Embed Size (px)
Citation preview
12/20/96 1
Investment Decisions and Capital Budgeting
Fuqua School of Business
Duke University
12/20/96 2
OverviewCapital Budgeting Techniques
Net Present Value (NPV)» Criterion for capital budgeting
decisions Special cases:
» Repeated projects» Optimal replacement rules
Alternative criteria» Internal Rates of Return (IRR)» Payback period» Profitability Index
12/20/96 3
Net Present Value
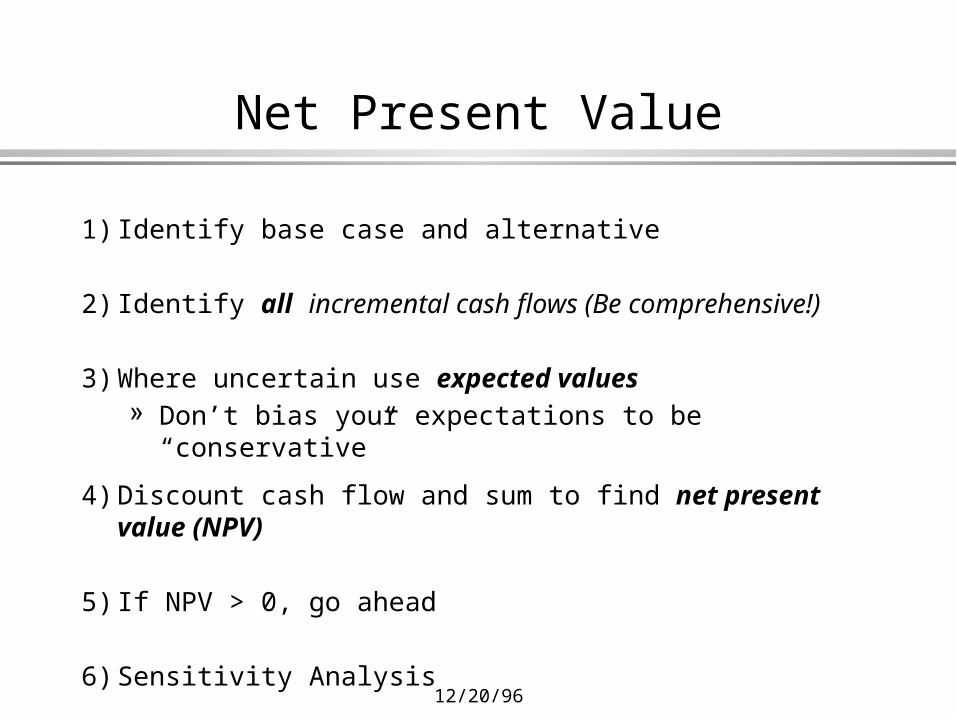
1) Identify base case and alternative
2) Identify all incremental cash flows (Be comprehensive!)
3) Where uncertain use expected values» Don’t bias your expectations to be “conservative”
4) Discount cash flow and sum to find net present value (NPV)
5) If NPV > 0, go ahead
6) Sensitivity Analysis
12/20/96 4
NPV - The Two-Period Case
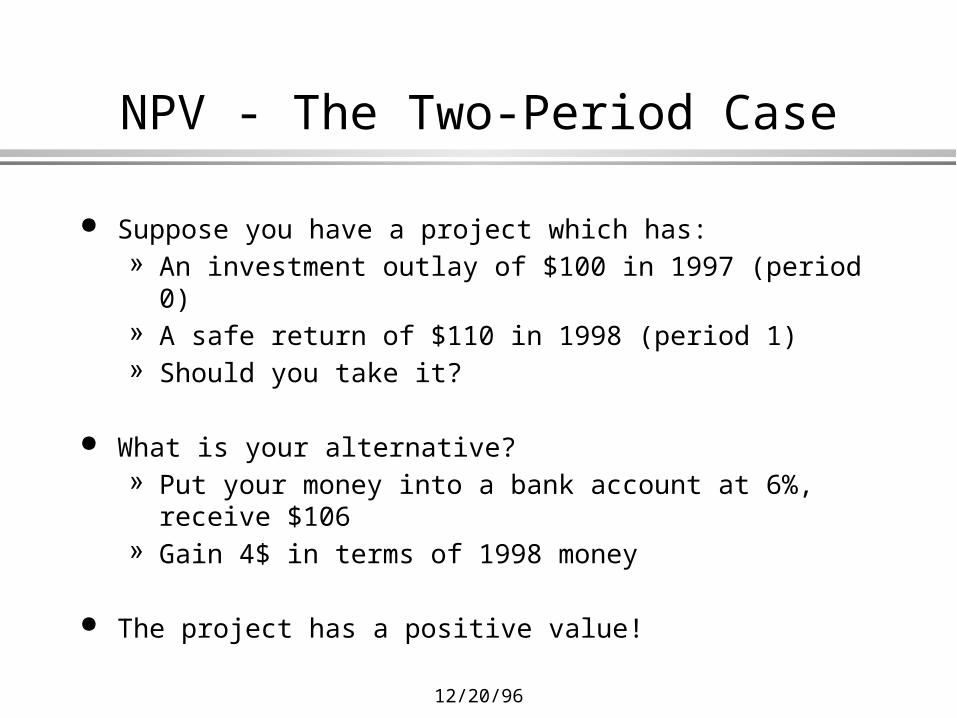
Suppose you have a project which has:» An investment outlay of $100 in 1997 (period 0)» A safe return of $110 in 1998 (period 1)» Should you take it?
What is your alternative?» Put your money into a bank account at 6%, receive $106» Gain 4$ in terms of 1998 money
The project has a positive value!
12/20/96 5
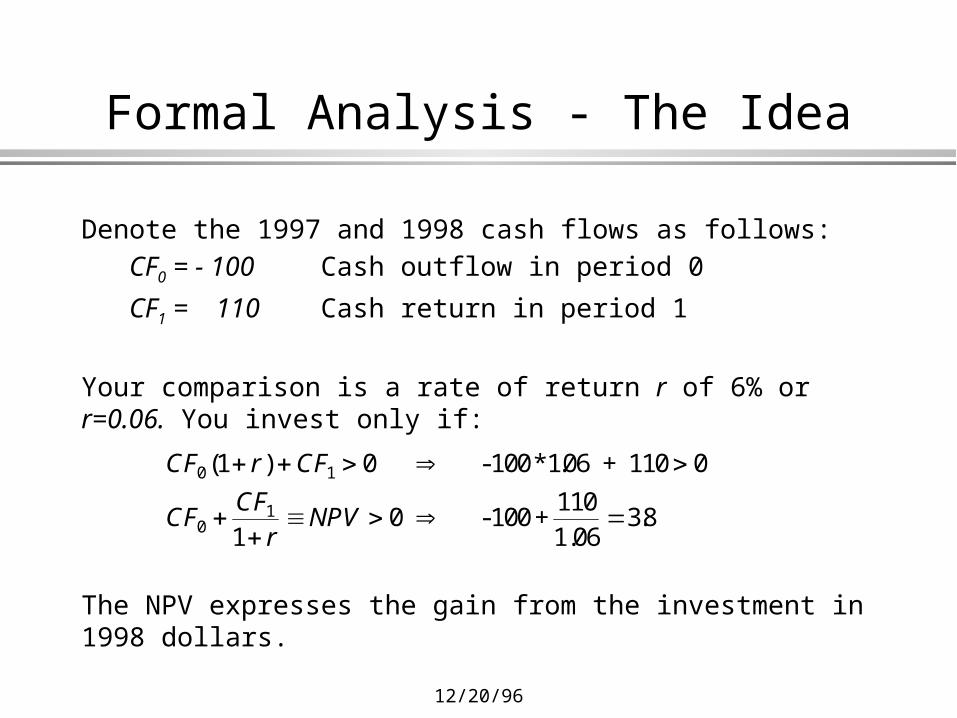
Denote the 1997 and 1998 cash flows as follows:
CF0 = - 100 Cash outflow in period 0
CF1 = 110 Cash return in period 1
Your comparison is a rate of return r of 6% or r=0.06. You invest only if:
The NPV expresses the gain from the investment in 1998 dollars.
Formal Analysis - The Idea
CF r CF
CFCF
rNPV
0 1
01
1 0 100 106 110 0
10 38
( )
.
- * . +
-100 +110
1.06
12/20/96 6
Calculating NPVs
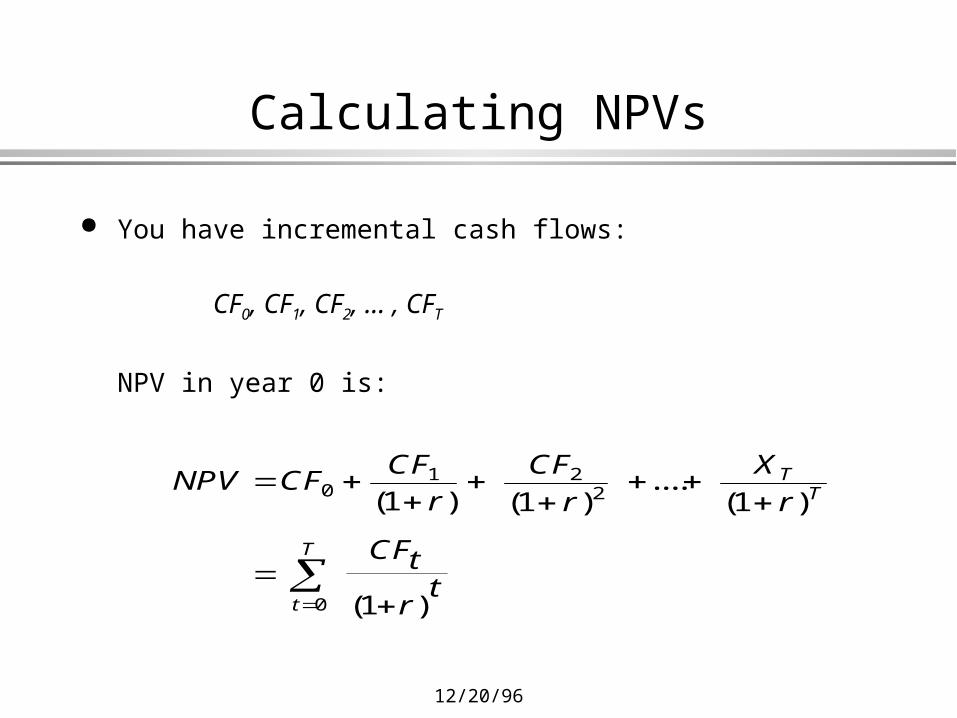
You have incremental cash flows:
CF0, CF1, CF2, ... , CFT
NPV in year 0 is:
NPV CFCF
r
CF
r
X
r
CFt
rt
TT
t
T
01 2
2
0
1 1 1
1
( ) ( ) ( )
( )
....
12/20/96 7
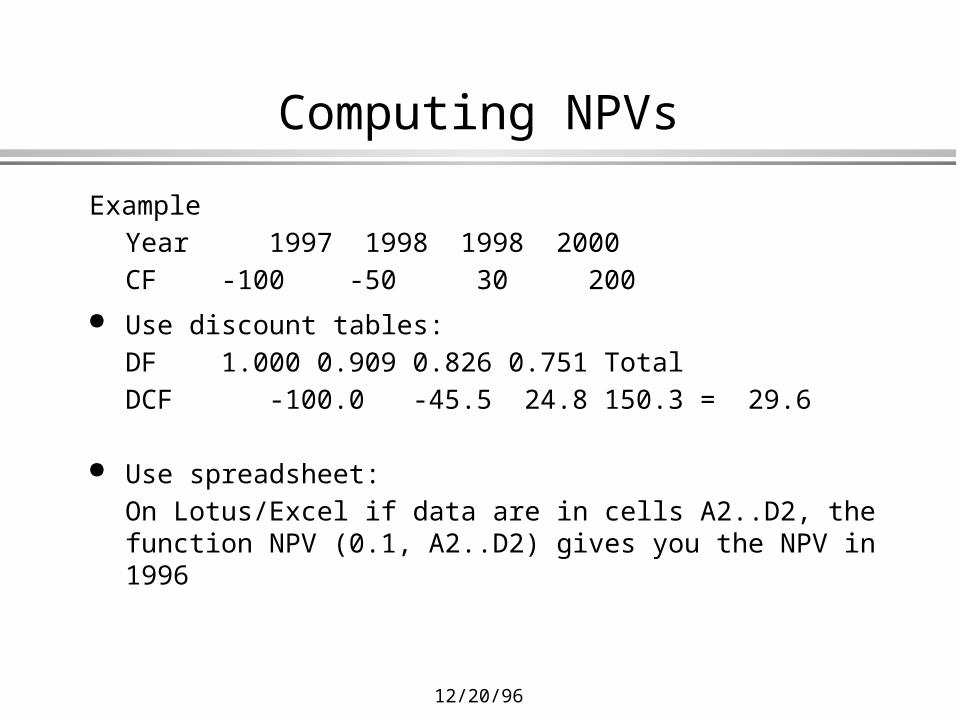
Computing NPVs
Example
Year 1997 1998 1998 2000
CF -100 -50 30 200
Use discount tables:
DF 1.000 0.909 0.826 0.751 Total
DCF -100.0 -45.5 24.8 150.3 = 29.6
Use spreadsheet:
On Lotus/Excel if data are in cells A2..D2, the function NPV (0.1, A2..D2) gives you the NPV in 1996
12/20/96 8
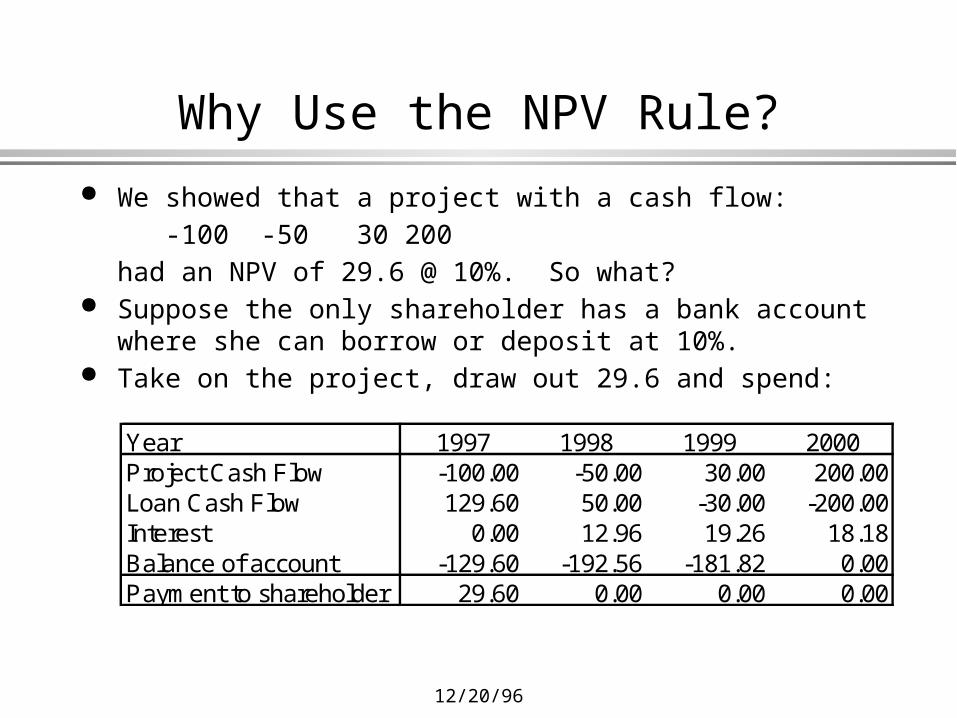
We showed that a project with a cash flow:
-100 -50 30 200
had an NPV of 29.6 @ 10%. So what? Suppose the only shareholder has a bank account where she
can borrow or deposit at 10%. Take on the project, draw out 29.6 and spend:
Why Use the NPV Rule?
Year 1997 1998 1999 2000Project Cash Flow -100.00 -50.00 30.00 200.00Loan Cash Flow 129.60 50.00 -30.00 -200.00Interest 0.00 12.96 19.26 18.18Balance of account -129.60 -192.56 -181.82 0.00Payment to shareholder 29.60 0.00 0.00 0.00
12/20/96 9
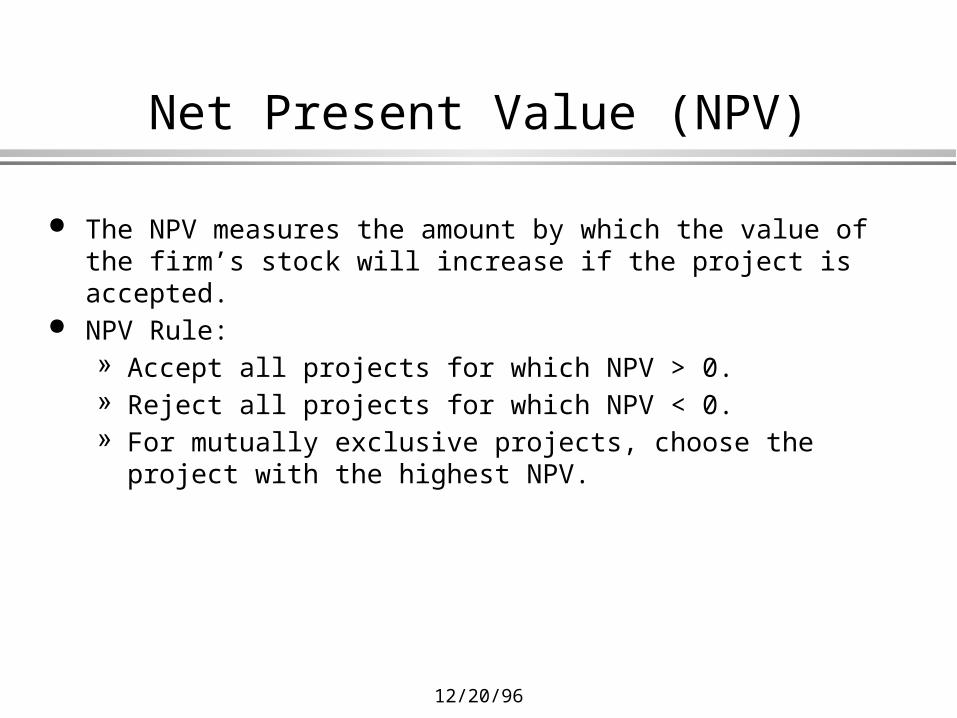
Net Present Value (NPV)
The NPV measures the amount by which the value of the firm’s stock will increase if the project is accepted.
NPV Rule:» Accept all projects for which NPV > 0.» Reject all projects for which NPV < 0.» For mutually exclusive projects, choose the project with the highest
NPV.
12/20/96 10
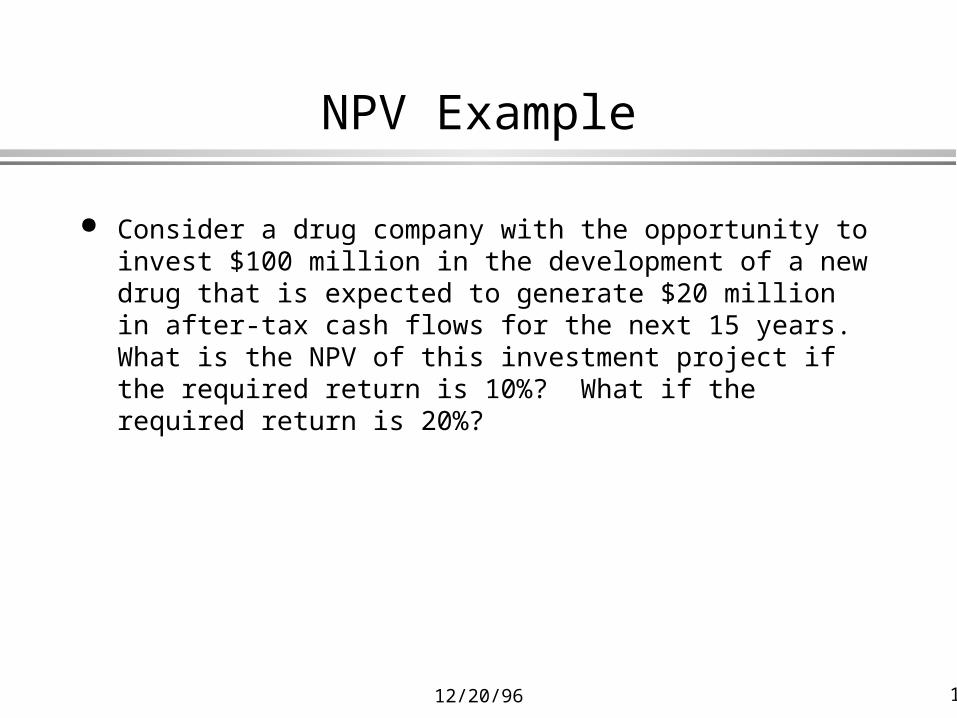
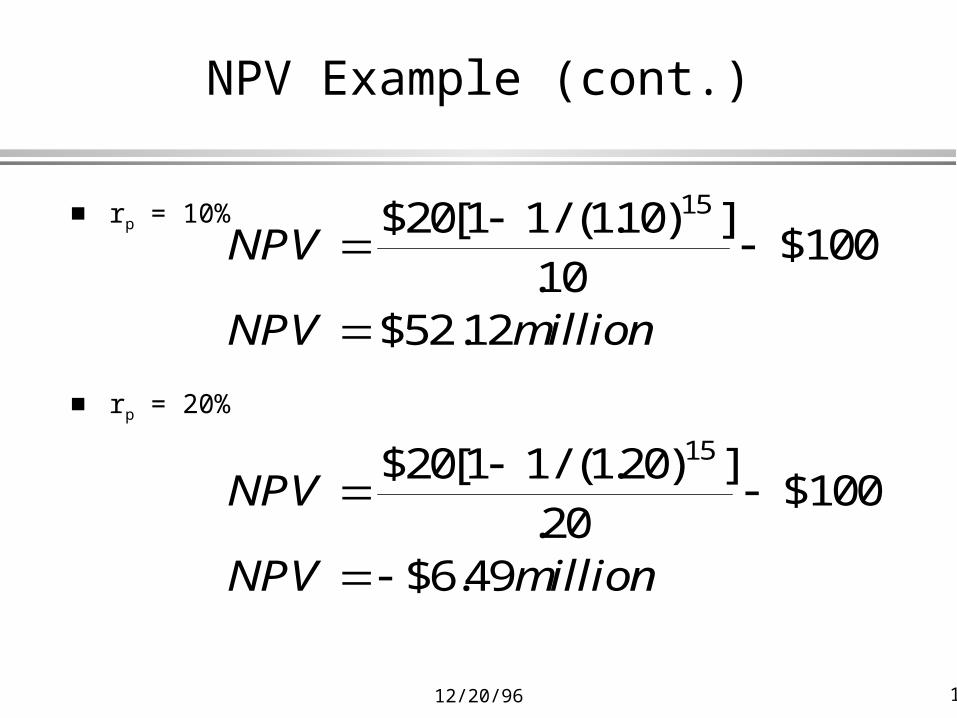
NPV Example
Consider a drug company with the opportunity to invest $100 million in the development of a new drug that is expected to generate $20 million in after-tax cash flows for the next 15 years. What is the NPV of this investment project if the required return is 10%? What if the required return is 20%?
12/20/96 11
NPV Example (cont.)
rp = 10%
rp = 20%
NPV
NPV million
NPV
NPV million
$20[ / ( . ) ]
.$100
$52.
$20[ / ( . ) ]
.$100
$6.
1 1 110
1012
1 1 120
2049
15
15
12/20/96 12
Eurotunnel NPV
One of the largest commercial investment project’s in recent years is Eurotunnel’s construction of the Channel Tunnel linking France with the U.K.
The cash flows on the following page are based on the forecasts of construction costs and revenues that the company provided to investors in 1986.
Given the risk of the project, we assume a 13% discount rate.
12/20/96 13
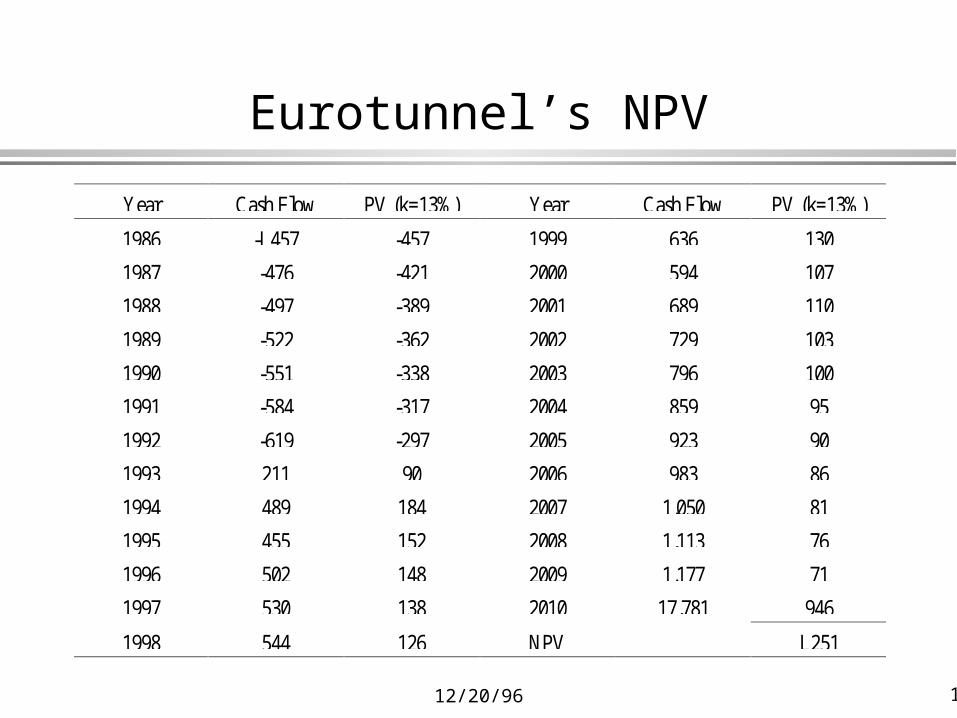
Eurotunnel’s NPV
Year Cash Flow PV (k=13%) Year Cash Flow PV (k=13%)
1986 -L457 -457 1999 636 130
1987 -476 -421 2000 594 107
1988 -497 -389 2001 689 110
1989 -522 -362 2002 729 103
1990 -551 -338 2003 796 100
1991 -584 -317 2004 859 95
1992 -619 -297 2005 923 90
1993 211 90 2006 983 86
1994 489 184 2007 1,050 81
1995 455 152 2008 1,113 76
1996 502 148 2009 1,177 71
1997 530 138 2010 17,781 946
1998 544 126 NPV L251
12/20/96 14
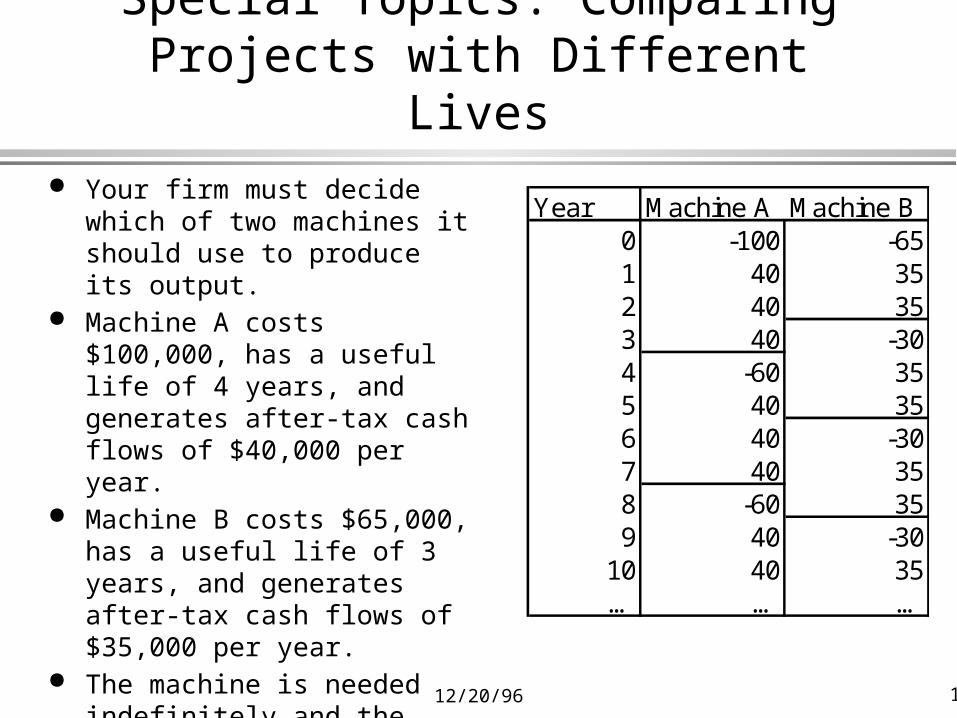
Special Topics: ComparingProjects with Different Lives
Your firm must decide which of two machines it should use to produce its output.
Machine A costs $100,000, has a useful life of 4 years, and generates after-tax cash flows of $40,000 per year.
Machine B costs $65,000, has a useful life of 3 years, and generates after-tax cash flows of $35,000 per year.
The machine is needed indefinitely and the discount rate is rp = 10%.
Year Machine A Machine B0 -100 -651 40 352 40 353 40 -304 -60 355 40 356 40 -307 40 358 -60 359 40 -30
10 40 35… … …
12/20/96 15
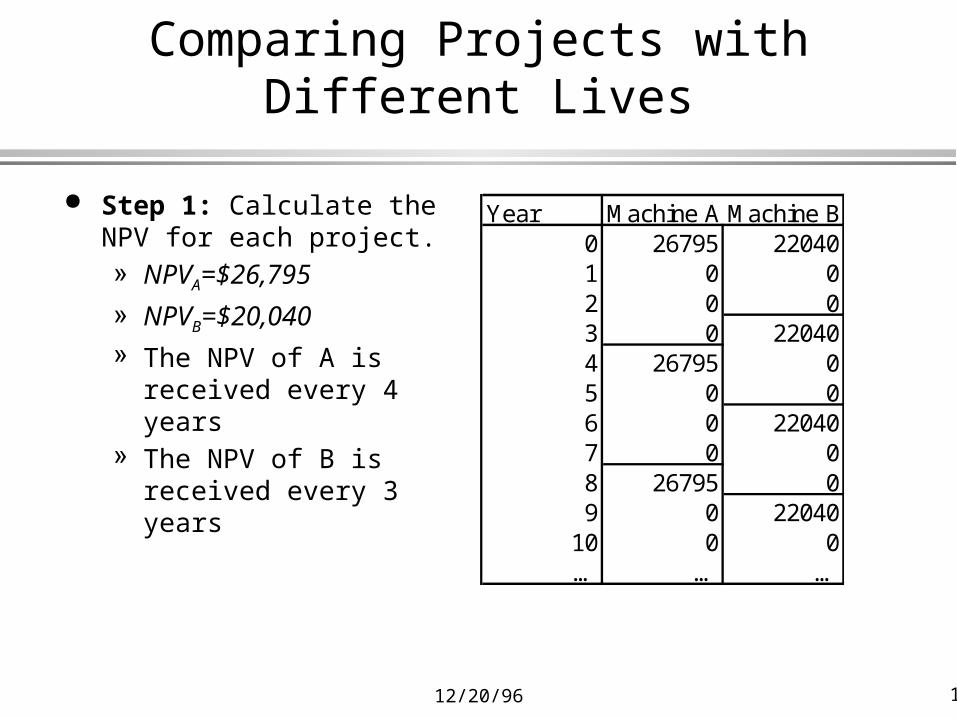
Comparing Projects with Different Lives
Step 1: Calculate the NPV for each project.» NPVA=$26,795
» NPVB=$20,040
» The NPV of A is received every 4 years
» The NPV of B is received every 3 years
Year Machine A Machine B0 26795 220401 0 02 0 03 0 220404 26795 05 0 06 0 220407 0 08 26795 09 0 22040
10 0 0… … …
12/20/96 16
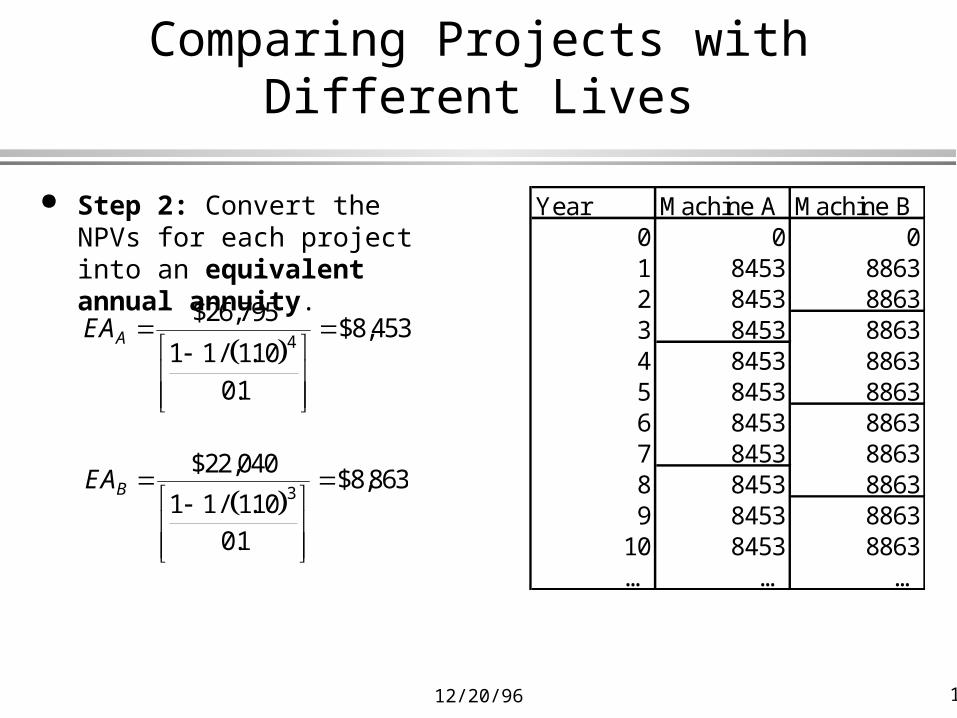
Comparing Projects with Different Lives
Step 2: Convert the NPVs for each project into an equivalent annual annuity.
EAA
$26,
/ .
.
$8,795
1 1 110
01
4534
EAB
$22,
/ .
.
$8,040
1 1 110
01
8633
Year Machine A Machine B0 0 01 8453 88632 8453 88633 8453 88634 8453 88635 8453 88636 8453 88637 8453 88638 8453 88639 8453 8863
10 8453 8863… … …
12/20/96 17
Comparing Projects with Different Lives
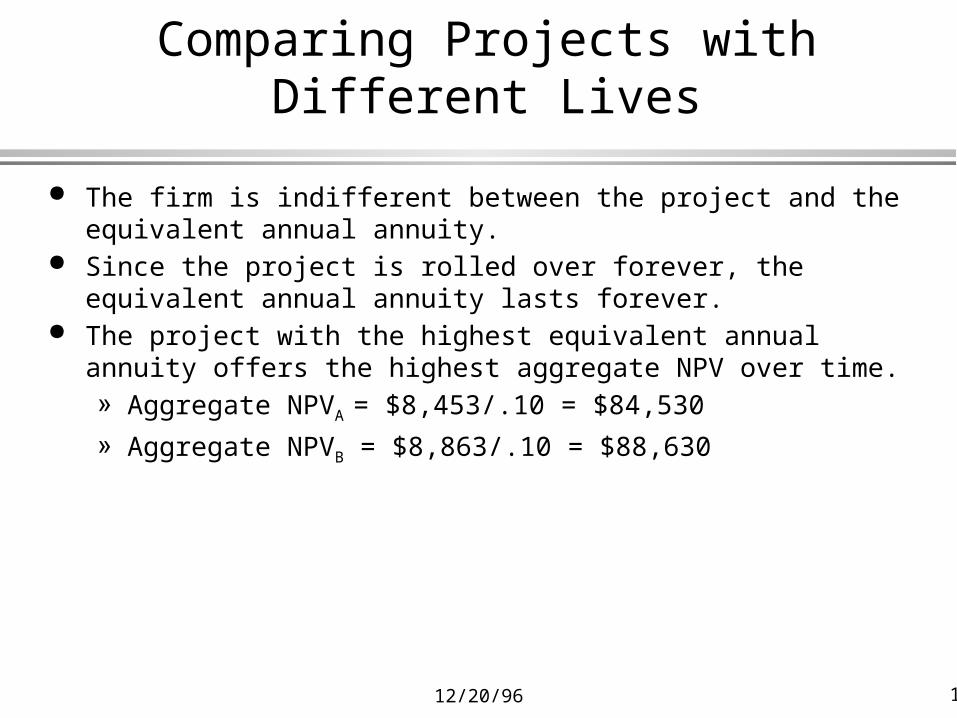
The firm is indifferent between the project and the equivalent annual annuity.
Since the project is rolled over forever, the equivalent annual annuity lasts forever.
The project with the highest equivalent annual annuity offers the highest aggregate NPV over time.» Aggregate NPVA = $8,453/.10 = $84,530
» Aggregate NPVB = $8,863/.10 = $88,630
12/20/96 18
Special Topics: Replacing anOld Machine
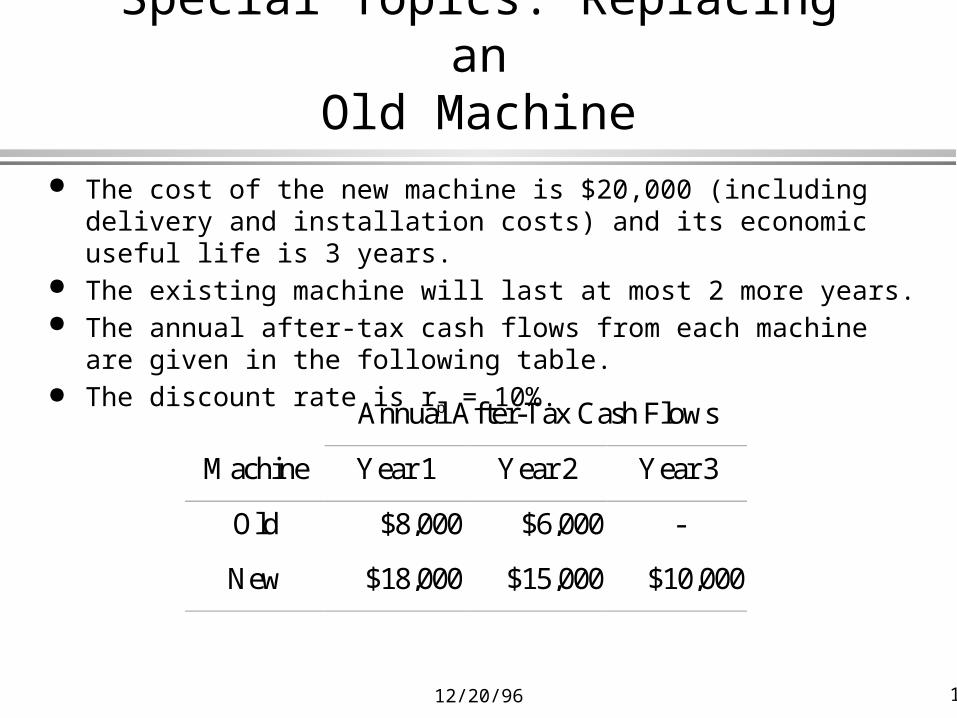
The cost of the new machine is $20,000 (including delivery and installation costs) and its economic useful life is 3 years.
The existing machine will last at most 2 more years. The annual after-tax cash flows from each machine are given in the
following table. The discount rate is rp = 10%.
Annual After-Tax Cash Flows
Machine Year 1 Year 2 Year 3
Old $8,000 $6,000 -
New $18,000 $15,000 $10,000
12/20/96 19
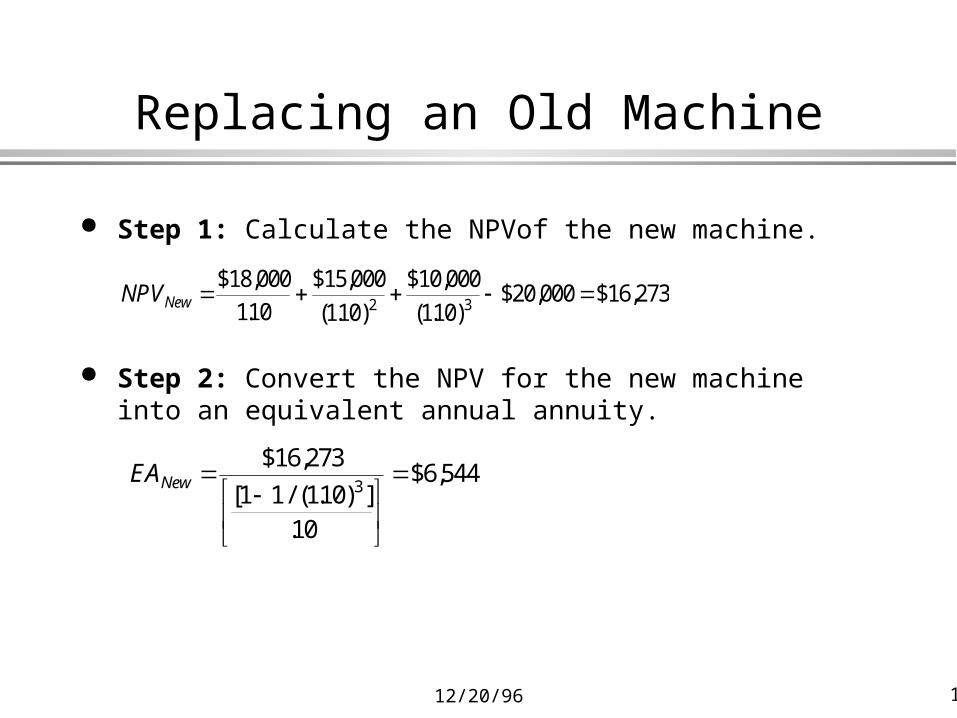
Replacing an Old Machine
Step 1: Calculate the NPVof the new machine.
Step 2: Convert the NPV for the new machine into an equivalent annual annuity.
NPVNew $18,
.
$15,
( . )
$10,
( . )$20, $16,
000
110
000
110
000
110000 2732 3
EANew
$16,
[ / ( . ) ].
$6,273
1 1 11010
5443
12/20/96 20
Replacing an Old Machine
The NPV of the new machine is equivalent to receiving $6,544 per year for 3 years.
Operate the old machine as long as its after-tax cash flows are greater than EANew = $6,544.
Old machine should be replaced after one more year of operation. How did we know that the new machine itself would not be replaced
early?
12/20/96 21
Alternatives to NPV
Internal Rate of Return (IRR) Payback Profitability Index
12/20/96 22
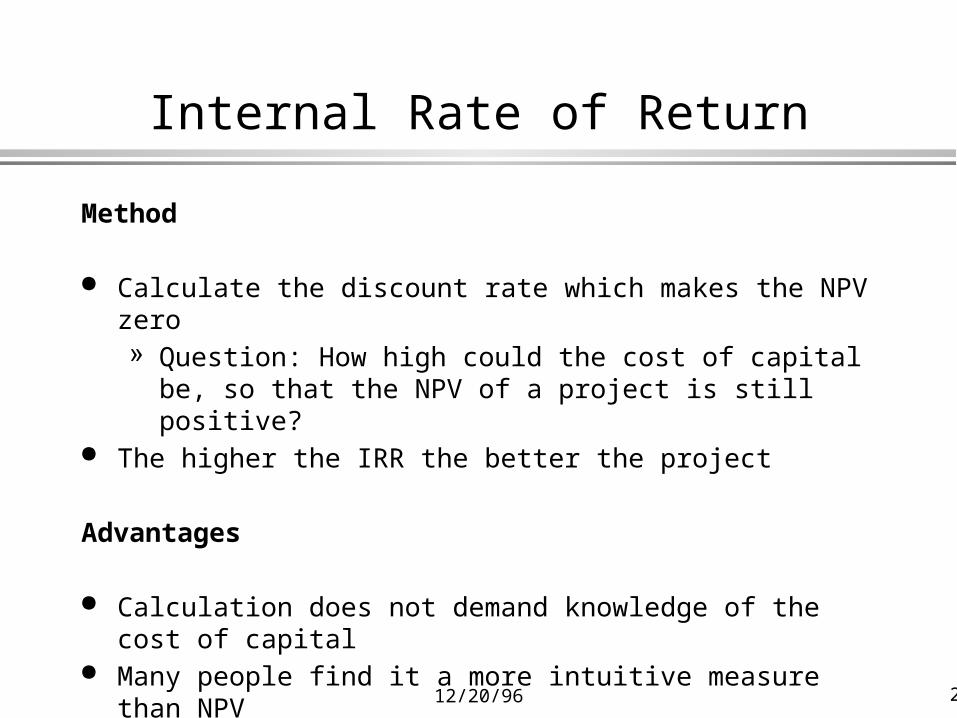
Internal Rate of Return
Method
Calculate the discount rate which makes the NPV zero» Question: How high could the cost of capital be, so that the
NPV of a project is still positive? The higher the IRR the better the project
Advantages
Calculation does not demand knowledge of the cost of capital Many people find it a more intuitive measure than NPV Usually gives the same signal as NPV
12/20/96 23
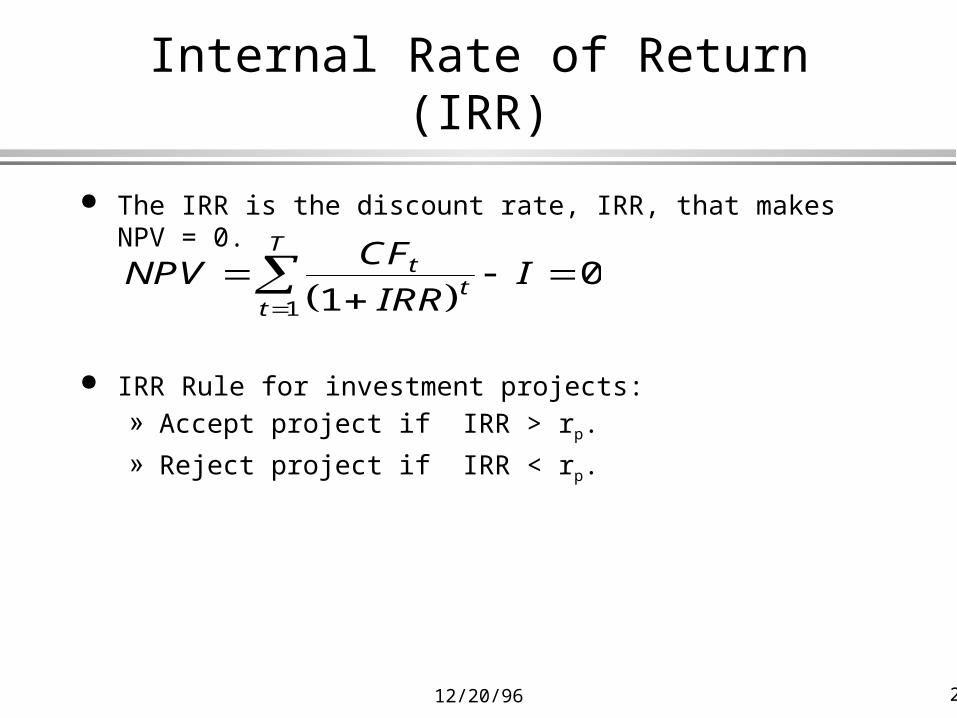
Internal Rate of Return (IRR)
The IRR is the discount rate, IRR, that makes NPV = 0.
IRR Rule for investment projects:» Accept project if IRR > rp.
» Reject project if IRR < rp.
NPV
CF
IRRIt
tt
T
10
1
12/20/96 24
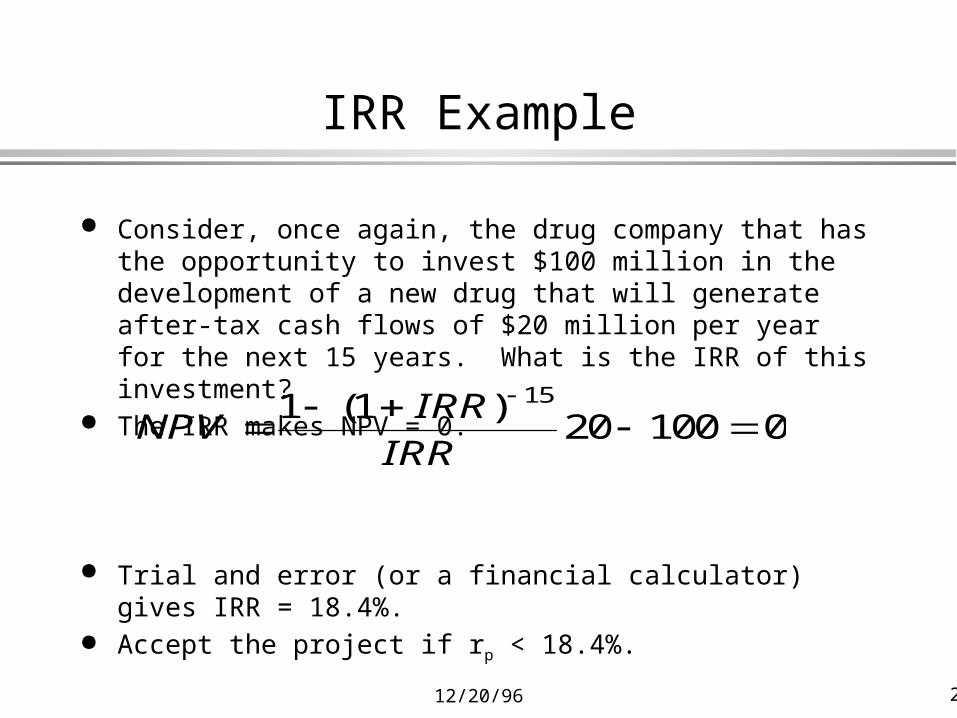
IRR Example
Consider, once again, the drug company that has the opportunity to invest $100 million in the development of a new drug that will generate after-tax cash flows of $20 million per year for the next 15 years. What is the IRR of this investment?
The IRR makes NPV = 0.
Trial and error (or a financial calculator) gives IRR = 18.4%. Accept the project if rp < 18.4%.
NPVIRR
IRR
1 120 100 0
15( )
12/20/96 25
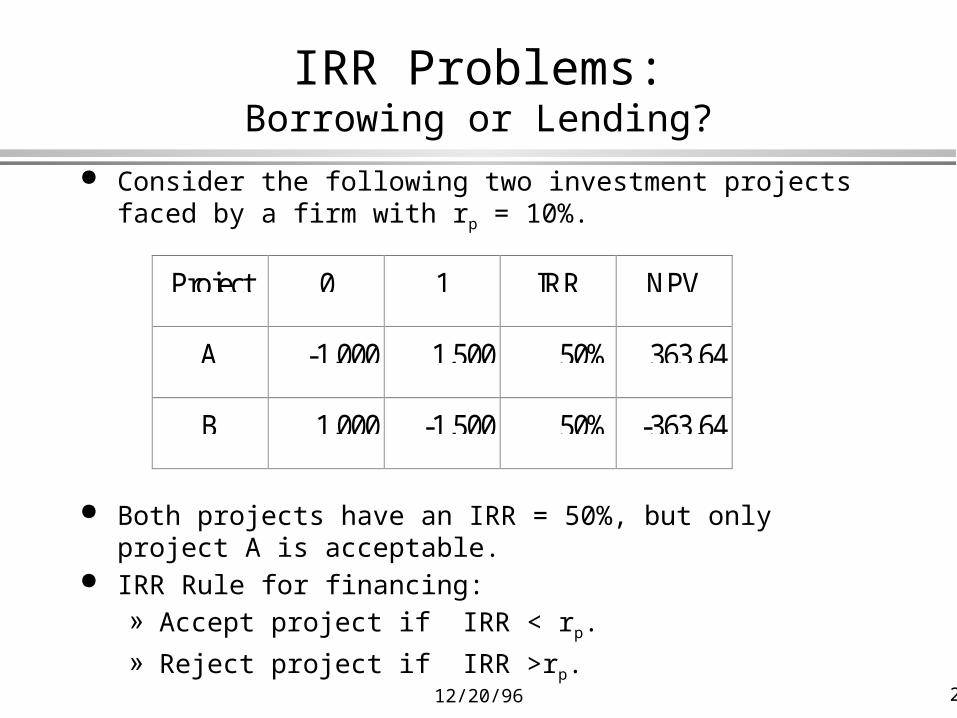
IRR Problems:Borrowing or Lending?
Consider the following two investment projects faced by a firm with rp = 10%.
Both projects have an IRR = 50%, but only project A is acceptable.
IRR Rule for financing:» Accept project if IRR < rp.
» Reject project if IRR >rp.
Project 0 1 IRR NPV
A -1,000 1,500 50% 363.64
B 1,000 -1,500 50% -363.64
12/20/96 26
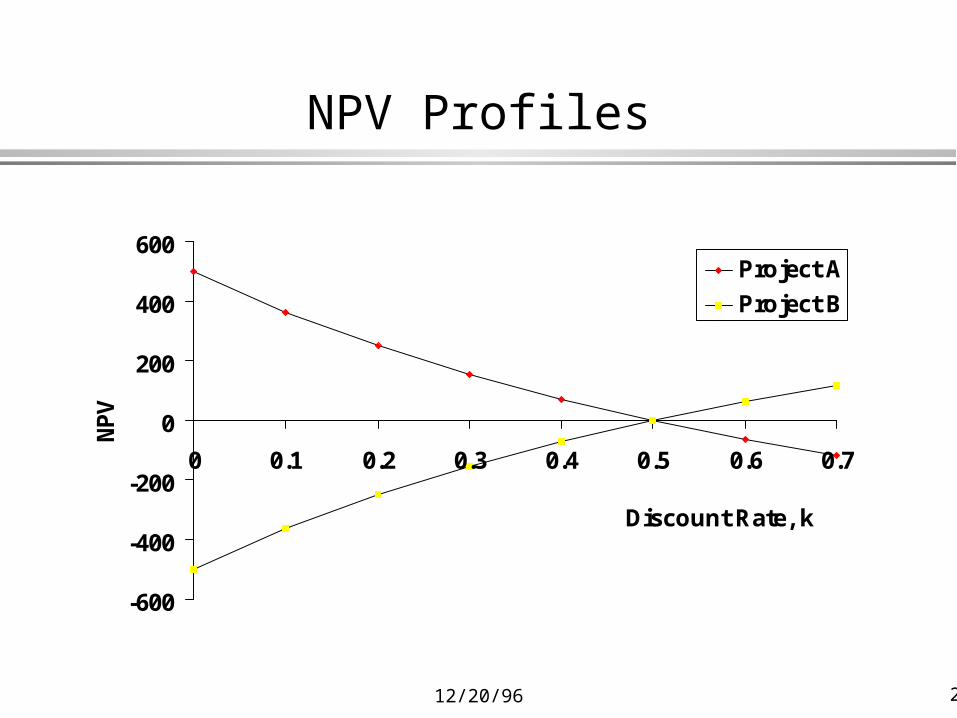
NPV Profiles
-600
-400
-200
0
200
400
600
0 0.1 0.2 0.3 0.4 0.5 0.6 0.7
Discount Rate, k
NP
V
Project A
Project B
12/20/96 27
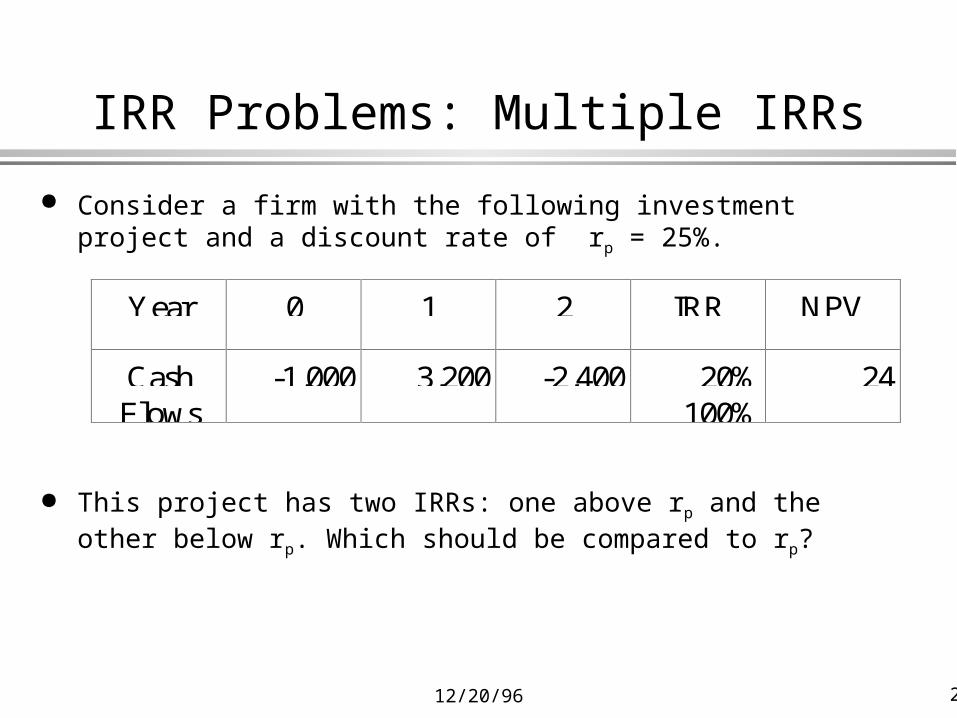
IRR Problems: Multiple IRRs
Consider a firm with the following investment project and a discount rate of rp = 25%.
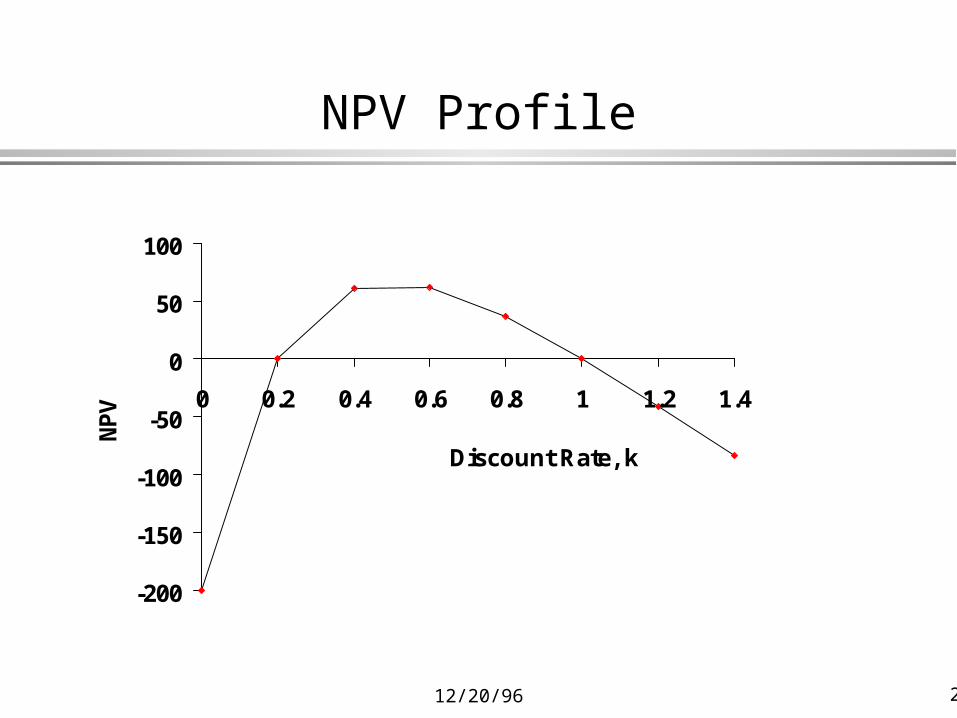
This project has two IRRs: one above rp and the other below rp. Which should be compared to rp?
Year 0 1 2 IRR NPV
CashFlows
-1,000 3,200 -2,400 20%100%
24
12/20/96 28
NPV Profile
-200
-150
-100
-50
0
50
100
0 0.2 0.4 0.6 0.8 1 1.2 1.4
Discount Rate, k
NP
V
12/20/96 29
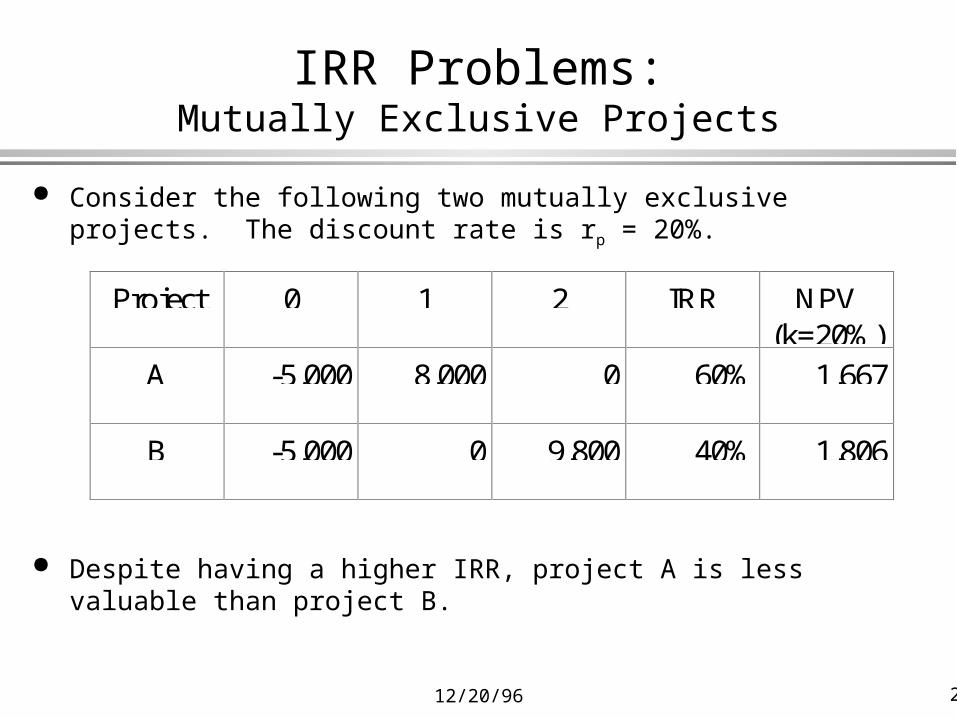
IRR Problems:Mutually Exclusive Projects
Consider the following two mutually exclusive projects. The discount rate is rp = 20%.
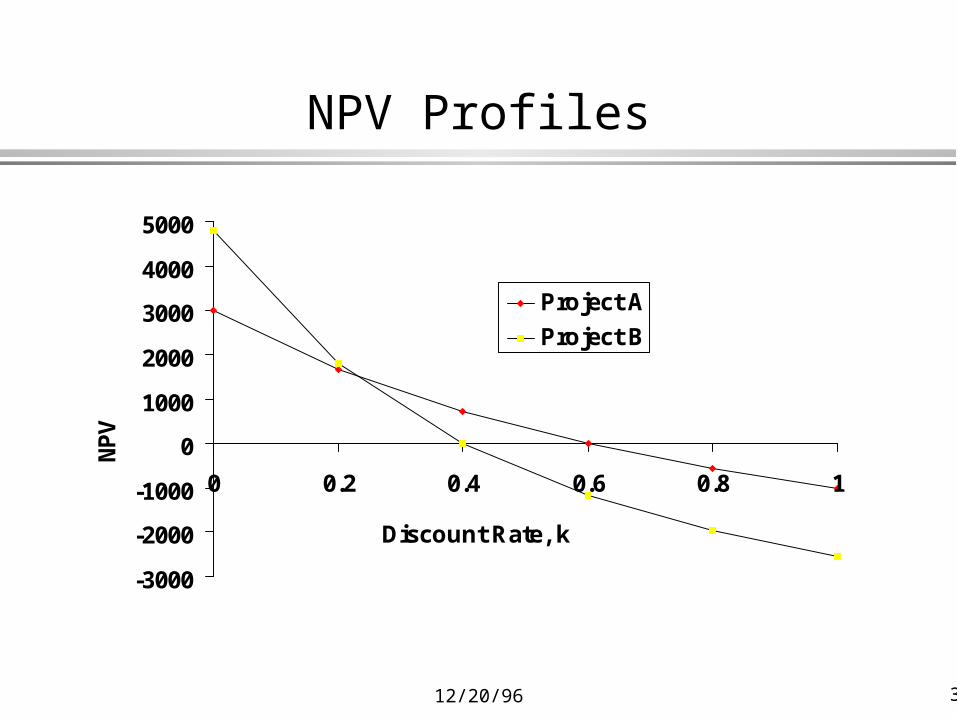
Despite having a higher IRR, project A is less valuable than project B.
Project 0 1 2 IRR NPV(k=20%)
A -5,000 8,000 0 60% 1,667
B -5,000 0 9,800 40% 1,806
12/20/96 30
NPV Profiles
-3000
-2000
-1000
0
1000
2000
3000
4000
5000
0 0.2 0.4 0.6 0.8 1
Discount Rate, k
NP
V
Project A
Project B
12/20/96 31
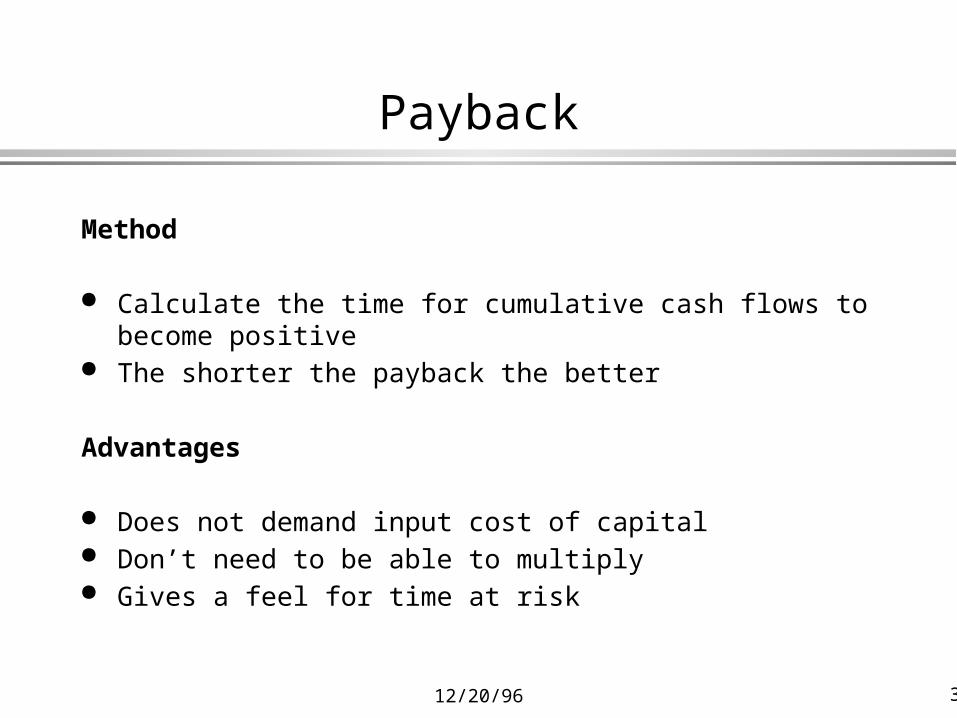
Payback
Method
Calculate the time for cumulative cash flows to become positive The shorter the payback the better
Advantages
Does not demand input cost of capital Don’t need to be able to multiply Gives a feel for time at risk
12/20/96 32
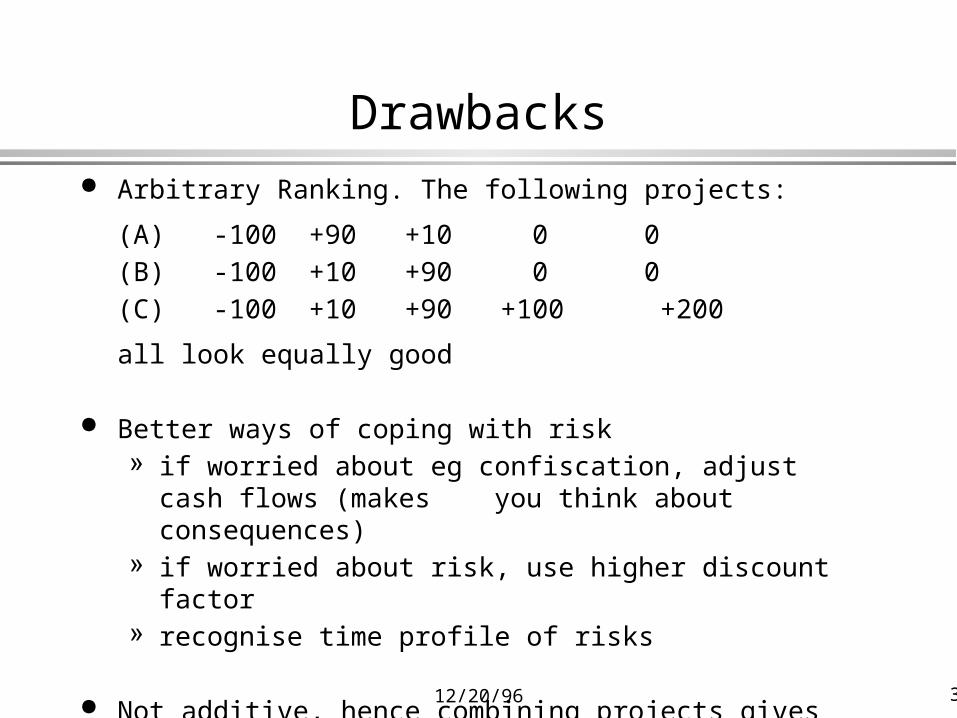
Drawbacks Arbitrary Ranking. The following projects:
(A) -100 +90 +10 0 0
(B) -100 +10 +90 0 0
(C) -100 +10 +90 +100 +200
all look equally good
Better ways of coping with risk» if worried about eg confiscation, adjust cash flows (makes
you think about consequences)» if worried about risk, use higher discount factor» recognise time profile of risks
Not additive, hence combining projects gives different results.
12/20/96 33
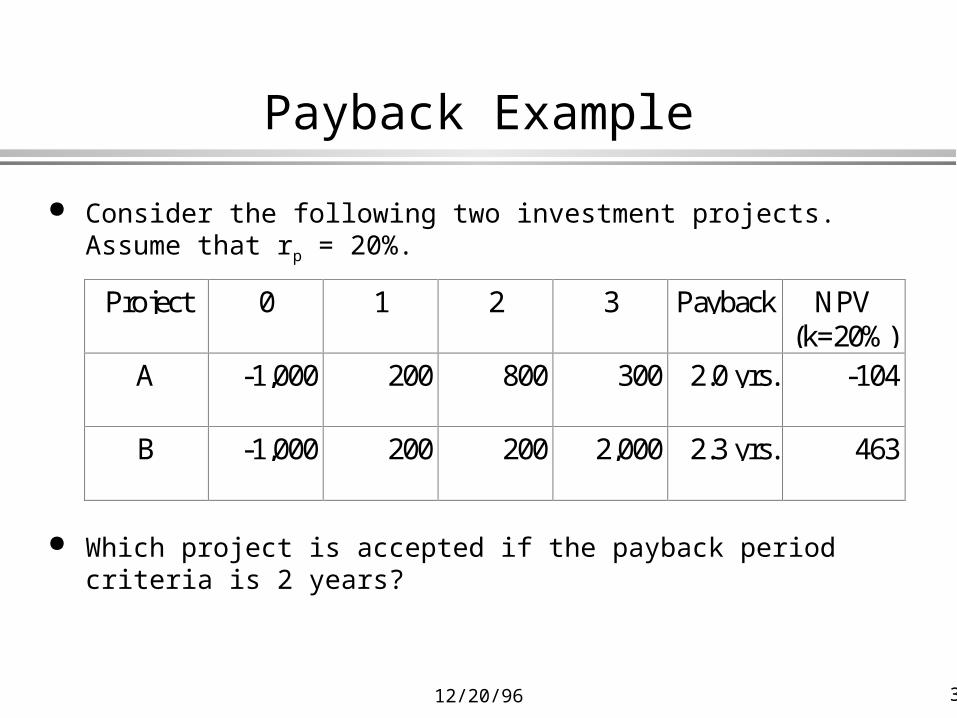
Payback Example
Consider the following two investment projects. Assume that rp = 20%.
Which project is accepted if the payback period criteria is 2 years?
Project 0 1 2 3 Payback NPV(k=20%)
A -1,000 200 800 300 2.0 yrs. -104
B -1,000 200 200 2,000 2.3 yrs. 463
12/20/96 34
Problems with Payback
Ignores the Time Value of Money Ignores Cash Flows Beyond the Payback Period Ignores the Scale of the Investment Decision Criteria is Arbitrary
12/20/96 35
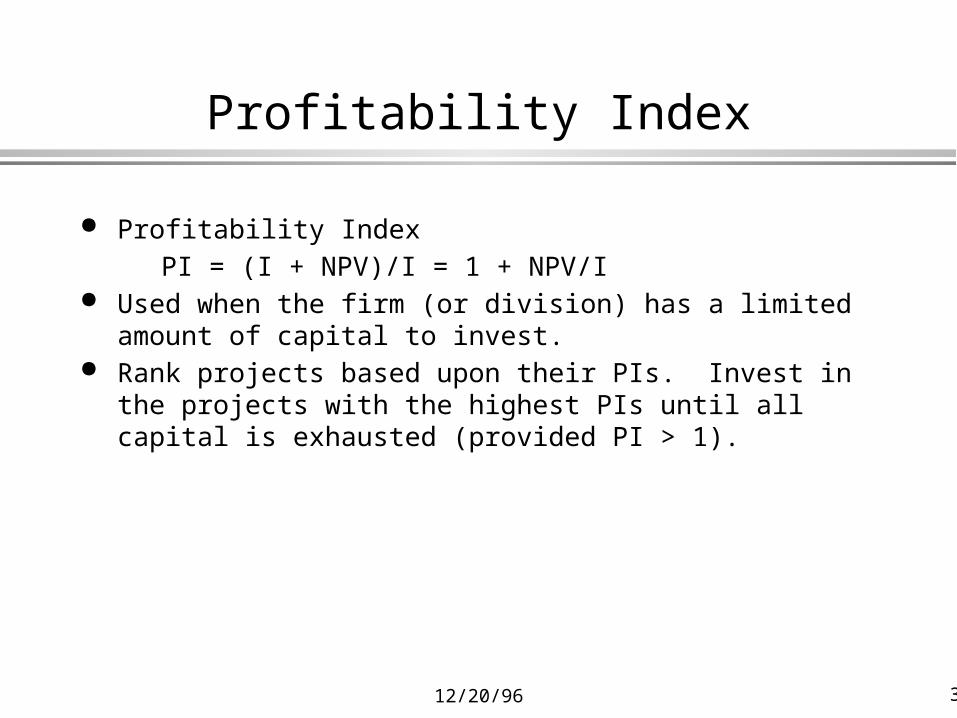
Profitability Index
Profitability Index
PI = (I + NPV)/I = 1 + NPV/I Used when the firm (or division) has a limited amount of capital
to invest. Rank projects based upon their PIs. Invest in the projects with
the highest PIs until all capital is exhausted (provided PI > 1).
12/20/96 36
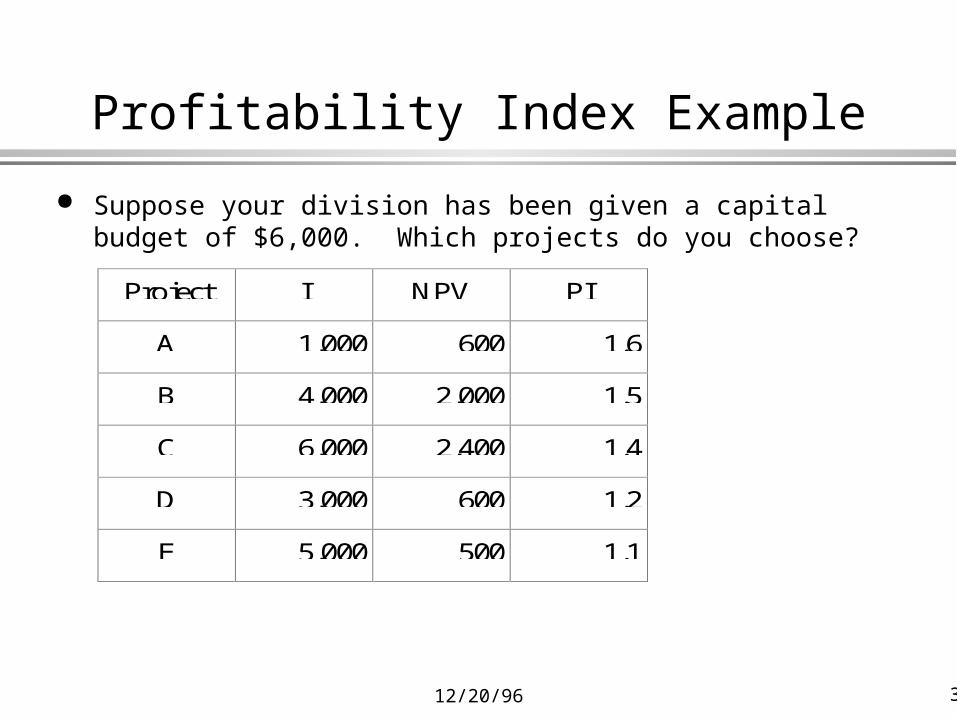
Profitability Index Example
Suppose your division has been given a capital budget of $6,000. Which projects do you choose?
Project I NPV PI
A 1,000 600 1.6
B 4,000 2,000 1.5
C 6,000 2,400 1.4
D 3,000 600 1.2
E 5,000 500 1.1
12/20/96 37
Profitability Index Example
Suppose your budget increases to $7,000. Choosing projects in decending order of PIs no longer
maximizes the aggreagate NPV. Projects A and C provide the highest aggregate NPV = $3,000
and stay within budget. Linear programming techniques can be used to solve large
capital allocation problems.
12/20/96 38
Conclusions
NPV has strong attractions:» based on cash flows - so does not depend on accounting
conventions» fully reflects time value of money» takes into account riskiness of project» gives clear go/no go answer