Embed Size (px)
Citation preview

12.3
PROBABILTY WITH
VENN DIAGRAMS
MDM
Objectives
Calculate probability involving “not”, “and”, “or”
Use tables and Venn diagrams to calculate probabilities
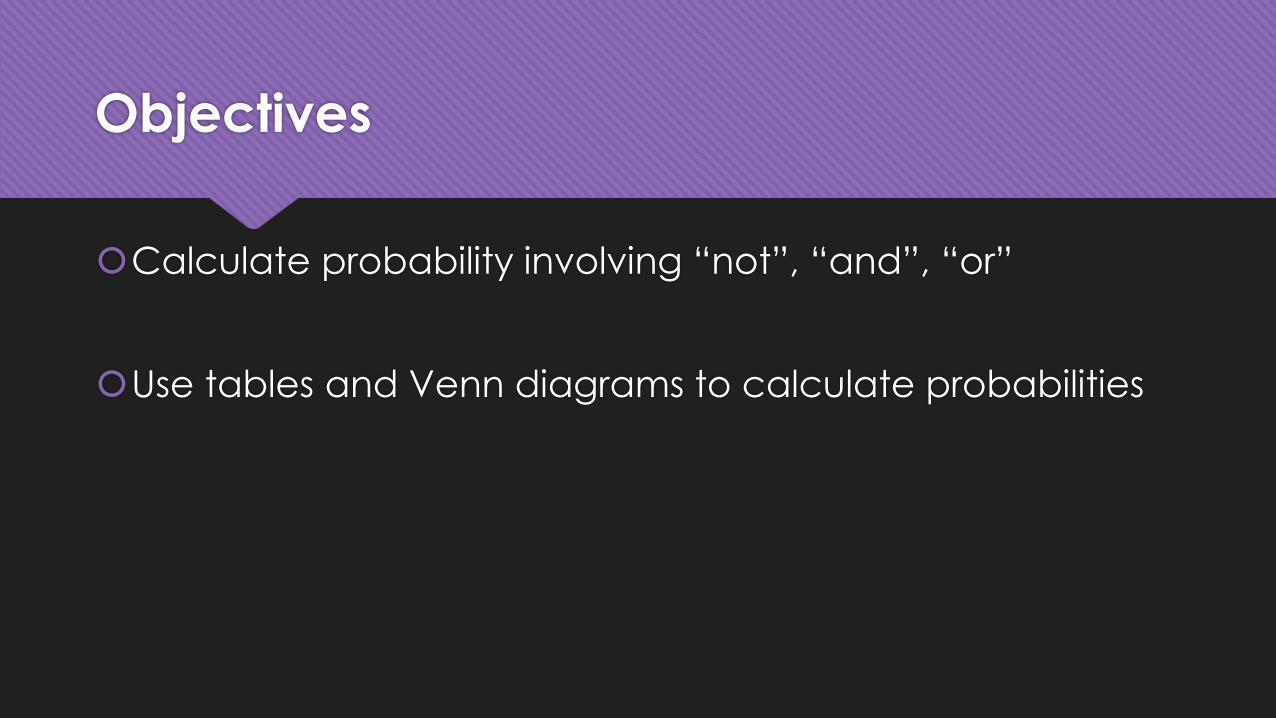
Probability Notation
𝑃 𝐴
𝑃(ഥ𝐴 )
𝑃 𝐴 ∩ 𝐵
𝑃(𝐴 ∪ 𝐵)
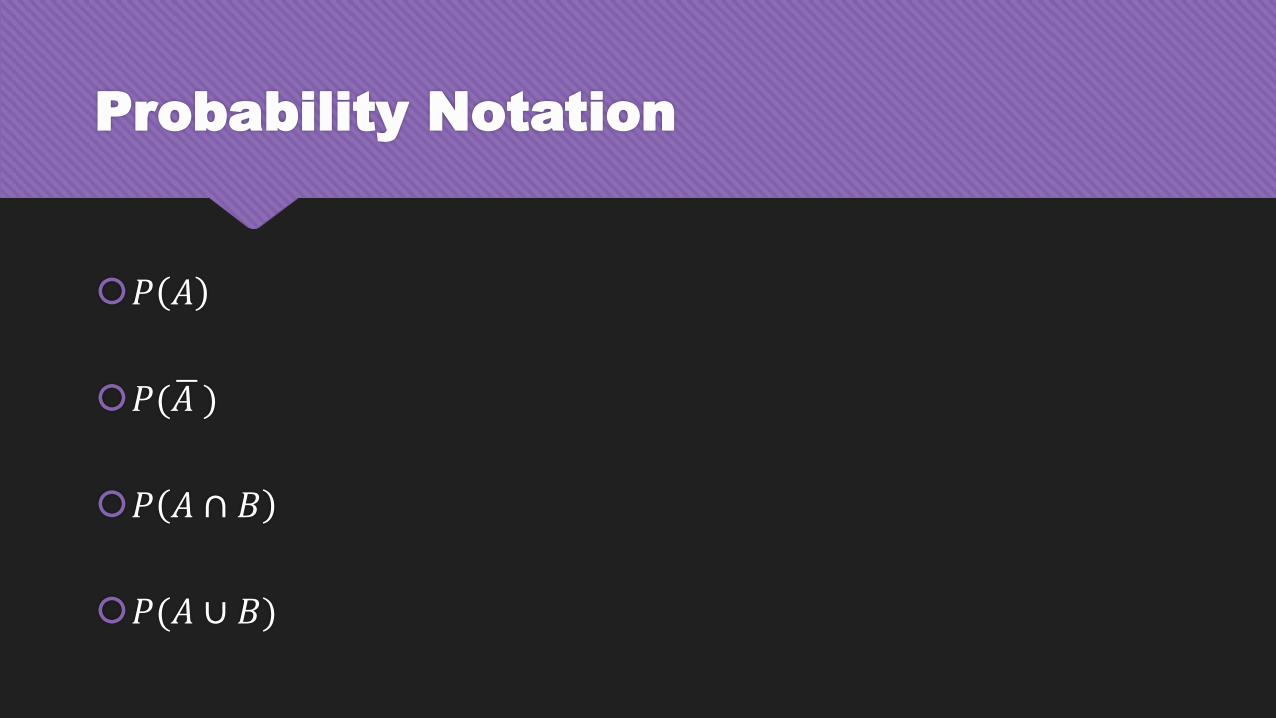
Probability Notation
𝑃 𝐴 Probability of A occurring
𝑃(ഥ𝐴 ) Probability of A NOT occurring
𝑃 𝐴 ∩ 𝐵 Probability of both A AND B occurring
𝑃(𝐴 ∪ 𝐵) Probability of either A OR B occurring
Probability Notation
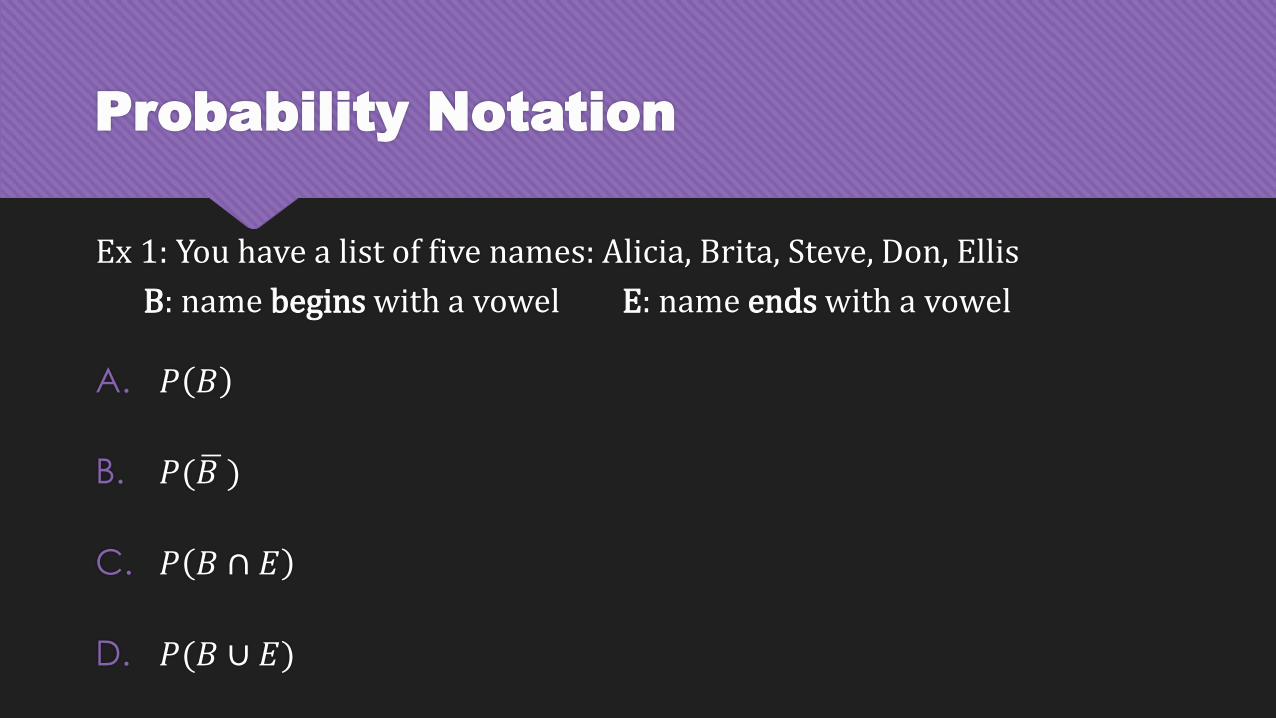
Ex 1: You have a list of five names: Alicia, Brita, Steve, Don, Ellis
B: name begins with a vowel E: name ends with a vowel
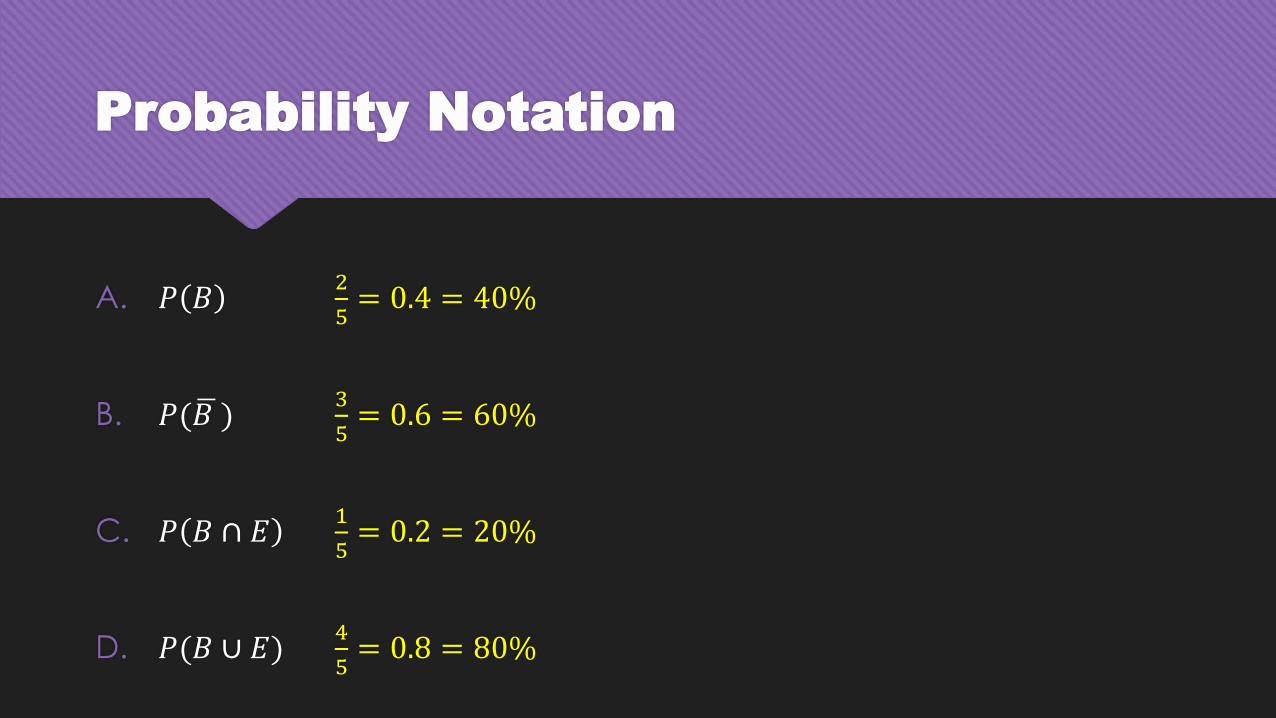
A. 𝑃 𝐵
B. 𝑃( ഥ𝐵 )
C. 𝑃 𝐵 ∩ 𝐸
D. 𝑃(𝐵 ∪ 𝐸)
Probability Notation
A. 𝑃 𝐵2
5= 0.4 = 40%
B. 𝑃( ഥ𝐵 )3
5= 0.6 = 60%
C. 𝑃 𝐵 ∩ 𝐸1
5= 0.2 = 20%
D. 𝑃(𝐵 ∪ 𝐸)4
5= 0.8 = 80%
Venn Diagram
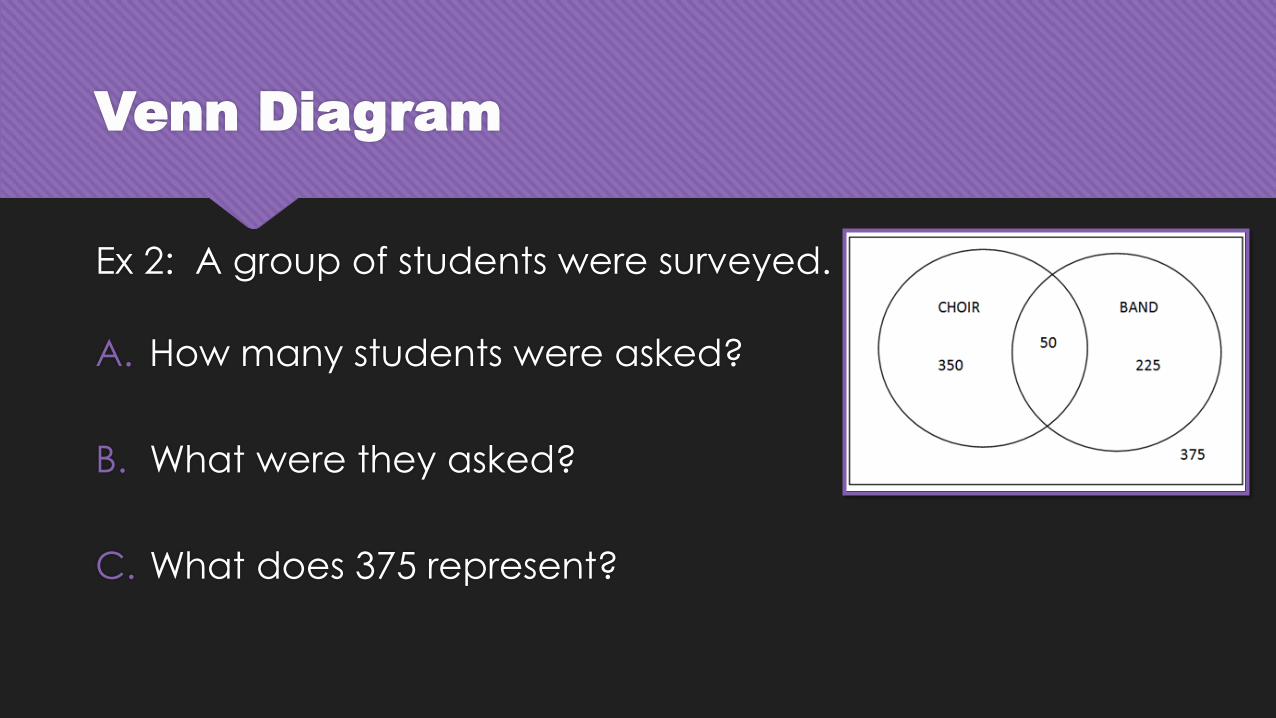
Ex 2: A group of students were surveyed.
A. How many students were asked?
B. What were they asked?
C. What does 375 represent?
Venn Diagram
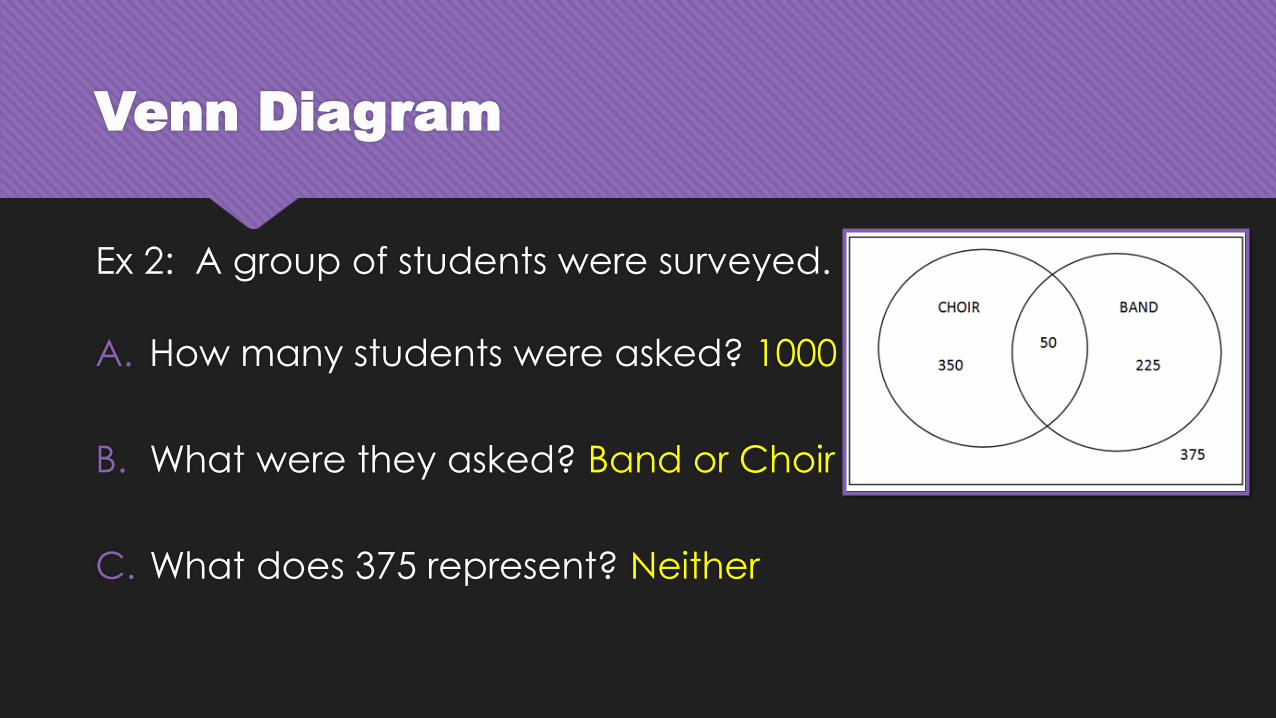
Ex 2: A group of students were surveyed.
A. How many students were asked? 1000
B. What were they asked? Band or Choir
C. What does 375 represent? Neither
Venn Diagram
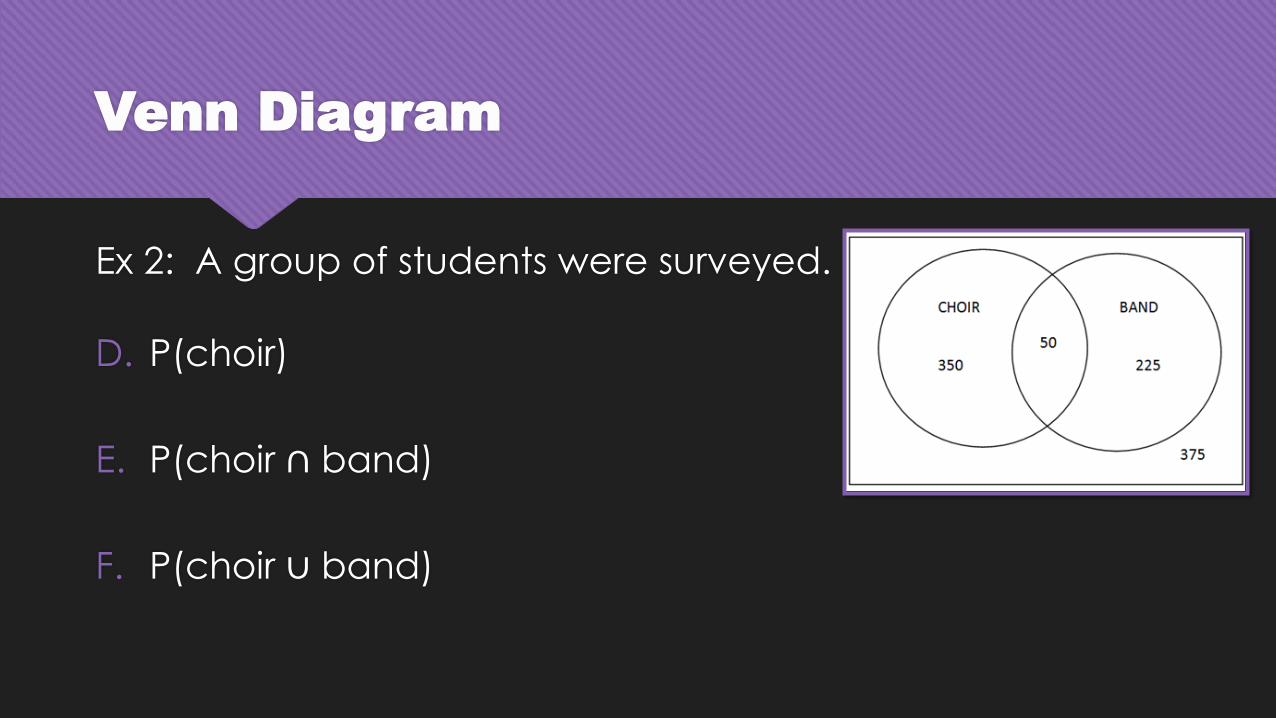
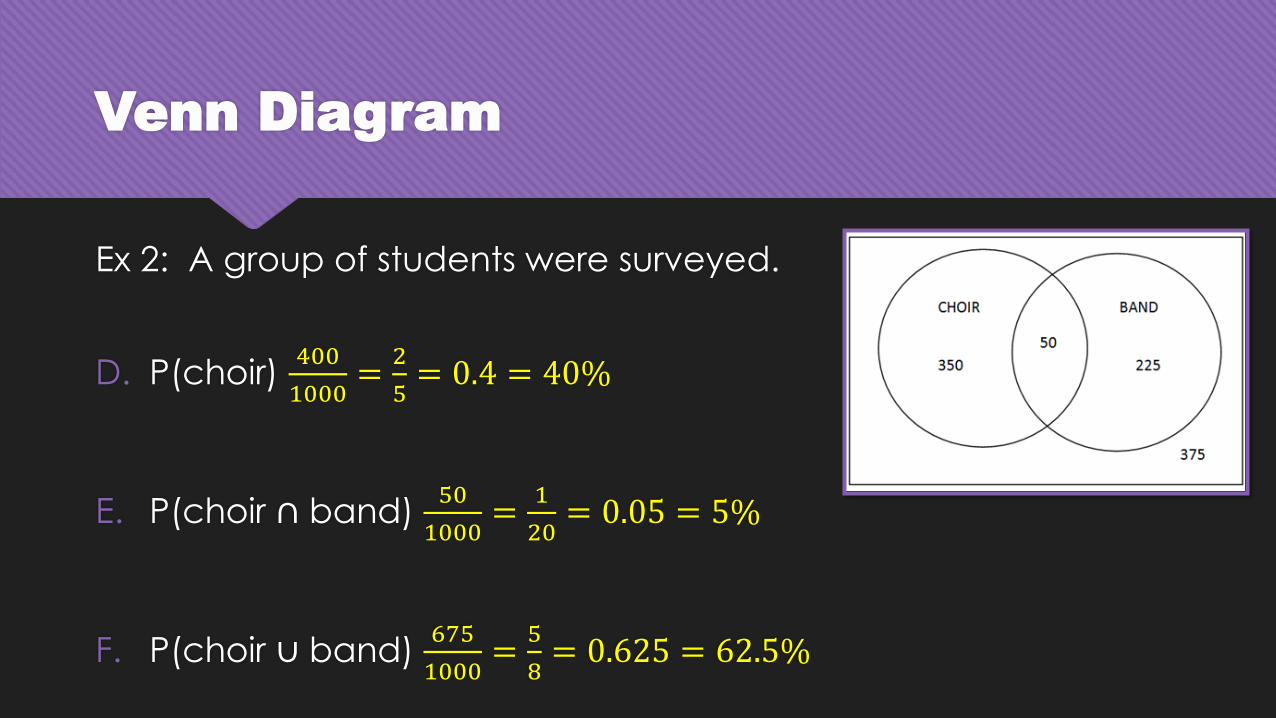
Ex 2: A group of students were surveyed.
D. P(choir)
E. P(choir ∩ band)
F. P(choir ∪ band)
Venn Diagram
Ex 2: A group of students were surveyed.
D. P(choir) 400
1000=
2
5= 0.4 = 40%
E. P(choir ∩ band) 50
1000=
1
20= 0.05 = 5%
F. P(choir ∪ band) 675
1000=
5
8= 0.625 = 62.5%
Venn Diagram
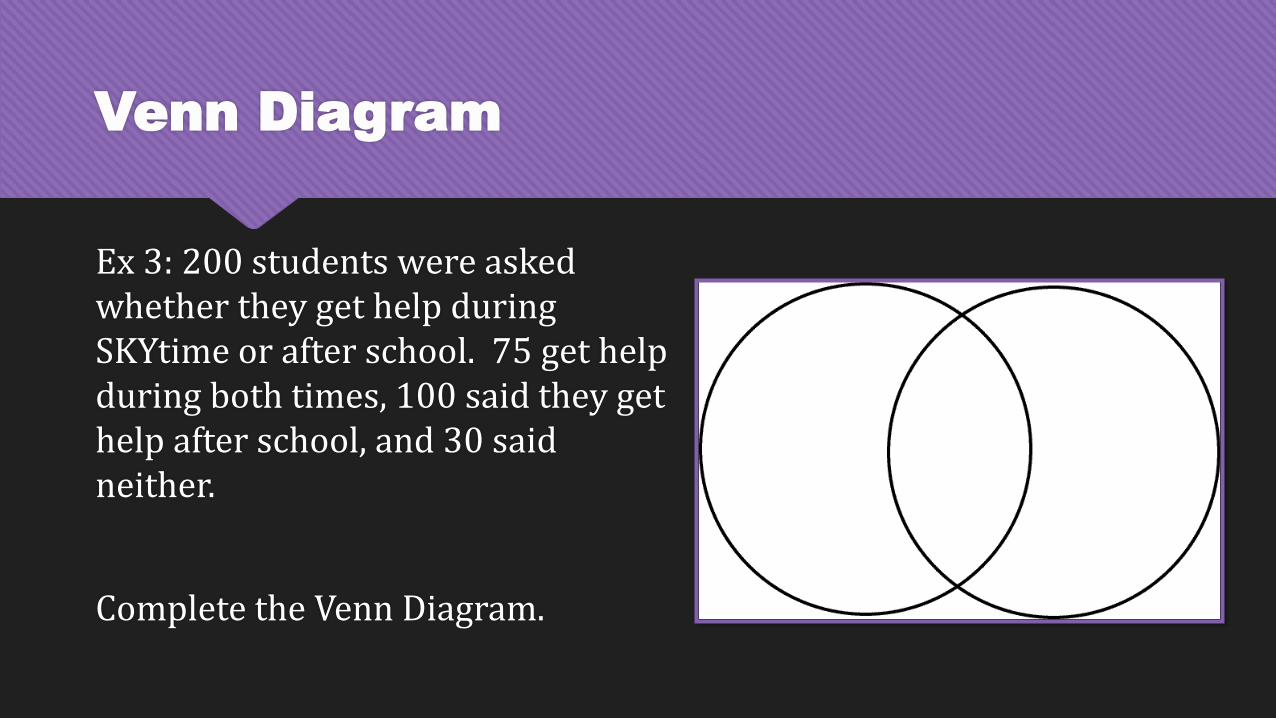
Ex 3: 200 students were asked whether they get help during SKYtime or after school. 75 get help during both times, 100 said they get help after school, and 30 said neither.
Complete the Venn Diagram.
Venn Diagram
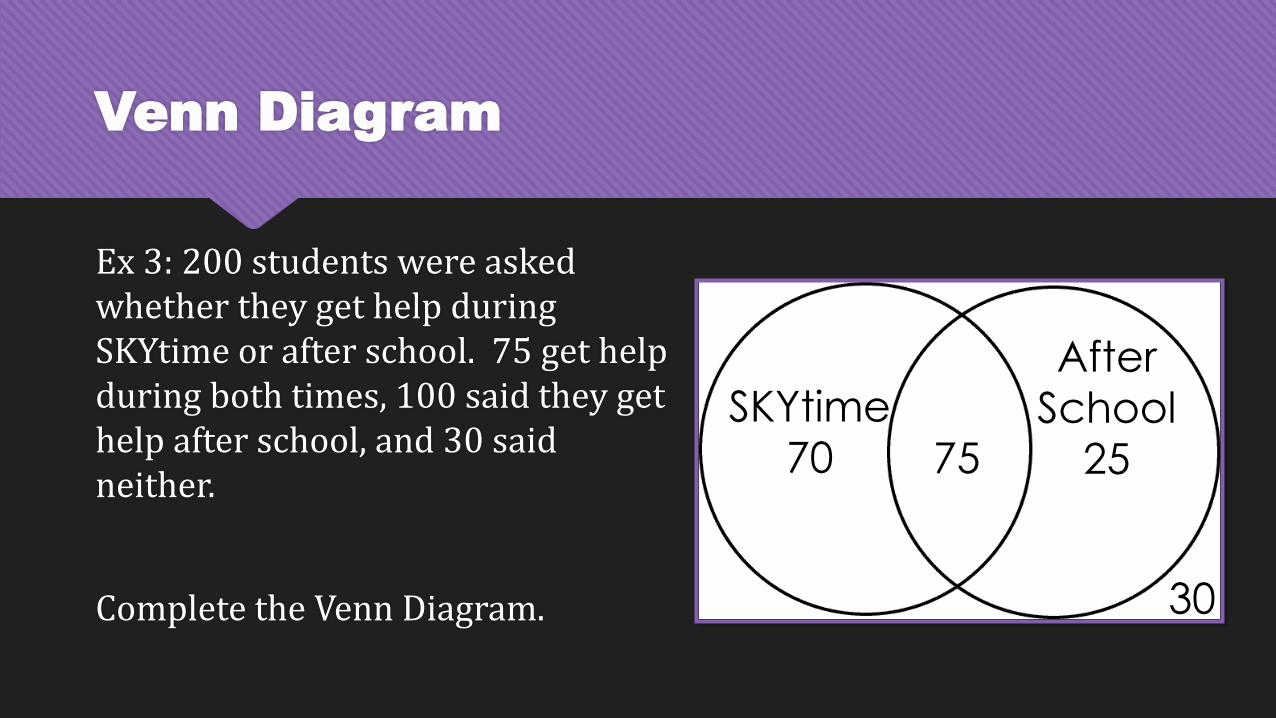
Ex 3: 200 students were asked whether they get help during SKYtime or after school. 75 get help during both times, 100 said they get help after school, and 30 said neither.
Complete the Venn Diagram.
SKYtime
70
After
School
2575
30
Venn Diagram
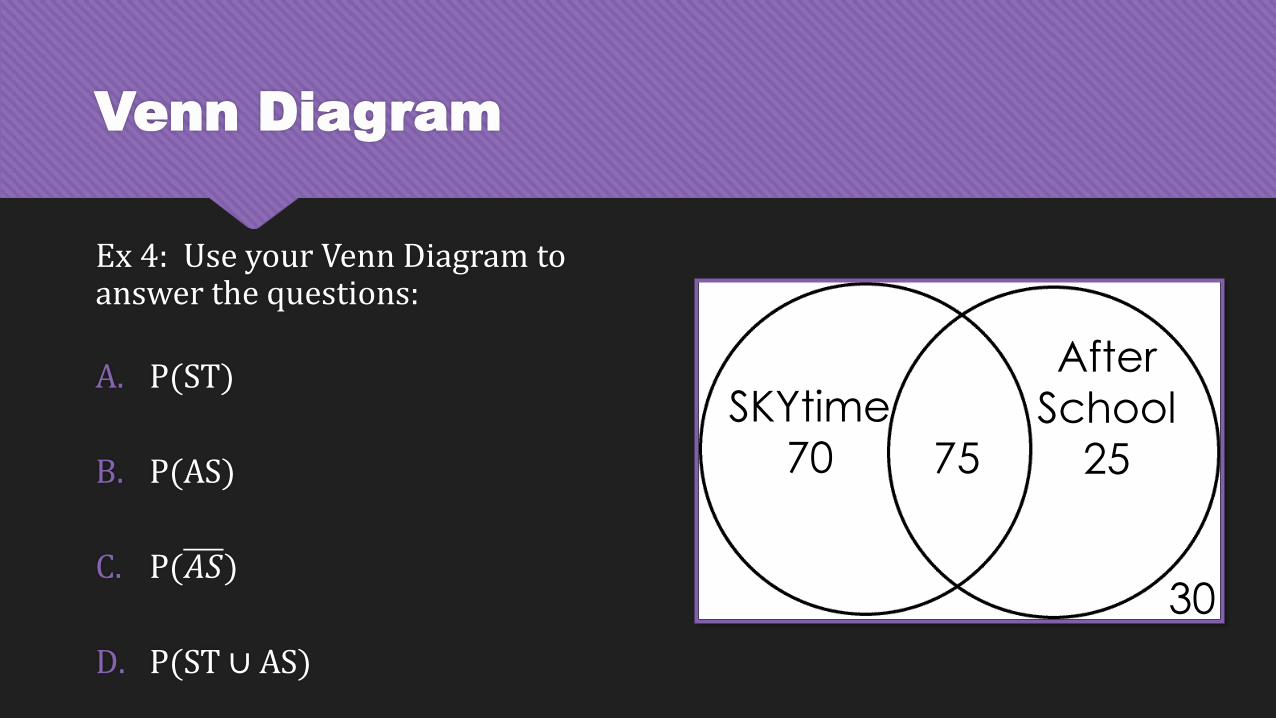
Ex 4: Use your Venn Diagram to answer the questions:
A. P(ST)
B. P(AS)
C. P(𝐴𝑆)
D. P(ST ∪ AS)
SKYtime
70 75
After
School
25
30
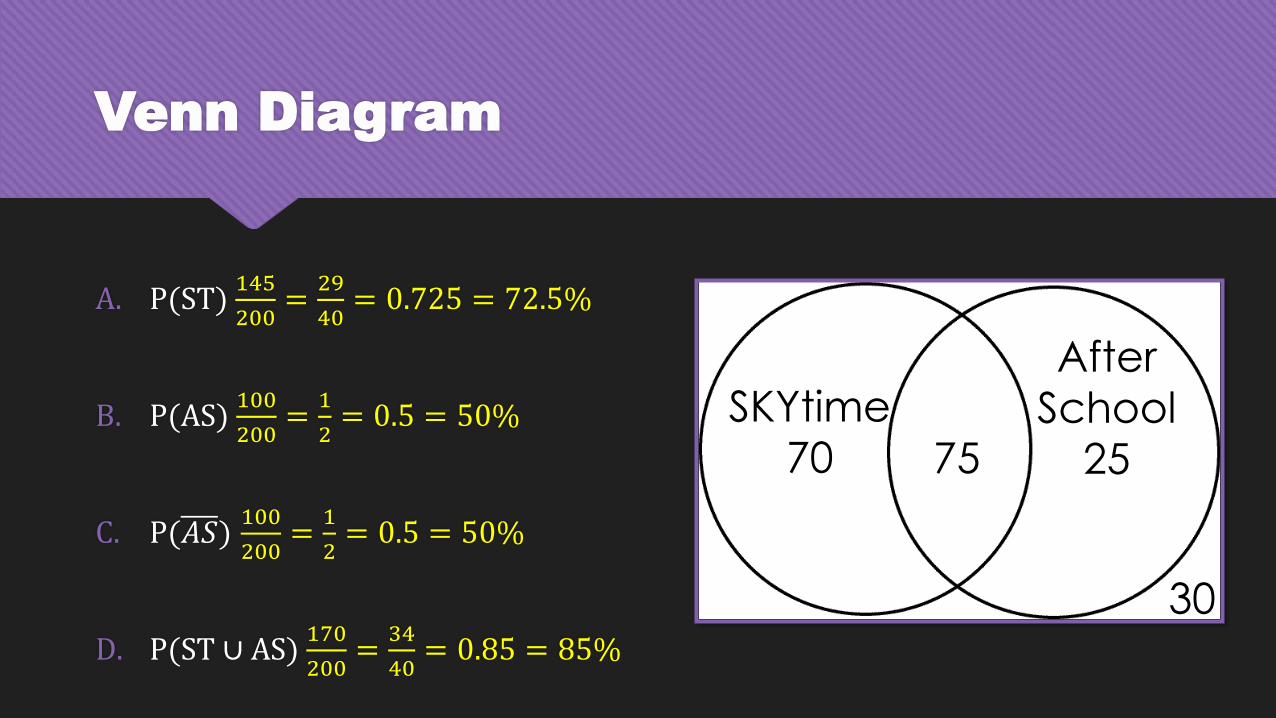
Venn Diagram
A. P(ST) 145
200=
29
40= 0.725 = 72.5%
B. P(AS) 100
200=
1
2= 0.5 = 50%
C. P(𝐴𝑆)100
200=
1
2= 0.5 = 50%
D. P(ST ∪ AS) 170
200=
34
40= 0.85 = 85%
SKYtime
70 75
After
School
25
30
Two Way Tables
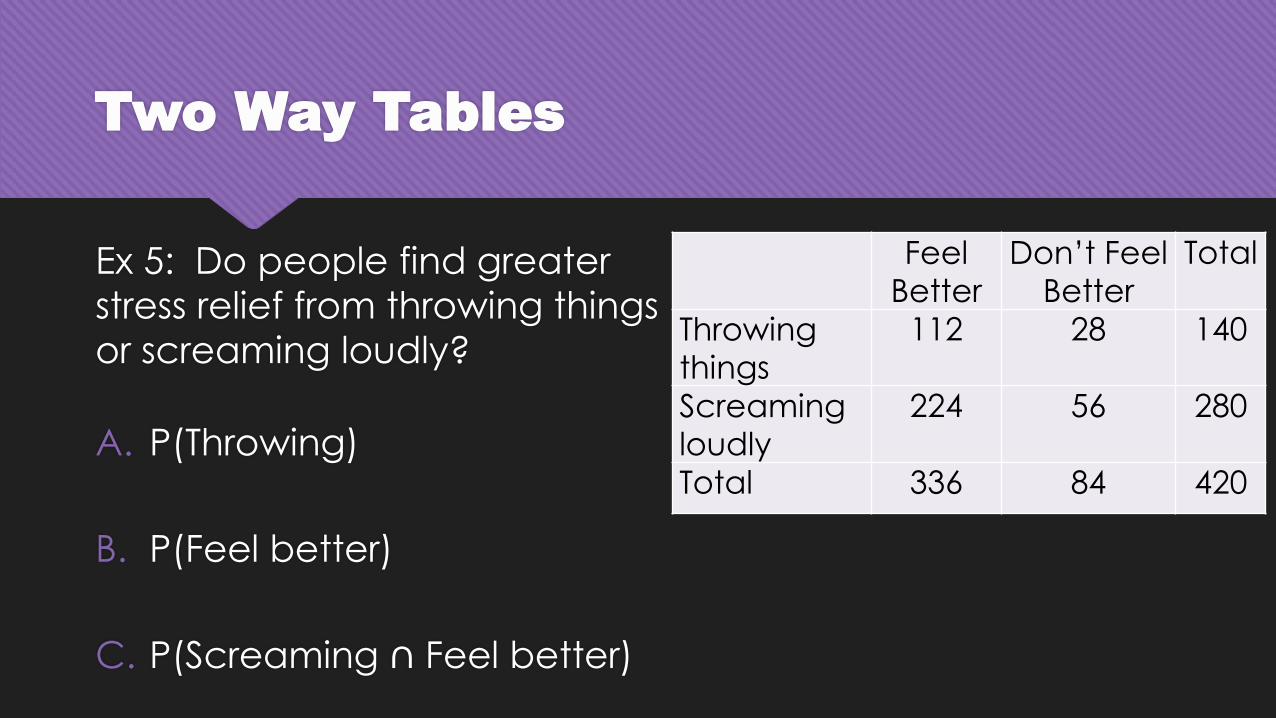
Ex 5: Do people find greater
stress relief from throwing things
or screaming loudly?
A. P(Throwing)
B. P(Feel better)
C. P(Screaming ∩ Feel better)
Feel Better
Don’t Feel Better
Total
Throwing things
112 28 140
Screaming loudly
224 56 280
Total 336 84 420
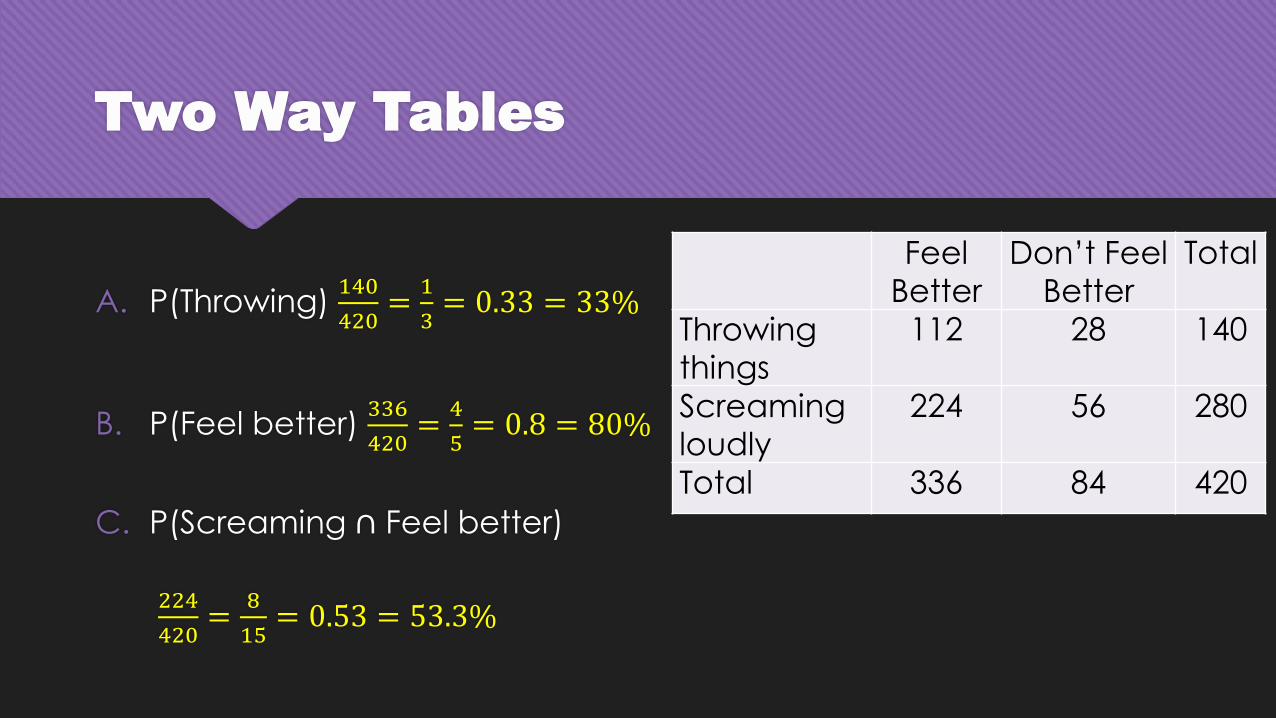
Two Way Tables
A. P(Throwing) 140
420=
1
3= 0.33 = 33%
B. P(Feel better) 336
420=
4
5= 0.8 = 80%
C. P(Screaming ∩ Feel better)
224
420=
8
15= 0.53 = 53.3%
Feel Better
Don’t Feel Better
Total
Throwing things
112 28 140
Screaming loudly
224 56 280
Total 336 84 420
HOMEWORK
Assignment 12.2
EDPuzzle 12.2