Embed Size (px)
Citation preview
m BChydro uI Richard Stout Chief Regulatory Officer Phone: (604) 623-4046 Fax: (604) 623-4407
30 December 2004
Mr. Robert J. Pellatt Commission Secretary British Columbia Utilities Commission Sixth Floor - 900 Howe Street Vancouver, BC V6Z 2N3
Dear Mr. Pellatt:
RE: British Columbia Hydro and Power Authority (“BC Hydro”) British Columbia Hydro and Power Authority (“BC Hydro”) Supplement to November 15, 2004 Compliance Filing
Pursuant to Paragraph 3 of BCUC Order No. G-96-04 and BC Hydro’s 15 November 2004 Compliance Filing, BC Hydro encloses the backup Schedules B through E to reflect the Commission’s decision (Consolidated Financial A Schedules are included for information).
Yours sincerelv,
df- e chard Stout fY Chief Regulatory Officer
Enclosure (20)
C. Project 3698360 Registered Intervenors
British Columbia Hydro and Power Authority, 333 Dunsmuir Street, Vancouver BC V6B 5R3 www. bchydro.com
Revenue Req u i reme n t Application
2004105 and 2005106
BChydro m llul
Supplemental Submission in Response to G-96-04
Consolidated Financial ‘A’ Schedules
Schedules ‘B’ to ‘E’
December 2004
Schedule A- I (November 2004)
1 2 3 4 5 6 7 8 9
10 11 12 13 14 15
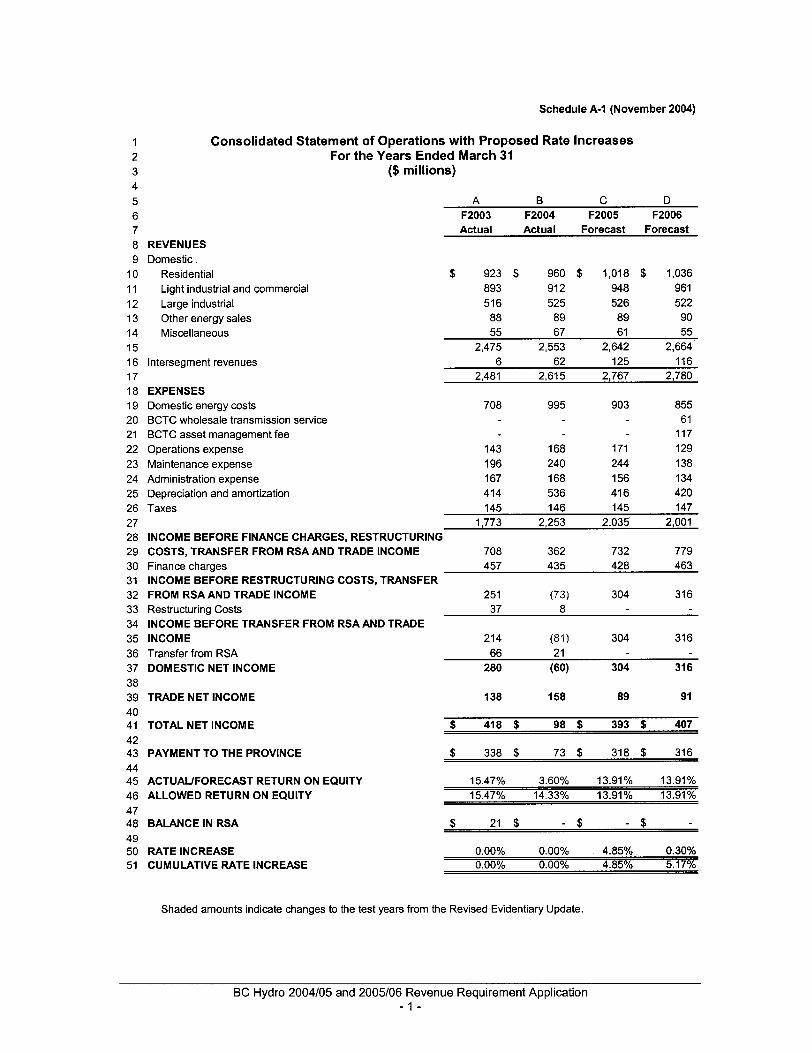
Consolidated Statement of Operations with Proposed Rate Increases For the Years Ended March 31
($ millions)
A B C D F2003 F2004 F2005 F2006 Actual Actual Forecast Forecast
REVENUES Domestic
Residential Light industrial and commercial Large industrial Other energy sales Miscellaneous
16 lntersegment revenues 17 18 EXPENSES
$ 923 $ 960 $ 1,018 $ 1,036 893 91 2 948 961 516 525 526 522 88 89 89 90 55 67 61 55
2,475 2,553 2,642 2,664 6 62 125 116
2,481 2,615 2,767 2,780
19 Domestic energy costs 708 995 903 855 20 BCTC wholesale transmission service 61 21 BCTC asset management fee 117 22 Operations expense 143 168 171 129 23 Maintenance expense 196 240 244 138
25 Depreciation and amortization 414 536 416 420 26 Taxes 145 146 145 147 27 1,773 2,253 2,035 2,001 28 INCOME BEFORE FINANCE CHARGES, RESTRUCTURING 29 COSTS, TRANSFER FROM RSA AND TRADE INCOME 708 362 732 779
24 Administration expense 167 168 156 I34
30 Finance charges 457 435 428 463 31 INCOME BEFORE RESTRUCTURING COSTS, TRANSFER 32 FROM RSAAND TRADE INCOME 251 (73) 304 31 6 33 Restructuring Costs 37 8 34 INCOME BEFORE TRANSFER FROM RSA AND TRADE 35 INCOME 214 (81) 304 31 6 36 Transfer from RSA 66 21 37 DOMESTIC NET INCOME 280 (60) 304 316 38 39 TRADE NET INCOME 138 158 89 91 40 41 TOTAL NET INCOME 42 43 PAYMENT TO THE PROVINCE 44 45 ACTUAUFORECAST RETURN ON EQUITY 46 ALLOWED RETURN ON EQUITY 47 48 BALANCE IN RSA 49 50 RATE INCREASE 51 CUMULATIVE RATE INCREASE
$ 418 $ 98 $ 393 $ 407
$ 338 !§ 73 $ 318 $ 316
15.47% 3.60% 13.91% 13.91% 15.47% 14.33% 13.91% 13.91%
0.00% 0.00% 4.85% 0.30% 0.00% 0.00% 4.85% 5.17%
Shaded amounts indicate changes to the test years from the Revised Evidentiary Update.
BC Hydro 2004/05 and 2005/06 Revenue Requirement Application - 1 -
Schedule A-2 (November 2004 Revised)
1 2 3 4 5 6 7 8 9
10 11 12 13 14 15 16 17 18 19 20 21 22 23 24 25 26 27 28 29 30 31 32 33 34 35 36 37 38 39 40 41 42 43 44 45 46 47 48 49 50 51 52 53 54 55 56
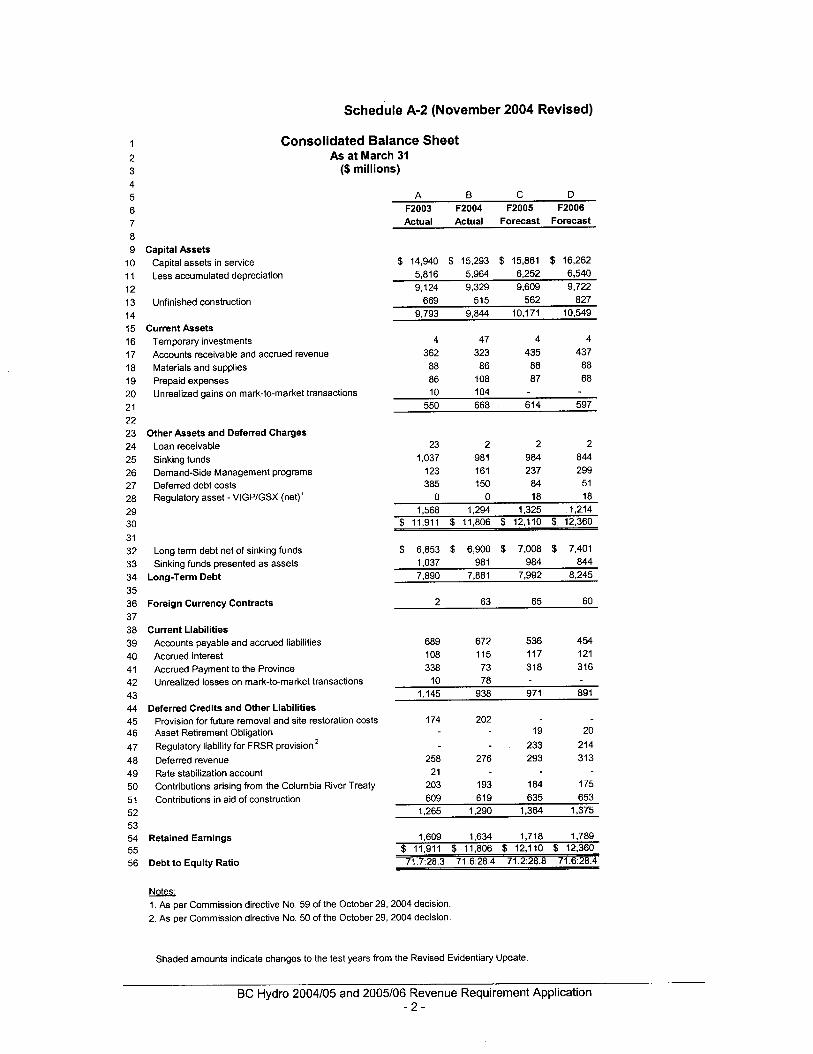
Consolidated Balance Sheet As at March 31
($ millions)
A 0 C D F2003 F2004 F2005 F2006 Actual Actual Forecast Forecast
Capital Assets Capital assets in service Less accumulated depreciation
Unfinished construction
Current Assets Temporary investments Accounts receivable and accrued revenue Materials and supplies Prepaid expenses Unrealized gains on mark-to-market transactions
Other Assets and Deferred Charges Loan receivable Sinking funds Demand-Side Management programs Deferred debt costs Regulatory asset - VIGP/GSX (net)'
Long term debt net of sinking funds Sinking funds presented as assets
Long-Term Debt
Foreign Currency Contracts
Current Liabilities Accounts payable and accrued liabilities Accrued interest Accrued Payment to the Province Unrealized losses on mark-to-market transactions
Deferred Credits and Other Liabilities Provision for future removal and site restoration costs Asset Retirement Obligation Regulatory liability for FRSR provision Deferred revenue Rate stabilization account Contributions arising from the Columbia River Treaty Contributions in aid of construction
Retained Earnings
Debt to Equity Ratio
$ 14,940 $ 15,293 $ 15,861 $ 16,262 5,816 5,964 6,252 6,540 9,124 9,329 9,609 9,722
669 515 562 827 9,793 9,844 10.171 10,549
4 47 4 4 362 323 435 437 88 86 88 88 86 108 87 68 10 104
550 668 614 597
23 2 2 2 1,037 981 984 844
123 161 237 299 385 150 84 51
0 0 18 18 1,568 1,294 1,325 1,214
$ 11,911 $ 11,806 $ 12,110 $ 12,360
$ 6.853 $ 6,900 $ 7,008 5 7,401 1,037 98 1 984 844 7,890 7,881 7,992 8,245
2 63 65 60
689 672 536 454 108 115 117 121 338 73 318 316
10 78 1,145 938 971 89 1
174 202 19 20
233 214 258 276 293 313
203 193 184 175 21
609 619 635 653 1,265 1,290 1,364 1,375
1,609 1,634 1,718 1,789 5 11,911 $ 11,806 $ 12,110 $ 12,360 71.7:28.3 71.6:28.4 71.2~28.8 71.6128.4
Notes: 1. As per Commission directive No. 59 of the October 29, 2004 decision. 2. As per Commission directive No. 50 of the October 29, 2004 decision.
Shaded amounts indicate changes to the test years from the Revised Evidentiary Update.
BC Hydro 2004105 and 2005/06 Revenue Requirement Application - 2 -
Schedule A-3 (November 2004)
1
2 3 4 5 6 7 8 9
10 11 12 13 14 15 16 17 18 19 20 21 22 23 24
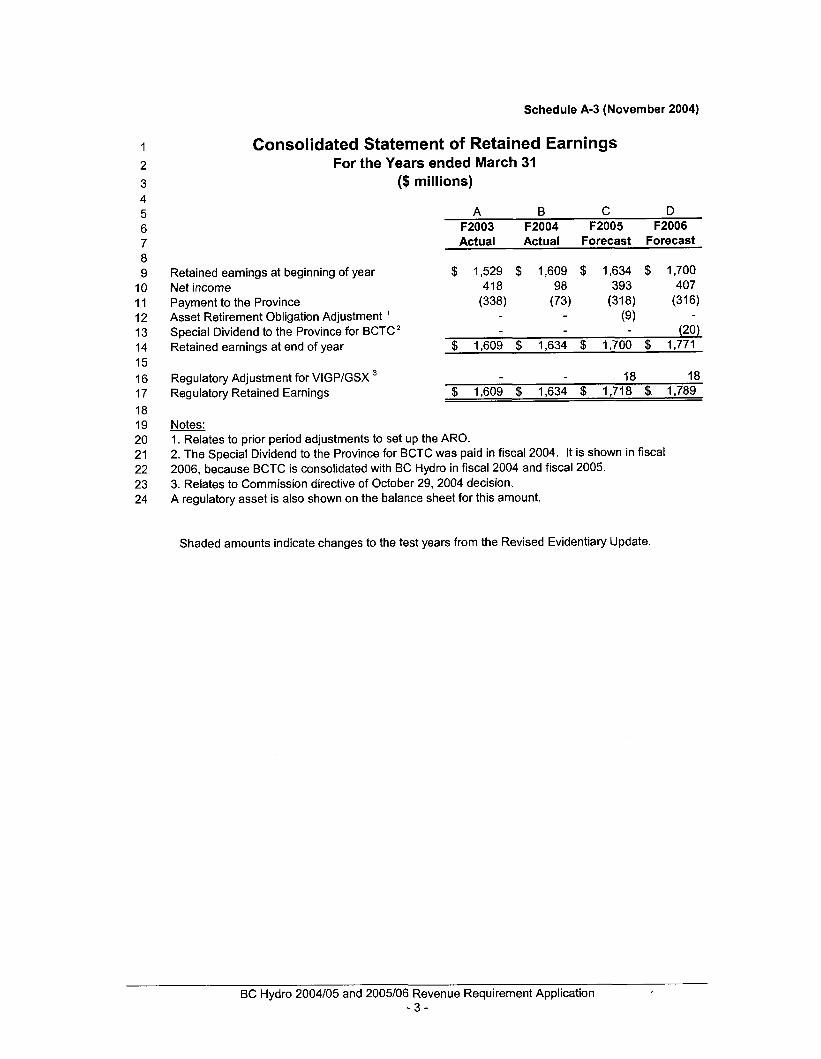
Consolidated Statement of Retained Earnings For the Years ended March 31
($ millions)
A B C D F2003 F2004 F2005 F2006 Actual Actual Forecast Forecast
Retained earnings at beginning of year $ 1,529 $ 1,609 $ 1,634 $ 1,700 Net income 418 98 393 407
Asset Retirement Obligation Adjustment ’ Retained earnings at end of year $ 1,609 $ 1,634 $ 1,700 $ 1,771
Regulatory Adjustment for VlGPlGSX 18 18 Regulatory Retained Earnings $ 1,609 $ 1,634 $ 1,718 $ 1,789
Payment to the Province (338) (73) (31 8) (31 6)
Special Dividend to the Province for BCTC’ (9)
(20)
Notes: 1. Relates to prior period adjustments to set up the ARO. 2. The Special Dividend to the Province for BCTC was paid in fiscal 2004. It is shown in fiscal 2006, because BCTC is consolidated with BC Hydro in fiscal 2004 and fiscal 2005. 3. Relates to Commission directive of October 29, 2004 decision. A regulatory asset is also shown on the balance sheet for this amount.
Shaded amounts indicate changes to the test years from the Revised Evidentiary Update.
BC Hydro 2004105 and 2005106 Revenue Requirement Application - 3 -
SCHEDULE A 4 (November 2004 Revised)
I 2 3 4 5 6 7 8 9
10 11 12 13 14 15 16 17 18 19 20 21 22 23 24 25 26 27 28 29 30 31 32 33 34 35 36 37 38 39 40 41 42
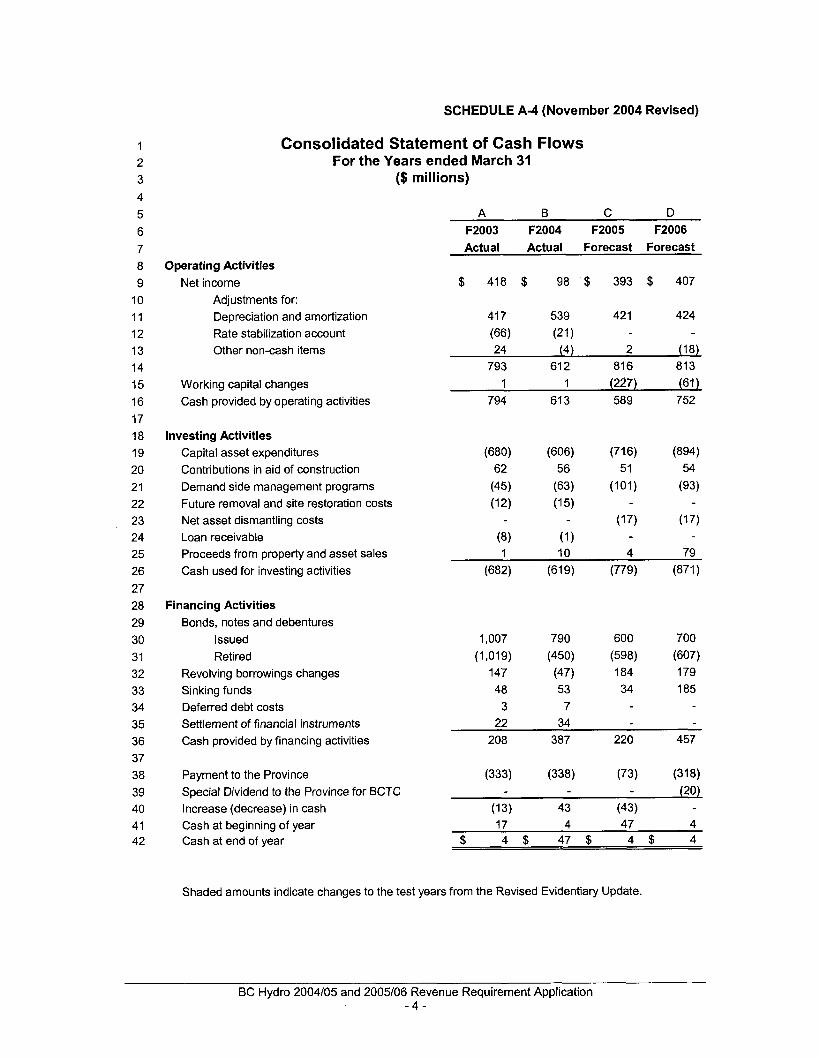
Consolidated Statement of Cash Flows For the Years ended March 31
($ millions)
A B C D
Operating Activities Net income
Adjustments for: Depreciation and amortization Rate stabilization account Other non-cash items
Working capital changes Cash provided by operating activities
Investing Activities Capital asset expenditures Contributions in aid of construction Demand side management programs Future removal and site restoration costs Net asset dismantling costs Loan receivable Proceeds from property and asset sales Cash used for investing activities
Financing Activities Bonds, notes and debentures
Issued Retired
Revolving borrowings changes Sinking funds Deferred debt costs Settlement of financial instruments Cash provided by financing activities
Payment to the Province Special Dividend to the Province for BCTC Increase (decrease) in cash Cash at beginning of year Cash at end of year
F2003 F2004 F2005 F2006 Actual Actual Forecast Forecast
$ 418 $ 98 $ 393 $ 407
41 7 539 42 1 424
24 (4) 2 (18) 793 61 2 81 6 813
1 1 (227) (61) 794 61 3 589 752
(66) (21)
1,007 790 600 700
147 (47) 184 179 48 53 34 185 3 7
22 34
(1,019) (450) (598) (607)
208 387 220 457
(13) 43 (43) 17 4 47 4
$ 4 $ 4 7 s 4 $ 4
Shaded amounts indicate changes to the test years from the Revised Evidentiary Update.
BC Hydro 2004/05 and 2005/06 Revenue Requirement Application - 4 -
Schedule A-5 (November 2004)
1 2 3 4 5 6 7 8 9
10 11 12 13 14 15 16 17 18 19 20 21 22 23 24 25 26 27 28 29 30 31 32 33
Revenue Residential revenue Revenue variance
Variance Rate increase: Volume:
Number of customers Usage per customer Power Smart savings Total Variance
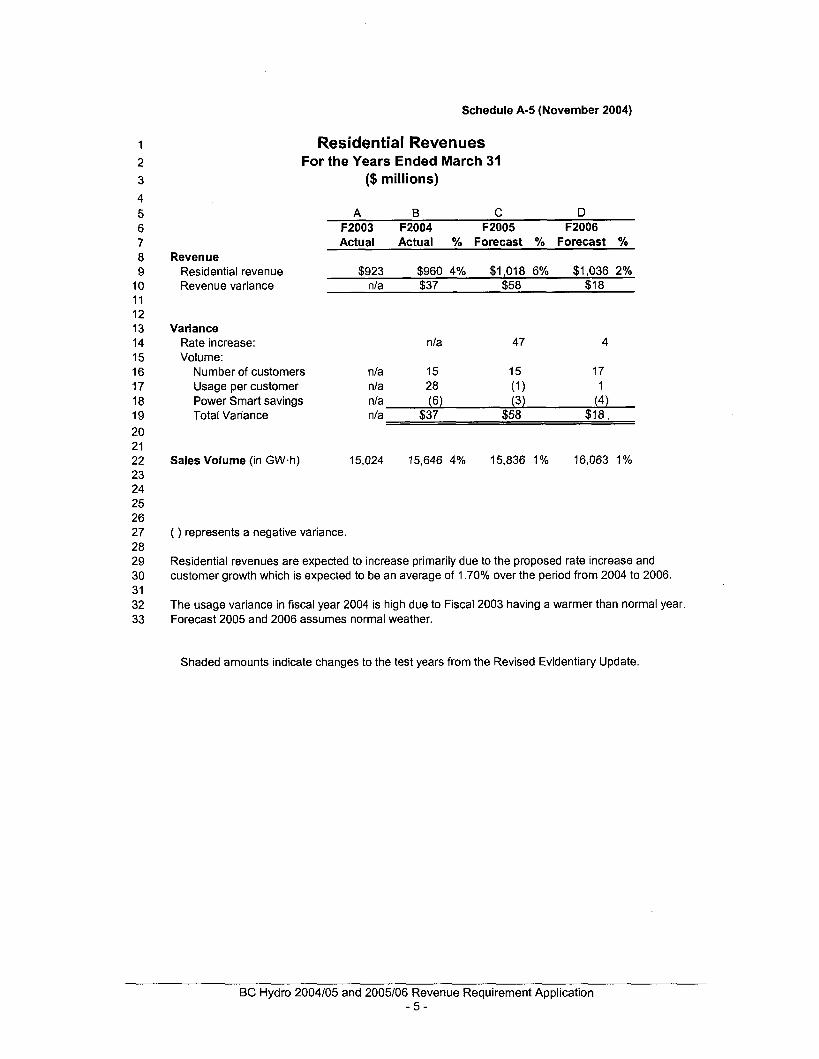
Res iden tial Revenues For the Years Ended March 31
($ millions)
Sales Volume (in GW.h)
A B C D F2003 F2004 F2005 F2006 Actual Actual % Forecast YO Forecast YO
$923 $960 4% $1,018 6% $1,036 2% nla $37 $58 $1 8
nla 47 4
n/a 15 15 17 nla 28 (1) 1 nla (6) (3) (4) nla $37 $58 $18
15,024 15,646 4% 15,836 1% 16,063 1%
( ) represents a negative variance.
Residential revenues are expected to increase primarily due to the proposed rate increase and customer growth which is expected to be an average of 1.70% over the period from 2004 to 2006.
The usage variance in fiscal year 2004 is high due to Fiscal 2003 having a warmer than normal year. Forecast 2005 and 2006 assumes normal weather.
Shaded amounts indicate changes to the test years from the Revised Evidentiary Update.
BC Hydro 2004105 and 2005106 Revenue Requirement Application - 5 -
Schedule A-6 (November 2004)
1 2
3
4 5 6 7
9 10 11
a
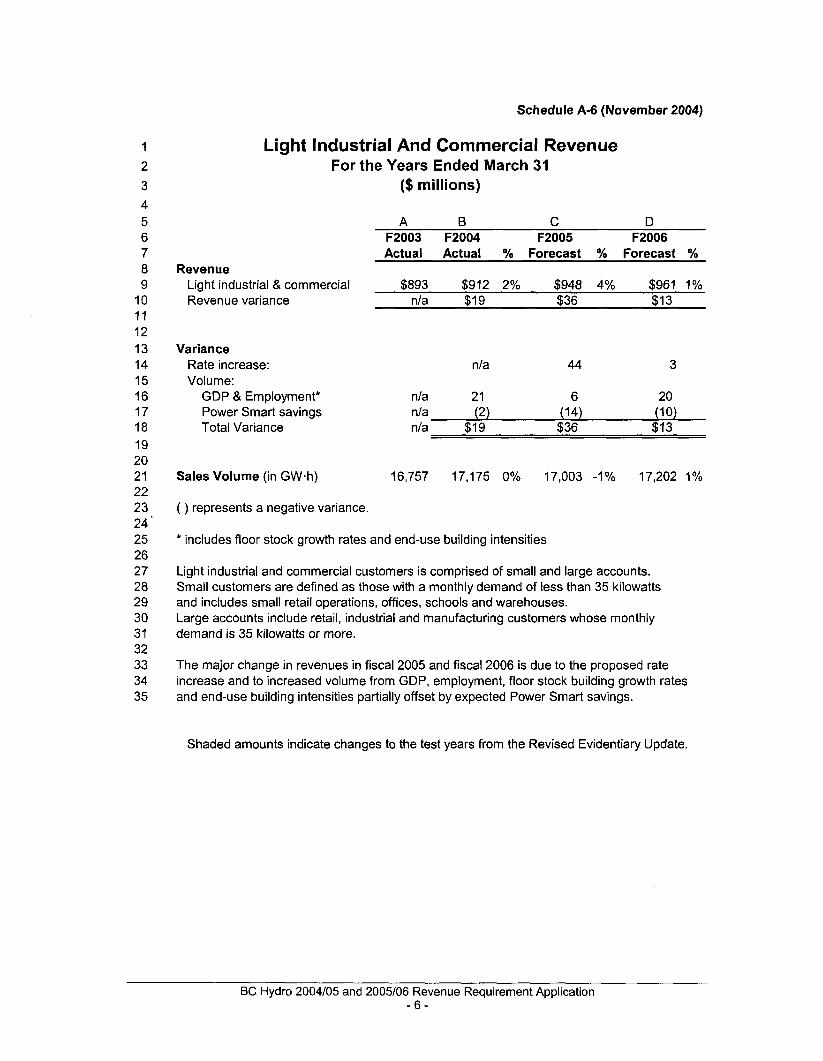
Light Industrial And Commercial Revenue For the Years Ended March 31
($ millions)
A B C D F2003 F2004 F2005 F2006 Actual Actual % Forecast % Forecast %
Revenue Light industrial & commercial $893 $912 2% $948 4% $961 1% Revenue variance nla $1 9 $36 $1 3
12 13 Variance 14 Rate increase: 15 Volume: 16 GDP & Employment* 17 Power Smart savings 18 Total Variance 19 20 21 22 23 24 ' 25 26 27 28 29 30 31 32 33 34 35
nla 44 3
nla 21 6 20 nla (2) (14) (IO) nla $19 $36 $13
Sales Volume (in GW.h) 16,757 17,175 0% 17,003 -1% 17,202 1%
( ) represents a negative variance.
* includes floor stock growth rates and end-use building intensities
Light industrial and commercial customers is comprised of small and large accounts. Small customers are defined as those with a monthly demand of less than 35 kilowatts and includes small retail operations, offices, schools and warehouses. Large accounts include retail, industrial and manufacturing customers whose monthly demand is 35 kilowatts or more.
The major change in revenues in fiscal 2005 and fiscal 2006 is due to the proposed rate increase and to increased volume from GDP, employment, floor stock building growth rates and end-use building intensities partially offset by expected Power Smart savings.
Shaded amounts indicate changes to the test years from the Revised Evidentiary Update.
BC Hydro 2004105 and 2005106 Revenue Requirement Application - 6 -
Schedule A-7 (November 2004)
1 2 3 4 5 6 7 8 9
10 11 12 13 14 15 16 17 18 19 20 21 22 23 24 25 26 27 28 29 30 31 32 33
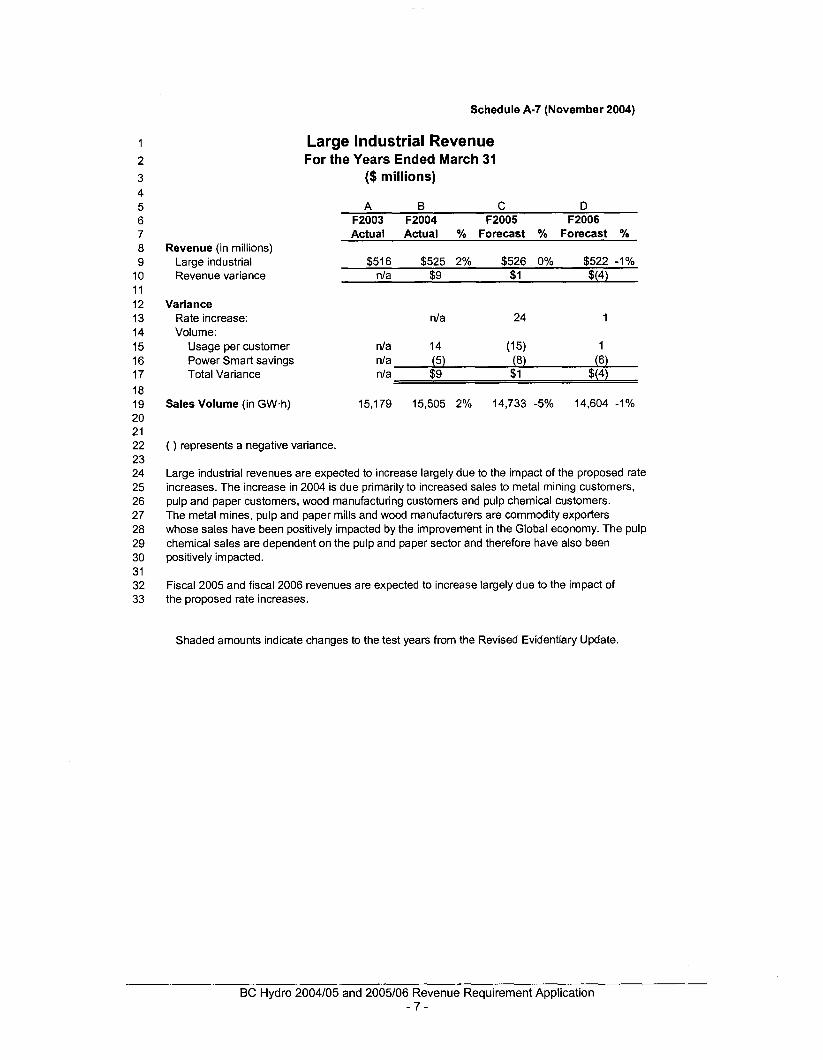
Large Industrial Revenue For the Years Ended March 31
($ millions)
A B C D F2003 F2004 F2005 F2006 Actual Actual % Forecast Ya Forecast %
Revenue (in millions) Large industrial Revenue variance
$516 $525 2% $526 0% $522 -1% nla $9 $1 $(4)
Variance Rate increase: Volume:
Usage per customer
nla 24 1
nla 14 (1 5) 1 Power Smart savings nla (5) (8) (6) Total Variance nla $9 $1 $44)
Sales Volume (in GW.h) 15,179 15,505 2% 14,733 -5% 14,604 -1%
( ) represents a negative variance.
Large industrial revenues are expected to increase largely due to the impact of the proposed rate increases. The increase in 2004 is due primarily to increased sales to metal mining customers, pulp and paper customers, wood manufacturing customers and pulp chemical customers. The metal mines, pulp and paper mills and wood manufacturers are commodity exporters whose sales have been positively impacted by the improvement in the Global economy. The pulp chemical sales are dependent on the pulp and paper sector and therefore have also been positively impacted.
Fiscal 2005 and fiscal 2006 revenues are expected to increase largely due to the impact of the proposed rate increases.
Shaded amounts indicate changes to the test years from the Revised Evidentiary Update.
BC Hydro 2004/05 and 2005106 Revenue Requirement Application - 7 -
Schedule A-8 (November 2004)
1 2 3 4 5 6 7 8 9 10 11 12 13 14 15 16 17 18 19 20 21 22 23 24 25 26 27 28 29 30 31 32 33 34 35 36 37 38 39 40 41 42 43 44 45 46 47 48
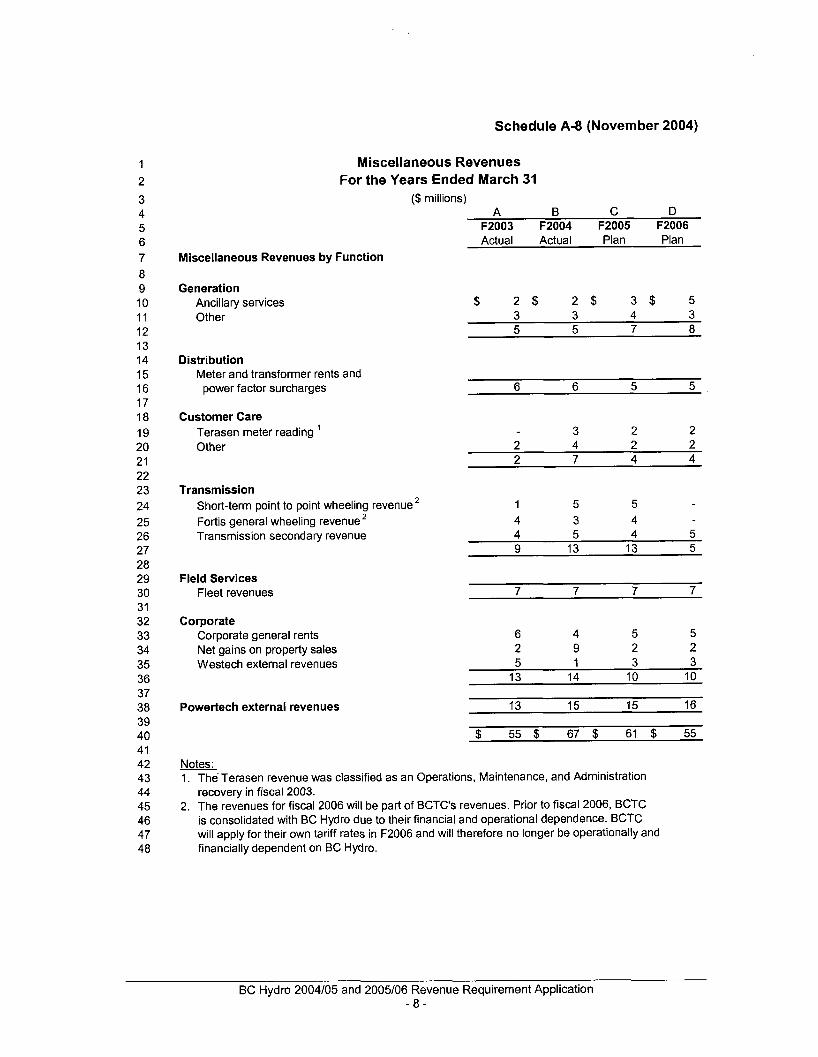
Miscellaneous Revenues For the Years Ended March 31
($ millions) A B C D
F2003 F2004 F2005 F2006 Actual Actual Plan Plan
Miscellaneous Revenues by Function
Generation Ancillary services Other
Distribution Meter and transformer rents and power factor surcharges
Customer Care Terasen meter reading ’ Other
Transmission Short-term point to point wheeling revenue2 Fortis general wheeling revenue’ Transmission secondary revenue
Field Services Fleet revenues
Corporate Corporate general rents Net gains on property sales Westech external revenues
Powertech external revenues
$ 2 $ 2 $ 3 $ 5 3 3 4 3 5 5 7 8
6 6 5 5
3 2 2 2 4 2 2 2 7 4 4
1 5 5 4 3 4 4 5 4 5 9 13 13 5
7 7 7 7
6 4 5 5 2 9 2 2 5 1 3 3
13 14 10 10
13 15 15 16
$ 55 $ 67 $ 61 $ 55
Notes: 1. The Terasen revenue was classified as an Operations, Maintenance, and Administration
recovery in fiscal 2003. 2. The revenues for fiscal 2006 will be part of BCTC‘s revenues. Prior to fiscal 2006, BCTC
is consolidated with BC Hydro due to their financial and operational dependence. BCTC will apply for their own tariff rates in F2006 and will therefore no longer be operationally and financially dependent on BC Hydro.
BC Hydro 2004105 and 2005106 Revenue Requirement Application - 8 -
Schedule A-9 (November 2004)
1 2
3 4 5 6 7 8 9
10 11 12 13 14 15 16 17 18 19 20 21 22 23 24 25 26 27 28 29 30 31 32 33 34 35 36 37 38 39 40 41 42 43 44 45 46 47 48 49 50 51 52 53 54 55 56 57 58 59 60
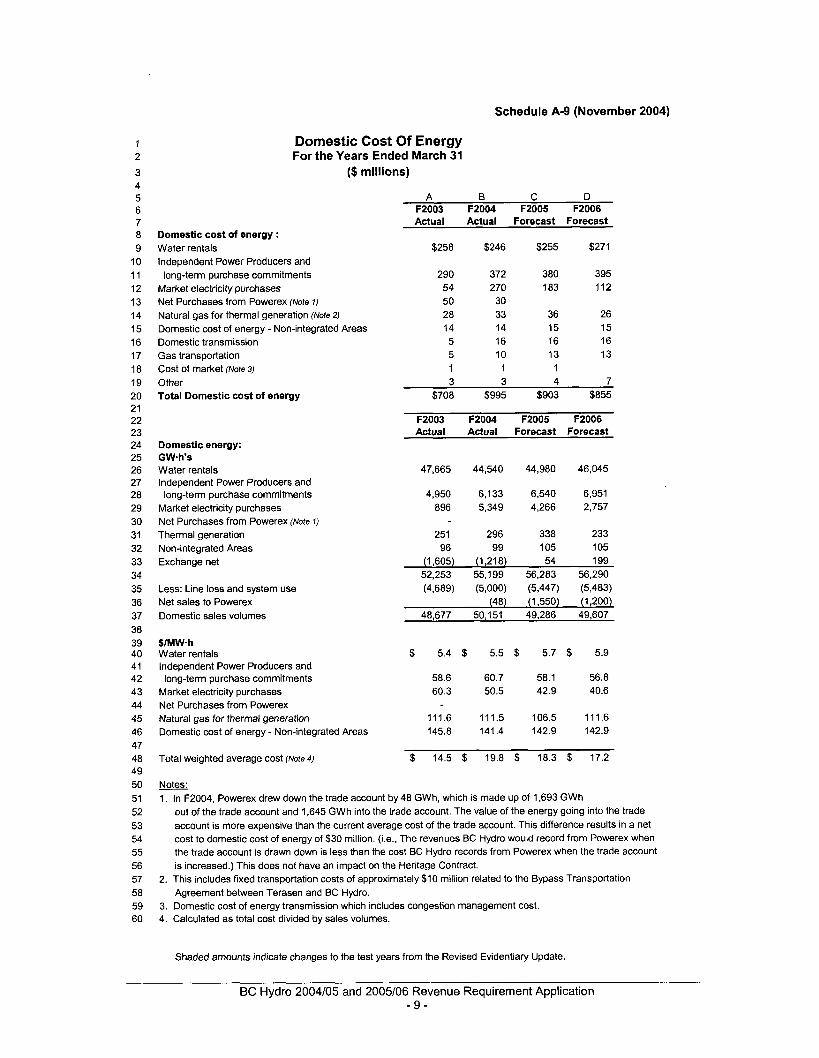
Domestic Cost Of Energy For the Years Ended March 31
($ millions)
A B C D F2003 F2004 F2005 F2006
Domestic cost of energy : Water rentals Independent Power Producers and long-term purchase commitments
Market electricity purchases Net Purchases from Powerex (Note 7)
Natural gas for thermal generation (Note 2) Domestic cost of energy - Non-integrated Areas Domestic transmission Gas transportation Cost of market (Note 3) Other Total Domestic cost of energy
Domestic energy: GW-h's Water rentals Independent Power Producers and long-term purchase commitments
Market electricity purchases Net Purchases from Powerex (Note I ) Thermal generation Non-integrated Areas Exchange net
Less: Line loss and system use Net sales to Powerex Domestic sales volumes
$/MW-h Water rentals Independent Power Producers and long-term purchase commitments
Market electricity purchases Net Purchases from Powerex Natural gas for thermal generation Domestic cost of energy - Non-integrated Areas
Total weighted average cost (hbte 4)
Actual Actual Forecast Forecast
$258 $246 $255 $271
290 372 380 395 54 270 183 112 50 30 28 33 36 26 14 14 15 15 5 16 16 16 5 10 13 13 1 1 1 3 3 4 7
$708 $995 $903 $855
F2003 F2004 F2005 F2006 Actual Actual Forecast Forecast
47,665 44,540 44,980 46,045
4,950 6,133 6,540 6,951 896 5,349 4,266 2,757
251 296 338 233 96 99 105 105
52,253 55,199 56,283 56,290 (4,689) (5,000) (5,447) (5,483)
(1,605) (1,218) 54 199
(48) (1,550) (1,200) 48,677 50,151 49,286 49,607
$ 5.4 $ 5.5 $ 5.7 $ 5.9
58.6 60.7 58.1 56.8 60.3 50.5 42.9 40.6
111.6 111.5 106.5 111.6 145.8 141.4 142.9 142.9
$ 14.5 $ 19.8 $ 18.3 $ 17.2
Notes: 1. In F2004, Powerex drew down the trade account by 48 GWh, which is made up of 1,693 GWh
out of the trade account and 1,645 GWh into the trade account. The value of the energy going into the trade account is more expensive than the current average cost of the trade account. This difference results in a net cost to domestic cost of energy of $30 million. (Le., The revenues BC Hydro would record from Powerex when the trade account is drawn down is less than the cost BC Hydro records from Powerex when the trade account is increased.) This does not have an impact on the Heritage Contract.
2. This includes fixed transportation costs of approximately $10 million related to the Bypass Transportation Agreement between Terasen and BC Hydro.
3. Domestic cost of energy transmission which includes congestion management cost. 4. Calculated as total cost divided by sales volumes.
Shaded amounts indicate changes to the test years from the Revised Evidentiary Update.
BC Hydro 2004l05 and 2005106 Revenue Requirement Application - 9 -
Schedule A-IO (November 2004)
1 2 3 4 5 6 7 8 9
10 11 12 13 14 15 16 17 18 19 20 21 22 23 24 25 26 27 28 29 30 31 32 33 34 35 36 37 38
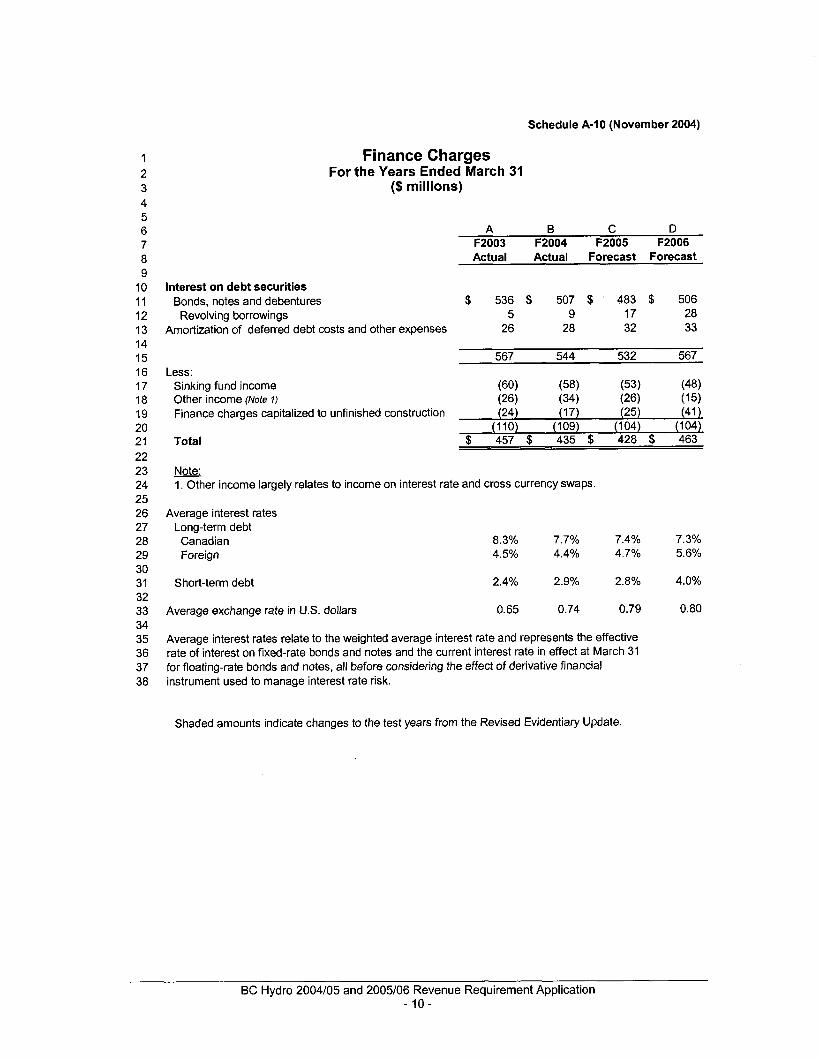
Finance Charges For the Years Ended March 31
($ millions)
A B C D F2003 F2004 F2005 F2006 Actual Actual Forecast Forecast
Interest on debt securities Bonds, notes and debentures $ 536 $ 507 $ 483 $ 506 Revolving borrowings 5 9 17 28
Amortization of deferred debt costs and other expenses 26 28 32 33
567 544 532 567 Less:
Sinking fund income (60) (58) (53) (48) Other income (Note 1) (26) (34) (26) (1 5) Finance charges capitalized to unfinished construction (24) (17) (25) (41 1
(110) (1 09) (1 04) (1 041 Total $ 457 $ 435 $ 428 $ 463
Note: 1. Other income largely relates to income on interest rate and cross currency swaps.
Average interest rates Long-term debt Canadian Foreign
8.3% 7.7% 7.4% 7.3% 4.5% 4.4% 4.7% 5.6%
Short-term debt 2.4% 2.9% 2.8% 4.0%
Average exchange rate in US. dollars 0.65 0.74 0.79 0.80
Average interest rates relate to the weighted average interest rate and represents the effective rate of interest on fixed-rate bonds and notes and the current interest rate in effect at March 31 for floating-rate bonds and notes, all before considering the effect of derivative financial instrument used to manage interest rate risk.
Shaded amounts indicate changes to the test years from the Revised Evidentiary Update.
BC Hydro 2004/05 and 2005/06 Revenue Requirement Application - 10-
Schedule A-I 1 (November 2004)
1 2 3 4 5 6 7 8 9
10 11 12 13 14 15 16 17 18 19 20 21 22 23 24 25 26 27 28 29 30 31 32 33 34 35 36 37 38 39 40 41 42 43 44 45 46
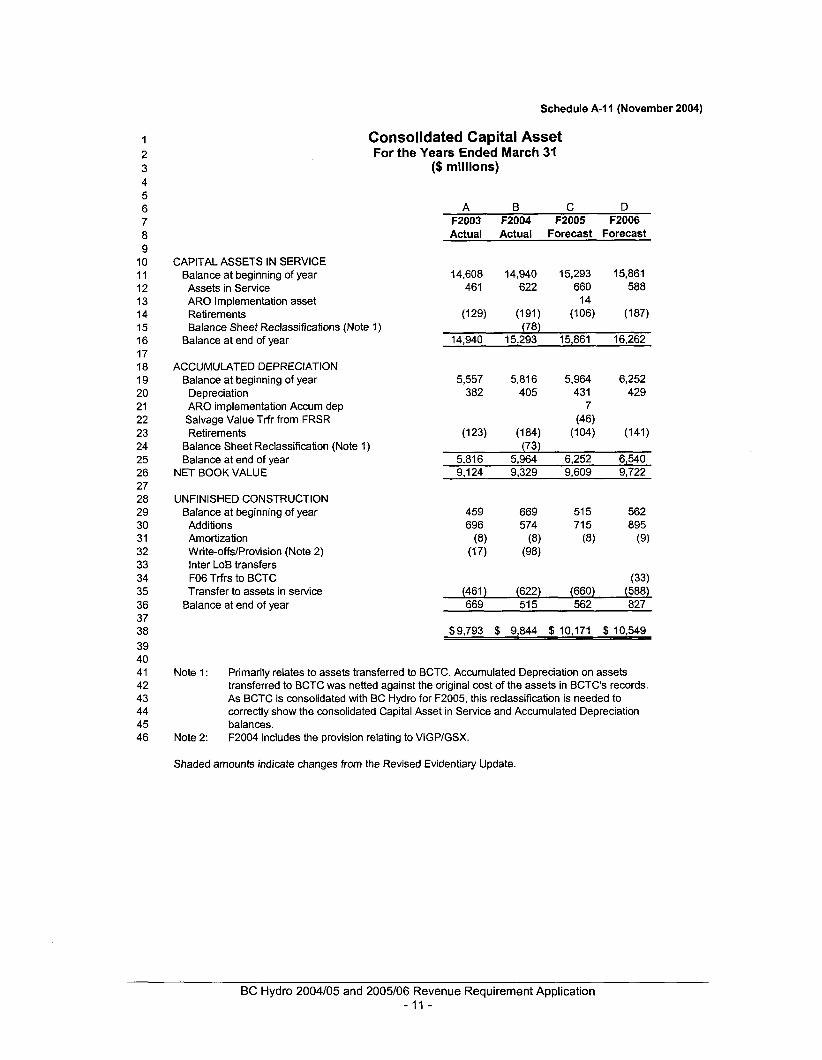
Consolidated Capital Asset For the Years Ended March 31
($ millions)
A B C D F2003 F2004 F2005 F2006 Actual Actual Forecast Forecast
CAPITAL ASSETS IN SERVICE Balance at beginning of year 14,608 14,940 15,293 15,861 Assets in Service 461 622 660 588 ARO Implementation asset 14 Retirements (129) (191) (106) (187) Balance Sheet Reclassifications (Note 1) (78)
Balance at end of year 14,940 15,293 15,861 16,262
ACCUMULATED DEPRECIATION Balance at beginning of year Depreciation ARO implementation Accum dep Salvage Value Trfr from FRSR Retirements
Balance Sheet Reclassification (Note 1) Balance at end of year
NET BOOK VALUE
UNFINISHED CONSTRUCTION Balance at beginning of year Additions Amortization Write-offslProvision (Note 2) Inter LOB transfers F06 Trfrs to BCTC Transfer to assets in service
Balance at end of year
5,557 5,816 5,964 6,252 382 405 431 429
7 (46)
(123) (184) (104) (141) (73)
5,816 5,964 6,252 6,540 9,124 9,329 9,609 9,722
(461) (622) (660) 669 51 5 562 827
$9,793 $ 9,844 $ 10,171 $ 10,549
Note 1: Primarily relates to assets transferred to BCTC. Accumulated Depreciation on assets transferred to BCTC was netted against the original cost of the assets in BCTC's records. As BCTC is consolidated with BC Hydro for F2005, this reclassification is needed to correctly show the consolidated Capital Asset in Service and Accumulated Depreciation balances.
Note 2: F2004 includes the provision relating to VIGPlGSX.
Shaded amounts indicate changes from the Revised Evidentiary Update.
BC Hydro 2004/05 and 2005/06 Revenue Requirement Application - 11 -
Schedule A-I2 (November 2004)
1 2 3 4 5 6 7 8 9
10 11 12 13 14 15 16 17 18 19 20 21 22 23 24 25 26 27 28
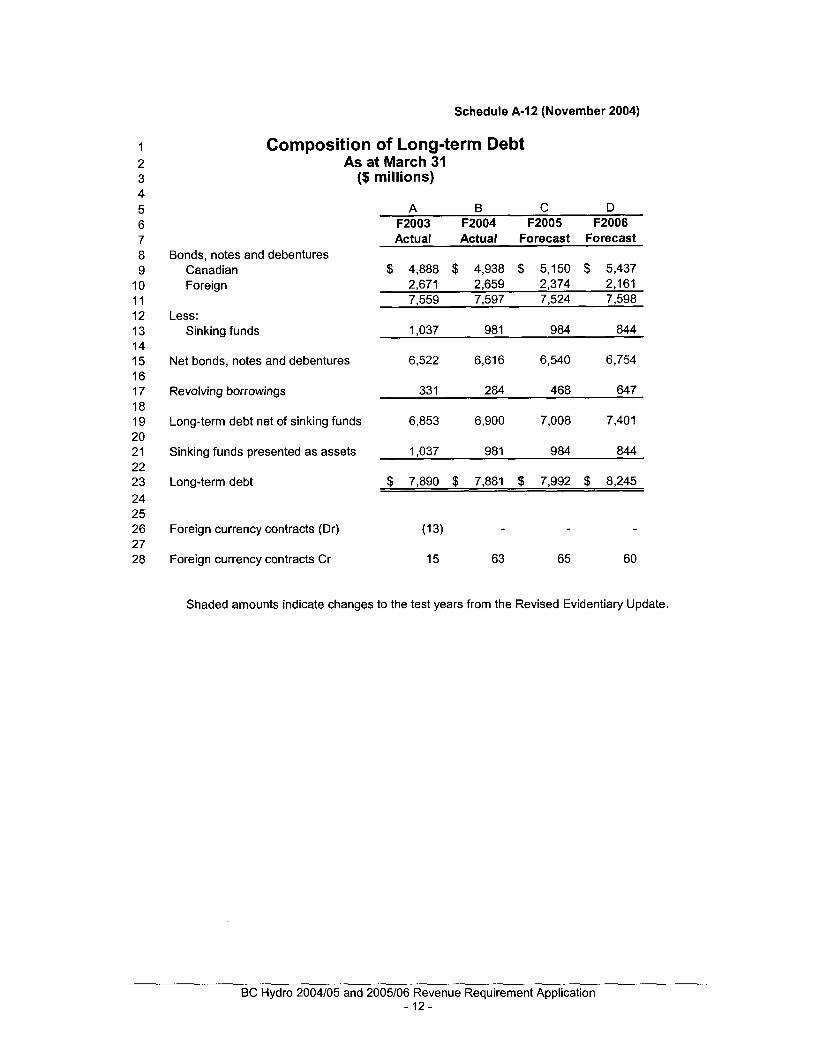
Composition of Long-term Debt As at March 31
($ millions)
A B C D F2003 F2004 F2005 F2006 Actual Actual Forecast Forecast
Canadian $ 4,888 $ 4,938 $ 5,150 $ 5,437 Bonds, notes and debentures
Foreign
Less: Sinking funds
2,671 2,659 2,374 2,161 7,559 7,597 7,524 7,598
1,037 981 984 844
Net bonds, notes and debentures 6,522 6,616 6,540 6,754
Revolving borrowings 331 284 468 647
Long-term debt net of sinking funds 6,853 6,900 7,008 7,401
Sinking funds presented as assets 1,037 981 984 844
Long-term debt $ 7,890 $ 7,881 $ 7,992 $ 8,245
Foreign currency contracts (Dr) (1 3)
Foreign currency contracts Cr 15 63 65 60
Shaded amounts indicate changes to the test years from the Revised Evidentiary Update.
BC Hydro 2004105 and 2005106 Revenue Requirement Application - 1 2 -
Schedule A-12-1 (November 2004)
1 2
3 4 5 6 7 8 9
10 11 12 13 14 15 16 17 18 19 20 21 22 23 24 25
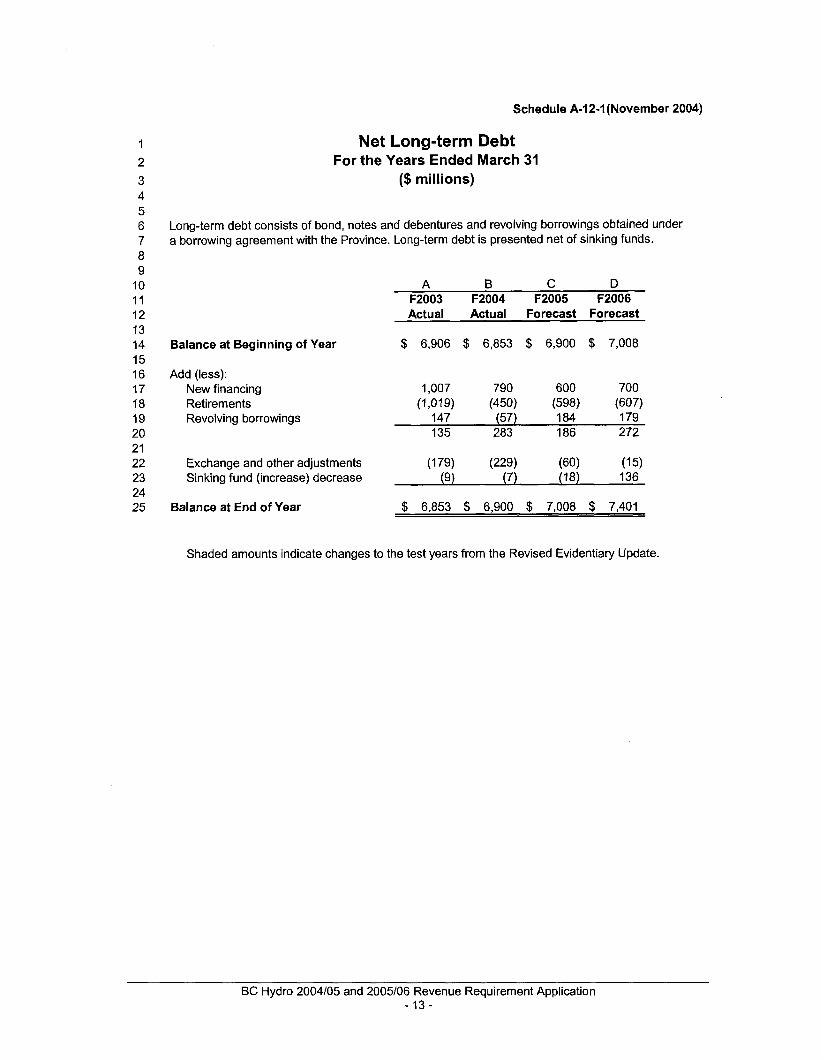
Net Long-term Debt For the Years Ended March 31
($ millions)
Long-term debt consists of bond, notes and debentures and revolving borrowings obtained under a borrowing agreement with the Province. Long-term debt is presented net of sinking funds.
A B C D F2003 F2004 F2005 F2006 Actual Actual Forecast Forecast
Balance at Beginning of Year $ 6,906 $ 6,853 $ 6,900 $ 7,008
Add (less): New financing Retirements Revolving borrowings
1,007 790 600 700
147 (57) 1 84 179 135 283 186 272
(1,019) (450) (598) (607)
Exchange and other adjustments (179) (229) (60) (1 5) Sinking fund (increase) decrease (9) (7) (18) 136
Balance at End of Year $ 6,853 $ 6,900 $ 7,008 $ 7,401
Shaded amounts indicate changes to the test years from the Revised Evidentiary Update.
BC Hydro 2004105 and 2005106 Revenue Requirement Application - 1 3 -
Schedule A-I3 (November 2004)
1
2 3 4 5 6 7 8 9
10 11 12 13 14 15 16 17 18 19 20 21 22 23 24 25 26 27 28 29
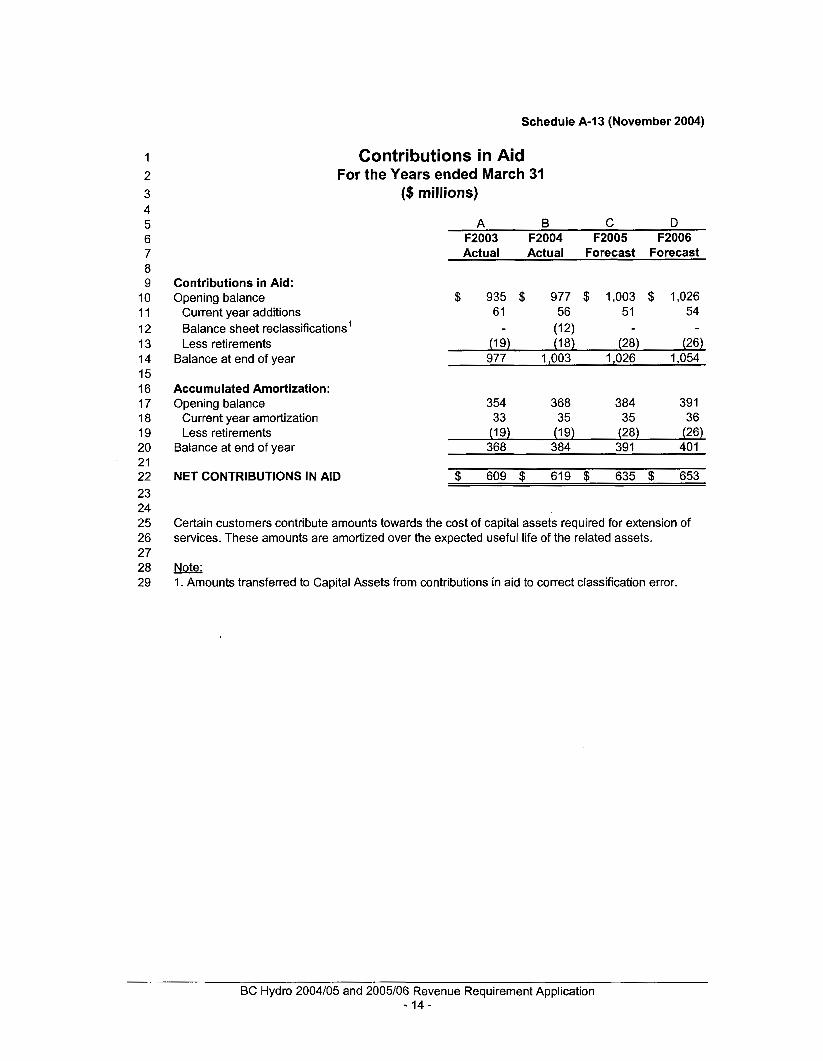
Contributions in Aid For the Years ended March 31
($ millions)
A B C D F2003 F2004 F2005 F2006 Actual Actual Forecast Forecast
Contributions in Aid: Opening balance $ 935 $ 977 $ 1,003 $ 1,026
Current year additions 61 56 51 54
Balance sheet reclassifications’ (1 2) Less retirements (19) (18) (28) (26)
Balance at end of year 977 1,003 1,026 1,054
Accumulated Amortization: Opening balance
Current year amortization Less retirements
Balance at end of year
354 368 384 39 I 33 35 35 36
(19) (19) (28) (26) 368 384 391 401
NET CONTRIBUTIONS IN AID $ 609 $ 619 $ 635 $ 653
Certain customers contribute amounts towards the cost of capital assets required for extension of services. These amounts are amortized over the expected useful life of the related assets.
Note: 1. Amounts transferred to Capital Assets from contributions in aid to correct classification error.
BC Hydro 2004/05 and 2005/06 Revenue Requirement Application - 1 4 -
Schedule A-I4 (November 2004)
1 2 3 4 5 6 7 8 9
10 11 12 13 14 15 16 17 18 19 20 21 22 23
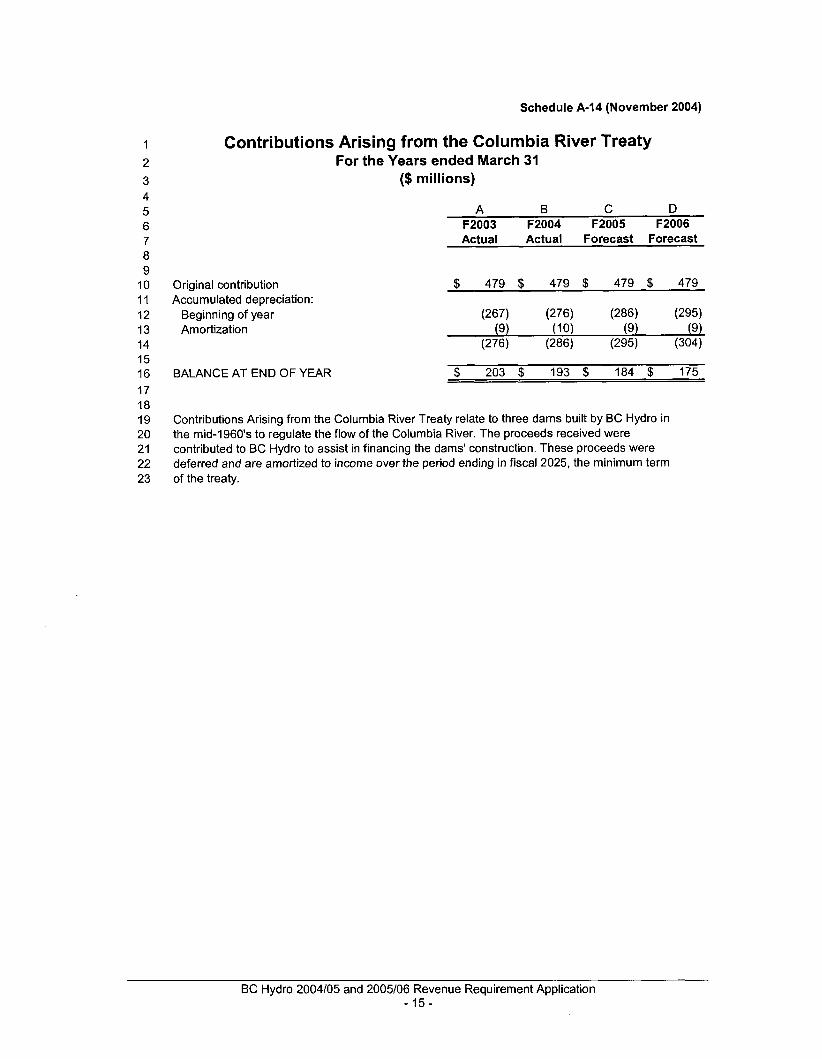
Contributions Arising from the Columbia River Treaty For the Years ended March 31
($ millions)
A B C D F2003 F2004 F2005 F2006 Actual Actual Forecast Forecast
Original contribution Accumulated depreciation:
Beginning of year Amortization
$ 479 $ 479 $ 479 $ 479
BALANCE AT END OF YEAR $ 203 $ 193 $ 184 $ 175
Contributions Arising from the Columbia River Treaty relate to three dams built by BC Hydro in the mid-1960’s to regulate the flow of the Columbia River. The proceeds received were contributed to BC Hydro to assist in financing the dams’ construction. These proceeds were deferred and are amortized to income over the period ending in fiscal 2025, the minimum term of the treaty.
BC Hydro 2004105 and 2005/06 Revenue Requirement Application - 1 5 -
Schedule A-I5 (November 2004)
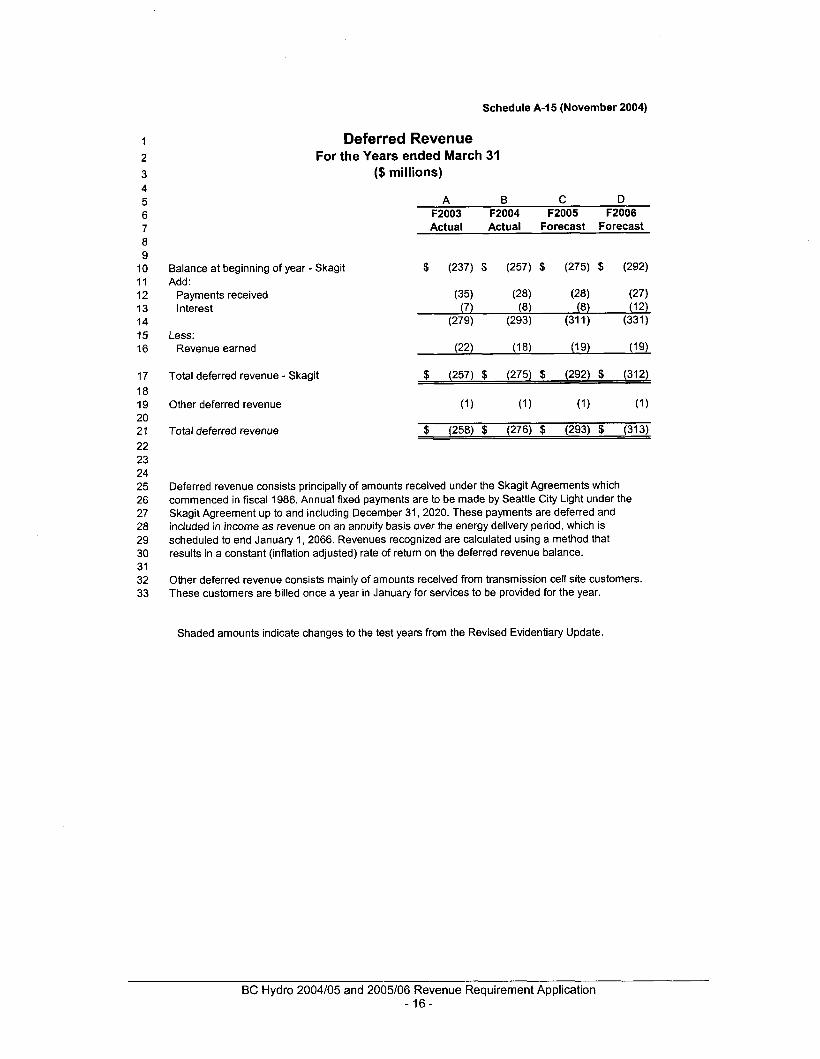
Deferred Revenue For the Years ended March 31
($ millions)
5 A B C D 6 F2003 F2004 F2005 F2006 7 Actual Actual Forecast Forecast 8 9
10 Balance at beginning of year - Skagit $ (237) $ (257) $ (275) $ (292) 11 Add:
13 Interest (7) (8) 8 14 (279) (293) (311) (331)
(27) (7; (12) 12 Payments received (35) (28)
15 Less: 16 Revenue earned
17 Total deferred revenue - Skagit $ (257) $ (275) $ (292) $ (312) 18 19 Other deferred revenue 20 21 22 23 24 25 26 27 28 29 30 31 32 33
Total deferred revenue
Deferred revenue consists principally of amounts received under the Skagit Agreements which commenced in fiscal 1986. Annual fixed payments are to be made by Seattle City Light under the Skagit Agreement up to and including December 31,2020. These payments are deferred and included in income as revenue on an annuity basis over the energy delivery period, which is scheduled to end January 1, 2066. Revenues recognized are calculated using a method that results in a constant (inflation adjusted) rate of return on the deferred revenue balance.
Other deferred revenue consists mainly of amounts received from transmission cell site customers. These customers are billed once a year in January for services to be provided for the year.
Shaded amounts indicate changes to the test years from the Revised Evidentiary Update.
BC Hydro 2004/05 and 2005106 Revenue Requirement Application - 1 6 -
Schedule A- I6 (November 2004)
1
2
3 4 5 6 7 8 9
10 11 12 13 14 15 16 17 18 19
20 21 22
23
24 25
26 27
28
29
30
' 31 32 33 34 35 36
37 38 39
40
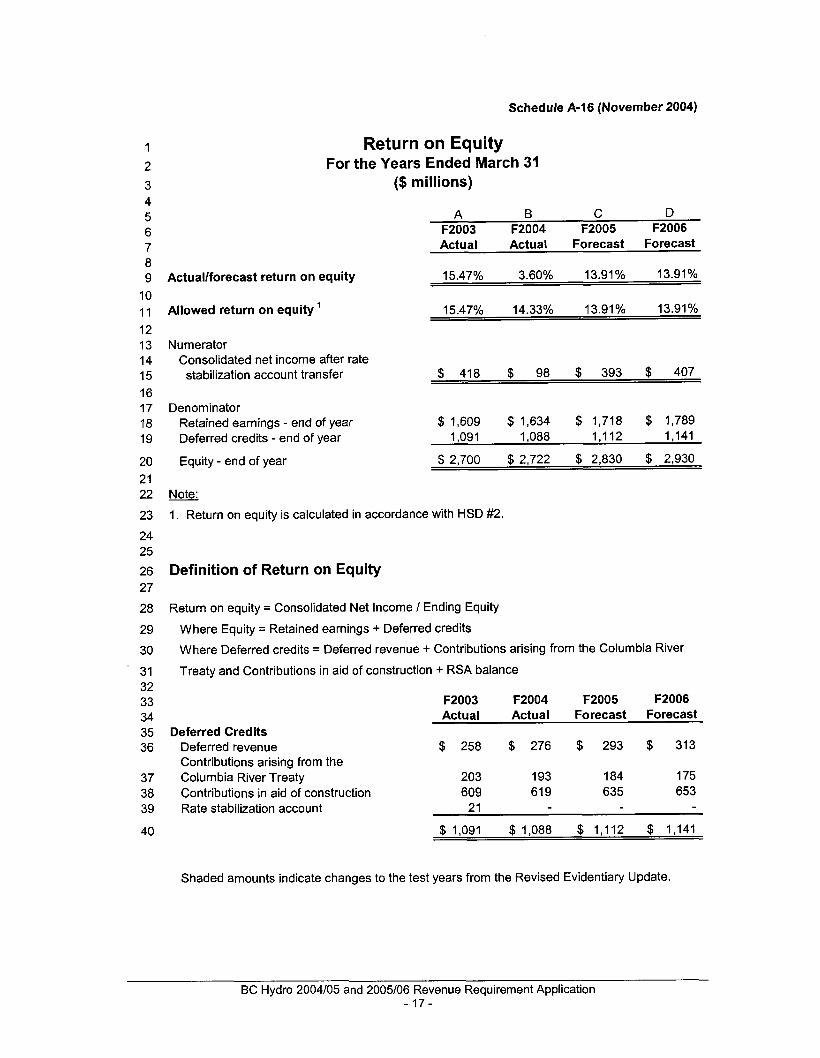
Return on Equity For the Years Ended March 31
($ millions)
A 6 C D F2003 F2004 F2005 F2006 Actual Actual Forecast Forecast
Actuallforecast return on equity 15.47% 3.60% 13.91% 13.91%
Allowed return on equity ' 15.47% 14.33% 13.91% 13.91%
Numerator Consolidated net income after rate
stabilization account transfer $ 418 $ 98 $ 393 $ 407
Denominator Retained earnings - end of year $ 1,609 $ 1,634 $ 1,718 $ 1,789 Deferred credits - end of year 1,091 1,088 1,112 1,141
Equity - end of year $ 2,700 $ 2,722 $ 2,830 $ 2,930
Note: 1. Return on equity is calculated in accordance with HSD #2.
Definition of Return on Equity
Return on equity = Consolidated Net Income / Ending Equity
Where Equity = Retained earnings + Deferred credits
Where Deferred credits = Deferred revenue + Contributions arising from the Columbia River
Treaty and Contributions in aid of construction + RSA balance
F2003 F2004 F2005 F2006
Deferred Credits Actual Actual Forecast Forecast
Deferred revenue $ 258 $ 276 $ 293 $ 313 Contributions arising from the Columbia River Treaty 203 193 1 84 175 Contributions in aid of construction 609 619 635 653 Rate stabilization account 21
$ 1,091 $ 1,088 $ 1,112 $ 1,141
Shaded amounts indicate changes to the test years from the Revised Evidentiary Update.
BC Hydro 2004105 and 2005/06 Revenue Requirement Application - 17 -
Schedule A-I7 (November 2004)
I 2
3 4 5 6 7
9 10 11 12 13 14 15 16 17
19 20 21 22 23 24 25 26 27
29 30 31 32
a
18
28
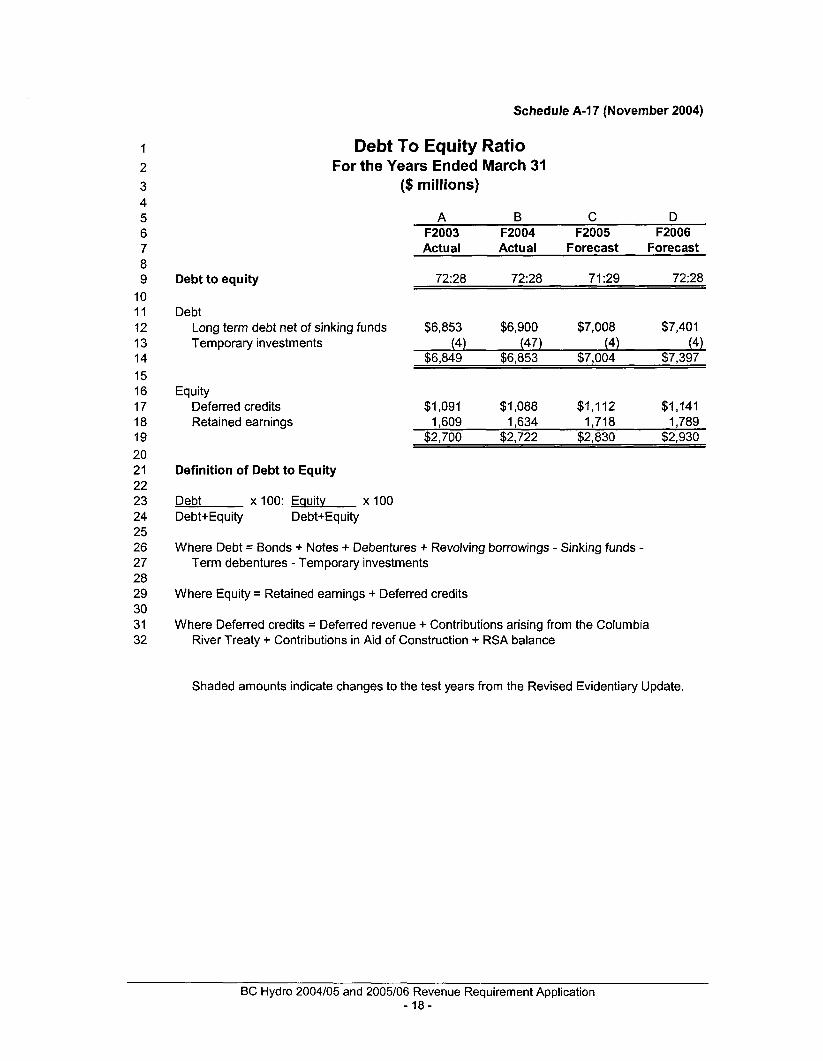
Debt To Equity Ratio For the Years Ended March 31
($ millions)
A B C D F2003 F2004 F2005 F2006 Actual Actual Forecast Forecast
Debt to equity 72:28 72:28 71 :29
Debt Long term debt net of sinking funds $6,853 $6,900 $7,008 $7,401 Temporary investments (4) (47) (4) (4)
$6,849 $6,853 $7,004 $7,397
Equity Deferred credits $1,091 $1,088 $1 ,I I 2 $1,141
$2,700 $2,722 $2,830 $2,930 Retained earnings 1,609 1,634 I ,718 I ,789
Definition of Debt to Equity
Debt x 100: Epuitv x 100 Debt+Equity Debt+Equity
Where Debt = Bonds + Notes + Debentures + Revolving borrowings - Sinking funds - Term debentures - Temporary investments
Where Equity = Retained earnings + Deferred credits
Where Deferred credits = Deferred revenue + Contributions arising from the Columbia River Treaty + Contributions in Aid of Construction + RSA balance
Shaded amounts indicate changes to the test years from the Revised Evidentiary Update.
BC Hydro 2004105 and 2005106 Revenue Requirement Application - 1 8 -
Schedule A-I8 (November 2004)
1 2 3 4 5 6 7 8 9
10 11 12 13 14 15 16 17 18 19 20 21 22 23 24
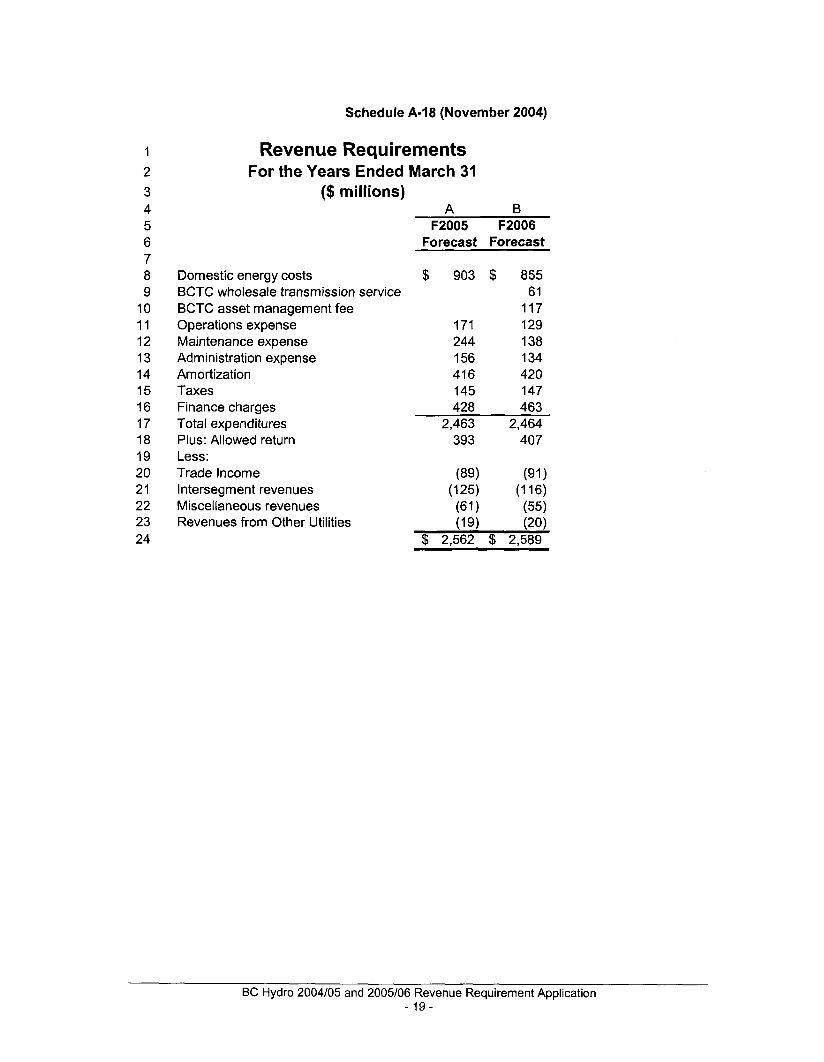
Reven ue Req u i re men ts For the Years Ended March 31
($ millions) A B
F2005 F2006 Forecast Forecast
Domestic energy costs BCTC wholesale transmission service BCTC asset management fee Operations expense Maintenance expense Administration expense Amortization Taxes Finance charges Total expenditures Plus: Allowed return Less: Trade Income I nterseg men t revenues Miscellaneous revenues Revenues from Other Utilities
$ 903 $ 855 61
117 171 129 244 138 156 134 416 420 145 147 428 463
2,463 2,464 393 407
BC Hydro 2004105 and 2005106 Revenue Requirement Application - 19-
Schedule A-I9 (November 2004)
1 2 3 4 5 6 7 8 9
10 11 12 13 14 15 16 17 18 19 20 21 22 23 24 25 26 27 28 29 30 31
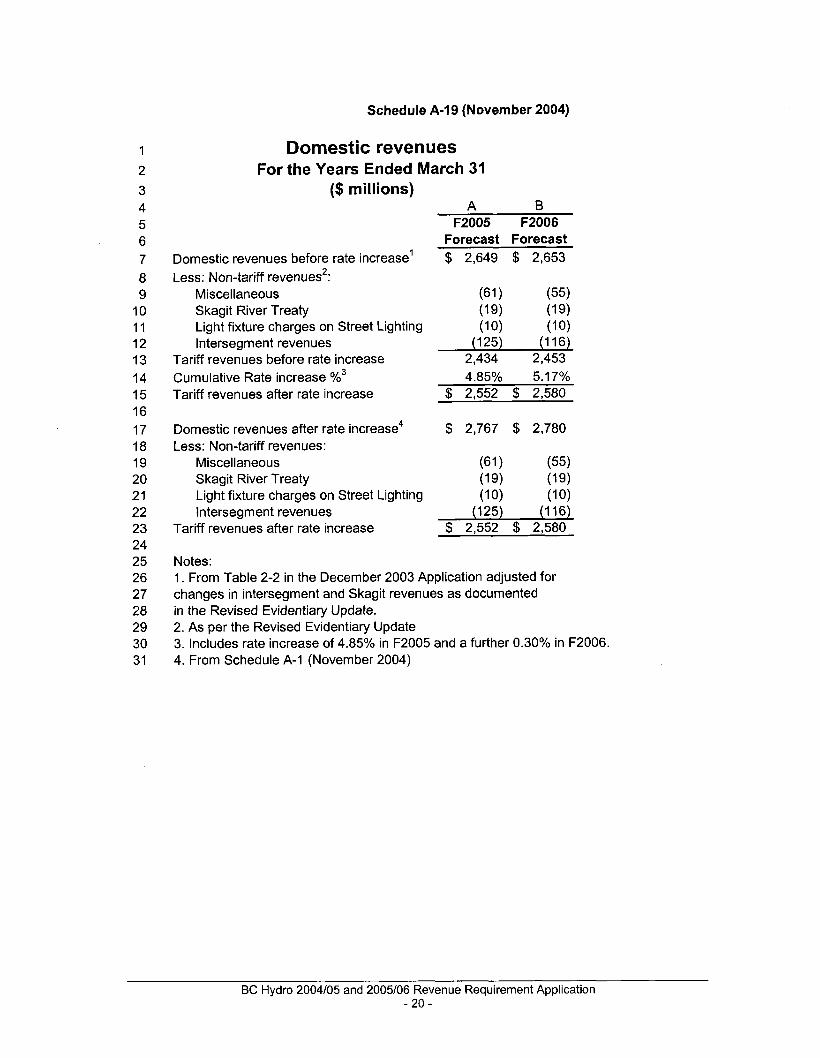
Domestic revenues For the Years Ended March 31
($ millions) A B
F2005 F2006 Forecast Forecast
Domestic revenues before rate increase’ $ 2,649 $ 2,653 Less: Non-tariff revenues2:
Miscellaneous (61 1 (55) Skagit River Treaty (19) (1 9) Light fixture charges on Street Lighting (1 0) (10) lntersegment revenues (125) (1 16)
Tariff revenues before rate increase 2,434 2,453 Cumulative Rate increase %3 4.85% 5.17% Tariff revenues after rate increase $ 2,552 $ 2,580
Domestic revenues after rate increase4 $ 2,767 $ 2,780 Less: Non-tariff revenues:
Miscellaneous (61 ) (55) Skagit River Treaty (1 9) (1 9) Light fixture charges on Street Lighting (1 0) (1 0) In tersegm en t revenues (125) (1 16)
Tariff revenues after rate increase $ 2,552 $ 2,580
Notes: 1. From Table 2-2 in the December 2003 Application adjusted for changes in intersegment and Skagit revenues as documented in the Revised Evidentiary Update. 2. As per the Revised Evidentiary Update 3. Includes rate increase of 4.85% in F2005 and a further 0.30% in F2006. 4. From Schedule A-1 (November 2004)
BC Hydro 2004105 and 2005106 Revenue Requirement Application - 20 -
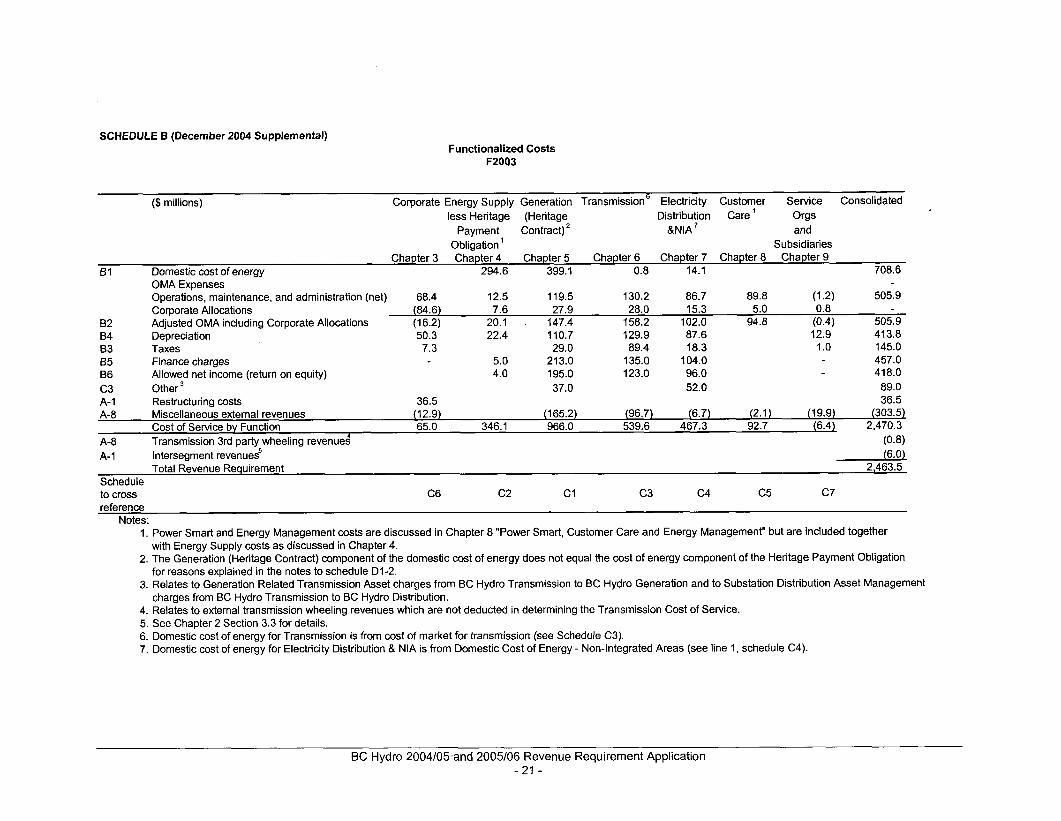
SCHEDULE B (December 2004 Supplemental) Functionalized Costs
F2003
($ millions) Corporate Energy Supply Generation Transmission6 Electricity Customer Service Consolidated less Heritage (Heritage Distribution Care Orgs
Payment Contract) * &NIA and Obligation Subsidiaries
Chapter 3 Chapter 4 Chapter 5 Chapter 6 Chapter 7 Chapter 8 Chapter 9 B1 Domestic cost of energy 294.6 399.1 0.8 14.1 708.6
OMA Expenses Operations, maintenance, and administration (net) 68.4 12.5 119.5 130.2 86.7 89.8 (1 4 505.9 Corporate Allocations (84.6) 7.6 27.9 28.0 15.3 5.0 0.8
B2 Adjusted OMA including Corporate Allocations (16.2) 20.1 . 147.4 158.2 102.0 94.8 (0.4) 505.9 84 Depreciation 50.3 22.4 110.7 129.9 87.6 12.9 413.8 83 Taxes 7.3 29.0 89.4 18.3 1 .o 145.0 65 Finance charges 5.0 213.0 135.0 104.0 457.0 B6 Allowed net income (return on equity) 4.0 195.0 123.0 96.0 418.0 c3 Other 37.0 52.0 89.0 A-I Restructuring costs 36.5 36.5 A-8 Miscellaneous external revenues (12.9) (165.2) (96.7) (6.7) (2.1) (19.9) (303.5)
Cost of Service by Function 65.0 346.1 966.0 539.6 467.3 92.7 (6.4) 2,470.3
A- 1 Intersegment revenues5 (6.0) Total Revenue Requirement 2.463.5
Schedule to cross C6 c2 c 1 c 3 c 4 c5 c7 reference
A-8 Transmission 3rd party wheeling revenues4 (0.8)
Notes: 1. Power Smart and Energy Management costs are discussed in Chapter 8 "Power Smart, Customer Care and Energy Management" but are included together
2. The Generation (Heritage Contract) component of the domestic cost of energy does not equal the cost of energy component of the Heritage Payment Obligation
3. Relates to Generation Related Transmission Asset charges from BC Hydro Transmission to BC Hydro Generation and to Substation Distribution Asset Management
4. Relates to external transmission wheeling revenues which are not deducted in determining the Transmission Cost of Service. 5. See Chapter 2 Section 3.3 for details. 6. Domestic cost of energy for Transmission is from cost of market for transmission (see Schedule C3). 7. Domestic cost of energy for Electricity Distribution & NIA is from Domestic Cost of Energy - Non-Integrated Areas (see line 1, schedule C4).
with Energy Supply costs as discussed in Chapter 4.
for reasons explained in the notes to schedule D1-2.
charges from BC Hydro Transmission to BC Hydro Distribution.
BC Hydro 2004105,and 2005106 Revenue Requirement Application - 21 -
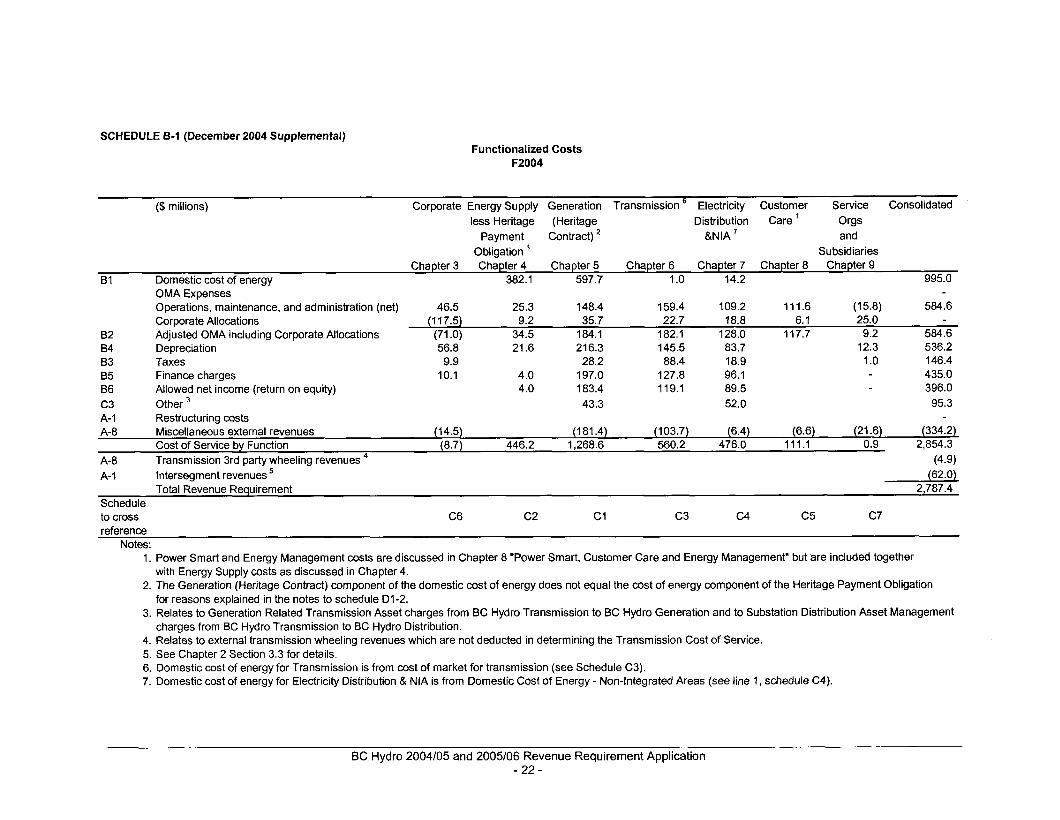
SCHEDULE 6-1 (December 2004 Supplemental) Functionalized Costs
F2004
($ millions) Corporate Energy Supply Generation Transmission Electricity Customer Service Consolidated less Heritage (Heritage Distribution Care Orgs
Payment Contract) * &NIA and Obligation Subsidiaries
Chapter 3 Chapter 4 Chapter 5 Chapter 6 Chapter 7 Chapter 8 Chapter 9 B1 Domestic cost of energy 382.1 597.7 1 .o 14.2 995.0 -.
OMA Expenses Operations, maintenance, and administration (net) 46.5 25.3 148.4 159.4 109.2 111.6 (1 5.8) 584.6 Corporate Allocations (117.5) 9.2 35.7 22.7 18.8 6.1 25.0
82 Adjusted OMA including Corporate Allocations (71 .O) 34.5 184.1 182.1 128.0 117.7 9.2 584.6 84 Depreciation 56.8 21.6 216.3 145.5 83.7 12.3 536.2 83 Taxes 9.9 28.2 88.4 18.9 1 .o 146.4 B5 Finance charges 10.1 4.0 197.0 127.8 96.1 435.0 B6 Allowed net income (return on equity) 4.0 183.4 119.1 89.5 396.0 c 3 Other 43.3 52.0 95.3 A-I Restructuring costs A-8 Miscellaneous external revenues (14.5) (181.4) (1 03.7) (6.4) (6.6) (21.6) (334.2)
Cost of Service by Function (8.7) 446.2 560.2 476.0 111.1 0.9 2,854.3 1,268.6 A-8 Transmission 3rd party wheeling revenues (4.9) A- 1 Intersegment revenues ' (62.0)
Total Revenue Requirement 2,787.4 Schedule to cross C6 c 2 c 1 c 3 c 4 c 5 c 7
Notes: 1.
2.
3.
4. 5. 6. 7.
Power Smart and Energy Management costs are discussed in Chapter 8 "Power Smart, Customer Care and Energy Management" but are included together with Energy Supply costs as discussed in Chapter 4. The Generation (Heritage Contract) component of the domestic cost of energy does not equal the cost of energy component of the Heritage Payment Obligation for reasons explained in the notes to schedule D1-2. Relates to Generation Related Transmission Asset charges from BC Hydro Transmission to BC Hydro Generation and to Substation Distribution Asset Management charges from BC Hydro Transmission to BC Hydro Distribution. Relates to external transmission wheeling revenues which are not deducted in determining the Transmission Cost of Service. See Chapter 2 Section 3.3 for details. Domestic cost of energy for Transmission is from cost of market for transmission (see Schedule C3). Domestic cost of energy for Electricity Distribution & NIA is from Domestic Cost of Energy - Non-Integrated Areas (see line 1, schedule C4).
BC Hydro 2004105 and 2005106 Revenue Requirement Application - 22 -
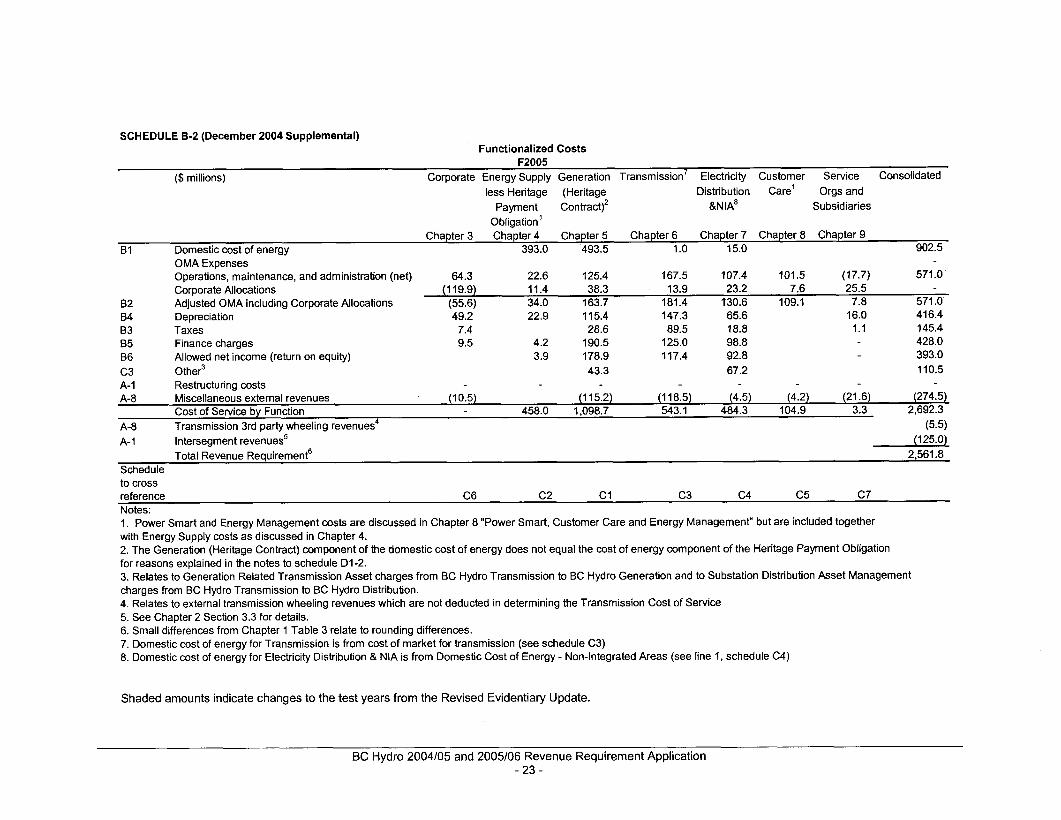
SCHEDULE 8-2 (December 2004 Supplemental) Functionalized Costs
F2005 ($ millions) Corporate Energy Supply Generation Transmission' Electricity Customer Service Consolidated
less Heritage (Heritage Payment Contractl2
Obligation'
Distribution Care' Orgs and &NIA~ Subsidiaries
Chapter 3 Chapter 4 Chapter 5 Chapter 6 Chapter 7 Chapter 8 Chapter 9 B1 Domestic cost of energy 393.0 493.5 1 .o 15.0 902.5
OMA Expenses Operations, maintenance, and administration (net) 64.3 22.6 125.4 167.5 107.4 101.5 (17.7) 571.0 Corporate Allocations (1 19.9) 11.4 38.3 13.9 23.2 7.6 25.5
82 Adjusted OMA including Corporate Allocations (55.6) 34.0 163.7 181.4 130.6 109.1 7.8 571 .O 84 Depreciation 49.2 22.9 11 5.4 147.3 65.6 16.0 416.4 83 Taxes 7.4 28.6 89.5 18.8 1.1 145.4 B5 Finance charges 9.5 4.2 190.5 125.0 98.8 428.0 B6 Allowed net income (return on equity) 3.9 178.9 117.4 92.8 393.0 c 3 Other3 43.3 67.2 110.5 A- 1 Restructuring costs A-8 Miscellaneous external revenues (10.5) (1 15.2) (118.5) (4.5) (4.2) (21.6) (274.5)
Cost of Service by Function 458.0 1,098.7 543.1 484.3 104.9 3.3 2,692.3
A- 1 Intersegment revenues' (125.0) Total Revenue Requirement' 2,561.8
Schedule to cross reference C6 c 2 c 1 c 3 c 4 c 5 c 7 Notes: 1. Power Smart and Energy Management costs are discussed in Chapter 8 "Power Smart, Customer Care and Energy Management" but are included together with Energy Supply costs as discussed in Chapter 4. 2. The Generation (Heritage Contract) component of the domestic cost of energy does not equal the cost of energy component of the Heritage Payment Obligation for reasons explained in the notes to schedule D1-2. 3. Relates to Generation Related Transmission Asset charges from BC Hydro Transmission to BC Hydro Generation and to Substation Distribution Asset Management charges from BC Hydro Transmission to BC Hydro Distribution. 4. Relates to external transmission wheeling revenues which are not deducted in determining the Transmission Cost of Service 5. See Chapter 2 Section 3.3 for details. 6. Small differences from Chapter 1 Table 3 relate to rounding differences. 7. Domestic cost of energy for Transmission is from cost of market for transmission (see schedule C3) 8. Domestic cost of energy for Electricity Distribution & NIA is from Domestic Cost of Energy - Non-Integrated Areas (see line 1, schedule C4)
A-8 Transmission 3rd party wheeling revenues4 (5.5)
Shaded amounts indicate changes to the test years from the Revised Evidentiary Update.
BC Hydro 2004105 and 2005106 Revenue Requirement Application - 23 -
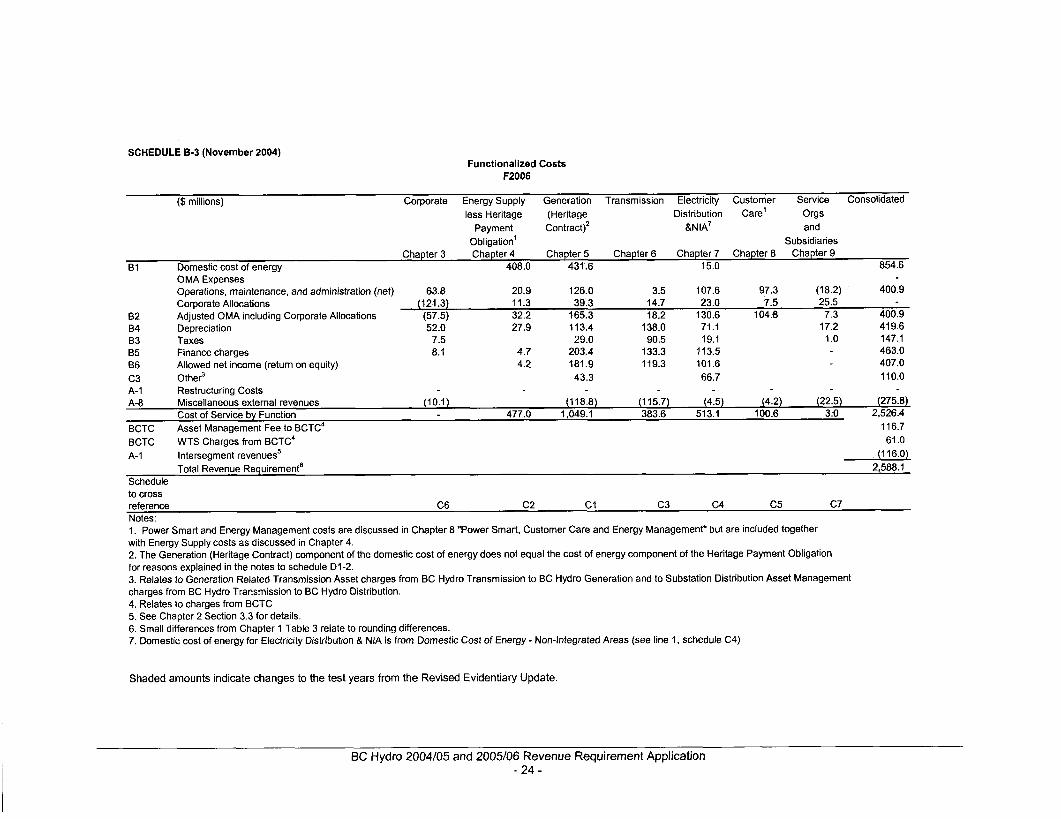
SCHEDULE 8-3 (November 2004) Functionalired Costs
F2006
($ millions) Corporate Energy Supply Generation Transmission Electricity Customer Service Consolidated less Heritage (Heritage Distribution Care' Orgs
Payment Contract)' &NIA' and Subsidiaries Oblioation' -
Chapter 3 Chapter 4 Chapter 5 Chapter 6 Chapter 7 Chapter 8 Chapter 9 B1 Domestic cost of enerav 408.0 431.6 15.0 854.6 -_
OMA Expenses Operations, maintenance, and administration (net) 63.8 20.9 126.0 3.5 107.6 97.3 (18.2) 400.9 Corporate Allocations (121.3) 11.3 39.3 14.7 23.0 7.5 25.5
82 Adjusted OMA including Corporate Allocations (57.5) 32.2 165.3 18.2 130.6 104.8 7.3 400.9 84 Depreciation 52.0 27.9 113.4 138.0 71.1 17.2 419.6 83 Taxes 7.5 29.0 90.5 19.1 1 .o 147.1 85 Finance charges 8.1 4.7 203.4 133.3 113.5 463.0 B6 Allowed net income (return on equity) 4.2 181.9 119.3 101.6 407.0
A-1 Restructuring Costs A-8 Miscellaneous external revenues (10.1) (118.8) (115.7) (4.5) (4.2) (22.5) (275.8)
Cost of Service by Function 477.0 1,049.1 383.6 513.1 100.6 3.0 2,526.4 BCTC Asset Management Fee to BCTC4 116.7 BCTC WTS Charges from BCTC4 61 .O A- 1 Intersegment revenues5 (1 16.0)
Total Revenue Requirement' 2,588.1
c 3 Other3 43.3 66.7 110.0
Schedule to cross
Notes: 1. Power Smart and Energy Management costs are discussed in Chapter 8 "Power Smart, Customer Care and Energy Management" but are included together with Energy Supply costs as discussed in Chapter 4. 2. The Generation (Heritage Contract) component of the domestic cost of energy does not equal the cost of energy component of the Heritage Payment Obligation for reasons explained in the notes to schedule D1-2. 3. Relates to Generation Related Transmission Asset charges from BC Hydro Transmission to BC Hydro Generation and to Substation Distribution Asset Management charges from BC Hydro Transmission to BC Hydro Distribution. 4. Relates to charges from BCTC 5. See Chapter 2 Section 3.3 for details. 6. Small differences from Chapter 1 Table 3 relate to rounding differences. 7. Domestic cost of energyfor Electricity Distribution & NIA is from Domestic Cost of Energy - Non-Integrated Areas (see line 1, schedule C4)
reference C6 c 2 c 1 c 3 c 4 c 5 c 7
Shaded amounts indicate changes to the test years from the Revised Evidentiary Update.
BC Hydro 2004105 and 2005106 Revenue Requirement Application - 24 -
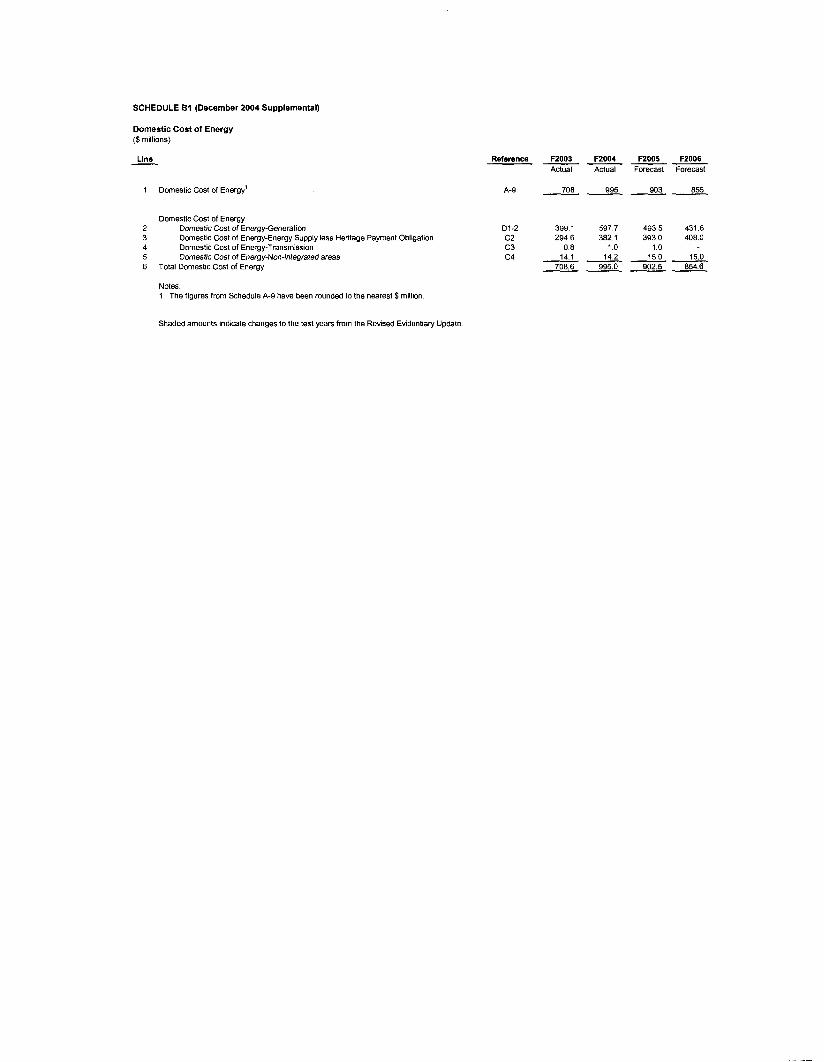
SCHEDULE E1 (December 2004 Supplemental)
Domestic Cost of Energy ($millions)
Line -
1 Domestic Cost of Energy’
Domestic Cost of Energy 2 Domestic Cost of Energy-Generation 3
5 6
Domestic Cost of Energy-Energy Supply less Heritage Payment Obligation 4 Domestic Cost of Energy-Transmission
Domestic Cost of Energy-Non-integrated areas Total Domestic Cost of Energy
Notes: 1 The figures from Schedule A-9 have been rounded to the nearest $ million
Reference FZ003 FZ004 FZ005 F2006 ----- Actual Actual Forecast Forecast
708 995 903 855 A-9 - - - -
Dl-2 399 1 5977 4935 431 6 c 2 2946 382 1 3930 4080 c 3 0 8 1 0 1 0
14 1 142 150 150 7086 9950 9025 8546
c 4 ---- ----
Shaded amounts indicate changes to the test years from the Revised Evidentiary Update
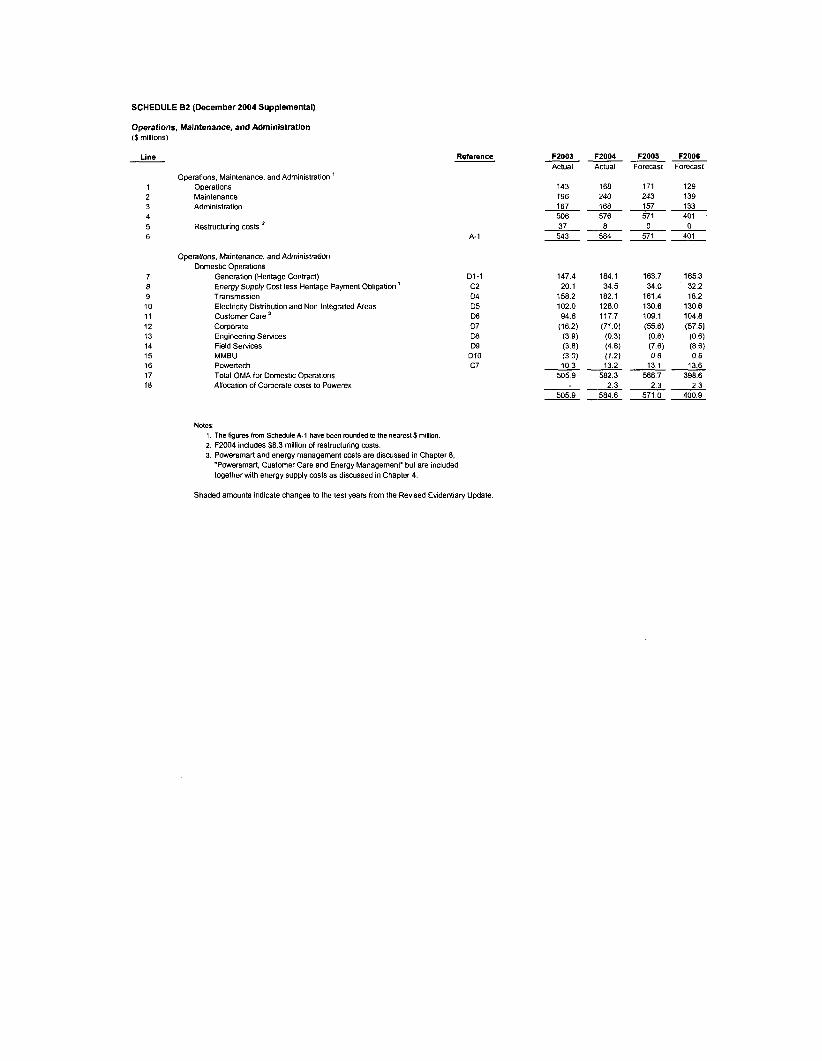
SCHEDULE 8 2 (December 2004 Supplemental)
Operations, Malntenance, and Administratlon (5 millions)
Line
1 2 3 4 5 6
7 8 9 10 11 12 13 14 15 16 17 18
Operations, Maintenance, and Administration ' Operations Maintenance Administration
Restructuring costs
Operations. Maintenance. and Administratim Domestic Operations
Generation (Heritage Contract) Energy Supply Cost less Heritage Payment Obligation Transmission Electricity Distribution and Non-Integrated Areas Customer Care Corporate Engineering Services Field Services MMBU Powertech Total OMA for Domestic Operations Allocation of Corporate costs to Powerex
FZ003 F2004 FZ005 W O O 6 Actual Actual Forecast Forecast ---- Reference
A-I
D1-1 c 2 04 D5 D6 D7 D8 D9
D10 c7
Notes 1. The fgures from Schedule A-I have been rounded tu the nearest $ million. 2. F2004 includes $8.3 million of restructuring costs. 3. Powersmart and energy management costs are discussed in Chapter 8.
"Powersmart. Customer Care and Energy Management' but are included tcgether with energy supply costs as discussed in Chapter 4.
Shaded amcunts indicate changes to the test years from the Revised Evidentiary Update.
143 168 171 129 243 139 196 240
167 168 157 133 506 576 571 401 37 8 0 0 543 584 57 1 401
---- ---- ----
147.4 20.1
158.2 102.0 94.8
(16.2) (3 9) (3.8) (3 01
184.1 34.5
182 1 128.0 1177 (71 0)
(4.8) (1.21
(0.3)
163.7 34.0
181.4 130.6 109 1 (55.6) (0.6) (7.6) 0 6
165 3 32 2 18 2
130 6 104 8 (57 5) (0 6) (8 6) 0 6 . .
10.3 13.2 13.1 13.6 505 9 582.3 566.7 398.6 ----
2.3 2 3 2 3 505.9 5846 571 0 4009 ---- ----
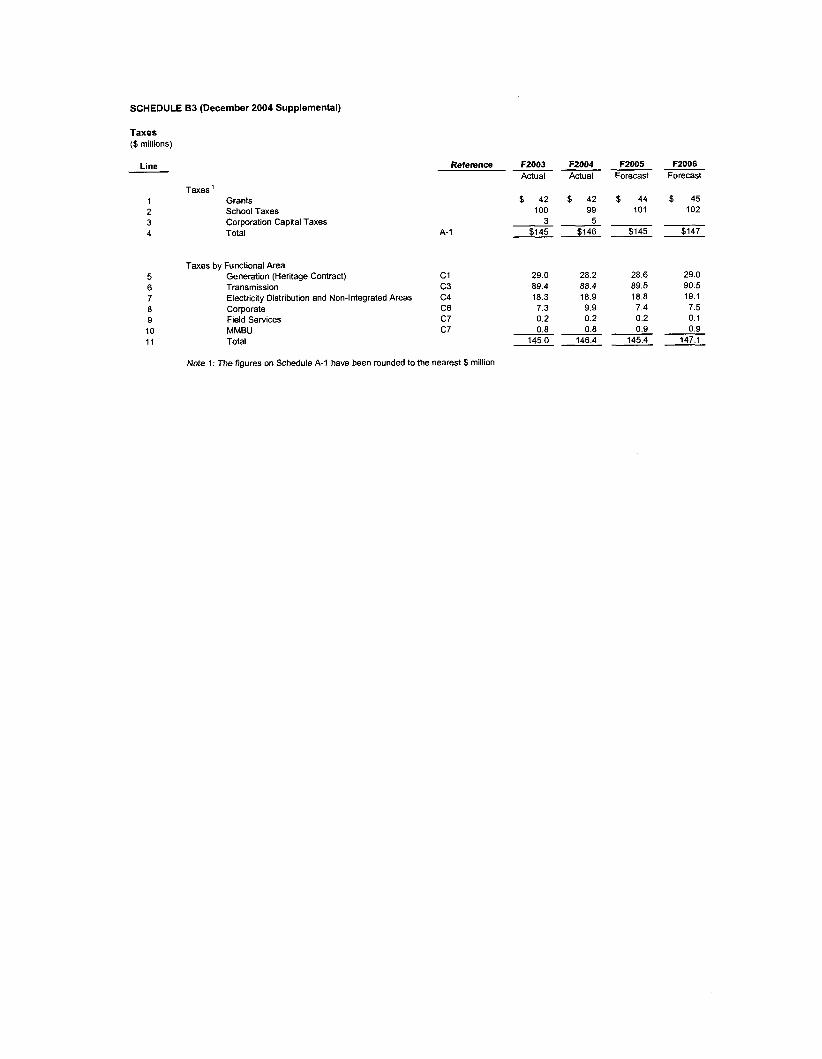
SCHEDULE B3 (December 2004 Supplemental)
Taxes ($ millions)
Line
Taxes ’ Grants School Taxes Corporation Capital Taxes Total
Reference F2003 F2004 F2005 F2006 Actual Actual Forecast Forecast
$ 42 $ 42 $ 44 $ 45 100 99 101 102
A-I
Taxes by Functional Area Generation (Heritage Contract) c 1 Transmission c 3 Electricity Distribution and Non-Integrated Areas C4 Corporate C6 Field Services c 7 MMBU c 7 Total
Note 1: The figures on Schedule A-I have been rounded to the nearest $ million
3 5 - _ _ _ _ _ _ - $145 $146 $145 $147 -____--
29.0 28.2 28.6 29.0 89.4 88.4 89.5 90.5 18.3 18.9 18.8 19.1 7.3 9.9 7.4 7.5 0.2 0.2 0.2 0.1 0.8 0.8 0.9 0.9
145.0 146.4 145.4 147.1 ---- ----
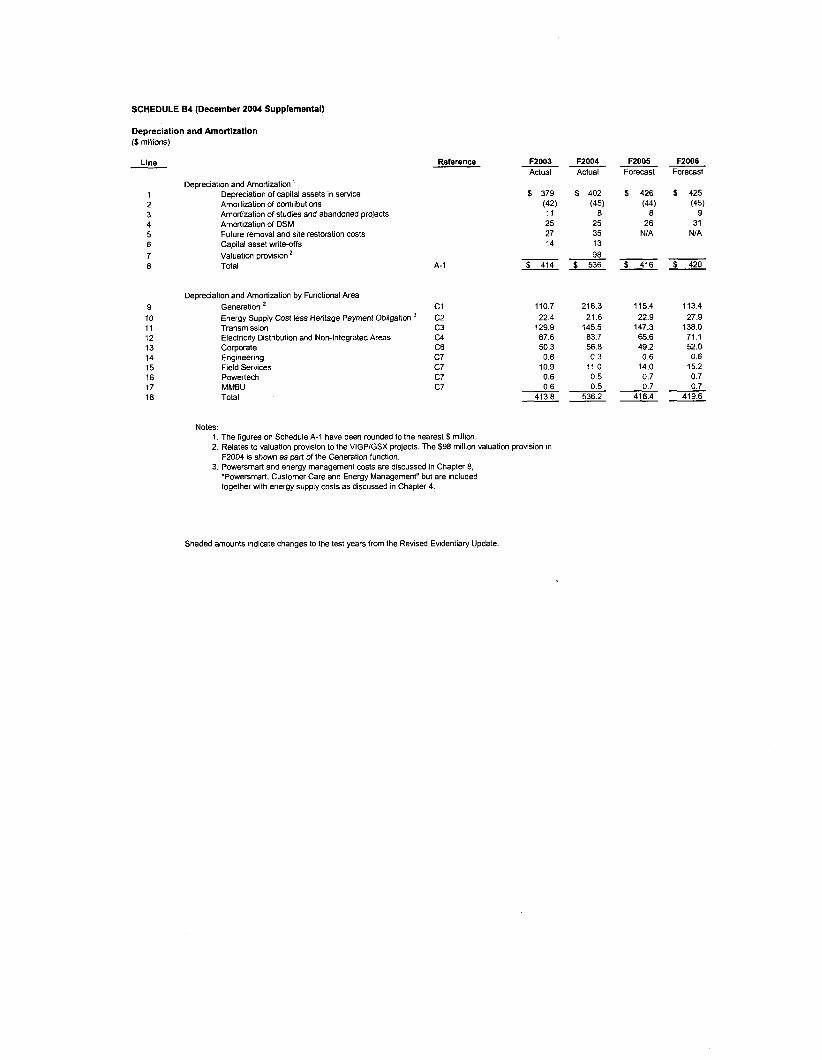
SCHEDULE 84 (December 2004 Supplemental)
DeDreciation and Amortization ($ millions)
Llne
1 2 3 4 5 6 7 8
9 10 11 12 13 14 15 16 17 18
Depreciation and Amortization ' Depreciation of capital assets in seMce Amortization of contributions Amortization of studies and abandoned projects Amortization of DSM Future removal and site restoration costs Capital asset wnte-offs Valuation provision ' Total
Depreciation and Amortization by Functional Area Generation * Energy Supply Cost less Hentage Payment Obligation Transmission Electricity Distribution and Non-lntegrated Areas Corporate Engineering Field Services Powertech MMBU Total
Reference
A-I
c1 c2 c 3 c 4 C6 c7 c 7 c7 c 7
FZ003 FZ004 FZ005 Actual Actual Forecast
$ 379 $ 402 $ 426
11 8 8 25 25 26 27 35 NIA 14 13
98
---
(42) (45) (44)
--- $ 414 $ 536 $ 416
110.7 22.4
129.9 87.6 50.3 0.8
10.9 0.6 0.6
413.8
Notes: 1 , The figures on Schedule A-I have been rounded to the nearest $ million. 2. Relates to valuation provision to the VIGP/GSX projects. The $98 million valuation provision in
3. Powersmart and energy management costs are discussed in Chapter 8, F2004 is shown as part of the Generaiion function.
"Powersmart, Customer Care and Energy Management" but are included together with energy supply costs as discussed in Chapter 4.
216.3 21.6
145.5 83.7
0.3 11.0 0.5 0.5
536.2
56.8
115.4 22.9
147.3 65.6 49.2 0.6
14.0 0.7 0.7
416.4
FZOOb Forecast
$ 425
9 31
NIA
(45)
$ 420
113.4 27.9
138.0 71.1 52.0 0.6
15.2 0.7 0.7
419.6
Shaded amounts indicate changes to the test years from the Revised Evidentiary Update.
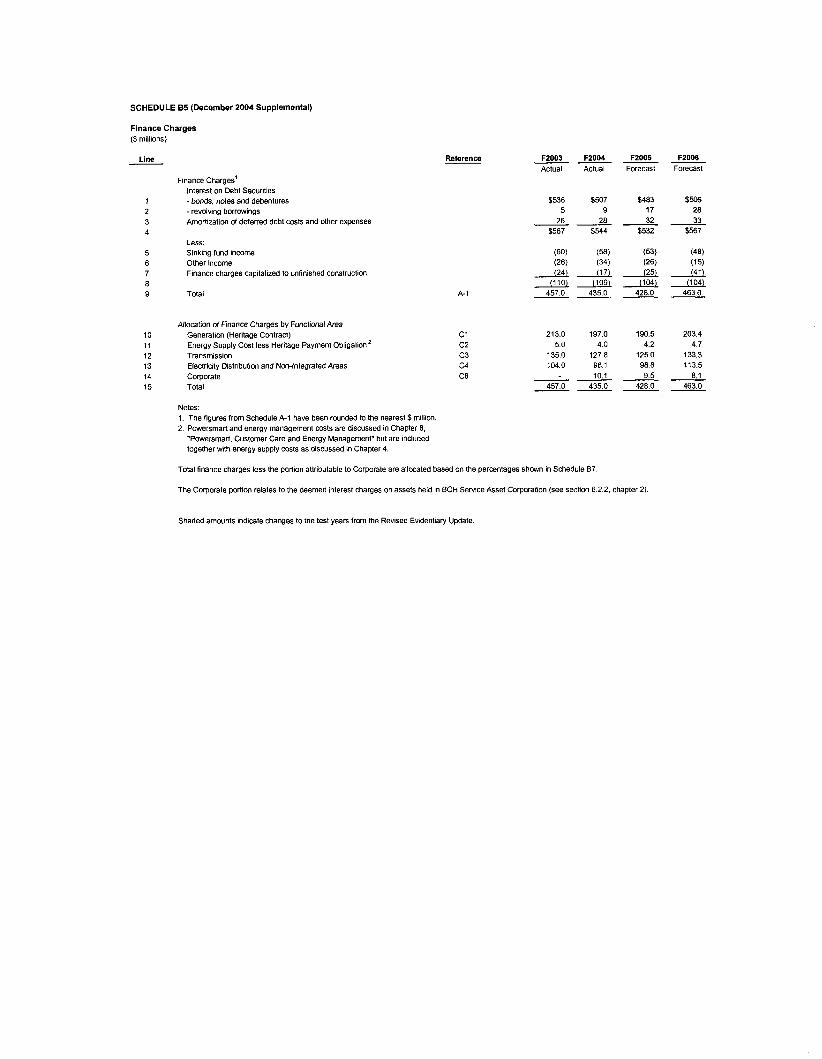
SCHEDULE 8 5 (December 2004 Supplemental)
Finance Charges ($ millions)
line
1 2 3 4
5 6 7 8 9
10 1 1 12 13 14 15
Reference
Finance Charges' Interest on Cebt Securities - bonds. notes and debentures - revolving borrowings Amortization of deferred debt costs and other expenses
Less: Sinking fund income Other income Finance charges capitalized lo unfinished mstruction
Total
Allocation of Finance Charges by Functional Area Generation (Heritage Contract) Energy supply cost less Heritage Payment ObliQation' Transmission Electricity Distribution and Nowlntegrated Areas Corpwate Total
Notes' 1. The figures from Schedule A-1 have been rounded to the nearest $ million. 2. Powersmart and energy management costs are discussed in Chapter 8.
"Powersmart. Customer Care and Energy Management" but are included together with energy supply costs as discussed in Chapter 4.
A-1
c1 c2 c3 c4 C6
FZ003 F2004 F 2 0 5 Actual Actual Forecast ---
(17) (24) (25)
4570 435.0 428.0 (110) (109) (104L ---
2130 1970 1905 50 40 42
1350 1278 1250 1040 961 96 8
10 1 9 5 4570 4350 4260 --- ---
Total finance charges less the poltion attributable to Corporate are allocated based on the percentages shown in Schedule 87
The Corporate portion relates to the deemed interest charges on assets held in BCH Service Asset Corporation (see section 6 2 2, chapter2)
FZOMI Forecast
$506 28 33
$567
(48) (15) 0
(1 04L 463 0
203.4 4.7
133.3 113.5 8.1
463.0
Shaded amwnts indicate changes to the test years from the Revised Evidentiary Update
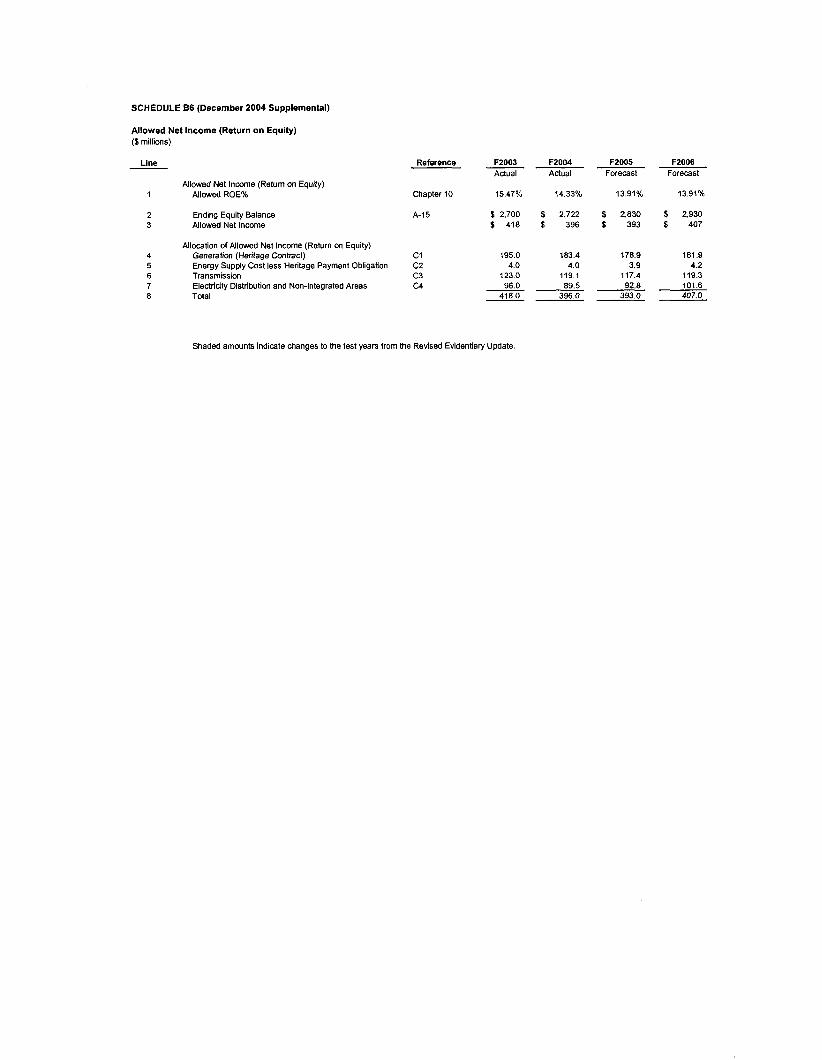
SCHEDULE B6 (December 2004 Supplemental)
Allowed Net Income (Return o n Equity) ($ millions)
Line
Allowed Net Income (Return on Equity) 1 Allowed ROE%
2 Ending Equity Balance 3 Allowed Net Income
Allocation of Allowed Net Income (Return on Equity) 4 5 6 Transmission 7 8 Total
Genera tion (Heritage Con tract) Energy Supply Cost less Heritage Payment Obligation
Electricity Distribution and Non-Integrated Areas
F2003 Reference Actual
Chapter 10 15.47%
A-I5 $ 2,700 $ 418
c1 195.0 c2 4.0 c3 123.0 GI 96.0
418.0
F2004 Actual
14.33%
$ 2,722 $ 396
183.4 4.0
119.1 89.5
396.0
F2005 Forecast
13.91%
$ 2,830 $ 393
178.9 3.9
117.4 92.8
393.0
F2006 Forecast
13.91%
f 2,930 $ 407
181.9 4.2
119.3 101.6 407.0
Shaded amounts indicate changes to the test years from the Revised Evidentiary Update.
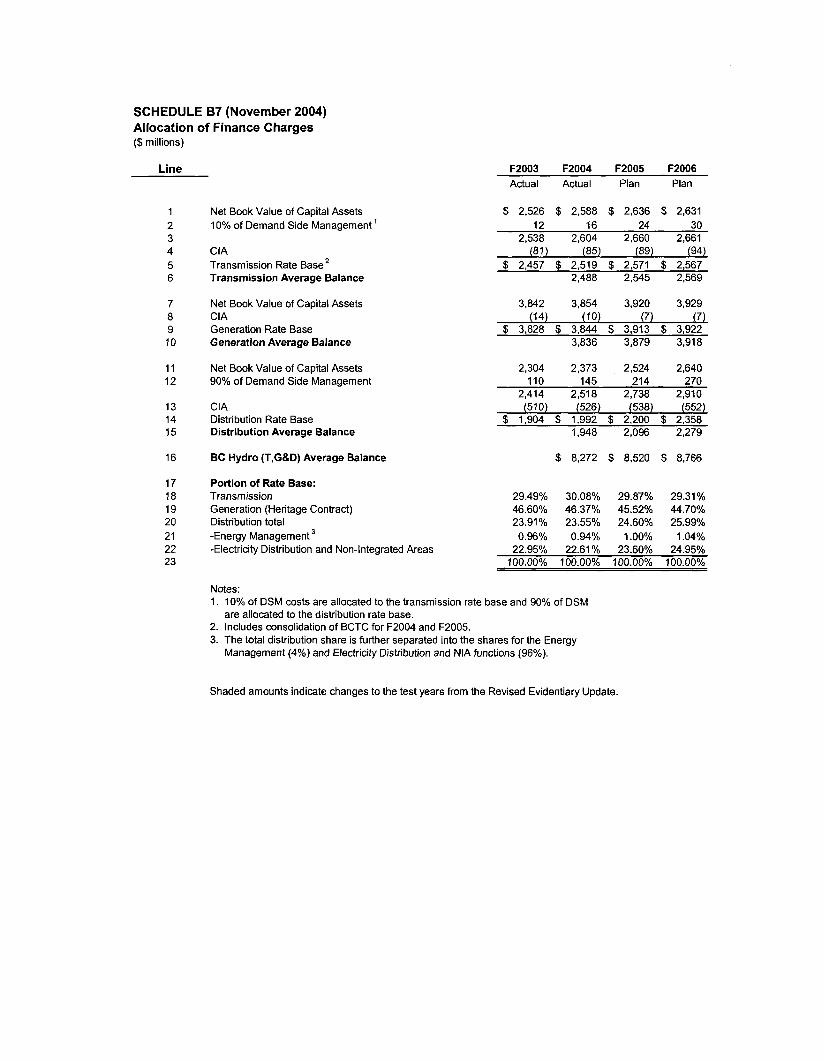
SCHEDULE 67 (November 2004) Allocation of Finance Charges ($ millions)
Line
1 2 3 4 5 6
7
9 10
11 12
13 14 15
16
17
19 20 21 22 23
a
18
F2003 F2004 F2005 F2006 Actual Actual Plan Plan
Net Book Value of Capital Assets $ 2,526 $ 2,588 $ 2,636 $ 2,631
2.538 2.604 2.ci60 2.661 10% of Demand Side Management ' 12 16 24 30
CIA Transmission Rate Base' Transmission Average Balance
(81) (85) (89) (94)
2,488 2,545 2,569 $ 2,457 $ 2,519 $ 2,571 $ 2,567
Net Book Value of Capital Assets 3,842 3,854 3,920 3,929 CIA Generation Rate Base Generation Average Balance
(14) ( I O ) (7) (7) $ 3,828 $ 3,844 $ 3,913 $ 3,922
3,836 3,879 3,918
Net Book Value of Capital Assets 2.304 2.373 2.524 2.640 90% of Demand Side Management 110 145 214 270
2,414 2,518 2,738 2,910 CIA Distribution Rate Base Distribution Average Balance
(510) (526) (538) (552) 1,904 $ 1,992 $ 2,200 2,358
1,948 2,096 2,279
BC Hydro (T,G&D) Average Balance $ 8,272 $ 8,520 $ 8,766
Portion of Rate Base: Transmission Generation (Heritage Contract) Distribution total -Energy Management -Electricity Distribution and Non-Integrated Areas
29.49% 30.08% 29.87% 29.31% 46.60% 46.37% 45.52% 44.70% 23.91% 23.55% 24.60% 25.99% 0.96% 0.94% 1.00% 1.04%
22.95% 22.61 Yo 23.60% 24.95% 100.00% 100.00% 100.00% 100.00%
Notes: 1. 10% of DSM costs are allocated to the transmission rate base and 90% of DSM
are allocated to the distribution rate base. 2. Includes consolidation of BCTC for F2004 and F2005. 3. The total distribution share is further separated into the shares for the Energy
Management (4%) and Electricity Distribution and NIA functions (96%).
Shaded amounts indicate changes to the test years from the Revised Evidentiary Update.
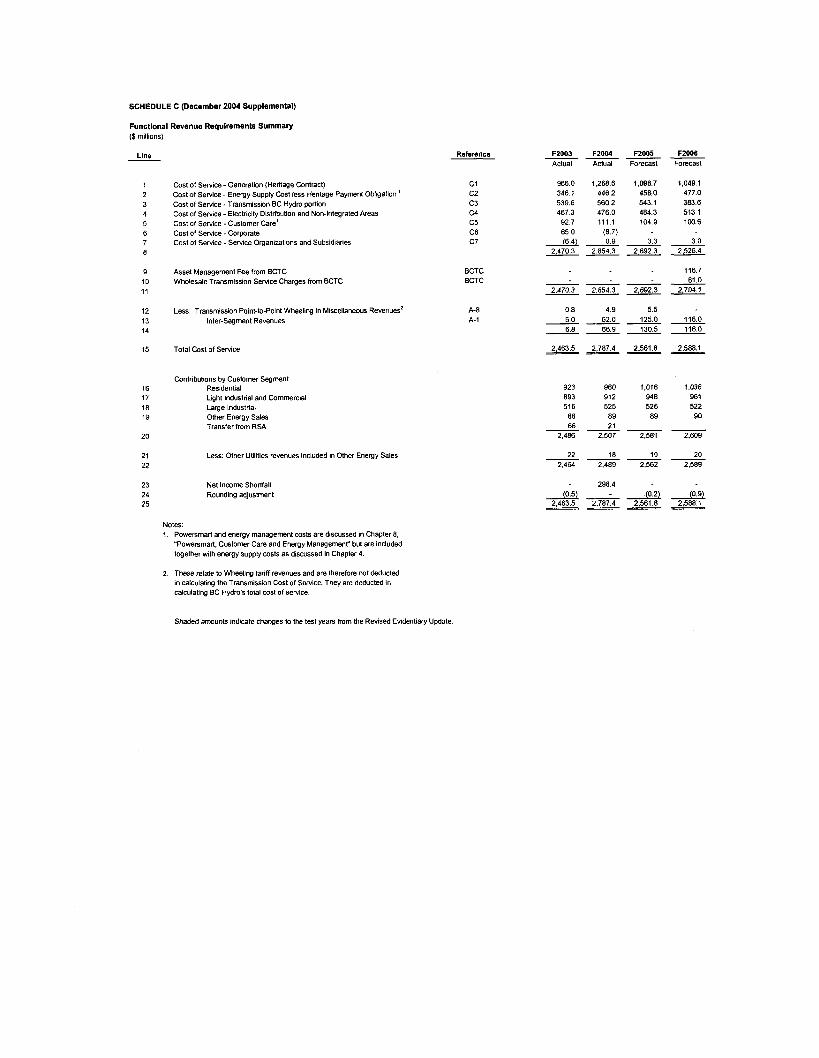
SCHEDULE C (December 2004 Supplemental)
Functional Revenue Requirements Summaty ($millions)
Line
1 2 3 4 5 6 7 8
9 10 11
12 13 14
15
16 17 18 19
20
21 22
23 24 25
Cost of Service - Generation (Heritage Contract) Cost of Service - Energy Supply Cost less Henlage Payment Obligatbn ' Cost of Service - Transmission BC Hydro portion Cost of Service - Electricity Distribution and Non-Integrated Areas cost of Service -Customer Care' Cost of Swvice - Cormrate Cost of Service - Service Organizations and Subsidiaries
Asset Management Fee from BCTC Wholesale Transmission Service Charges from BCTC
Less: Transmisson Point-to-Point Wheeling in Miscellaneous Revenues' inter-Segment Revenues
Total Cost of Service
Contnbumns by Customer Segment Residential Light industrial and Commercial Large Industrial Other Energy Sales Transfer from RSA
Less: Other Ublities revenues included in Other Energy Sales
Net Income Shorifall Rounding adjustment
Notes: 1. Powersmart and energy management costs are discussed in Chapter 8.
"Powersmart. Customer Care and Energy Management" but are included together with energy supply costs as discussed in Chapter 4.
2. These relate to Wheeilng tariff revenues and are therefore ~t deducted in calculating the Transmission Cost of Service. They are deducted in calculating BC Hydro's total cost of service.
Reference
c1 c 2 c3 c4 c5 C6 c7
BCTC BCTC
A-8 A-I
F2003 F2004 R O O 5 Actual Actual Forecast ---
966 0 346 1 539 6 467 3 92 7 650
2,470 3 0
1.2686 1.0987 4462 45RO 5602 543 1 4760 4843 111 1 1049
(8 7) 0 9 33
2,854 3 2,692 3 --
--- 2.470 3 2,854 3 2,682 3
0 8 4 9 5 5 6 0 620 1250 6 8 669 1305
2.4635 2,787 4 2.561 8
--- --- ---
923 960 1,018 893 912 948 516 525 526 88 89 89 66 21 ---
2.4% 2.507 2,581
22 18 19 2.464 2.489 2.562 ---
- 2984 (05) - (0.21
2,463.5 2.787.4 2,561.8 ---
F2006 Forecast
1.049 1 477 0 383 6 513 1 100 6
3 0 2,526 4
1167 61 0
2,704 1
116.0 116.0
1,036 961 522 90
2.609
20 2,589
(0.9l 2,588 1 v
Shaded amounts indicate changes to the test years from the Revised Evidentiary Update.
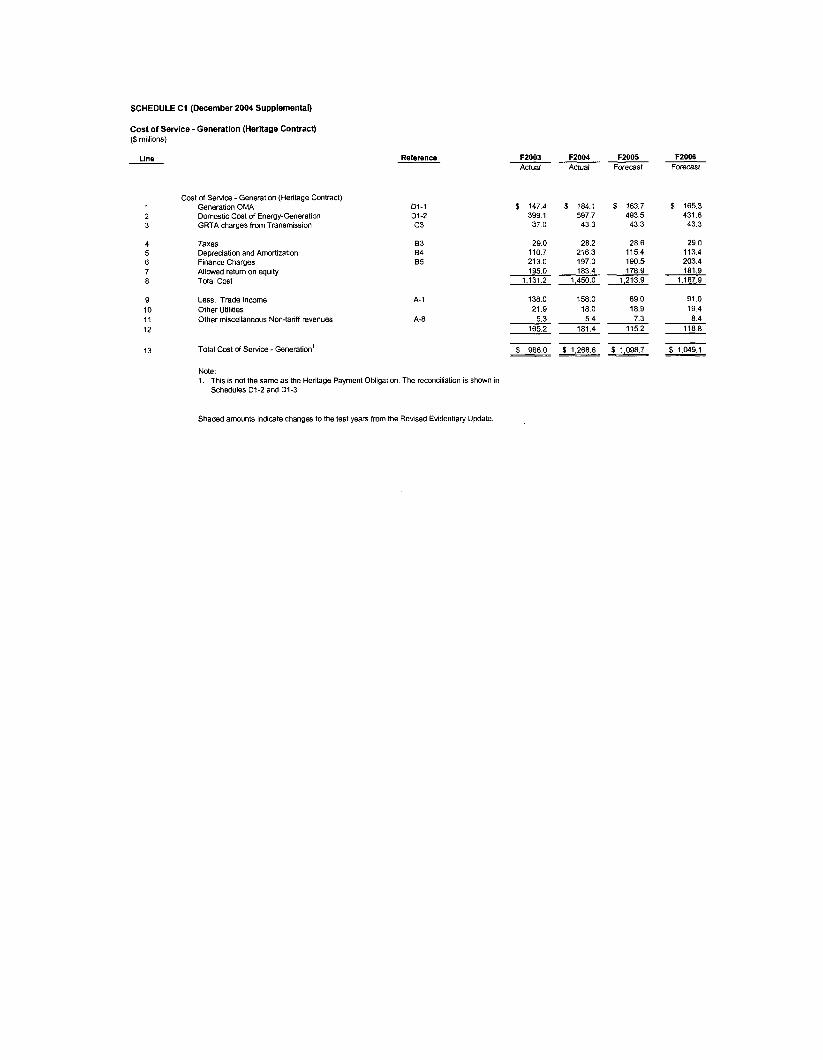
SCHEDULE C1 (December 2004 Supplemental)
Cost of Service - Generation (Heritage Contract) (I millions)
Une
Cost of Service -Generation (Heritage Contract) 1 Generation OMA 2 Domestic Cost of Energy-Generation 3 GRTA charges from Transmission
4 Taxes 5 Depreciation and Amortizabon 6 Finance Charges 7 Allowed return on equity 8 Total Cost
9 Less: Trade Income 10 Other Utilities 11 Other miscellaneous Non-tariff revenues 12
13 Total Cost of Service - Generation’
Reference
D1-1 D1-2 c 3
83 84 B5
A- 1
A-8
Note: 1. This is not the same as the Heritage Payment Obligation. The reconciliation is shown in
Schedules D1-2 and D1-3.
F2003 F2004 F2005 Actual Actual Forecast - ~ -
$ 1474 5 1841 399 1 597 7 37 0 43 3
29 0 28 2 1107 2163 213 0 197 0 1950 1834
1,131 2 1,4500
138 0 158 0 21 9 18 0
5 3 5 4 165 2 161 4
-~
~~ -~
5 1637 493 5 43 3
28 6 1154 190 5 178 9
1.2139
89 0 18 9 7 3
1152
- ~ - PPP $ 966.0 $ 1,268.6 $ 1.098.7
F20W Forecast
$ 165.3 431.6 43 3
29 0 113.4 203 4 181 9
1.167 9
91 0 19 4 8.4
1188
$1,0491 -
Shaded amounts indicate changes to the test years from the Revlsed Evidentiary Update
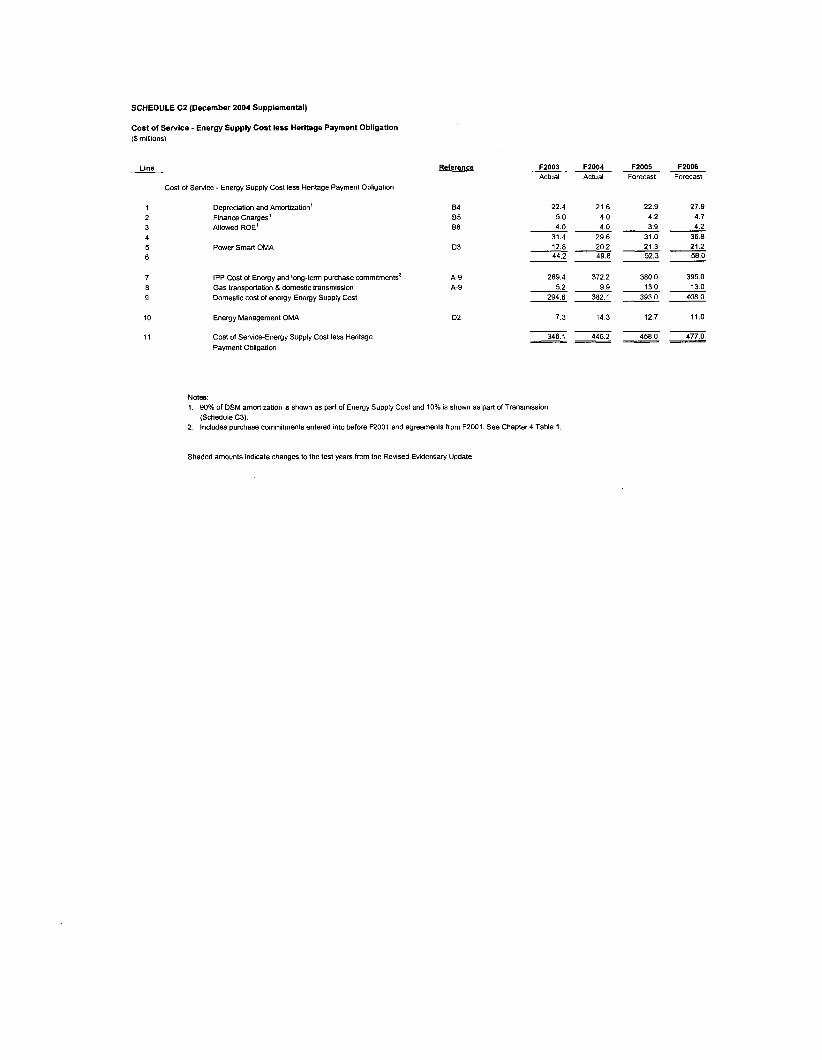
SCHEDULE C2 (December 2004 Supplemental)
Cost of Service - Energy Supply Cost less Heritage Payment Obllgation ($millions)
Line
Cost of Service - Energy Supply Cost less Heritage Payment Obligatwn
1 Depreciation and Amortization’ 2 Fmance Charges‘ 3 ~ i o w e d ROE’ 4 5 Power Smart OMA 6
7
9
10 Energy Management OMA
11
IPP Cost of Energy and long-term purchase commitments’
Domestic cost of energy-Energy Supply Cost 8 Gas transpwtation &domestic transmissim
Cost of Service-Energy Supply Cost less Heritage Payment Obligation
Reference
B4 B5 B6
03
A-9 A-9
D2
FZ003 FZ004 F2005 Actual Actual Forecast ---
22 4 21 6 22 9 5 0 4 0 4 2 4 0 4 0 3 9
31 4 29 6 31 0 ---
12.6 20 2 21.3 44.2 49.6 52.3 --- ---
2694 3722 380.0 5.2 9.9 13.0
294.6 382.1 393.0 --- ---
7.3 14 3 12 7
346.1 4462 458 0 --- ---
Notes: 1. 90% of DSM amortization IS shown as part of Energy Supply Cost and 10% IS shown as part of Transmission
(Schedule C3). 2 Includes purchase commitments entered into before e001 and agreements from F2001. See Chapter 4 Table 1
FZOOE Forecast
27.9 4.7 4.2 36.8 21.2 58.0
395 0 13 0
408 0
11.0
477.0 P
Shaded amounts indicate changes to the test years from the Revised Evidentiary Update
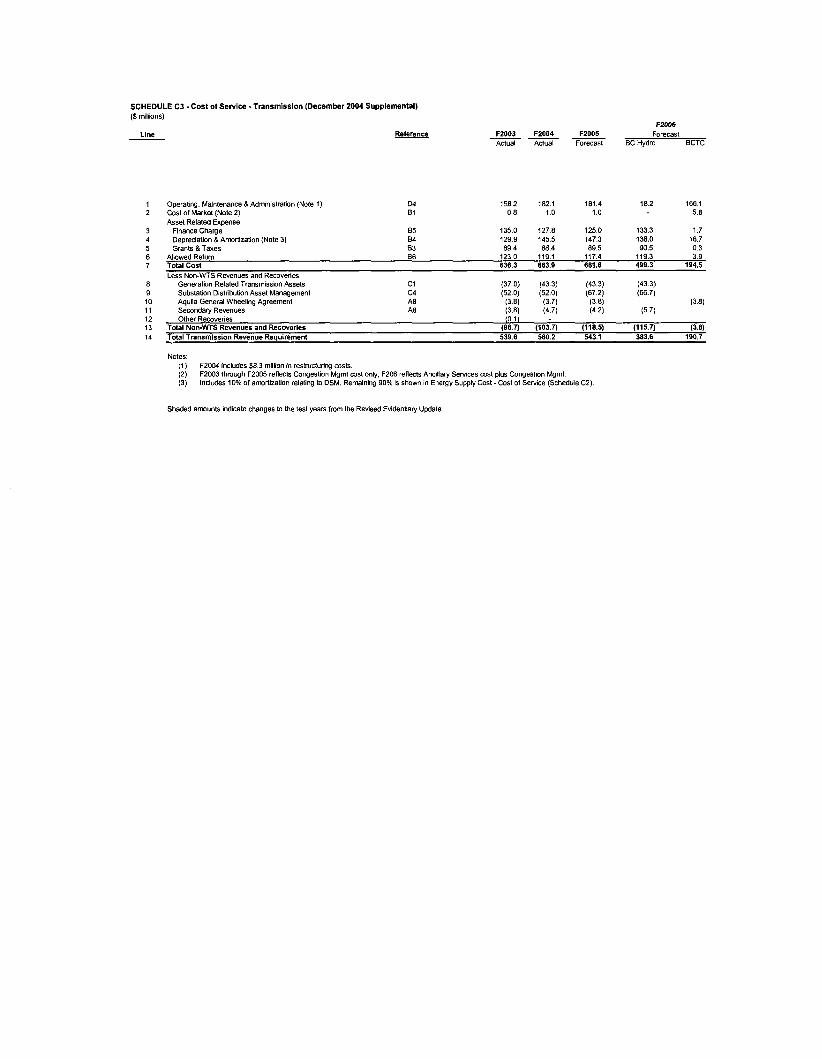
SCHEDULE C3 -Cost of Service - Transmlssion (December 2004 Supplemental) ($millions)
Llne
1 2
3 4 5 6 7
8 9 10 11 12 13 14
Operating, Maintenance & Administraian (Note 1) Cost of Market (Note 2) Asset Related Expense
Finance Charge Depreciation &Amortization (Note 3) Grants &Taxes
Reference
D4 81
65 84 83
F 2 W FZ003 FZ004 FZ005 Forecast Actual Actual Forecast BCHydro BCTC -- -
1582 1821 181 4 182 166 1 0 8 1 0 1 0 5 8
1350 1278 1250 133 3 1 7 1299 1455 1473 138 0 16 7 894 884 89 5 90 5 0 3
Allowed Return 66 123.0 119.1 117.4 119.3 3.9 Total Cost 636.3 663.9 661.6 499.3 194.5 Less NowWTS Revenues and Recoveries
Generation Related Transmission Assets c1 (37.0) (43.3) (43.3) (43.3) Substation Distribution Asset Management c4 (52.0) (52.0) (672) (66.7) Aquila General Wheeling Agreement A8 (3.8) (3.7) (3 8) (3.8) Sewndary Revenues A8 (3.8) (4.7) (4 2 ) (5.71 Other Recoveries (011
Total Non-WTS Revenwr and Recoveries (96.7) (103.7) (118.5) (115.7) (3.8) Total Transmission Revenue Requirement 5396 560 2 543 1 383.6 190 7
Notes (1) (2) (3)
F2004 includes $8.3 million in restructuring costs. F2W3 through F2005 reflects Congestion Mgmt wst only, F206 reflects Ancillary Services wst plus Congestion Mgrnt. Includes 10% OF amortization relating to DSM. Remaining 90% is shown in Energy Supply Cost - Cost of Service (Schedule C2)
Shaded amounts indicate changes to the test years from the Revised E~denBary Updale
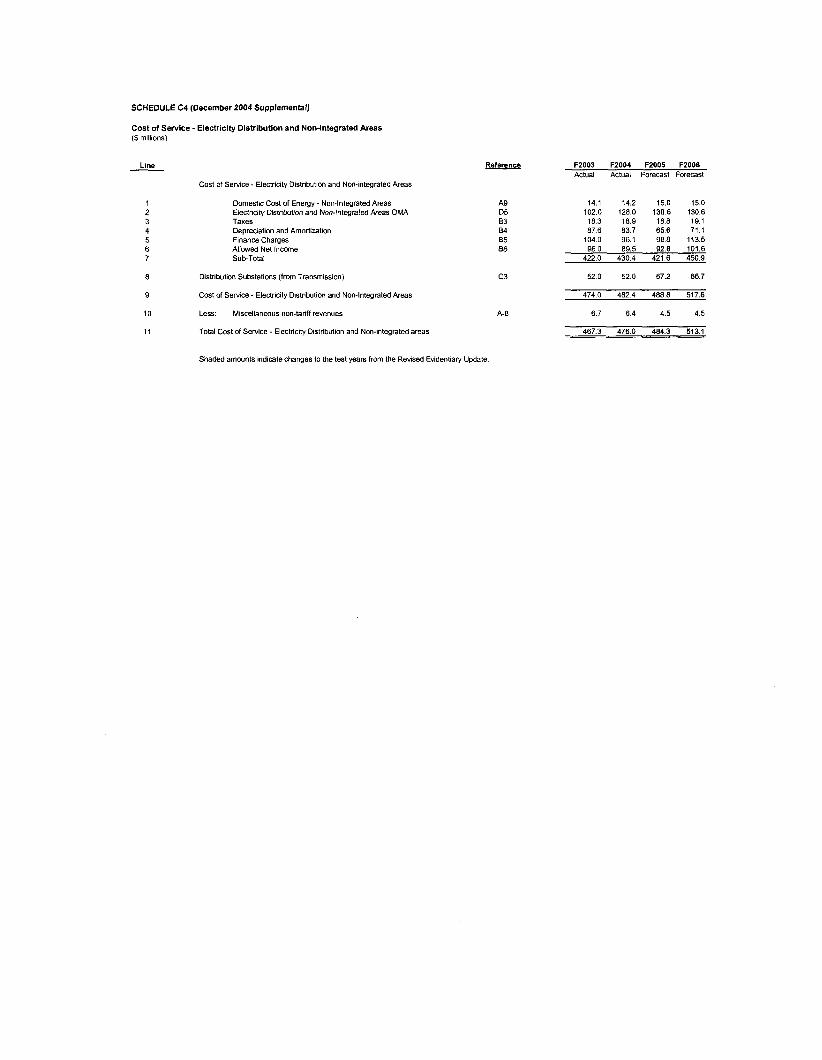
SCHEDULE C4 (December 2004 Supplemental)
Cost of Service - Electricity Dlstrlbution and Non-lntegrated Areas ($millions)
Line
Cost of Service - Electricity Distribution and Non-integrated Areas
Domestic Cost of Energy - Non-Integrated Areas Electricity Distnbution and Non-Integrated Areas OMA Taxes Depreciation and Amortization Finance Charges Allowed Ne1 lnccmne SubTotal
8 Distribution Substations (from Transmission)
9
t o Less Miscellaneous non-tariff revenues
11
Cost of Service. Electricity Distribution and Non-Integrated Areas
Total Cost of Service - Electricity Distnbution and Non-integrated areas
Reference
A9 D5 83 84 B5 86
c 3
A-8
F2003 F2004 F2005 F2006 Actual Actual Forecast Forecast
141 142 150 150 1020 1280 1306 1306 183 189 188 191 876 837 656 71 1
1040 961 988 1135 960 895 928 1016
4220 4304 421 6 4509
520 520 672 667
4740 4824 4888 5176
6 7 6 4 4 5 4 5
467 3 4760 4843 5131
Shaded amounts indicate changes to the test years from the Revised Evidentiary Update.
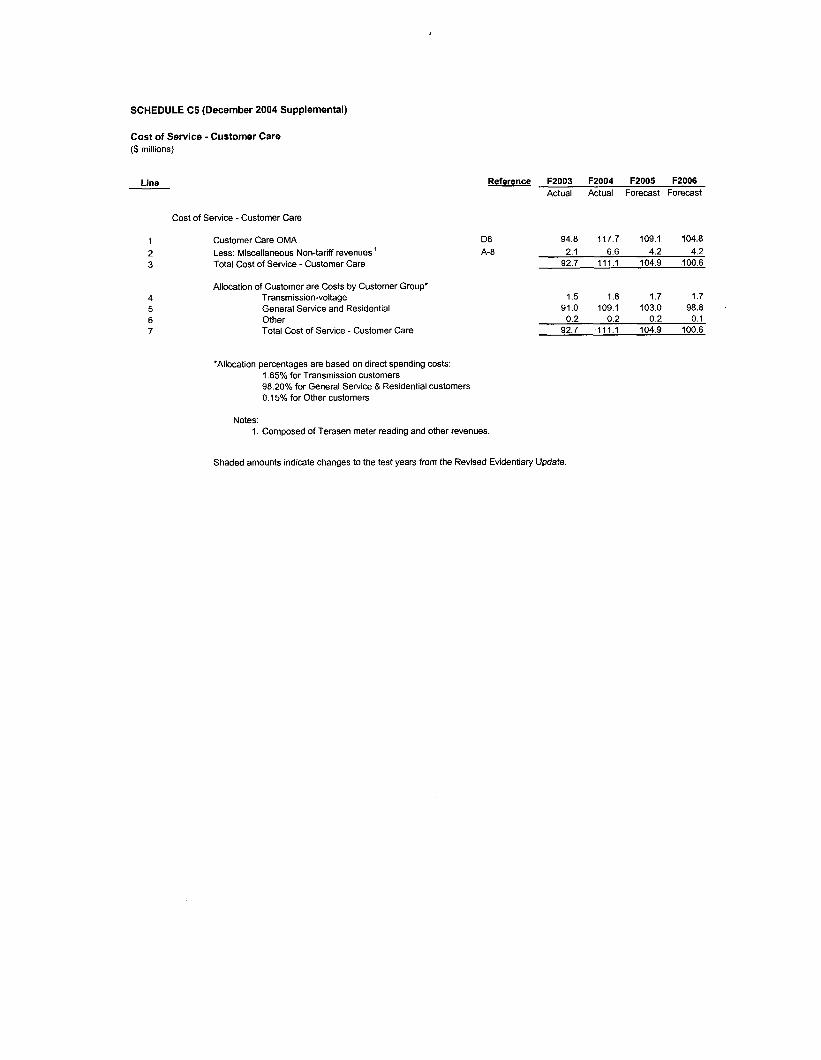
SCHEDULE C5 (December 2004 Supplemental)
Cost of Service - Customer Care ($ millions)
Line
Cost of Service - Customer Care
1 Customer Care OMA 2 3
Less: Miscellaneous Non-tariff revenues ' Total Cost of Service - Customer Care
Allocation of Customer are Costs by Customer Group' 4 Transmission-voltage 5 General Service and Residential 6 Other 7 Total Cost of Service - Customer Care
Reference F2003 F2004 F2005 F2006 Actual Actual Forecast Forecast
*Allocation percentages are based on direct spending costs: 1.65% for Transmission customers 98.20% for General Service & Residential customers 0.15% for Other customers
Notes: 1. Composed of Terasen meter reading and other revenues
D6 94.8 117.7 109.1 104.8 A-8 2.1 6.6 4.2 4.2
92.7 111.1 104.9 100.6
1.5 1.8 1.7 1.7 91.0 109.1 103.0 98.8 0.2 0.2 0.2 0.1
92.7 111.1 104.9 100.6
Shaded amounts indicate changes to the test years from the Revised Evidentiary Update
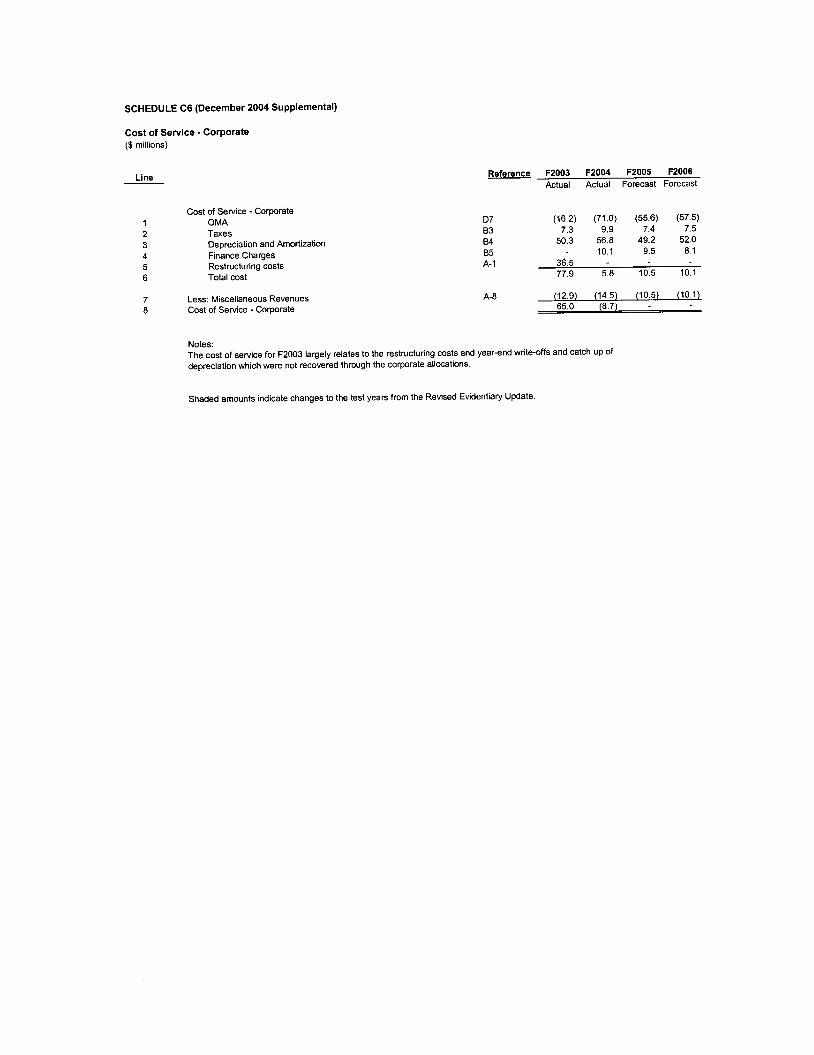
SCHEDULE C6 (December 2004 Supplemental)
Cost of Service - Corporate ($ millions)
Line Reference F2003 F2004 F2005 F2006 Actual Actual Forecast Forecast
Cost of Service - Corporate 1 OMA 2 Taxes 3 Depreciation and Amortization 4 Finance Charges 5 Restructuring costs 6 Total cost
7 Less: Miscellaneous Revenues 8 Cost of Service - Corporate
D7 (16.2) (71.0) (55.6) (57.5)
84 50.3 56.8 49.2 52.0 85 - 10.1 9.5 8.1
77.9 5.8 10.5 10.1
83 7.3 9.9 7.4 7.5
A- 1 36.5
A-8 (12.9) (14.5) (10.5) (10.1) 65.0 (8.7)
Notes: The cost of service for F2003 largely relates to the restructuring costs and year-end write-offs and catch up of depreciation which were not recovered through the corporate allocations.
Shaded amounts indicate changes to the test years from the Revised Evidentiary Update.
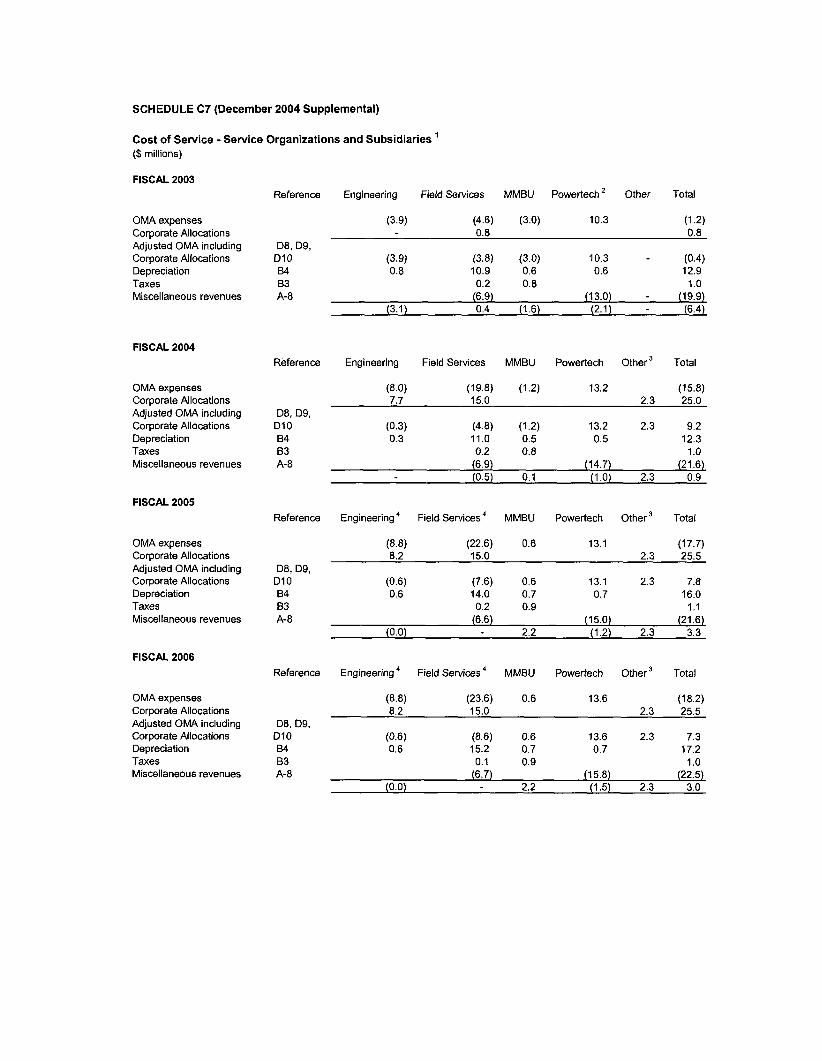
SCHEDULE C7 (December 2004 Supplemental)
Cost of Service - Service Organizations and Subsidiaries ' ($ millions)
FISCAL 2003 Reference Engineering Field Services MMBU Powertech Other Total
OMA expenses Corporate Allocations Adjusted OMA including Corporate Allocations Depreciation Taxes Miscellaneous revenues
FISCAL 2004
OMA expenses Corporate Allocations Adjusted OM4 including Corporate Allocations Depreciation Taxes Miscellaneous revenues
FISCAL 2005
OMA expenses Corporate Allocations Adjusted OMA including Corporate Allocations Depreciation Taxes Miscellaneous revenues
FISCAL 2006
OMA expenses Corporate Allocations Adjusted OMA including Corporate Allocations Depreciation Taxes Miscellaneous revenues
(3.9) (4.6) (3.0) 10.3 (1 4 0.8 0.8
D10 (3.9) (3.8) (3.0) 10.3 (0.4) D8, D9,
84 0.8 10.9 0.6 0.6 12.9 B3 0.2 0.8 1 .o A-8 (6.9) (13.0) (19.9)
(3.1) 0.4 (1.6) (2.1) (6.4)
Reference Engineering Field Services MMBU Powertech Other Total
(8.0) (19.8) (1.2) 13.2 (15.8) 7.7 15.0 2.3 25.0
D8. D9, D10 84 83
(0.3) (4.8) (1.2) 13.2 2.3 9.2 0.3 11.0 0.5 0.5 12.3
0.2 0.8 1 .o A-8 (6.9) (14.7) (21.6)
(0.5) 0.1 (1.0) 2.3 0.9
Reference Engineering Field Services' MMBU Powertech Other Total
(8.8) (22.6) 0.6 13.1 (17.7) 8.2 15.0 2.3 25.5
D8, D9, D10 (0.6) (7.6) 0.6 13.1 2.3 7.8 84 0.6 14.0 0.7 0.7 16.0 83 0.2 0.9 1.1 A-8 (6.6) (15.0) (21.6)
(0.0) 2.2 (1.2) 2.3 3.3
Reference Engineering Field Services MMBU Powertech Other Total
(8.8) (23.6) 0.6 13.6 (18.2) 8.2 15.0 2.3 25.5
D8, D9, D10 e4 B3
(0.6) (8.6) 0.6 13.6 2.3 7.3 0.6 15.2 0.7 0.7 17.2
0.1 0.9 1 .o A-8 (6.7) (15.8) (22.5)
(0.0) 2.2 (1 5) 2.3 3.0
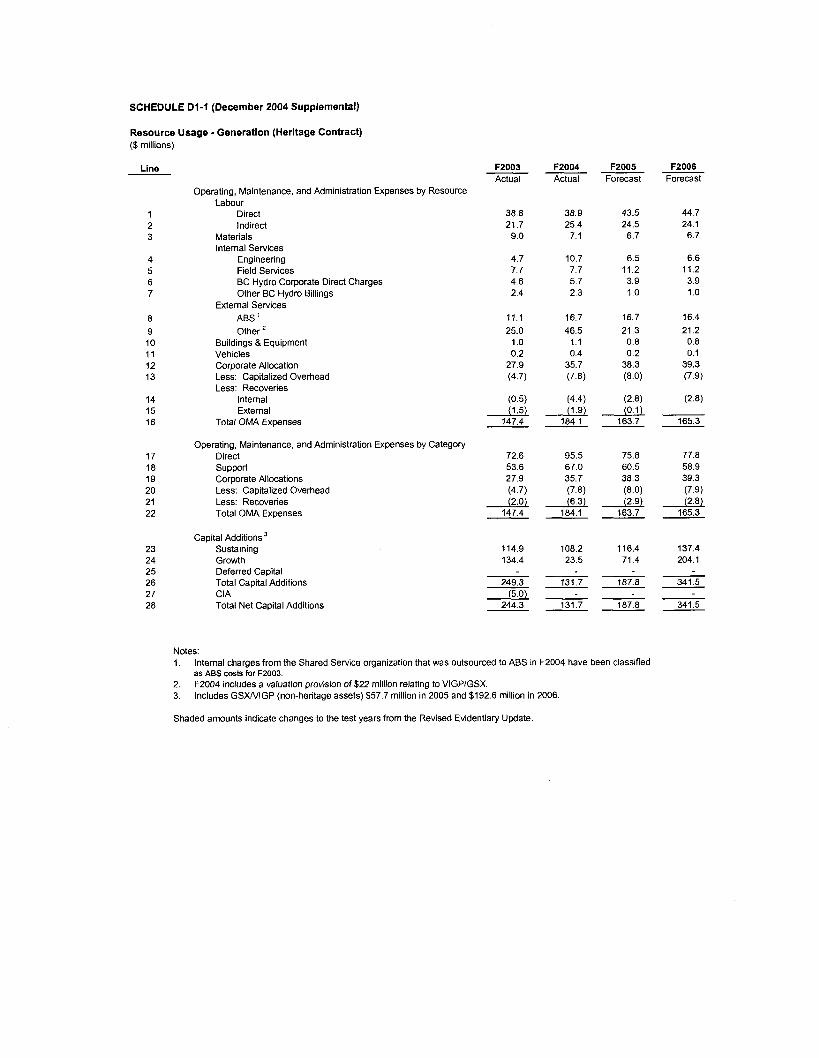
SCHEDULE DI - I (December 2004 Supplemental)
Resource Usage - Generation (Heritage Contract) ($ millions)
Line
1 2 3
4 5 6 7
8 9 10 11 12 13
14 15 16
17 18 19 20 21 22
23 24 25 26 27 28
Operating, Maintenance, and Administration Expenses by Resource Labour
Direct Indirect
Materials Internal Services
Engineering Field Services BC Hydro Corporate Direct Charges Other BC Hydro Billings
External Services ABS ’ Other
Buildings & Equipment Vehicles Corporate Allocation Less: Capitalized Overhead Less: Recoveries
Internal External
Total OMA Expenses
Operating, Maintenance, and Administration Expenses by Category Direct support Corporate Allocations Less: Capitalized Overhead Less: Recoveries Total OMA Expenses
Capital Additions Sustaining Growth Deferred Capital Total Capital Additions CIA Total Net Capital Additions
F2W3 Actual
38.8 21.7 9.0
4.7 7.7 4.6 2.4
11.1 25.0
1 .o 0.2
27.9 (4.7)
(0.5) (1.5)
147.4
72.6 53.6 27.9 (4.7) (2.0)
147.4
114.9 134.4
249.3
244.3 (5.0)
F2004 F2005 Actual Forecast --
38.9 43.5 25.4 24.5
7.1 6.7
10.7 6.5 7.7 11.2 5.7 3.9 2.3 1 .o
16.7 16.7 46.5 21.3
1.1 0.8 0.4 0.2
35.7 38.3 (7.8) (8.0)
14.4) (2.8) i i . g j io . i j
184.1 163.7 --
95.5 75.8 67.0 60.5 35.7 38.3 (7.8) (8.0) (6.3) (2.9)
184.1 163.7 --
108.2 116.4 23.5 71.4
131.7 187.8
131.7 187.8
-- -- -- --
Notes: 1.
2. 3.
Shaded amounts indicate changes to the test years from the Revised Evidentiary Update
Internal charges from the Shared Service organization that was outsourced to ABS in F2004 have been classified as ABS costs for F2003. F2004 includes a valuation provision of $22 million relating to VIGP/GSX. Includes GSXNIGP (non-heritage assets) $57.7 million in 2005 and $192.6 million in 2006.
F2006 Forecast
44.7 24.1 6.7
6.6 11.2 3.9 1.0
16.4 21.2
0.8 0.1
39.3 (7.9)
(2.8)
165.3
77.8 58.9 39.3
(2.8) (7.9)
165.3
137.4 204.1
341.5
341.5
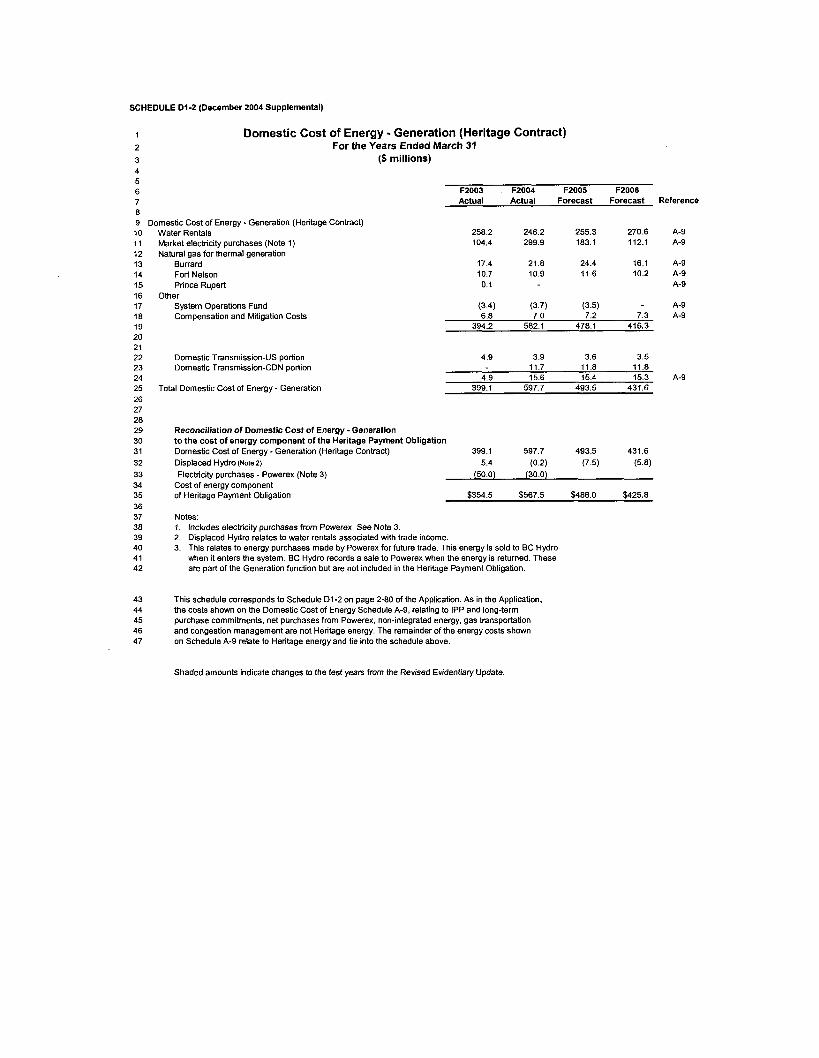
SCHEDULE DI-2 (December 2004 Supplemental)
Domestic Cost of Energy - Generation (Heritage Contract) For the Years Ended March 31
(t millions)
F2003 F2004 F2005 F2006 Actual Actual Forecast Forecast Reference
10 11 12 13 14 15 16 17 18 19 20 21 22 23 24 25 26 27 28 29 30 31 32 33 34 35 36 37 38 39 40 41 42
43 44 45 46 47
8 9 Domestic Cost of Energy - Generation (Heritage Contract)
Water Rentals Market electricity purchases (Note 1) Natural gas for thermal generation
Burrard Fort Nelson Prince Rupert
System Operations Fund Compensation and Mitigation Costs
other
Domestic Transmission-US portion Domestic Transmission-CDN portion
Total Domestic Cost of Energy - Generation
258.2 246.2 255.3 270.6 104.4 299.9 183.1 112.1
17.4 21.8 24.4 16.1 10.7 10.9 11.6 10.2 0.1
(3.4) (3.7) (3.5) 6.8 7.0 7.2 7.3
394.2 582.1 478.1 416.3
4.9 3.9 3.6 3.5 11.7 11.8 11.8
4.9 15.6 15.4 15.3 399.1 597.7 493.5 431.6
Reconciliation of Domestic Cost of Energy - Generation to the cost of energy component of the Heritage Payment Obligation Domestic Cost of Energy - Generation (Heritage Contract) 399.1 597.7 493.5 431.6 Displaced Hydro (Note 2) 5.4 (0.2) (7.5) (5.8) Electricity purchases - Powerex (Note 3)
Cost of energy component of Heritage Payment Obligation
(50.0) (30.0)
$354.5 $567.5 $486.0 $425.8
Notes: 1. Includes electricity purchases from Powerex. See Note 3. 2. Displaced Hydro relates to water rentals associated with trade income. 3. This relates to energy purchases made by Powerex for future trade. This energy is sold to BC Hydro
when it enters the system. BC Hydro records a sale to Powerex when the energy is returned. These are part of the Generation function but are not included in the Heritage Payment Obligation.
This schedule corresponds to Schedule D1-2 on page 2-80 of the Application. As in the Application, the costs shown on the Domestic Cost of Energy Schedule A-9, relating to IPP and long-term purchase commitments, net purchases from Powerex, non-integrated energy, gas transportation and congestion management are not Heritage energy. The remainder of the energy costs shown on Schedule A-9 relate to Heritage energy and tie into the schedule above.
A-9 A-9
A-9 A-9 A-9
A-9 A-9
A-9
Shaded amounts indicate changes to the test years from the Revised Evidentiary Update
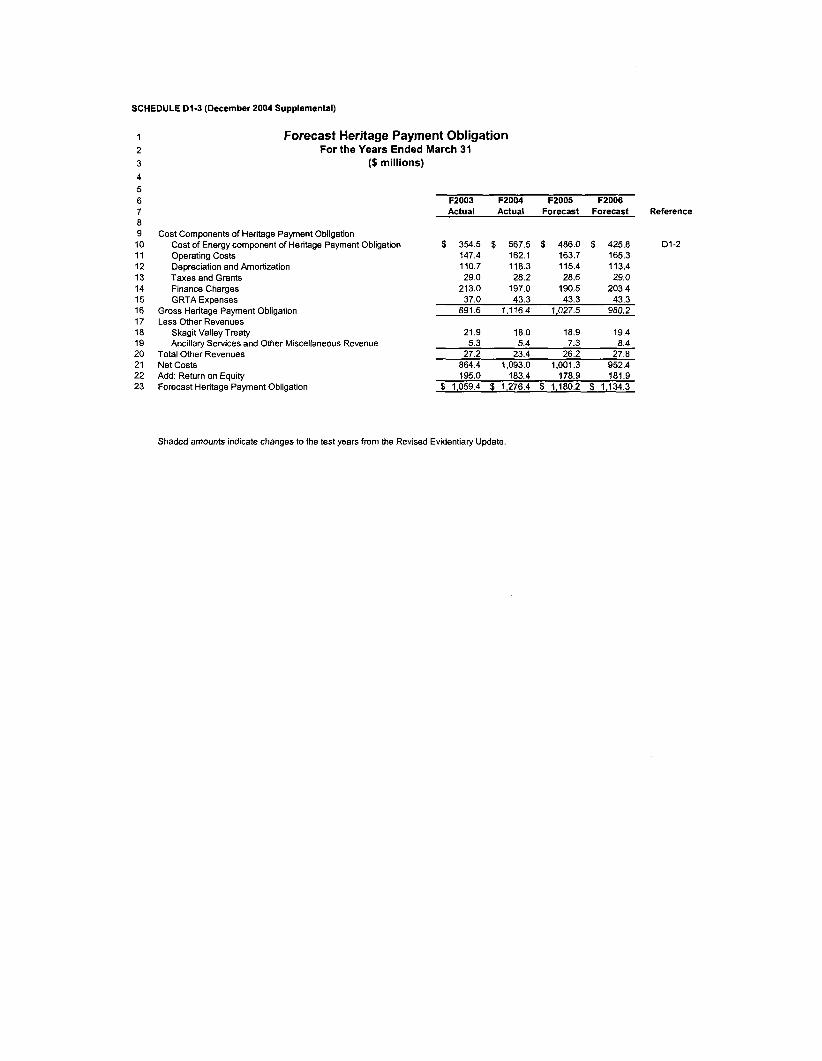
SCHEDULE Dl-3 (December 2004 Supplemental)
1 2 3 4 5 6 7 8 9 10 11 12 13 14 15 16 17 18 19 20 21 22 23
Forecast Heritage Payment Obligation For the Years Ended March 31
(9 millions)
F2003 F2004 F2005 F2006 Actual Actual Forecast Forecast Reference
Cost Components of Heritage Payment Obligation Cost of Energy component of Heritage Payment Obligation Operating Costs Depreciation and Amortization Taxes and Grants Finance Charges GRTA Expenses
Gross Heritage Payment Obligation Less Other Revenues
Skagit Valley Treaty Ancillary Services and Other Miscellaneous Revenue
Total Other Revenues Net Costs Add: Return on Equity Forecast Heritage Payment Obligation
$ 354.5 $ 567.5 $ 486.0 $ 425.8 D1-2 147.4 162.1 163.7 165.3 110.7 118.3 115.4 113.4 29.0 28.2 28.6 29.0
213.0 197.0 190.5 203.4 37.0 43.3 43.3 43.3
891.6 1,1164 1,027.5 980.2
21.9 18.0 18.9 19.4 5.3 5.4 7.3 8.4
27.2 23.4 26.2 27.8 864.4 1,093.0 1,001.3 952.4 195.0 183.4 178.9 181.9
$ 1,059.4 $ 1,276.4 $ 1,180.2 $ 1,134.3
Shaded amounts indicate changes to the test years from the Revised Evidentiary Update.
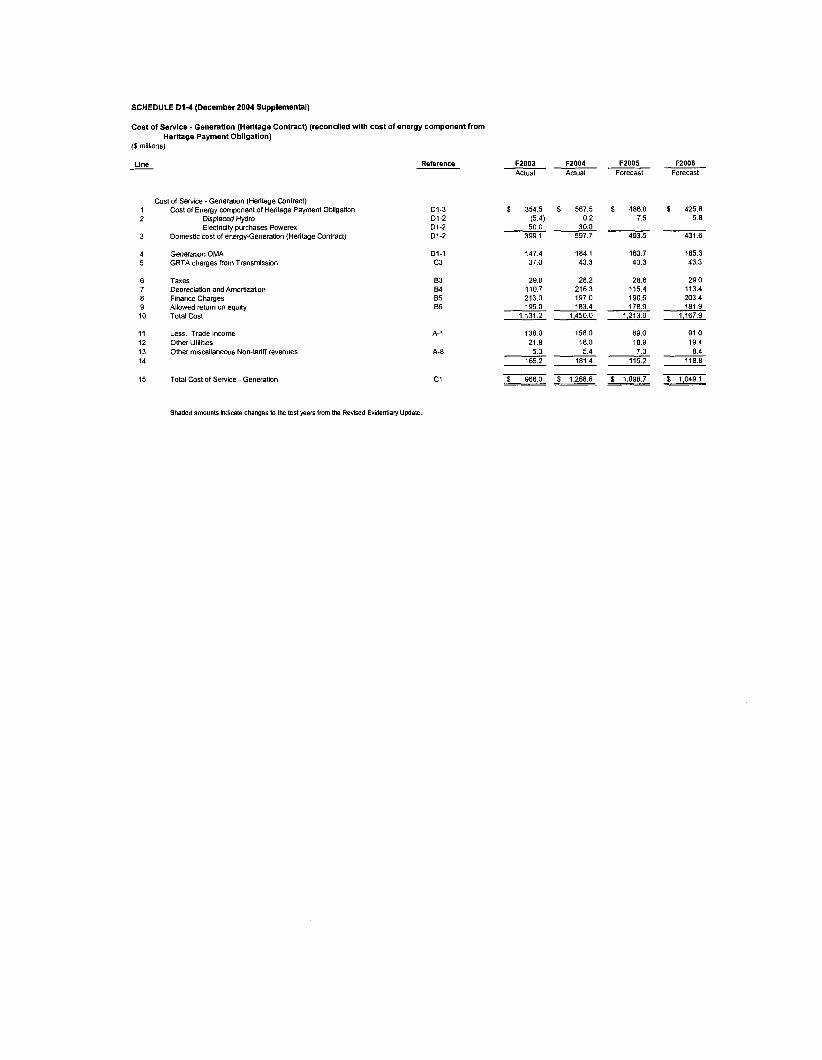
SCHEDULE D 1 4 (December 2004 Supplemental)
Cost of Service -Generation (Heritage Contract) (reconciled with cost of energy component from
($ mdlions) Heritage Payment Obligation)
Line Reference -
Cost of Service - Generation (Heritage Contract) 1 2 Displaced Hydro
3
4 Generatbn O M 5 GRTA charges from Transmission
6 Taxes 7 Depreciation and Anwrtization 8 Finance Charges 9 Allowed return on equity 10 Total Cost
11 Less: Trade Income 12 Other Utilites 13 Other miscellanmus Nan-tariff revenues 14
Cost of Energy mrnpanent of Heritage Payment Obligation
Electricity purchases Powerex Domestic cost of energy-Generation (Herime Contract)
D1-3 01-2 D1-2 D1-2
D1-I c3
83 84 85 56
A-I
A-8
15 Total Cost of Service - Generation c1
F2003 FZ004 F2005 Actual Actual Forecast
~ _ _ _ ~
S 354 5 $ 5675 $ 4860 (5 4) 0 2 7 5
399 1 597 7 493 5
147 4 184 1 163 7 37 0 43 3 43 3
50 0 30 0 -___-
29 0 28 2 28 6 1107 216 3 115 4 213 0 197 0 190 5 195 0 183 4 1789
1.131 2 1.4500 1,2139
138 0 158 0 890 21 9 18 0 18 9 5 3 5 4 7 3
165 2 181 4 115 2
$ 9660 $ 1,2686 $ 1,0987
_______-
-~~ ___-___ --- ---
F2006 Forecast
5 425.8 5 8
431.6
165.3 43.3
29 0 113.4 203.4 181.9
1,167.9
91.0 19.4 8.4
11 8.8
$ 1,049.1 - Shaded amOuntS indicate changes to the test )ears from the Revised Evrjentiary Update
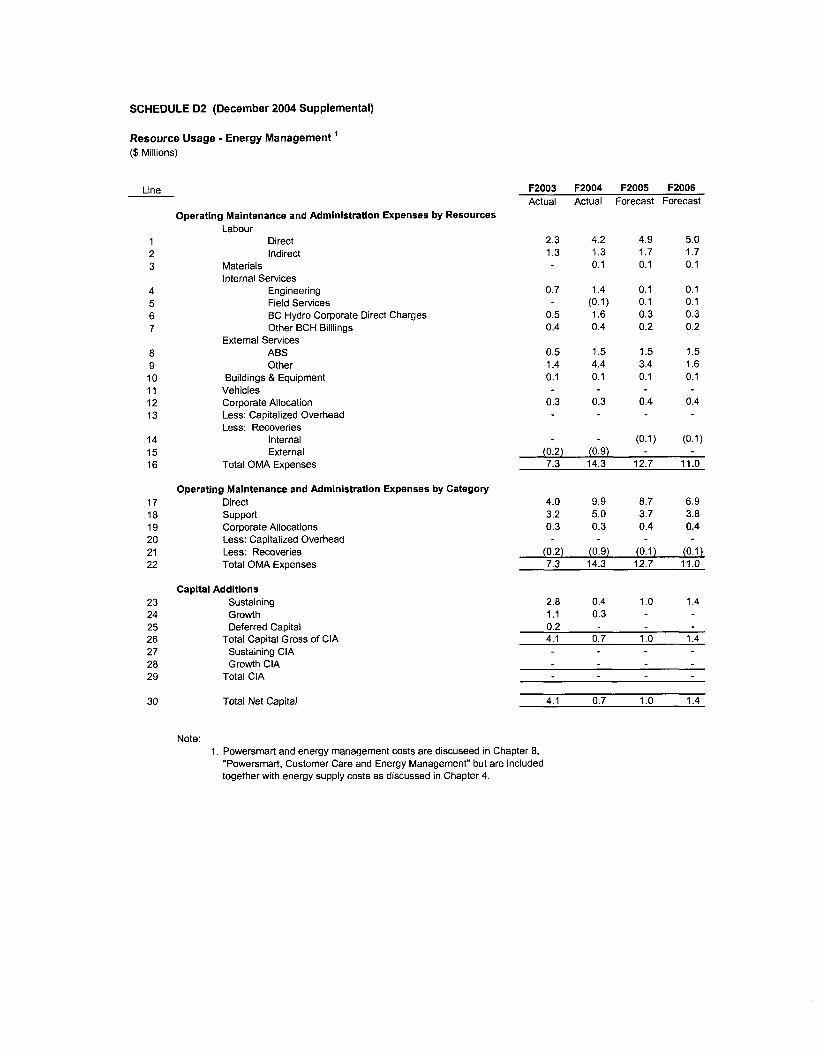
SCHEDULE D2 (December 2004 Supplemental)
Resource Usage - Energy Management ' ($ Millions)
Line
1 2 3
4 5 6 7
8 9 10 11 12 13
14 15 16
17 18 19 20 21 22
23 24 25 26 27
29
30
223
Operating Maintenance and Administration Expenses by Resources Labour
Direct Indirect
Materials Internal Services
Engineering Field Services BC Hydro Corporate Direct Charges Other BCH Billlings
ABS Other
Buildings & Equipment Vehicles Corporate Allocation Less: Capitalized Overhead Less: Recoveries
Internal External
External Services
Total OMA Expenses
F2003 F2004 F2005 F2006 Actual Actual Forecast Forecast
2.3 4.2 4.9 5.0 1.3 1.3 1.7 1.7
0.1 0.1 0.1
0.7 1.4 0.1 0.1 (0.1) 0.1 0.1
0.5 1.6 0.3 0.3 0.4 0.4 0.2 0.2
0.5 1.5 1.5 1.5 1.4 4.4 3.4 1.6 0.1 0.1 0.1 0.1
0.3 0.3 0.4 0.4
(0.1) (0.1) (0.2) (0.9) 7.3 14.3 12.7 11.0
Operating Maintenance and Administration Expenses by Category Direct 4.0 9.9 23.7 6.9
Corporate Allocations 0.3 0.3 0.4 0.4 Less: Capitalized Overhead Less: Recoveries Total OMA Expenses
support 3.2 5.0 3.7 3.23
(0.2) (0.9) (0.1) (0.1) 711 143 127 110
Capital Additions Sustaining Growth Deferred Capital
Sustaining CIA Growth CIA
Total Capital Gross of CIA
Total CIA
Total Net Capital
2.0 0.4 1 .o 1.4 1.1 0.3 0.2 4.1 0.7 1 .o 1.4
4.1 0.7 1 .o 1.4
Note: 1. Powersmart and energy management costs are discuseed in Chapter 8,
"Powersmart, Customer Care and Energy Management" but are included together with energy supply costs as discussed in Chapter 4.
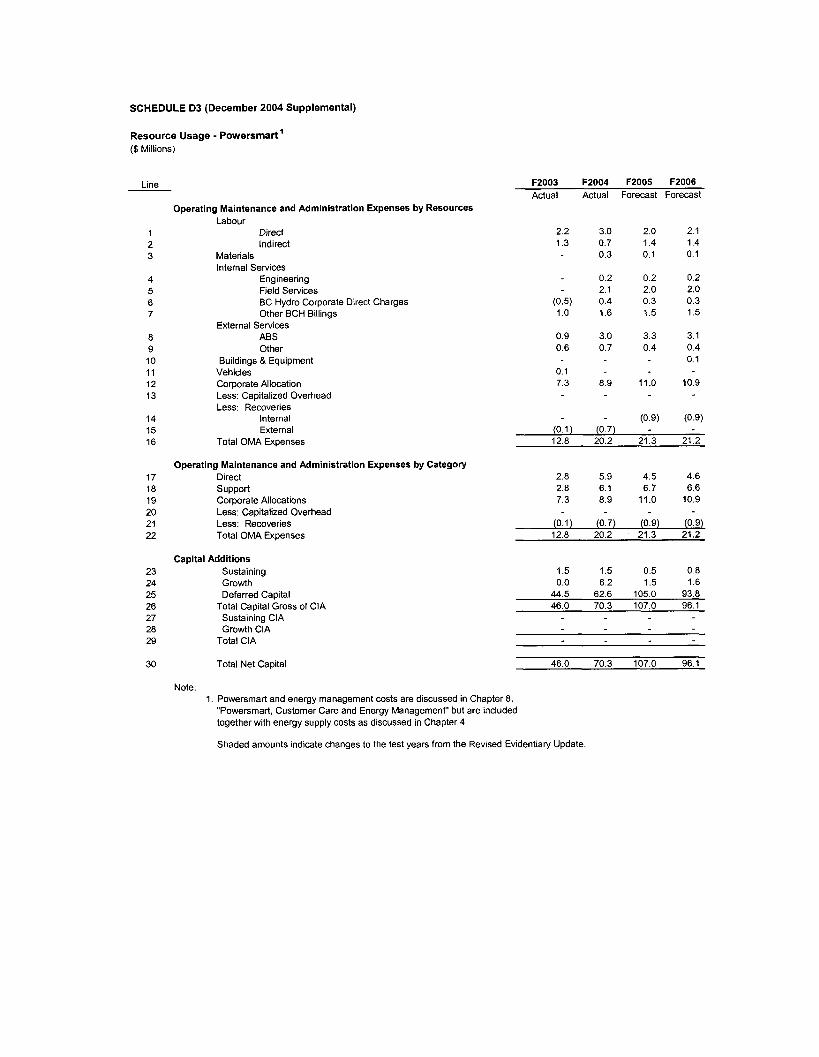
SCHEDULE D3 (December 2004 Supplemental)
Resource Usage - Powersmart' ($ Millions)
Line
1 2 3
4 5 6 7
8 9 10 11 12 13
14 15 16
17 18 19 20 21 22
23 24 25 26 27 28 29
30
Operating Maintenance and Administration Expenses by Resources Labour
Direct Indirect
Materials Internal Services
Engineering Field Services BC Hydro Corporate Direct Charges Other BCH Billings
ABS Other
Buildings & Equipment Vehicles Corporate Allocation Less: Capitalized Overhead Less: Recoveries
Internal External
External Services
Total OMA Expenses
Operating Maintenance and Administration Expenses by Category Direct support Corporate Allocations Less: Capitalized Overhead Less: Recoveries Total OMA Expenses
Capital Additions Sustaining Growth Deferred Capital
Sustaining CIA Growth CIA
Total Capital Gross of CIA
Total CIA
Total Net Capital
Note:
F2 F2004 F2005 F2006 - Actual Actual Forecast Forecast
2.2 3.0 2.0 2.1 1.3 0.7 1.4 1.4
0.3 0.1 0.1
0.2 0.2 0.2 2.1 2.0 2.0
(0.5) 0.4 0.3 0.3 1 .o 1.6 1.5 1.5
0.9 3.0 3.3 3.1 0.4 0.4 0.6 0.7
0.1 0.1 7.3 8.9 11.0 10.9
(0.9) (0.9) (0.1) (0.7) 12.8 20.2 21.3 21.2
2.8 5.9 4.5 4.6 2.8 6.1 6.7 6.6 7.3 8.9 11.0 10.9
(0.1) (0.7) (0.9) (0.9) 12.8 20.2 21.3 21.2
1.5 1.5 0.5 0.8 0.0 6.2 1.5 1.6
44.5 62.6 105.0 93.8 46.0 70.3 107.0 96.1
46.0 70.3 107.0 96.1
1. Powersmart and energy management costs are discussed in Chapter 8, "Powersmart, Customer Care and Energy Management" but are included together with energy supply costs as discussed in Chapter 4.
Shaded amounts indicate changes to the test years from the Revised Evidentiary Update
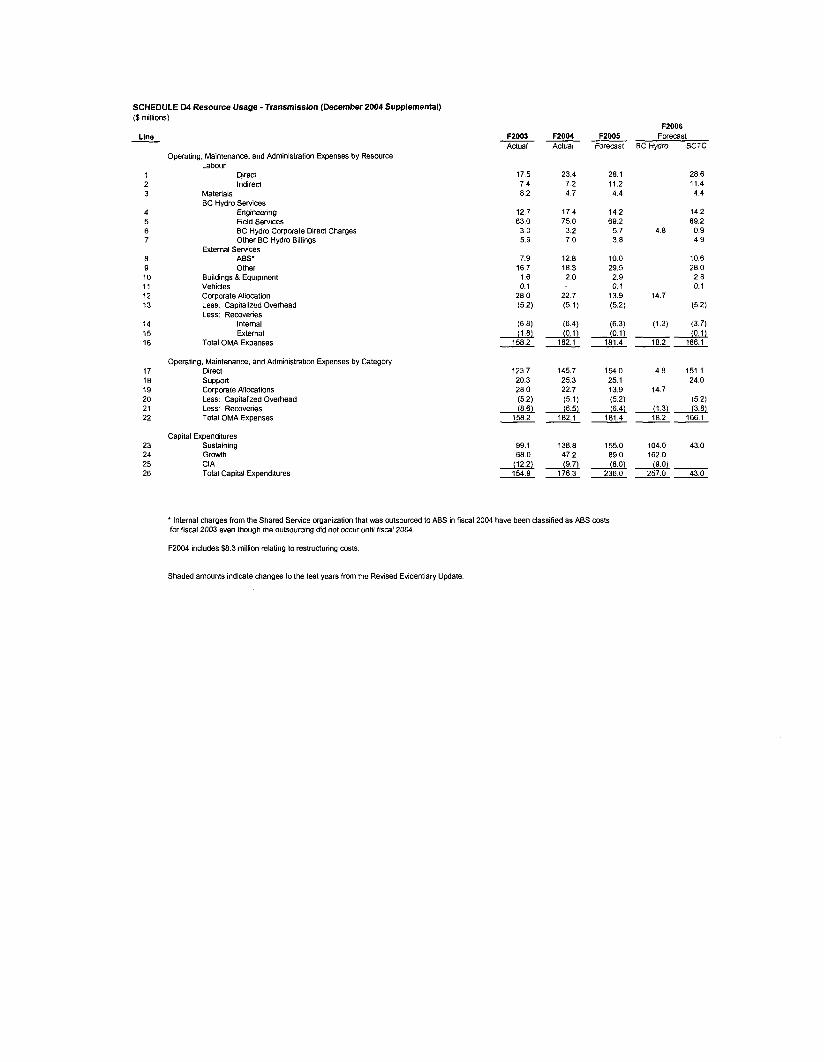
SCHEDULE 04 Resource Usage - Transmission (December 2004 Supplemental) ($millions)
FZ006 FZ003 FZOO4 FZ005 Forecast Actual Actual Forecast BCHydro BCTC - --- Llne
1 2 3
4 5 6 7
8 9 10 11 12 13
14 15 16
17 18 19 20 21 22
23 24 25 26
Operating, Maintenance. and Administration Expenses by Resource Labour
Direct Indirect
Materials BC Hydro Services
Engineering Field Services BC Hydro Corporate Direct Charges Other BC Hydro Billings
ABS' Other
External Services
Buildings & Equipment Vehicles Corporate Alloation Less: Capitalized Overhead Less: Recoveries
Internal External
Total OMA Expenses
Operating, Maintenance. and Administration Expenses by Category Direct
Corporate Alloations Less. Capitalized Overhead Less: Recovenes Total OMA Expenses
SUPPofl
Capital Expenditures Sustaining Growth CIA Total Capital Expenditures
17 5 7 4 8 2
12 7 63 0
3 0 5 9
7 9 16 7 1 6 0 1
28 0 (5 2)
(6 8)
-42 123 7 20 3 28 0 (5 2)
-42 99 1 68 0
154 9 (12 2 1
23 4 7 2 4 7
174 75 0
3 2 7 0
12 8 18 3 2 0
22 7 (5 1)
(6 4) * 145 7 25 3 22 7 (5 1) *
-7%
138 8 47 2
28.1 11.2 4.4
14.2 69.2
5 7 4.8 3.8
10 0 29.5 2.9 0.1
13.9 14.7 (5.2)
(6.3) (1.31
28 6 11 4 4 4
14 2 69 2
0 9 4 9
10 6 28 0 2 8 0 1
(5 2)
(3 7) . . . , 0- i o . i i
181.4 18.2 166.1 --- 154 0 4 8 151 1 25 1 24 0 139 147
(64) (1 3) 1381 (5 2) (5 2)
1814 182 1661 ---
155.0 104.0 43.0 89.0 162.0 (SO) (9.0)
236 0 257.0 43.0 ---
* Internal charges from the Shared Service organization that was outsourced to ABS in fiscal 2004 have been dassitied as ABS mts for fiscal 2003 even though the outsourcing did not occur until fiscal 2004
F2004 includes $8.3 million relating to restructuring costs.
Shaded amounts indicate changes to the test years from the Revised Evidentiary Update
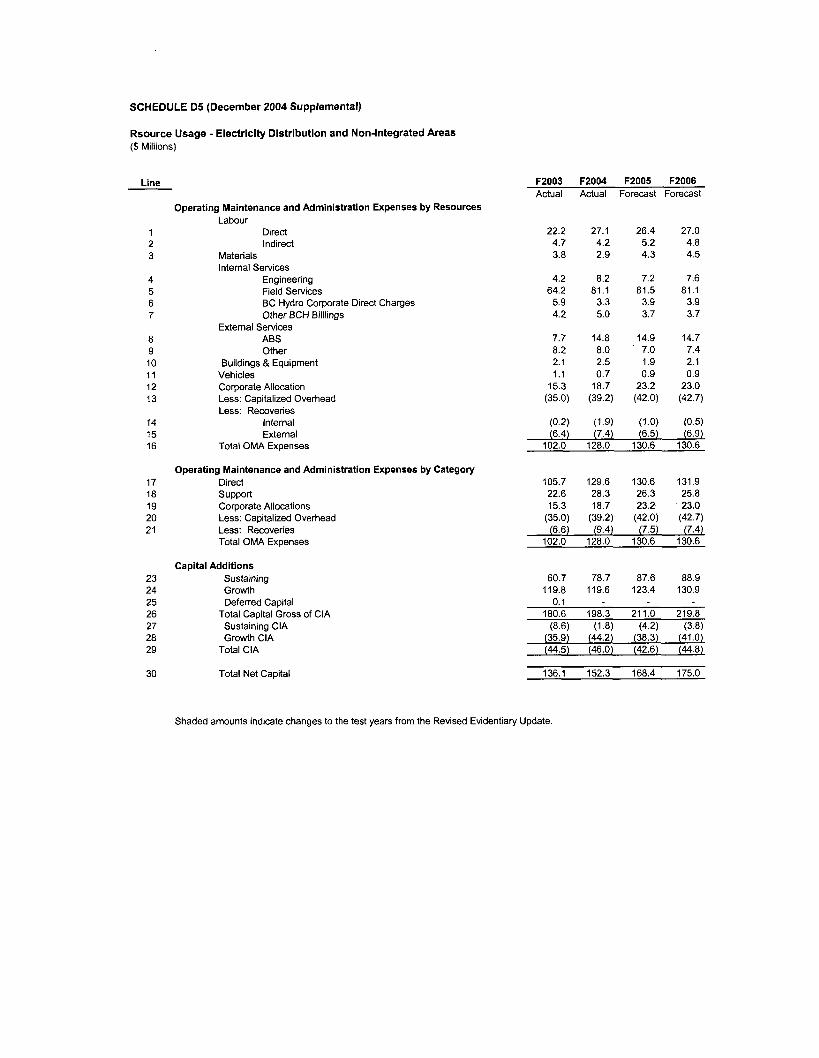
SCHEDULE D5 (December 2004 Supplemental)
Rsource Usage - Electricity Distribution and Non-lntegrated Areas ($ Millions)
Line
1 2 3
4 5 6 7
8 9 10 11 12 13
14 15 16
17 18 19 20 21
23 24 25 26 27 28 29
30
Operating Maintenance and Administration Expenses by Resources Labour
Direct Indirect
Materials Internal Services
Engineering Field Services BC Hydro Corporate Direct Charges Other BCH Billlings
ABS Other
Buildings & Equipment Vehicles Corporate Allocation Less: Capitalized Overhead Less: Recoveries
Internal External
External Services
Total OMA Expenses
Operating Maintenance and Administration Expenses by Category Direct
Corporate Allocations Less: Capitalized Overhead Less: Recoveries Total OMA Expenses
support
Capital Additions Sustaining Growth Deferred Capital
Sustaining CIA Growth CIA
Total Capital Gross of CIA
Total CIA
F2003 F2004 F2005 F2006 Actual Actual Forecast Forecast
22.2 27.1 26.4 27.0 4.7 4.2 5.2 4.8 3.8 2.9 4.3 4.5
4.2 8.2 7.2 7.6 64.2 81.1 81.5 81.1 5.9 3.3 3.9 3.9 4.2 5.0 3.7 3.7
7.7 14.8 14.9 14.7 8.2 8.0 ' 7.0 7.4 2.1 2.5 1.9 2.1 1.1 0.7 0.9 0.9
15.3 18.7 23.2 23.0 (35.0) (39.2) (42.0) (42.7)
(0.2) (1.9) (1.0) (0.5) (6.4) (7.4) (6.5) (6.9)
102.0 128.0 130.6 130.6
105.7 129.6 130.6 131.9 22.6 28.3 26.3 25.8 15.3 18.7 23.2 23.0
(35.0) (39.2) (42.0) (42.7) (6.6) (9.4) (7.5) (7.4)
102.0 128.0 130.6 130.6
60.7 78.7 87.6 88.9 119.8 119.6 123.4 130.9
n i -. . 180.6 198.3 211.0 219.8
(8.61 (1.81 (4.21 (3.8) (35.9j (44.2) (38.3j (4i.oj (44.5) (46.0) (42.6) (44.8)
Total Net Capital 136.1 152.3 168.4 175.0
Shaded amounts indicate changes to the test years from the Revised Evidentiary Update.
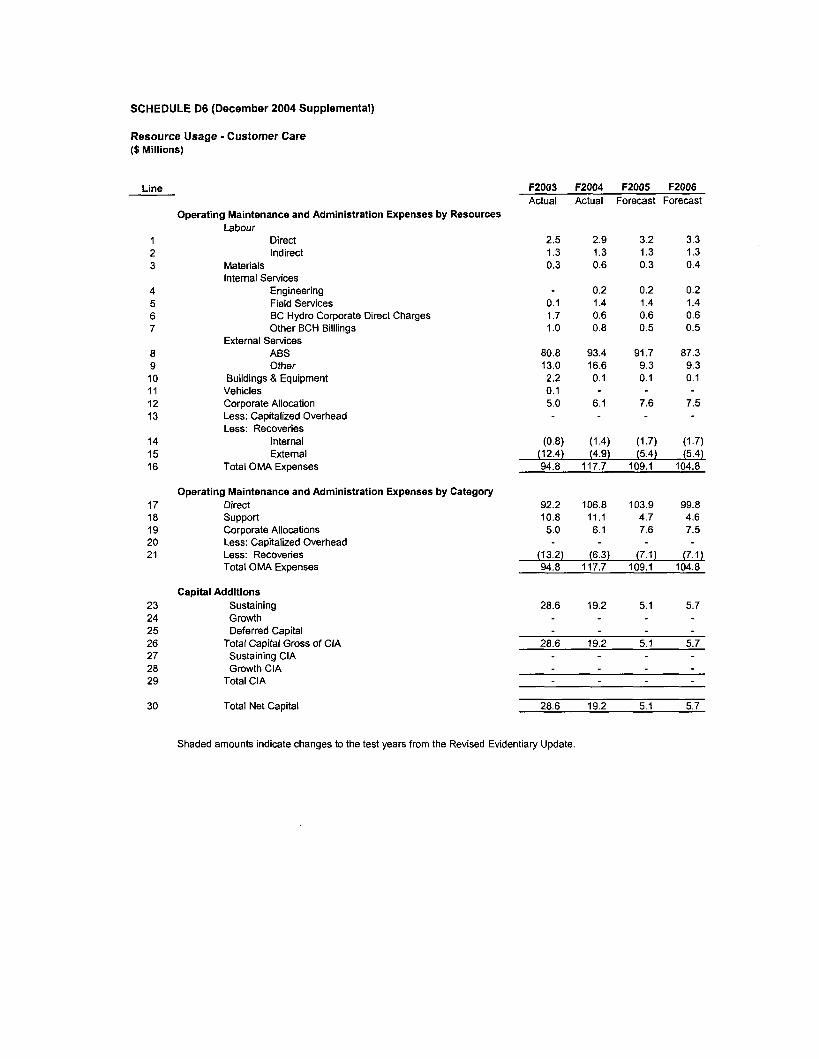
SCHEDULE D6 (December 2004 Supplemental)
Resource Usage - Customer Care ($ Millions)
Line
1 2 3
8 9 10 11 12 13
14 15 16
17 18 19 20 21
23 24 25 26 27 28 29
30
Operating Maintenance and Administration Expenses by Resources Labour
Direct Indirect
Materials Internal Services
Engineering Field Services BC Hydro Corporate Direct Charges Other BCH Billlings
ABS Other
Buildings 8 Equipment Vehicles Corporate Allocation Less: Capitalized Overhead Less: Recoveries
Internal External
External Services
Total OMA Expenses
Operating Maintenance and Administration Expenses by Category Direct support Corporate Allocations Less: Capitalized Overhead Less: Recoveries Total OMA Expenses
Capital Additions Sustaining Growth Deferred Capital
Sustaining CIA Growth CIA
Total Capital Gross of CIA
Total CIA
FZ003 FZ004 F2005 F2006 Actual Actual Forecast Forecast
2.5 2.9 3.2 3.3 1.3 1.3 1.3 1.3 0.3 0.6 0.3 0.4
0.2 0.2 0.2 0.1 1.4 1.4 1.4 1.7 0.6 0.6 0.6 1 .o 0.8 0.5 0.5
80.8 93.4 91.7 87.3 13.0 16.6 9.3 9.3 2.2 0.1 0.1 0.1 0.1 5.0 6.1 7.6 7.5
(0.8) (1.4) (1.7) (1.7) . . . . . . . .
(12.4) (4.9) (5.4) (5.4) 94.8 117.7 109.1 104.8
92.2 106.8 103.9 99.8 10.8 11.1 4.7 4.6 5.0 6.1 7.6 7.5
(13.2) (6.3) (7.1) (7.1) 94.8 117.7 109.1 104.8
28.6 19.2 5.1 5.7
28.6 19.2 5.1 5.7
Total Net Capital 28.6 19.2 5.1 5.7
Shaded amounts indicate changes to the test years from the Revised Evidentiary Update.
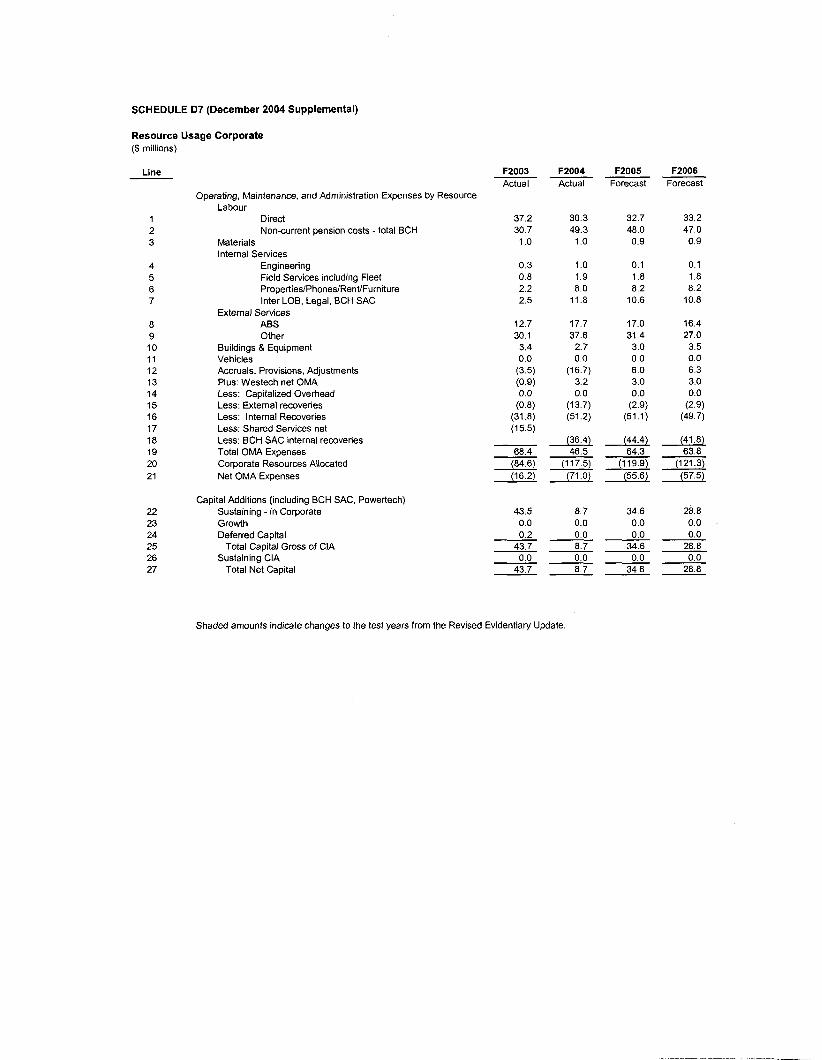
SCHEDULE D7 (December 2004 Supplemental)
Resource Usage Corporate ($ millions)
F2003 Actual
F2004 Actual
F2005 F2006 Forecast
Line Forecast
Operating, Maintenance, and Administration Expenses by Resource Labour
Direct Non-current pension costs -total BCH
Materials Internal Services
Engineering Field Services including Fleet PropertiedPhonedRentlFurniture Inter LOB, Legal, BCH SAC
ABS Other
External Services
Buildings & Equipment Vehicles Accruals, Provisions, Adjustments Plus: Westech net OMA Less: Capitalized Overhead Less: External recoveries Less: Internal Recoveries Less: Shared Services net Less: BCH SAC internal recoveries Total OMA Expenses Corporate Resources Allocated Net OMA Expenses
Capital Additions (including BCH SAC, Powertech) Sustaining - in Corporate Growth Deferred Capital
Sustaining CIA Total Capital Gross of CIA
Total Net Capital
33.2 47.0 0.9
1 2 3
37.2 30.7
1 .o
30.3 49.3
1 .o
32.7 48.0 0.9
0.3 0.8 2.2 2.5
1 .o 1.9 8.0
11.8
0.1 1.8 8.2
10.6
0.1 1.8 8.2
10.8
4 5 6 7
8 9 10 11 12 13 14 15 16 17 18 19 20 21
12.7 30.1
3.4 0.0
(3.5) (0.9)
(0.8)
(15.5)
0.0
(31.8)
17.7 37.6
2.7 0.0
(16.7) 3.2 0.0
(13.7) (51.2)
17.0 31.4 3.0 0.0 6.0 3.0 0.0
(51.1) (2.9)
16.4 27.0
3.5 0.0 6.3 3.0 0.0
(2.9) (49.7)
(36.4) 46.5
(117.5) (71 .O)
(44.4) 64.3
(119.9) (55.6)
(41 .E) 63.8
(121.3) (57.5)
68.4 (84.6) (16.2)
43.5 0.0
8.7 0.0
34.6 0.0
28.8 0.0
22 23 24 25 26 27
0.0 28.8 0.0
28.8
0.2 43.7 0.0
43.7
0.0 8.7 0.0 8.7
0.0 34.6 0.0
34.6
Shaded amounts indicate changes to the test years from the Revised Evidentiary Update.
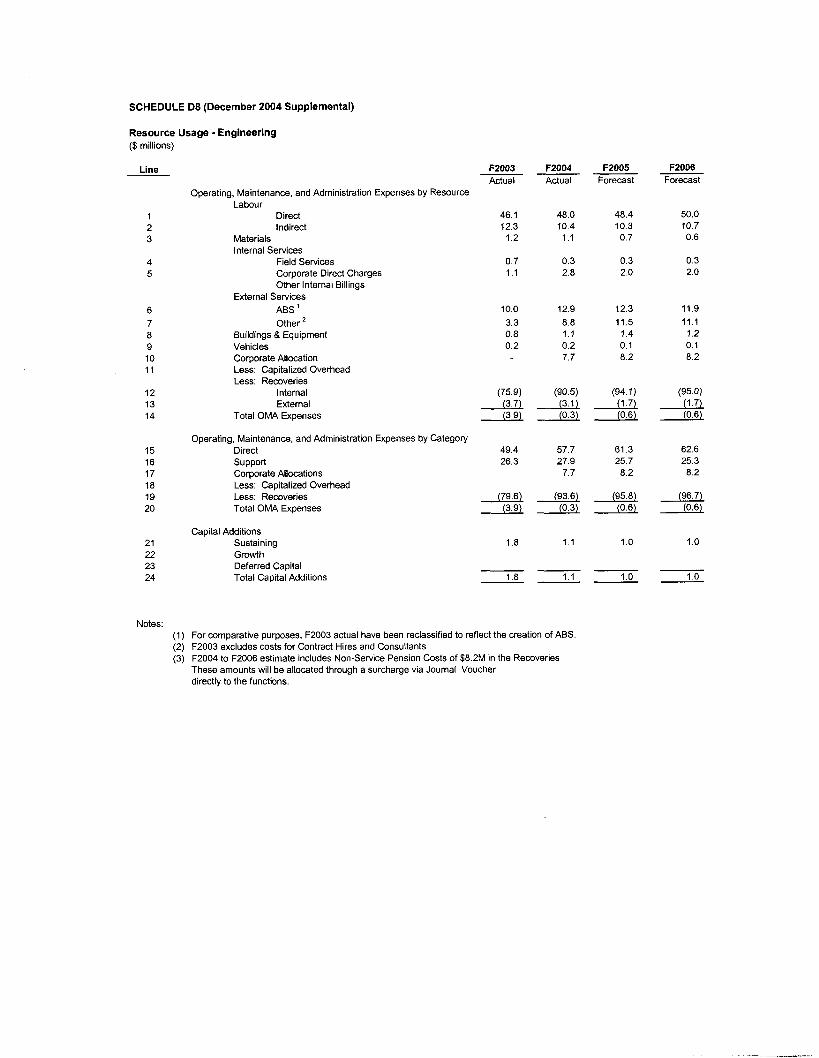
SCHEDULE D8 (December 2004 Supplemental)
Resource Usage - Engineering ($ millions)
Line
1 2 3
4 5
6 7 8 9 10 11
12 13 14
15 16 17 18 19 20
21 22 23 24
Notes: (1) (2) (3)
Operating, Maintenance, and Administration Expenses by Resource Labour
Direct Indirect
Materials Internal Services
Field Services Corporate Direct Charges Other Internal Billings
ABS ’ Other
External Services
Buildings & Equipment Vehicles Corporate Allocation Less: Capitalized Overhead Less: Recoveries
Internal External
Total OMA Expenses
Operating, Maintenance, and Administration Expenses by Category Direct
Corporate Allocations Less: Capitalized Overhead Less: Recoveries Total OMA Expenses
support
Capital Additions Sustaining Growth Deferred Capital Total Capital Additions
F2003 Actual
46.1 12.3 1.2
0.7 1.1
10.0 3.3 0.8 0.2
(75.9) (3.7) (3.9)
49.4 26.3
(79.6) (3.9)
1.8
1.8
F2004 Actual
48.0 10.4 1 . I
0.3 2.8
12.9 8.8 1.1 0.2 7.7
(90.5) (3.1) (0.3)
57.7 27.9
7.7
(93.6) (0.3)
1 . I
1.1
For comparative purposes, F2003 actual have been reclassified to reflect the creation of ABS. F2003 excludes costs for Contract Hires and Consultants F2004 to F2006 estimate includes Non-Service Pension Costs of $8.2M in the Recoveries These amounts will be allocated through a surcharge via Journal Voucher directly to the functions.
F2005 Forecast
48.4 10.3 0.7
0.3 2.0
12.3 11.5 1.4 0.1 8.2
(94.1) (1.7) (0.6)
61.3 25.7
8.2
(95.8) (0.6)
1 .o
1 .o
F2006 Forecast
50.0 10.7 0.6
0.3 2.0
11.9 11.1 1.2 0.1 8.2
(95.0)
(0.6) (1.7)
62.6 25.3 8.2
(96.7) (0.6)
1 .o
1 .o
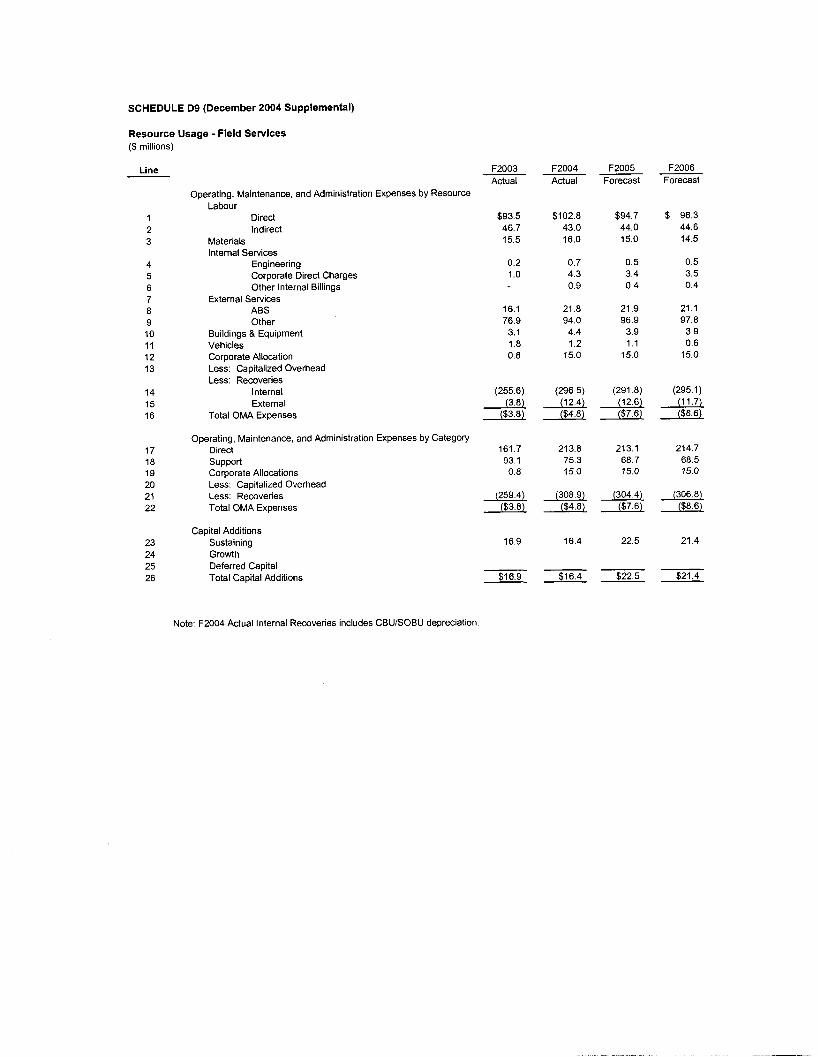
SCHEDULE D9 (December 2004 Supplemental)
Resource Usage - Field Services ($ millions)
Line
1 2 3
4 5 6 7 8 9 10 11 12 13
14 15 16
Operating, Maintenance, and Administration Expenses by Resource Labour
Direct Indirect
Materials Internal Services
Engineering Corporate Direct Charges Other Internal Billings
ABS Other
External Services
Buildings & Equipment Vehicles Corporate Allocation Less: Capitalized Overhead Less: Recoveries
Internal External
Total OMA Expenses
F2003 Actual
$93.5 46.7 15.5
0.2 1 .o
16.1 76.9 3.1 1.8 0.8
(255.6) (3.81
($3.81
F2004 Actual
$102.8 43.0 16.0
0.7 4.3 0.9
21.8 94.0 4.4 1.2
15.0
(296.5) (12.4) ($4.8)
F2005 Forecast
$94.7 44.0 15.0
0.5 3.4 0.4
21.9 96.9 3.9 1.1
15.0
(291.8) (12.61 ($7.6)
F2006 Forecast
$ 96.3 44.6 14.5
0.5 3.5 0.4
21.1 97.8
3.9 0.6
15.0
(295.1) (11.7) ($8.6)
Operating, Maintenance, and Administration Expenses by Category 17 Direct 161.7 213.8 213.1 214.7 18 support 93.1 75.3 68.7 68.5 19 Corporate Allocations 0.8 15.0 15.0 15.0 20 Less: Capitalized Overhead 21 Less: Recoveries 22 Total OMA Expenses
Capital Additions 23 Sustaining 24 Growth 25 Deferred Capital 26 Total Capital Additions
(259.4) (308.9) (304.41 (306.8) ($4.8) ($3.8) ($7.6) ($8.6)
16.9 16.4 22.5 21.4
---- $16.4 $22.5 $21.4 $16.9 - - -
Note: F2004 Actual Internal Recoveries includes CBU/SOBU depreciation
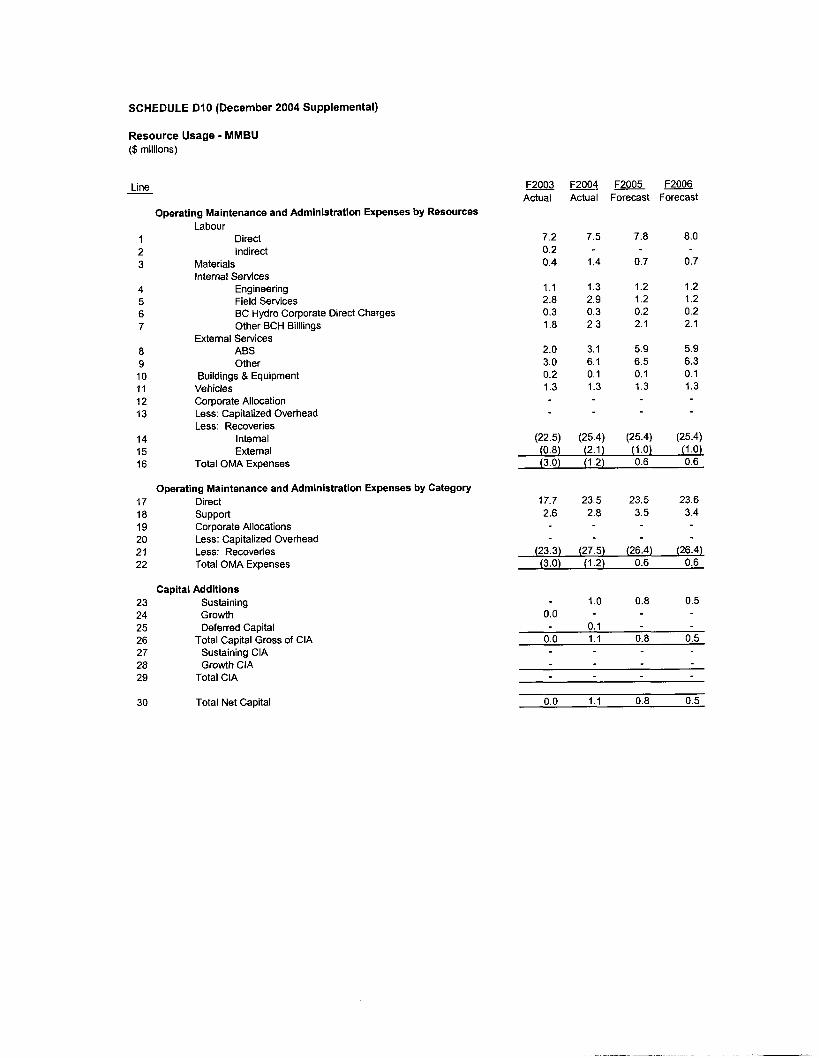
SCHEDULE D10 (December 2004 Supplemental)
Resource Usage - MMBU ($ millions)
Line - Operating Maintenance and Administration Expenses by Resources
Labour 1 Direct 2 Indirect 3 Materials
Internal Services 4 Engineering 5 Field Services 6 7 Other BCH Billlings
External Services 8 ABS 9 Other 10 Buildings & Equipment 11 Vehicles 12 Corporate Allocation 13 Less: Capitalized Overhead
Less: Recoveries 14 Internal 15 External 16 Total OMA Expenses
BC Hydro Corporate Direct Charges
Operating Maintenance and Administration Expenses by Category 17 Direct 18 support 19 Corporate Allocations 20 Less: Capitalized Overhead 21 Less: Recoveries 22 Total OMA Expenses
Capital Additions 23 Sustaining 24 Growth 25 Deferred Capital 26 27 Sustaining CIA 28 Growth CIA 29 Total CIA
30 Total Net Capital
Total Capital Gross of CIA
F2004 F2003 F2005 F2006 Actual Actual Forecast Forecast
7.2 7.5 7.8 8.0 0.2 0.4 1.4 0.7 0.7
1.1 1.3 1.2 1.2 2.8 2.9 1.2 1.2 0.3 0.3 0.2 0.2 1.8 2.3 2.1 2.1
2.0 3.1 5.9 5.9 3.0 6.1 6.5 6.3 0.2 0.1 0.1 0.1 1.3 1.3 1.3 1.3
(22.5) (25.4) (25.4) (25.4) (0.8) (2.1) (1.0) (1 .O) (3.0) (1.2) 0.6 0.6
17.7 23.5 23.5 23.6 2.6 2.8 3.5 3.4
(23.3) (27.5) (26.4) (26.4) (3.0) (1.2) 0.6 0.6
1 .o 0.8 0.5 0.0
0.1 0.0 1.1 0.8 0.5
0.0 1.1 0.8 0.5
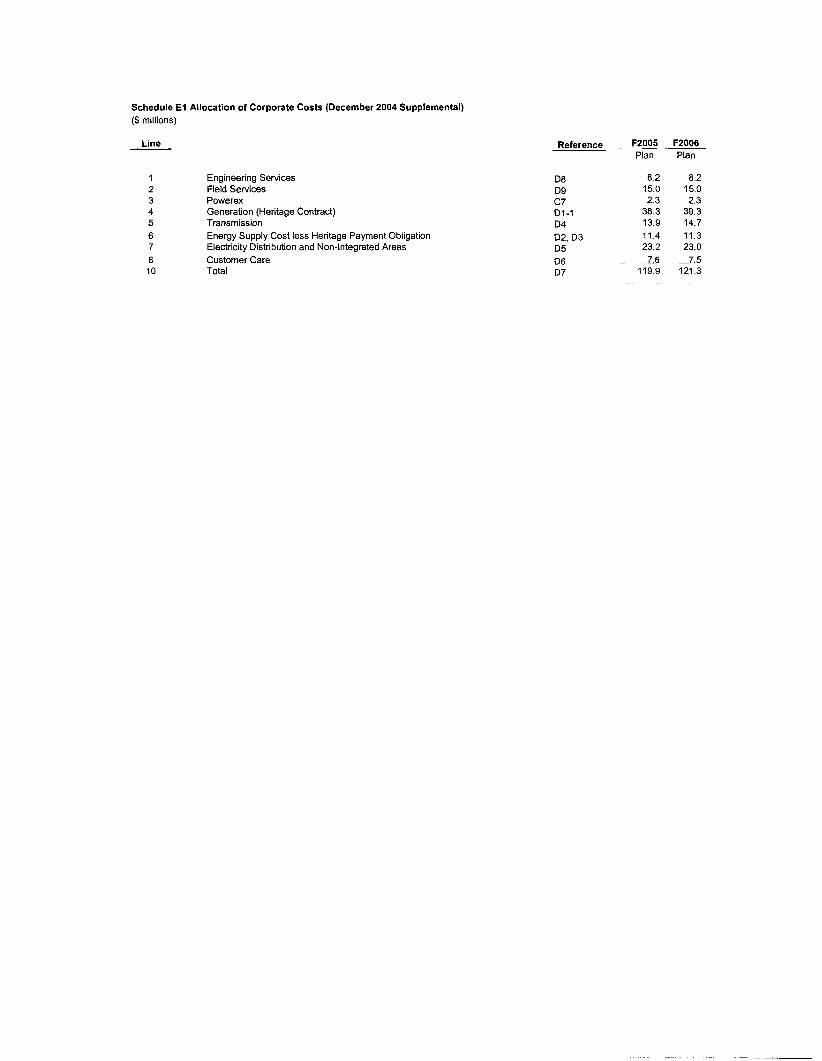
Schedule E l Allocation of Corporate Costs (December 2004 Supplemental) ($ millions)
Line
1 2 3 4 5 6 7 8 10
Engineering Services Field Services Powerex Generation (Heritage Contract) Transmission Energy Supply Cost less Heritage Payment Obligation Electricity Distribution and Non-Integrated Areas Customer Care Total
Reference
D8 D9 c 7 D1-1 D4 D2. D3 05 D6 D7
F2005 Plan
8.2 15.0 2.3
38.3 13.9 11.4 23.2 7.6
119.9
F2006 Plan
8.2 15.0 2.3
39.3 14.7 11.3 23.0
- .__ 7.5 121.3
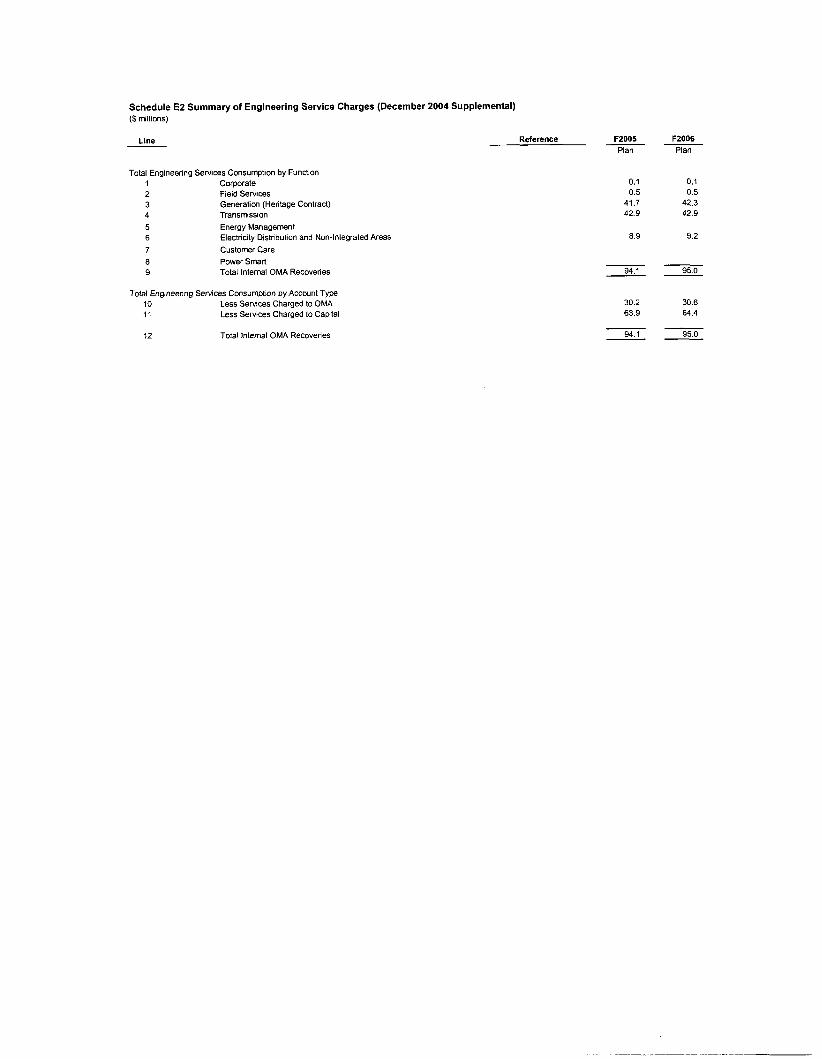
Schedule E2 Summary of Engineering Service Charges (December 2004 Supplemental) ($ millions)
Line
Total Engineenng Services Consumption by Funcbon 1 Corporate 2 Field Services 3 Generation (Hentage Contract) 4 Transmission 5 Energy Management 6 7 Customer Care 8 Power Smart 9 Total Internal OMA Recovenes
Electnaty Distnbution and Non-Integrated Areas
Total Engineenng Semces Consumption by Account Type Less Services Charged to OMA Less Services Charged to Capltal
10 1 1
12 Total Internal OMA Recovenes
Reference F2005 Plan
0.1 0.5 41.7 42.9
8.9
94.1
30.2 63.9
94.1
F2006 Plan
0.1 0.5 42.3 42.9
9.2
95.0
30.6 64.4
95.0
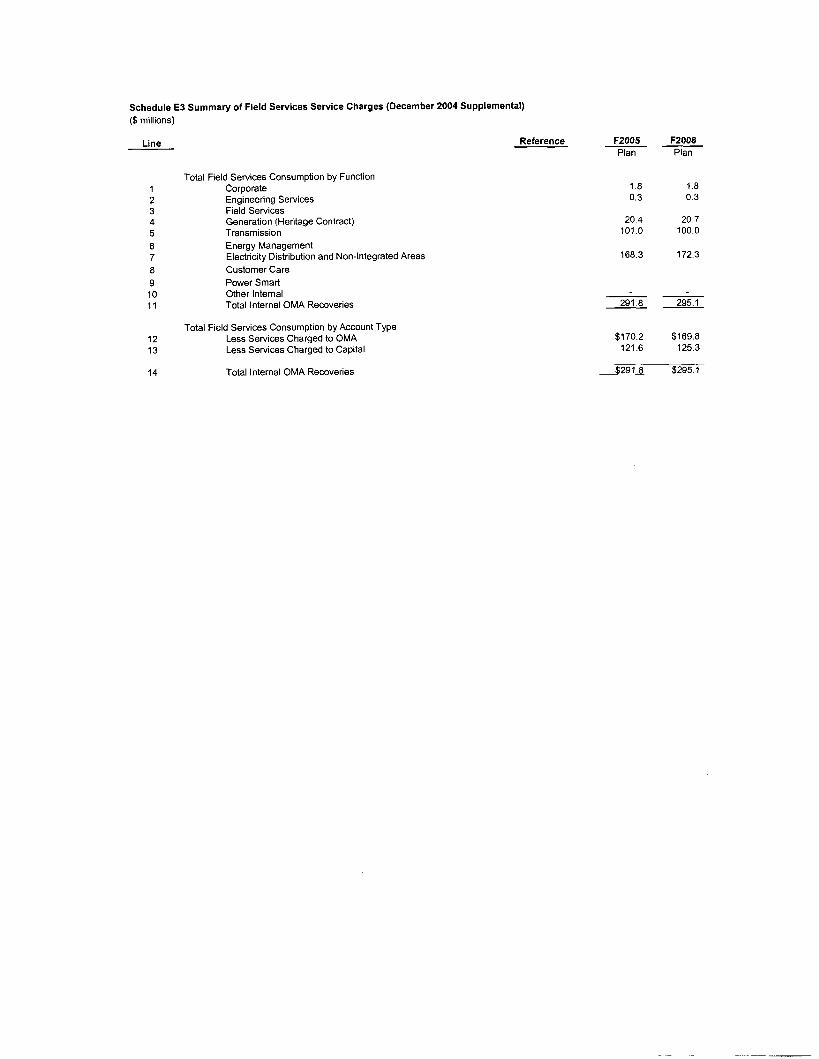
Schedule E3 Summary of Field Services Service Charges (December 2004 Supplemental) ($ millions)
Line
1 2 3 4 5 6 7 8 9 10 11
12 13
Total Field Services Consumption by Function Corporate Engineering Services Field Services Generation (Heritage Contract) Transmission Energy Management Electricity Distribution and Non-Integrated Areas Customer Care Power Smart Other lntemal Total Internal OMA Recoveries
Total Field Services Consumption by Account Type Less Services Charged to OMA Less Services Charged to Capital
Total Internal OMA Recoveries
Reference F2005 Plan
1.8 0.3
20.4 101.0
168.3
291.8
$170.2 121.6
F2006 Plan
1.8 0.3
20.7 100.0
172.3
295.1
$169.8 125.3
14 $291.8 $295.1


![GUIDE D’IMPLEMENTATION DES PROCESSUS ACHEMINEMENT ... · V2.2 28/10/2010 [OMEGA V6B] : Précision sur l’étape de recevabilité d’une demande V2.3 11/09/2015 [OMEGA V10] : Mise](https://img.pdfslide.tips/doc/110x75/5fcbfc992d986570d71cd41c/guide-daimplementation-des-processus-acheminement-v22-28102010-omega-v6b.jpg)

![CE - rapatcl.or.kr · - 7 - ` \æ Ó g < L-.M _|#$ \æ JKèé =ø. ÔÓ > þ 12 s~ ` gi ke k h h úZÙ Ú,[VK+, ¦ V6B\ ÖÚ, ]K4 K Zs~ îïfôñf bGÓ4](https://img.pdfslide.tips/doc/110x75/5b3be9287f8b9a0e628d4038/ce-7-ae-o-g-l-m-ae-jkee-o-oo-b-12-s-gi-ke-k.jpg)