Embed Size (px)
Citation preview
2012 GEC Ghani Workshop 3/23/2012
1
Important!This session is approved for 0.2 IACET or 1.5 PDH. Many states accept this for Professional Continuing Education.
To qualify for credit you must: Be sure your badge was scanned when you entered the workshop
Stay for the entire session
Participate in Question and Answer sessions
Fill out the Evaluation Form and hand it to the proctor as you leaveout t e a uat o o a d a d t to t e p octo as you ea e
If you are registered in Florida, New York, or North Carolina, you must alsosign the sheets in the back at the end of the session. Please print your name,include your registration number, and sign the sheet.
TITLE GOES HERETITLE GOES HERETITLE GOES HERETITLE GOES HERETITLE GOES HERE
2012 GEC Ghani Workshop 3/23/2012
2
R i f P ti i th Di t i t C liReview of Practices in the District Cooling Systems and Pumping Schemes to Manage the Impact on Energy – Burj Khalifa Case Study
Ahmed Abdul Ganhi
Chairman
2
Chairman
Allied Consultants
Cairo, Egypt
Learning Objectives
1. Understand distribution systems reliability
2. Determine distribution system energy running2. Determine distribution system energy running cost
3. Understand new Middle East techniques in District cooling
3
2012 GEC Ghani Workshop 3/23/2012
3
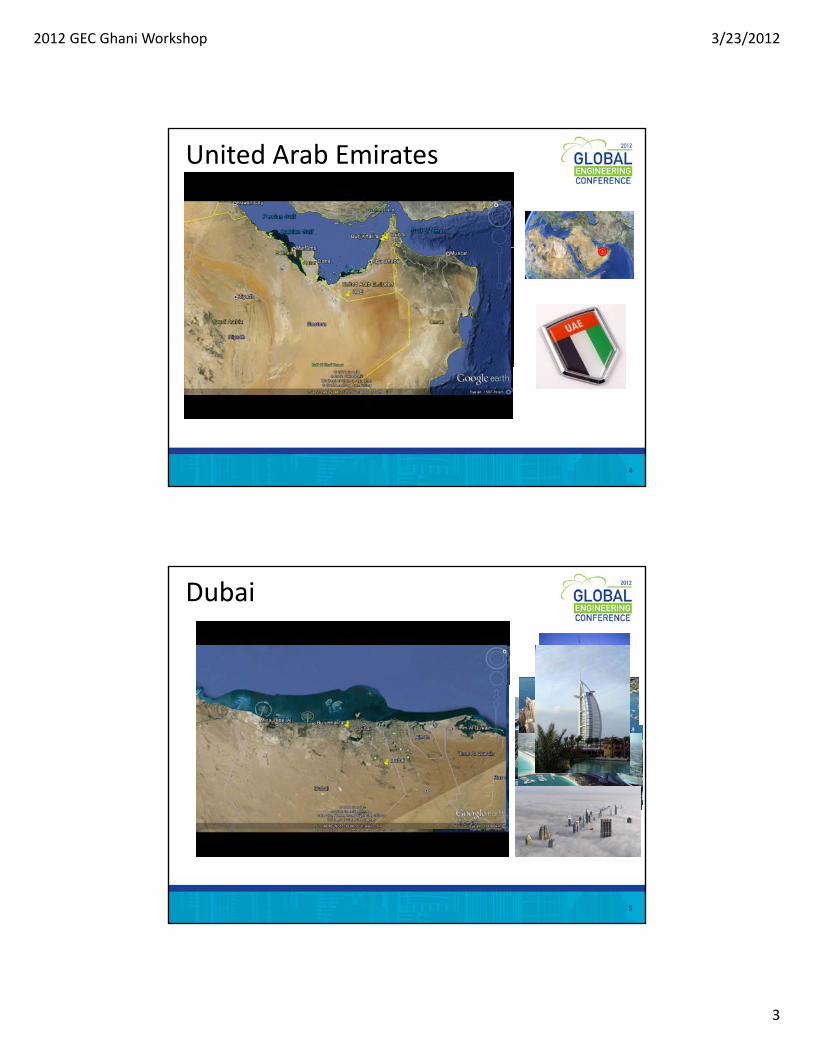
United Arab Emirates
4
Dubai
5
2012 GEC Ghani Workshop 3/23/2012
4
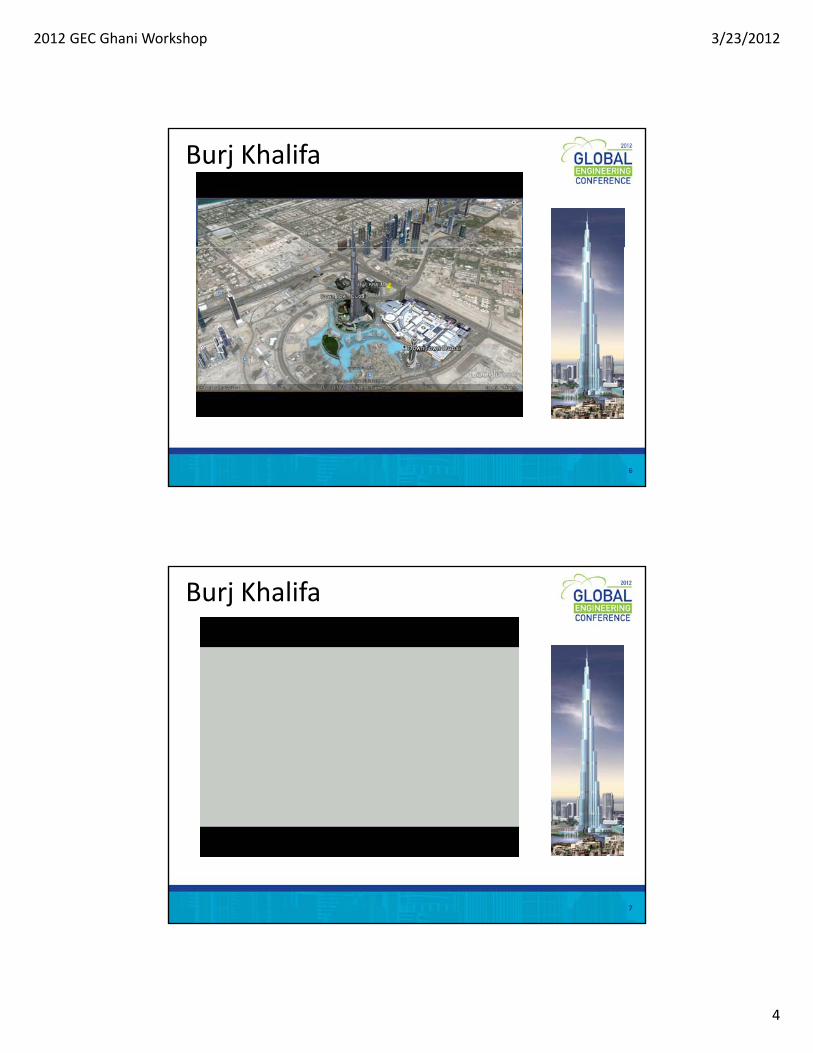
Burj Khalifa
6
Burj Khalifa
7
2012 GEC Ghani Workshop 3/23/2012
5
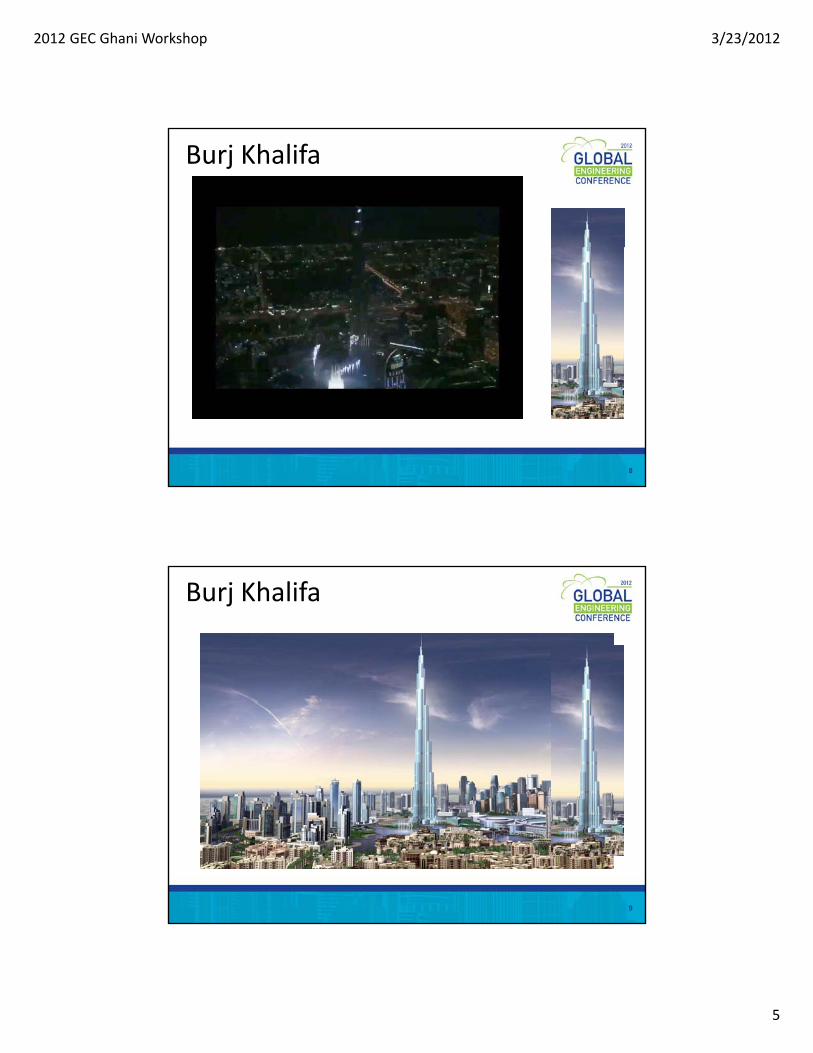
Burj Khalifa
8
Burj Khalifa
9
2012 GEC Ghani Workshop 3/23/2012
6
DCP1
DCP4
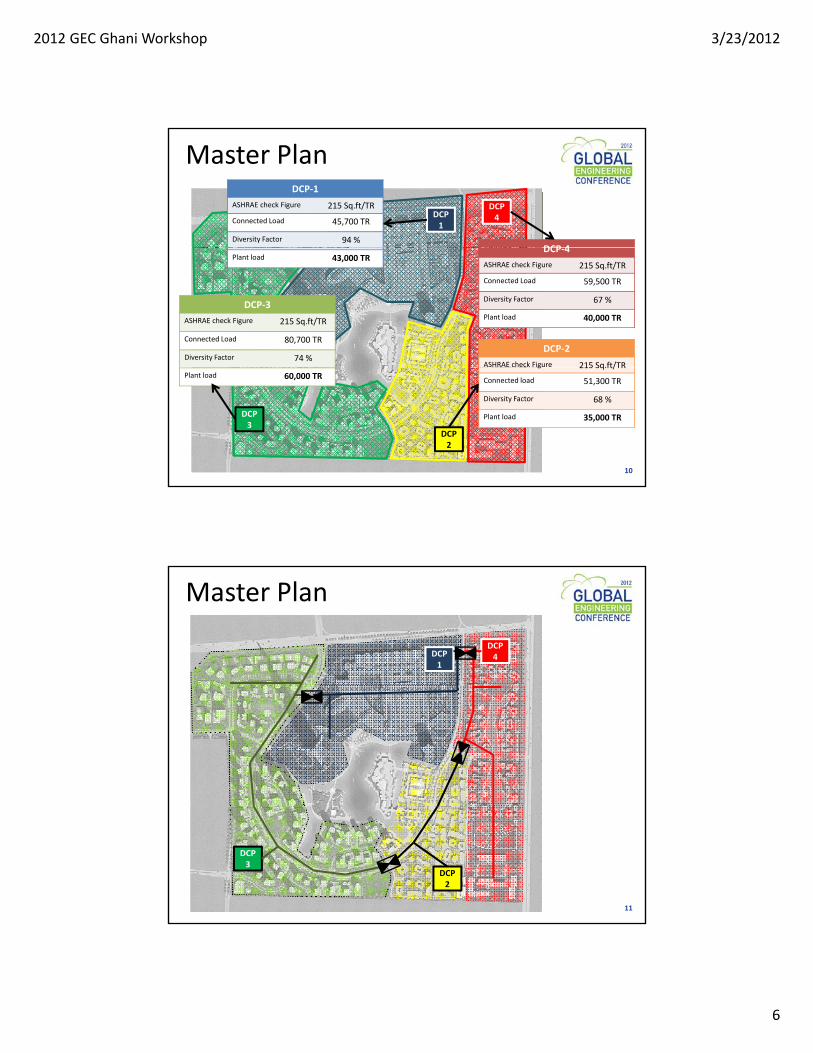
DCP‐1
ASHRAE check Figure 215 Sq.ft/TR
Connected Load 45,700 TR
Diversity Factor 94 %DCP 4
Master Plan
Plant load 43,000 TR
DCP‐2
ASHRAE check Figure 215 Sq.ft/TR
DCP‐3
ASHRAE check Figure 215 Sq.ft/TR
Connected Load 80,700 TR
Diversity Factor 74 %
DCP‐4
ASHRAE check Figure 215 Sq.ft/TR
Connected Load 59,500 TR
Diversity Factor 67 %
Plant load 40,000 TR
DCP2
DCP3
g 215 Sq.ft/TR
Connected load 51,300 TR
Diversity Factor 68 %
Plant load 35,000 TR
Plant load 60,000 TR
10
DCP1
DCP4
Master Plan
DCP2
DCP3
11
2012 GEC Ghani Workshop 3/23/2012
7
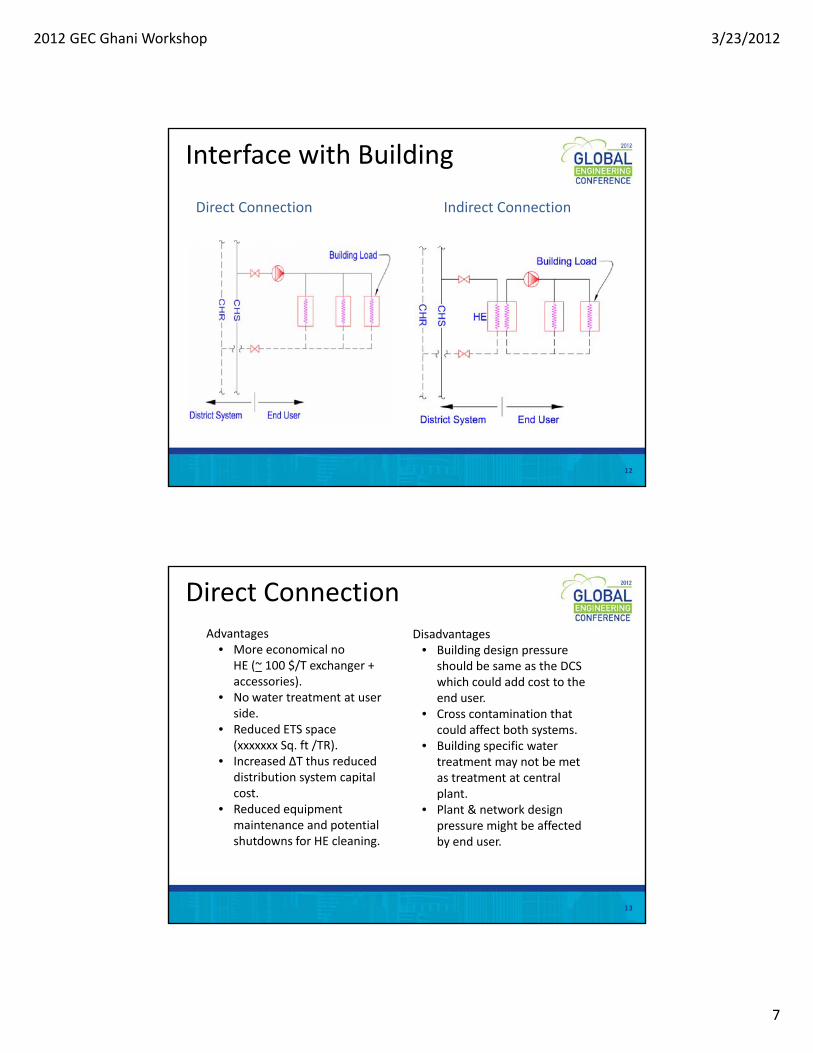
Direct Connection Indirect Connection
Interface with Building
12
Advantages• More economical no
HE (~ 100 $/T exchanger + accessories).
Disadvantages• Building design pressure
should be same as the DCS which could add cost to the
Direct Connection
accessories).• No water treatment at user
side.• Reduced ETS space
(xxxxxxx Sq. ft /TR).• Increased ΔT thus reduced
distribution system capital cost.R d d i
which could add cost to the end user.
• Cross contamination that could affect both systems.
• Building specific water treatment may not be met as treatment at central plant.l k d• Reduced equipment
maintenance and potential shutdowns for HE cleaning.
• Plant & network design pressure might be affected by end user.
13
2012 GEC Ghani Workshop 3/23/2012
8
• Decision taken
• ETS for all users except for Mall (direct connection)
Direct Connection
• ETS for all users except for Mall (direct connection) owned by the Energy Provider.
• Burj indirect due to static impact.
• Pipes‐ Pre insulated with HDPE Jackets‐ Leak detectors
14
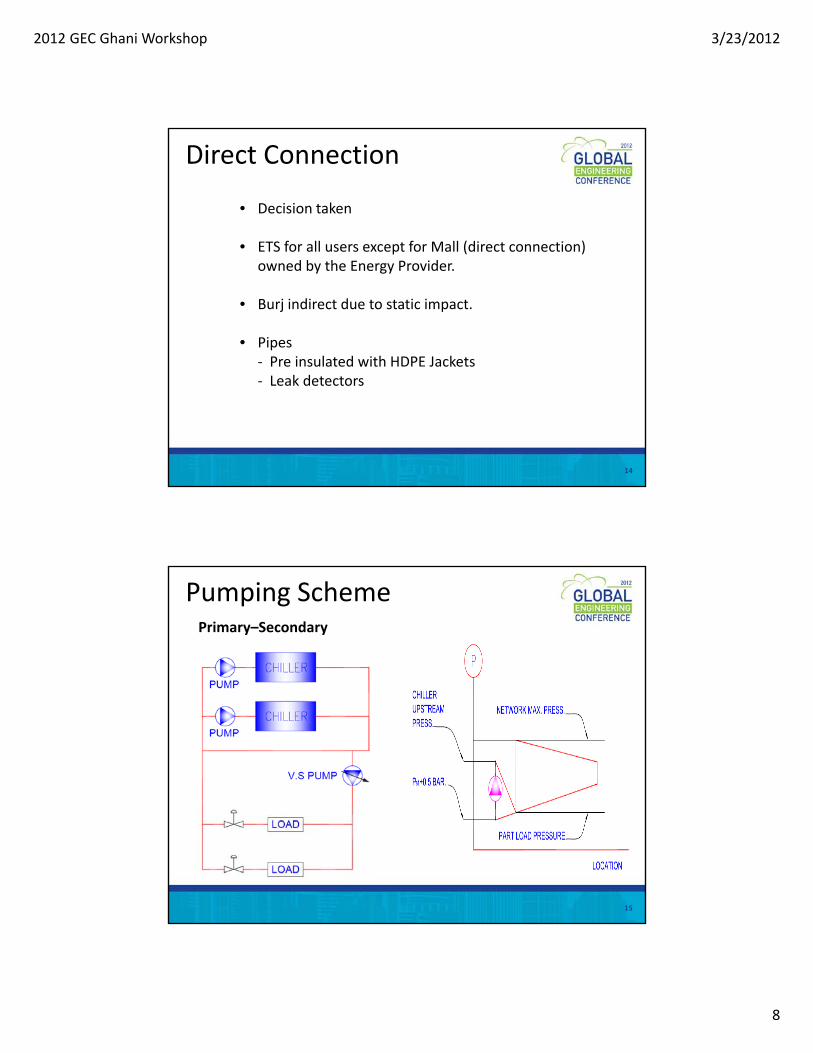
Primary–Secondary
Pumping Scheme
15
2012 GEC Ghani Workshop 3/23/2012
9
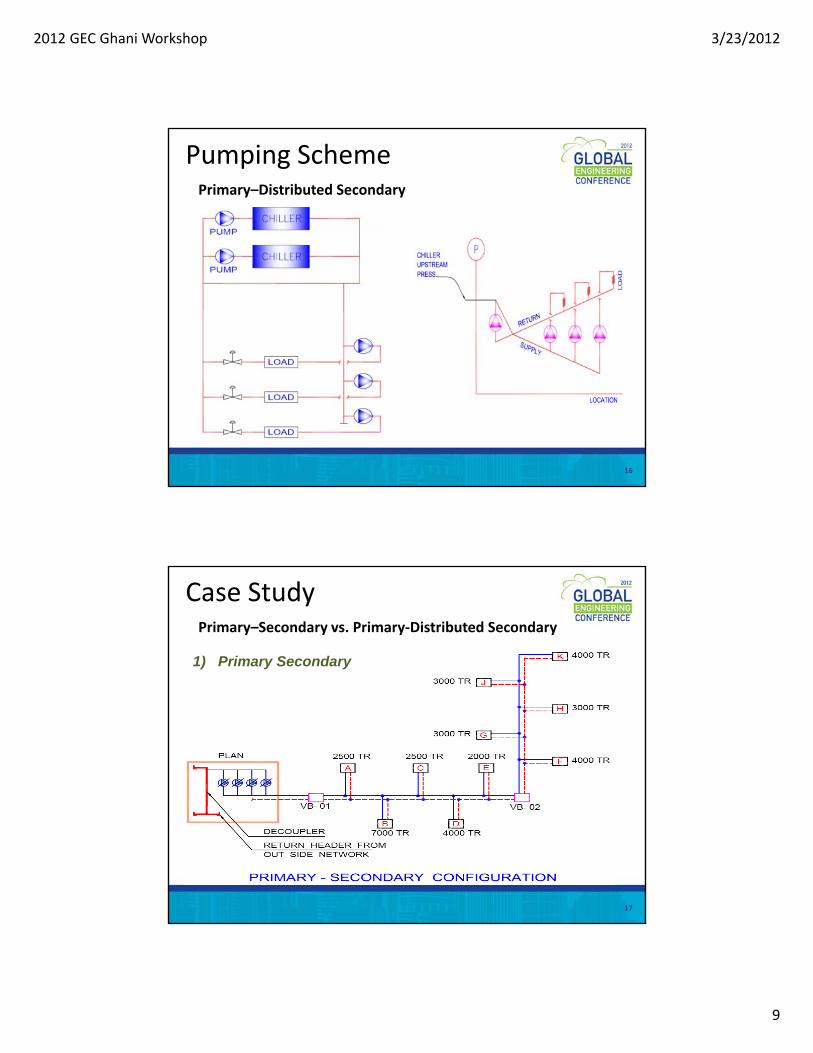
Pumping SchemePrimary–Distributed Secondary
16
Case StudyPrimary–Secondary vs. Primary‐Distributed Secondary
1) Primary Secondary
17
2012 GEC Ghani Workshop 3/23/2012
10
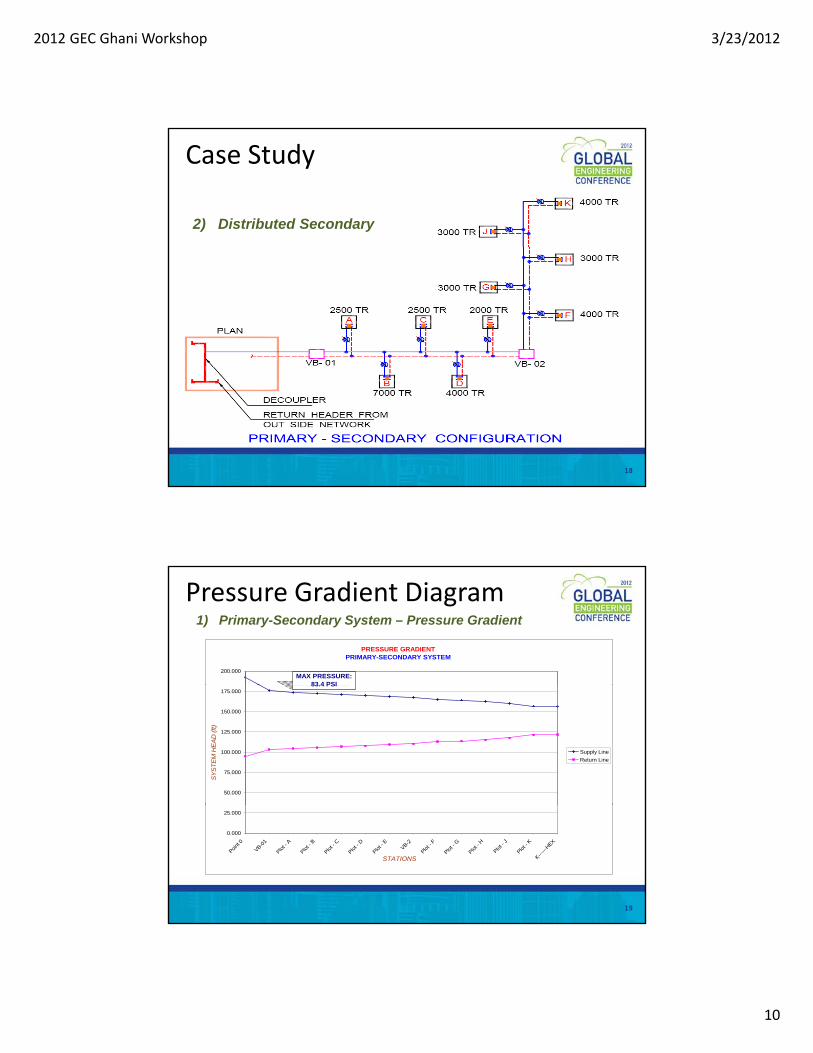
2) Distributed Secondary
Case Study
18
1) Primary-Secondary System – Pressure Gradient
PRESSURE GRADIENTPRIMARY-SECONDARY SYSTEM
200.000MAX PRESSURE:
83 4 PSI
Pressure Gradient Diagram
50.000
75.000
100.000
125.000
150.000
175.000
SY
ST
EM
HE
AD
(ft)
Supply Line
Return Line
83.4 PSI
0.000
25.000
Point
0
VB-01
Plot -
A
Plot -
B
Plot -
C
Plot -
D
Plot -
EVB-2
Plot -
F
Plot -
G
Plot -
H
Plot -
J
Plot -
K
K------
HEX
STATIONS
19
2012 GEC Ghani Workshop 3/23/2012
11
PRESSURE GRADIENTPRIMARY-DISTRIBUTED SYSTEM
175.000
200.000
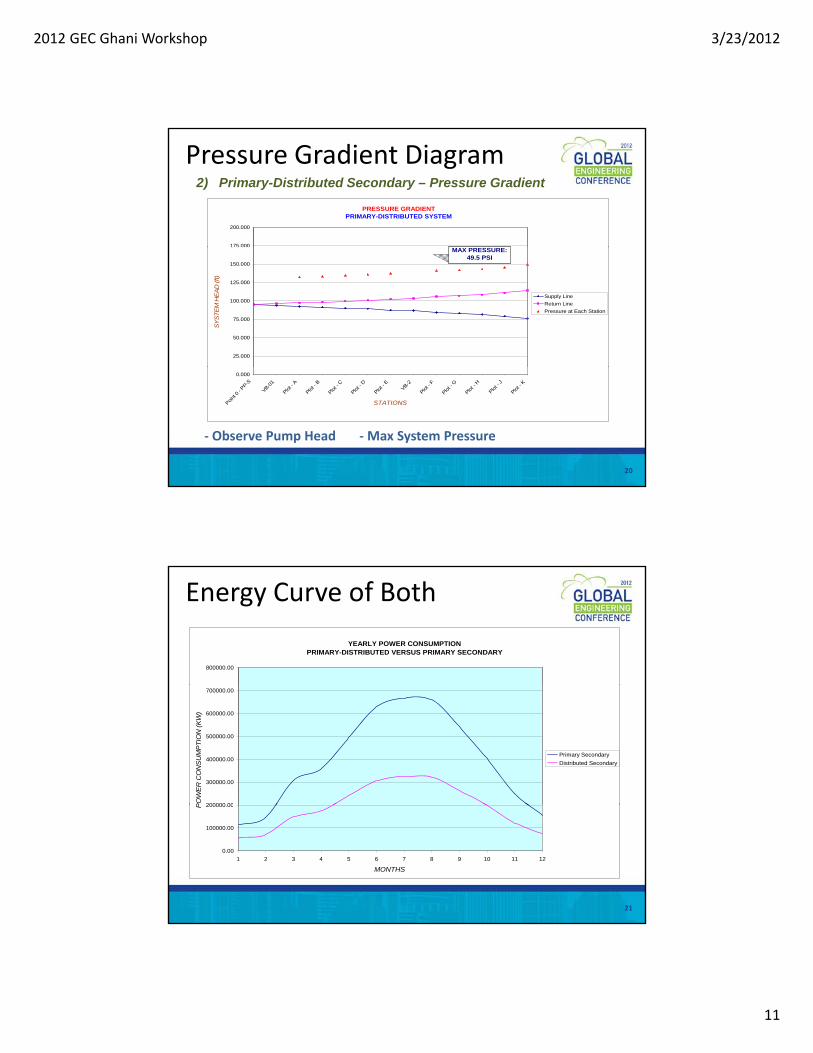
2) Primary-Distributed Secondary – Pressure Gradient
Pressure Gradient Diagram
25.000
50.000
75.000
100.000
125.000
150.000
SY
STE
M H
EA
D (ft)
Supply Line
Return Line
Pressure at Each Station
MAX PRESSURE: 49.5 PSI
0.000
Point
0 -
PP-S
VB-01
Plot -
A
Plot -
B
Plot -
C
Plot -
D
Plot -
EVB-2
Plot -
F
Plot -
G
Plot -
H
Plot -
J
Plot -
K
STATIONS
‐ Observe Pump Head ‐Max System Pressure
20
YEARLY POWER CONSUMPTIONPRIMARY-DISTRIBUTED VERSUS PRIMARY SECONDARY
800000.00
Energy Curve of Both
200000 00
300000.00
400000.00
500000.00
600000.00
700000.00
PO
WE
R C
ON
SU
MP
TIO
N (
KW
)
Primary Secondary
Distributed Secondary
0.00
100000.00
200000.00
1 2 3 4 5 6 7 8 9 10 11 12
MONTHS
P
21
2012 GEC Ghani Workshop 3/23/2012
12
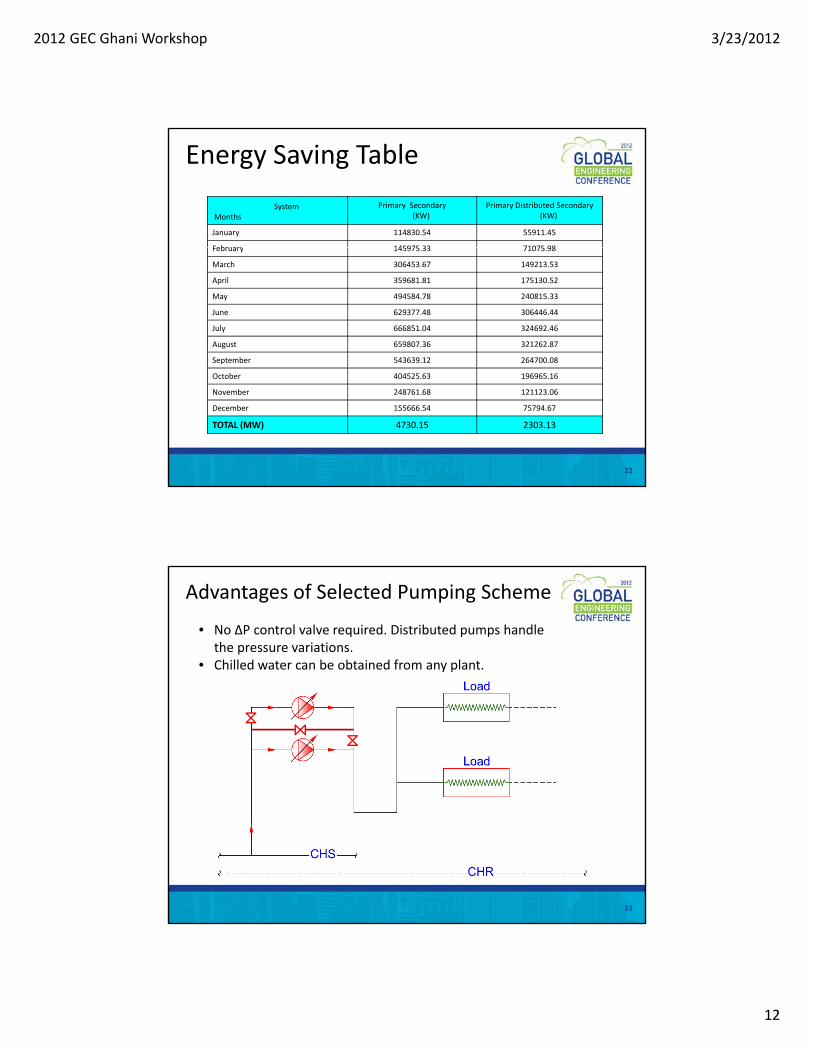
SystemMonths
Primary Secondary (KW)
Primary Distributed Secondary (KW)
January 114830.54 55911.45
February 145975 33 71075 98
Energy Saving Table
February 145975.33 71075.98
March 306453.67 149213.53
April 359681.81 175130.52
May 494584.78 240815.33
June 629377.48 306446.44
July 666851.04 324692.46
August 659807.36 321262.87
September 543639.12 264700.08
October 404525.63 196965.16
November 248761.68 121123.06
December 155666.54 75794.67
TOTAL (MW) 4730.15 2303.13
22
Advantages of Selected Pumping Scheme
• No ΔP control valve required. Distributed pumps handle the pressure variations.
• Chilled water can be obtained from any plant.
23
2012 GEC Ghani Workshop 3/23/2012
13
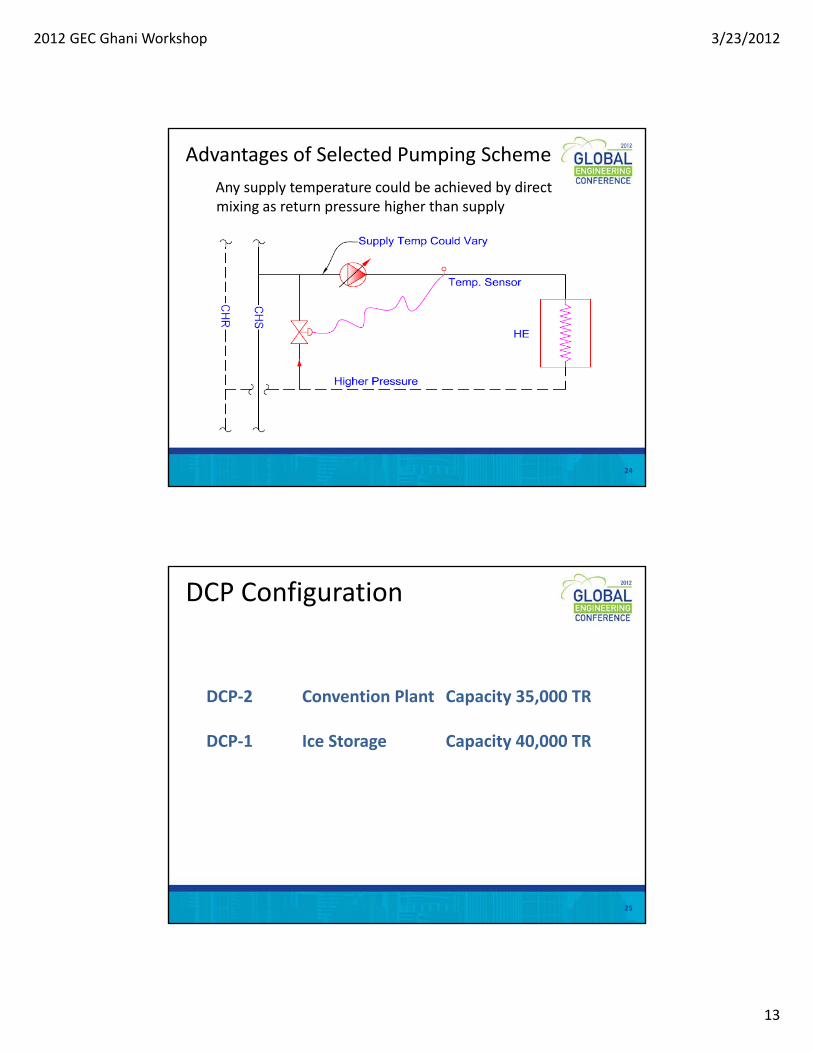
Any supply temperature could be achieved by direct mixing as return pressure higher than supply
Advantages of Selected Pumping Scheme
24
DCP Configuration
DCP‐2 Convention Plant Capacity 35,000 TR
DCP‐1 Ice Storage Capacity 40,000 TR
25
2012 GEC Ghani Workshop 3/23/2012
14
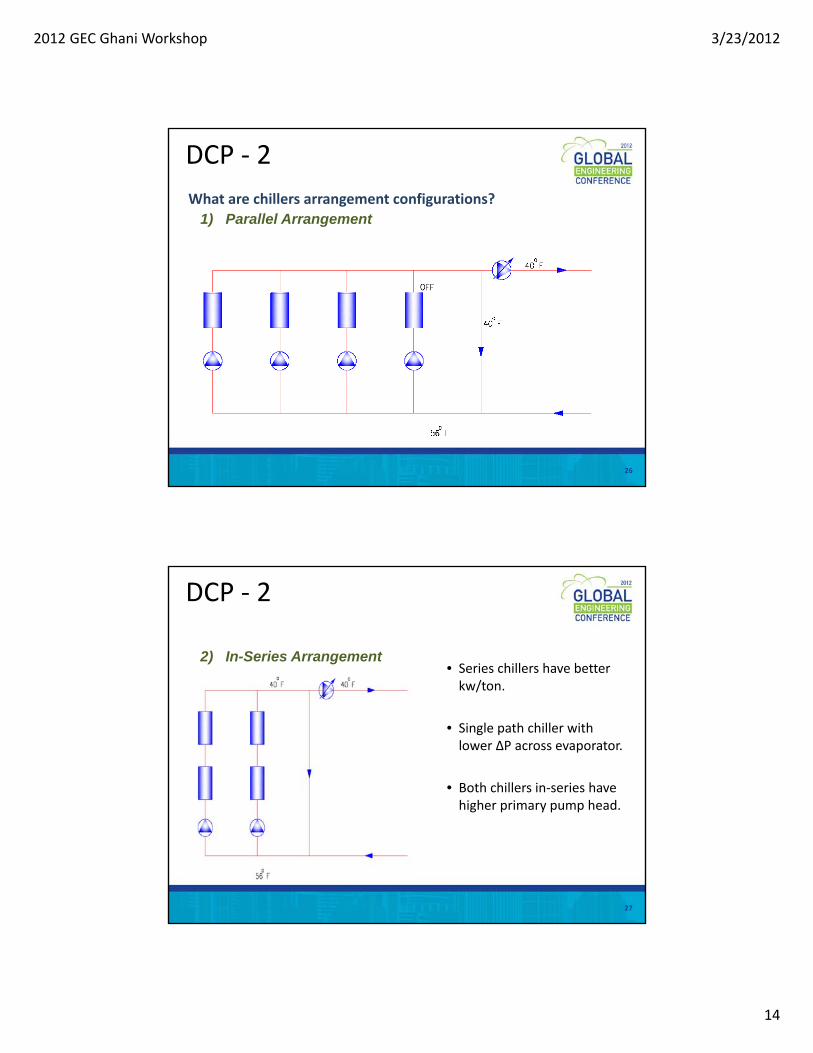
What are chillers arrangement configurations?
1) Parallel Arrangement
DCP ‐ 2
26
• Series chillers have better kw/ton
2) In-Series Arrangement
DCP ‐ 2
kw/ton.
• Single path chiller with lower ΔP across evaporator.
• Both chillers in‐series have higher primary pump headhigher primary pump head.
27
2012 GEC Ghani Workshop 3/23/2012
15
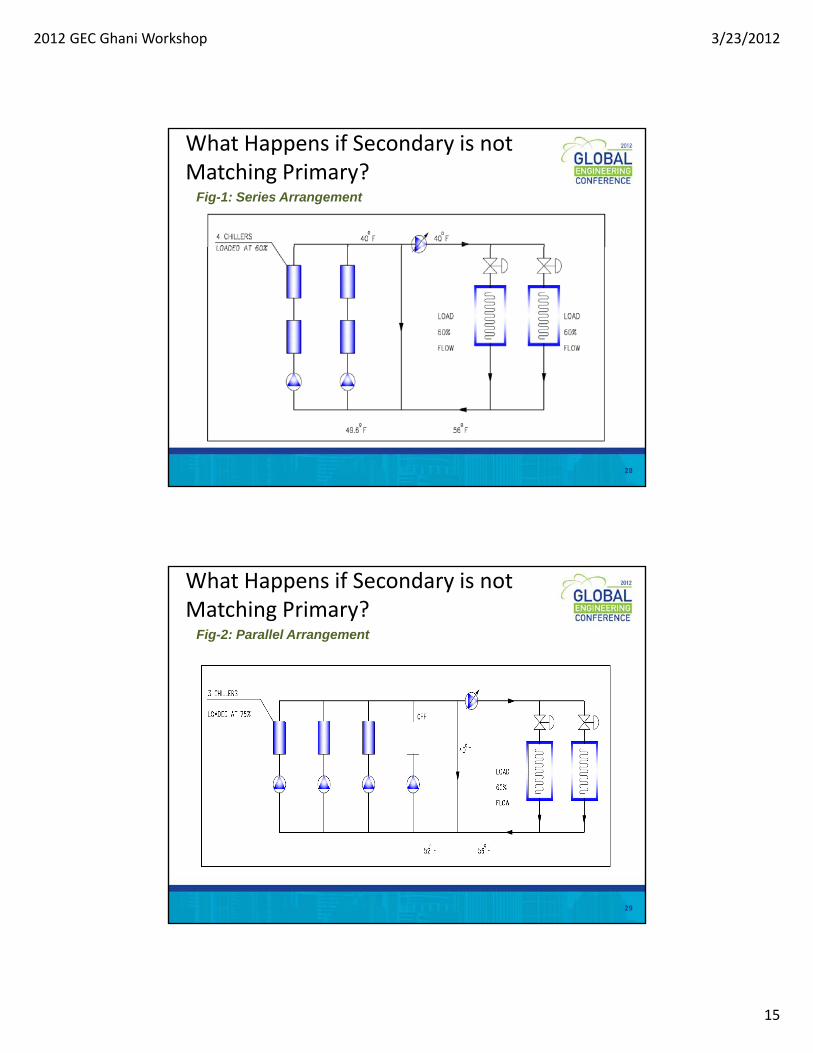
Fig-1: Series Arrangement
What Happens if Secondary is notMatching Primary?
28
Fig-2: Parallel Arrangement
What Happens if Secondary is notMatching Primary?
29
2012 GEC Ghani Workshop 3/23/2012
16
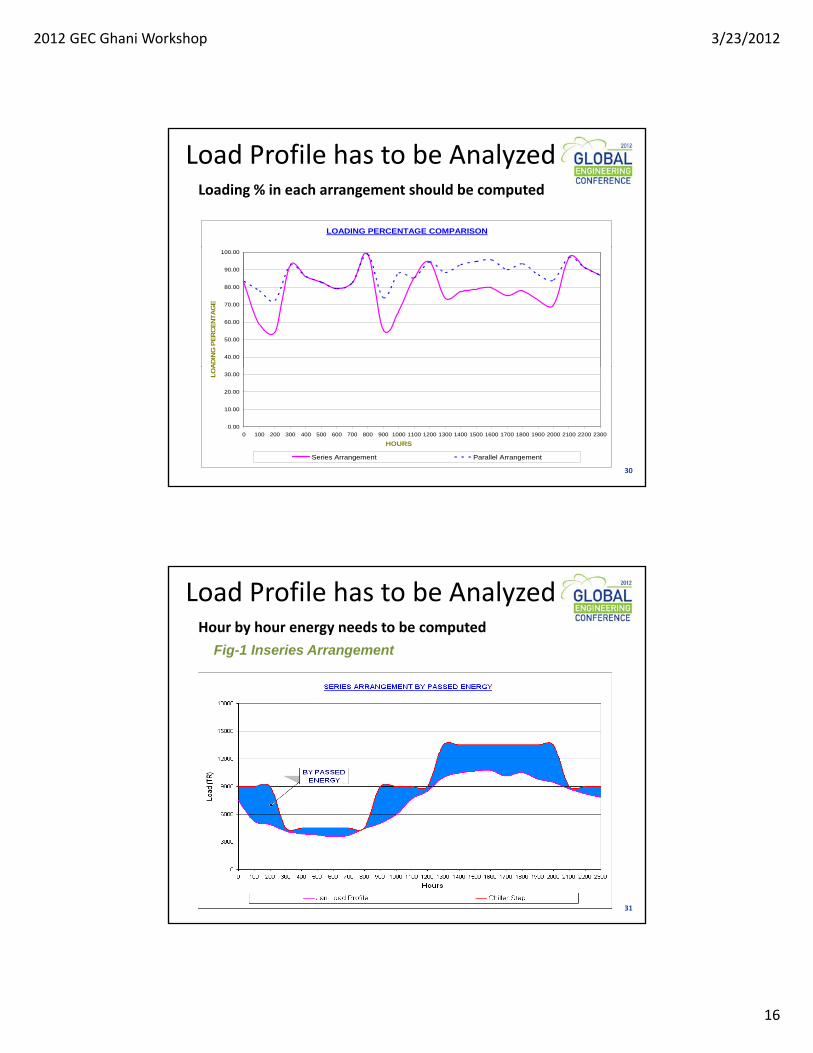
LOADING PERCENTAGE COMPARISON
Load Profile has to be AnalyzedLoading % in each arrangement should be computed
40.00
50.00
60.00
70.00
80.00
90.00
100.00
AD
ING
PE
RC
EN
TA
GE
0.00
10.00
20.00
30.00
0 100 200 300 400 500 600 700 800 900 1000 1100 1200 1300 1400 1500 1600 1700 1800 1900 2000 2100 2200 2300
HOURS
LO
A
Series Arrangement Parallel Arrangement
30
Fig-1 Inseries Arrangement
Load Profile has to be AnalyzedHour by hour energy needs to be computed
31
2012 GEC Ghani Workshop 3/23/2012
17
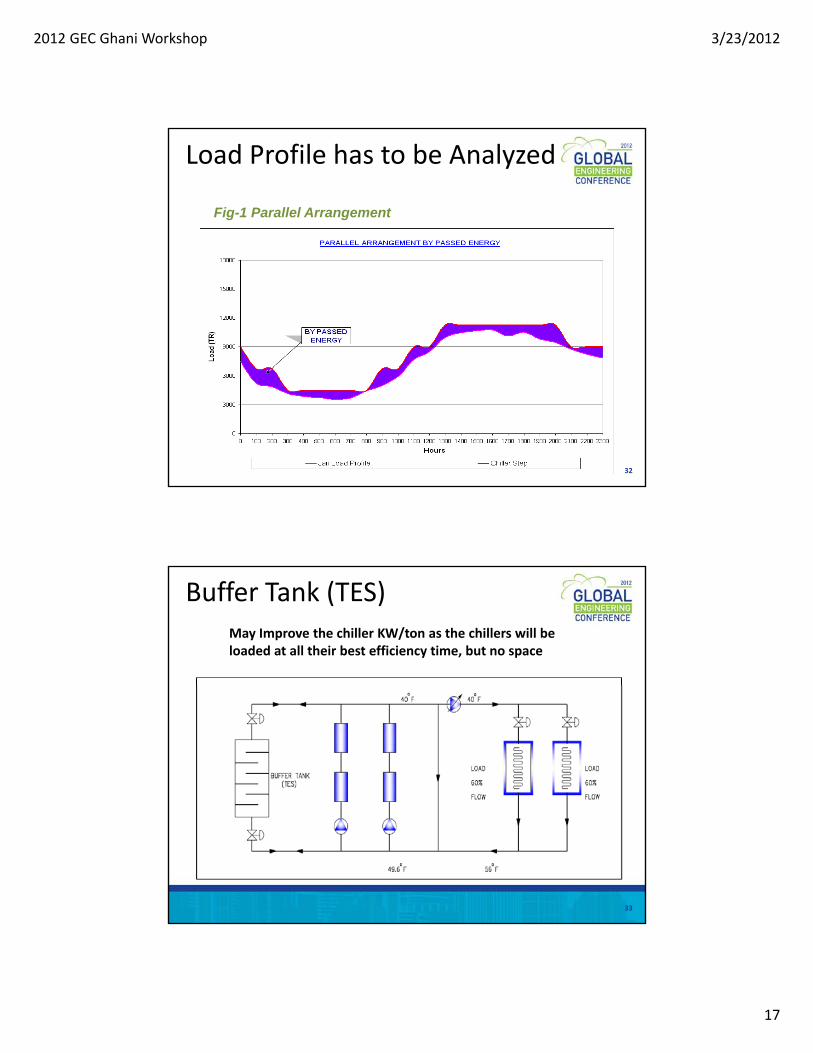
Fig-1 Parallel Arrangement
Load Profile has to be Analyzed
32
May Improve the chiller KW/ton as the chillers will be loaded at all their best efficiency time, but no space
Buffer Tank (TES)
33
2012 GEC Ghani Workshop 3/23/2012
18
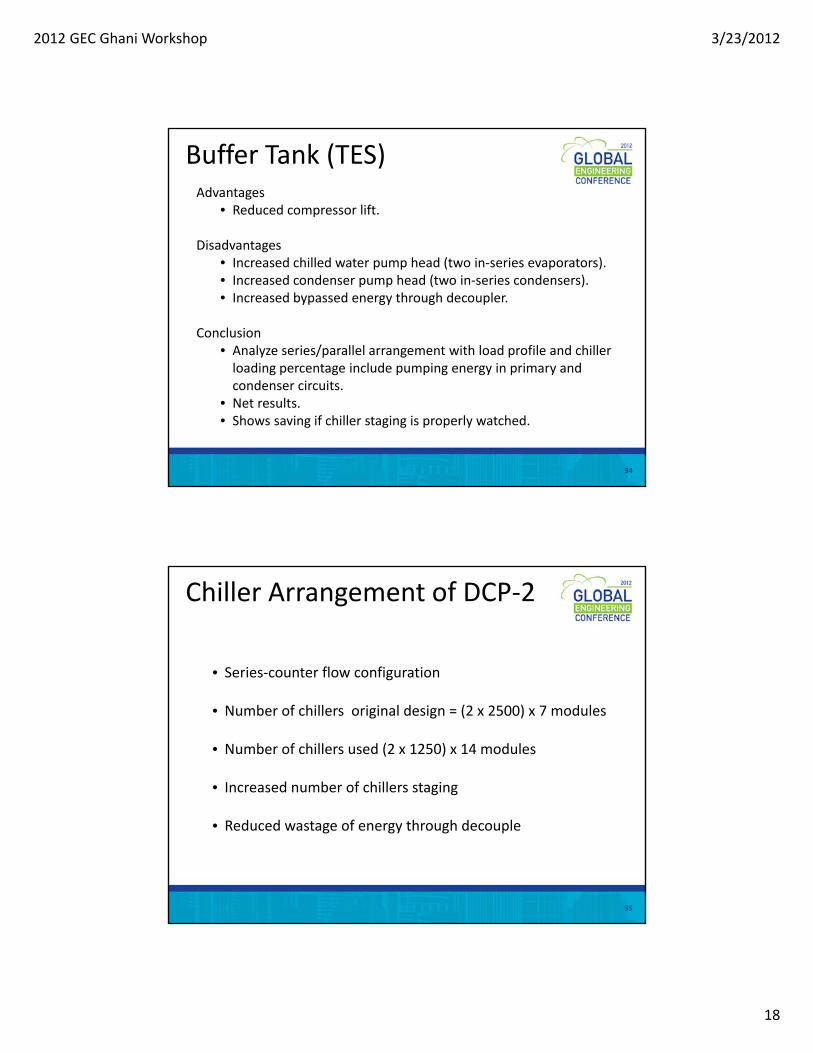
Advantages• Reduced compressor lift.
Disadvantages
Buffer Tank (TES)
Disadvantages• Increased chilled water pump head (two in‐series evaporators). • Increased condenser pump head (two in‐series condensers).• Increased bypassed energy through decoupler.
Conclusion• Analyze series/parallel arrangement with load profile and chiller loading percentage include pumping energy in primary andloading percentage include pumping energy in primary and condenser circuits.
• Net results. • Shows saving if chiller staging is properly watched.
34
• Series‐counter flow configuration
Chiller Arrangement of DCP‐2
• Number of chillers original design = (2 x 2500) x 7 modules
• Number of chillers used (2 x 1250) x 14 modules
• Increased number of chillers staging
• Reduced wastage of energy through decouple
35
2012 GEC Ghani Workshop 3/23/2012
19
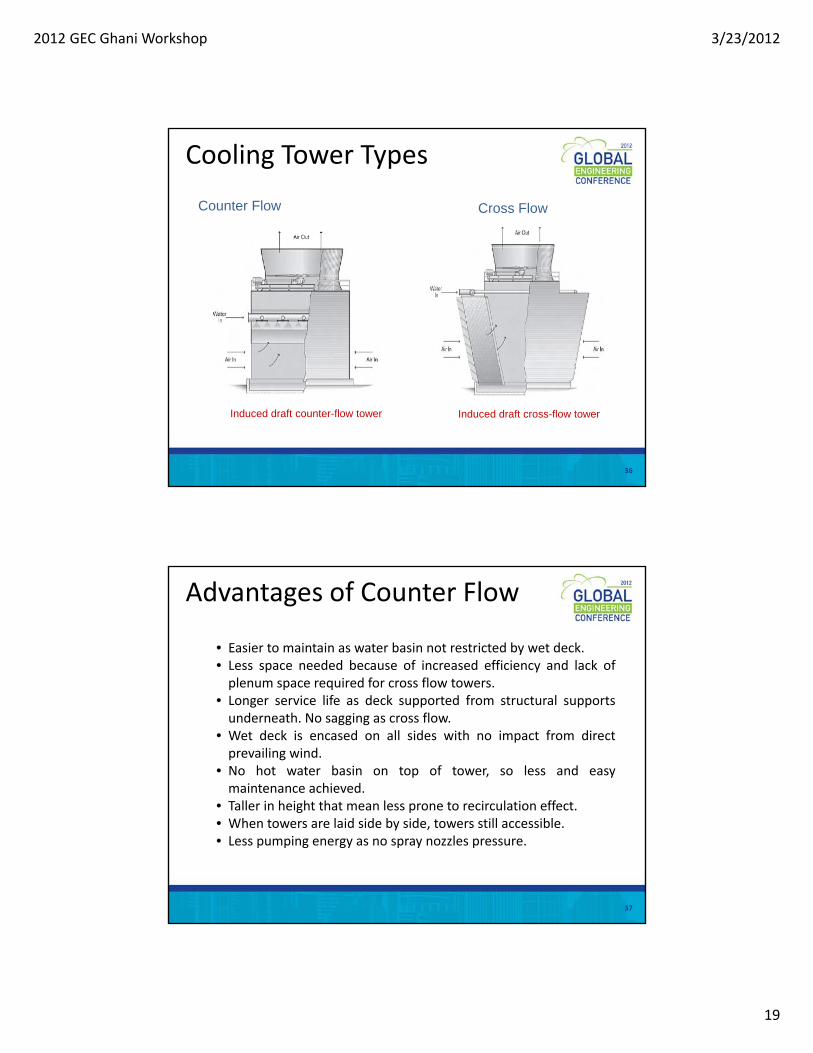
Counter Flow Cross Flow
Cooling Tower Types
Induced draft counter-flow tower Induced draft cross-flow tower
36
• Easier to maintain as water basin not restricted by wet deck.• Less space needed because of increased efficiency and lack of plenum space required for cross flow towers
Advantages of Counter Flow
plenum space required for cross flow towers.• Longer service life as deck supported from structural supports underneath. No sagging as cross flow.
• Wet deck is encased on all sides with no impact from direct prevailing wind.
• No hot water basin on top of tower, so less and easy maintenance achieved.
• Taller in height that mean less prone to recirculation effect• Taller in height that mean less prone to recirculation effect.• When towers are laid side by side, towers still accessible.• Less pumping energy as no spray nozzles pressure.
37
2012 GEC Ghani Workshop 3/23/2012
20
Wind
Vw
Discharge Vd
Plume
Vp
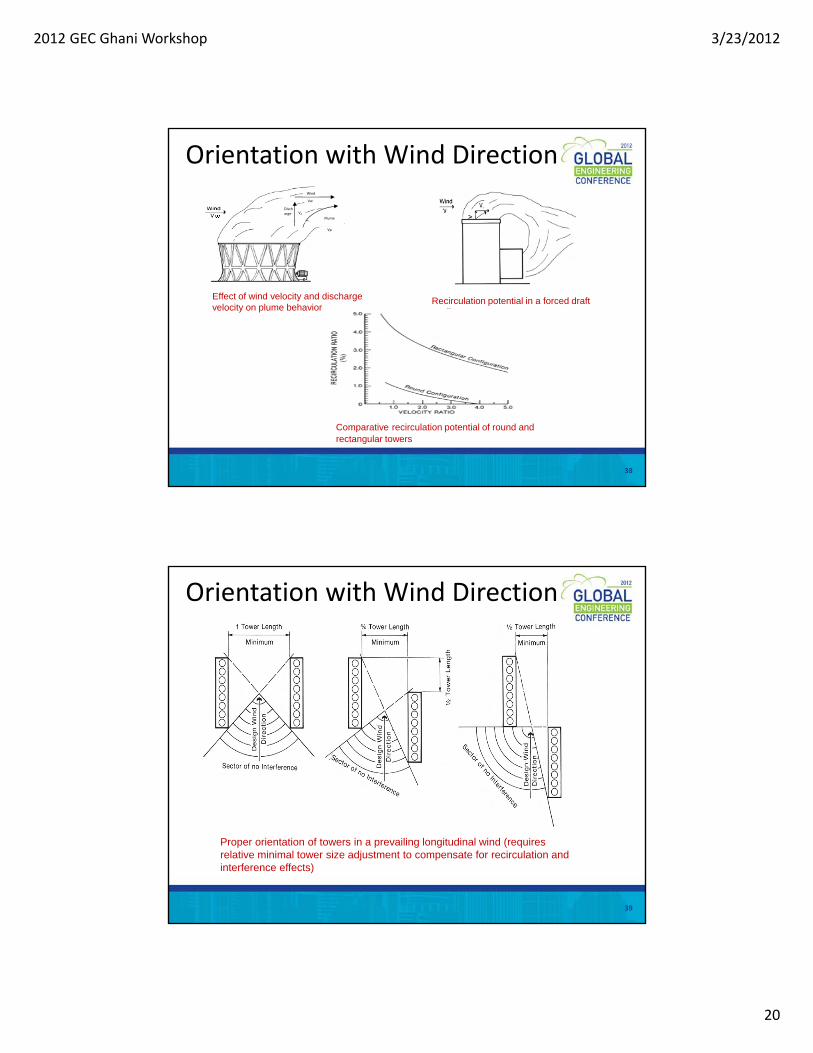
Orientation with Wind Direction
Effect of wind velocity and discharge velocity on plume behavior
Recirculation potential in a forced draft cooling tower
Comparative recirculation potential of round and rectangular towers
38
Orientation with Wind Direction
Proper orientation of towers in a prevailing longitudinal wind (requires relative minimal tower size adjustment to compensate for recirculation and interference effects)
39
2012 GEC Ghani Workshop 3/23/2012
21
For Wet Coolers
where:Humidity is expressed in absolute units of moisture content for example grains of moisture per pound of aircontent, for example, grains of moisture per pound of air.
40
• Recirculation impacts design wet bulb temp• CFDModeling
‐ Conducted to validate tower performance at prevailing wind d
For Wet Coolers
speed.• Capacity
‐ Heat rejection‐ Chiller motor cooling‐ Safety‐Design wet bulb temp. considering recirculation
• Pump NPSH‐ NPSHA > NPSHRNPSHA NPSHR
Hs + Ha ‐ Hf ‐ Hv > NPSHR
‐ Found safe‐ Other tools to overcome NPSH issues
41
2012 GEC Ghani Workshop 3/23/2012
22
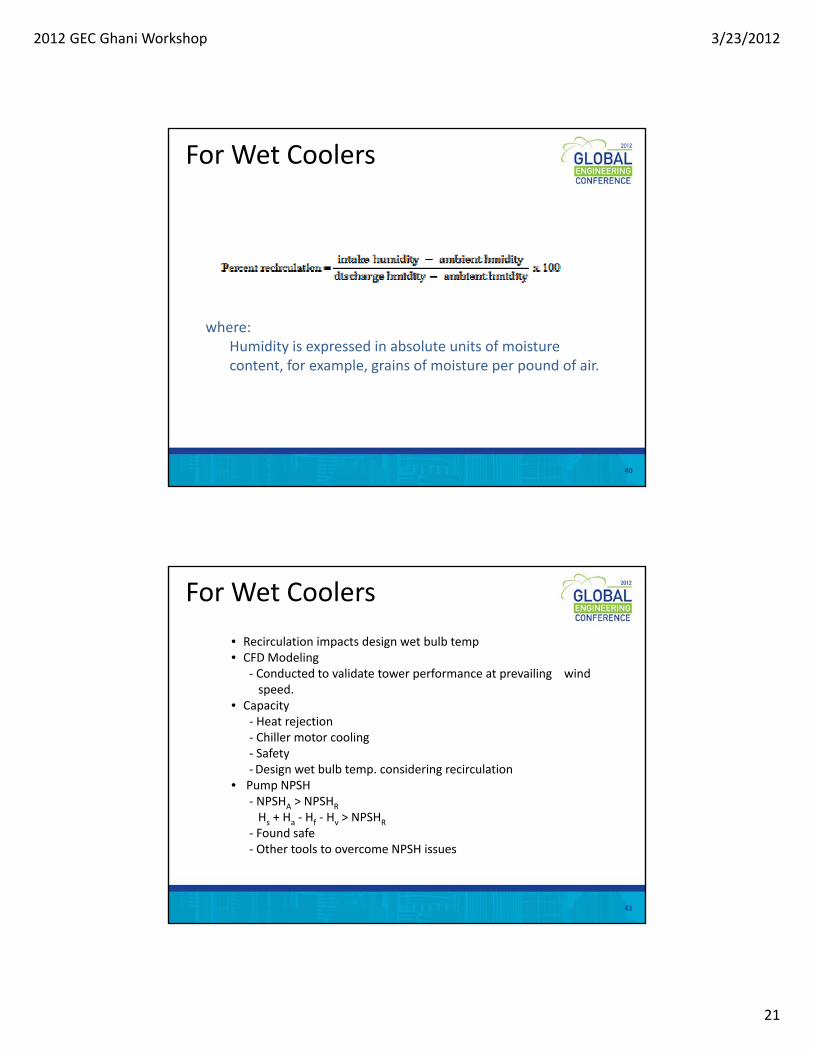
• Sand storm & development construction activity dust
For Wet Coolers
y‐ Cooling tower dirt removal
• Sweeper systems• Side stream filtration
•Ozonef• Issues & concerns of ozone
• Corrosion of steel parts (chiller marine box)
42
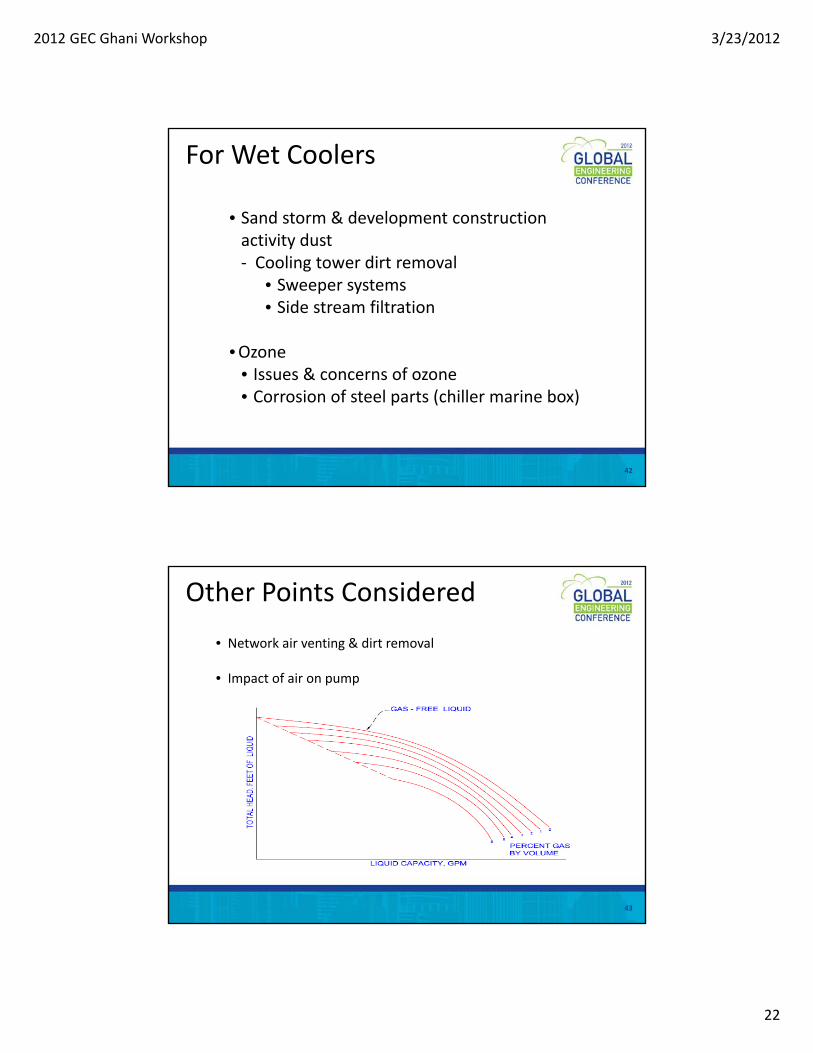
• Network air venting & dirt removal
• Impact of air on pump
Other Points Considered
p p p
43
2012 GEC Ghani Workshop 3/23/2012
23
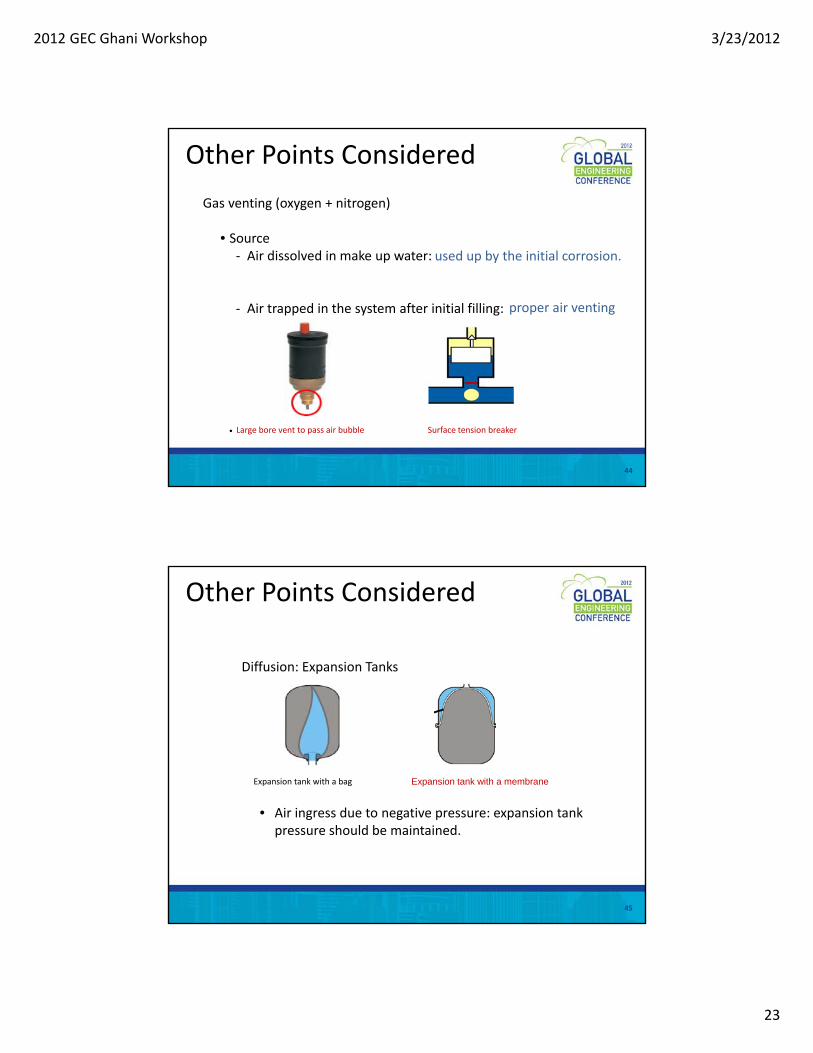
Gas venting (oxygen + nitrogen)
• Source
Other Points Considered
‐ Air dissolved in make up water:
‐ Air trapped in the system after initial filling:
used up by the initial corrosion.
proper air venting
• Large bore vent to pass air bubble Surface tension breaker
44
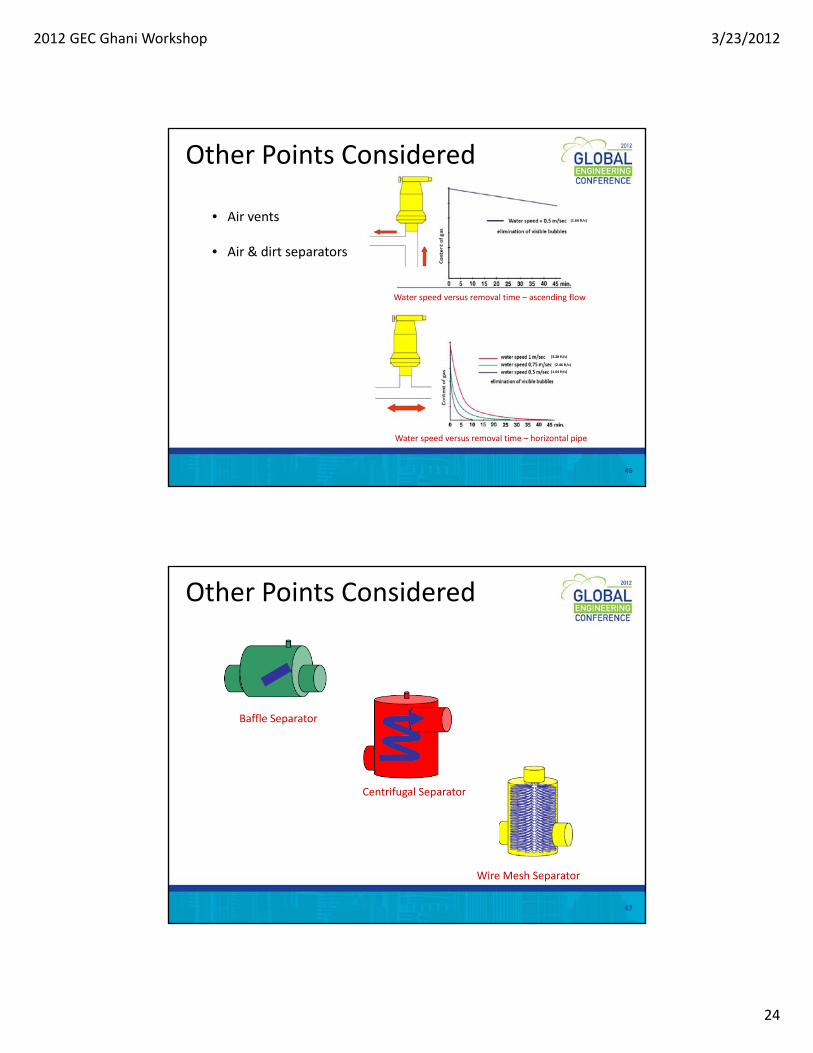
Diffusion: Expansion Tanks
Other Points Considered
Expansion tank with a bag Expansion tank with a membrane
• Air ingress due to negative pressure: expansion tank pressure should be maintained.
45
2012 GEC Ghani Workshop 3/23/2012
24
• Air vents
Ai & di
(1.64 ft/s)
Other Points Considered
• Air & dirt separators
(3.28 ft/s)
(2.46 ft/s)
Water speed versus removal time – ascending flow
(1.64 ft/s)
Water speed versus removal time – horizontal pipe
46
Other Points Considered
Baffle Separator
Centrifugal Separator
Wire Mesh Separator
47
2012 GEC Ghani Workshop 3/23/2012
25
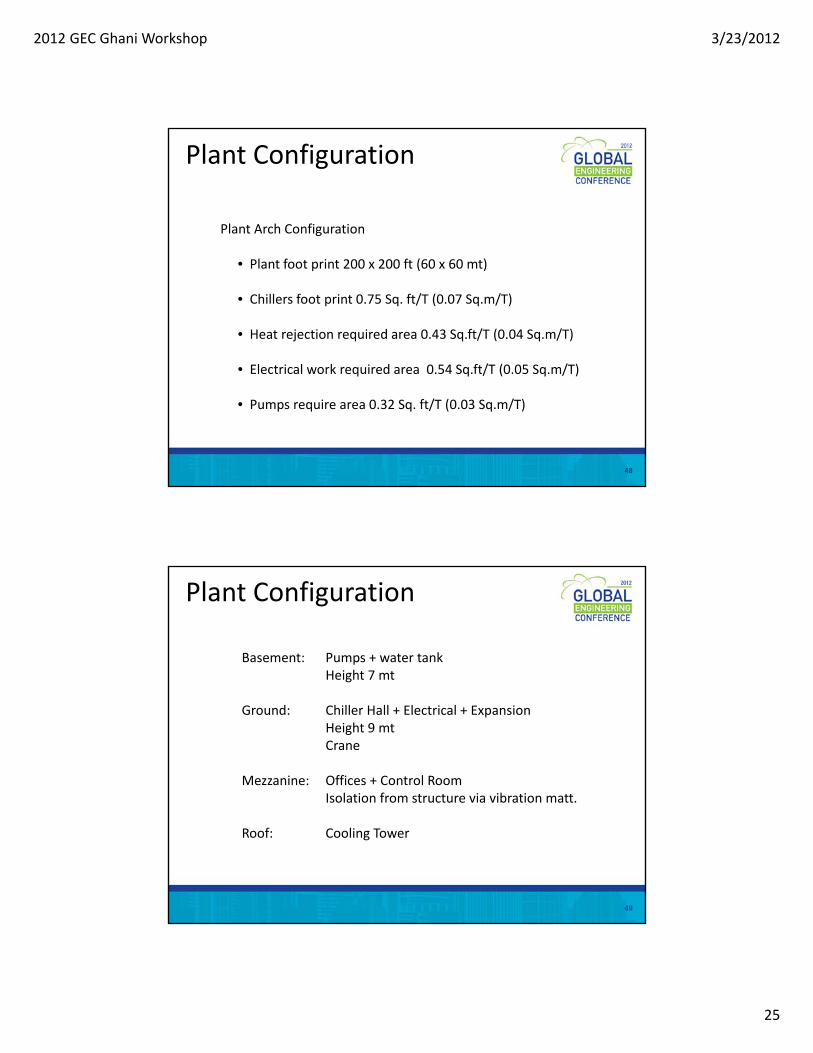
Plant Arch Configuration
Plant Configuration
• Plant foot print 200 x 200 ft (60 x 60 mt)
• Chillers foot print 0.75 Sq. ft/T (0.07 Sq.m/T)
• Heat rejection required area 0.43 Sq.ft/T (0.04 Sq.m/T)
• Electrical work required area 0 54 Sq ft/T (0 05 Sq m/T)• Electrical work required area 0.54 Sq.ft/T (0.05 Sq.m/T)
• Pumps require area 0.32 Sq. ft/T (0.03 Sq.m/T)
48
Basement: Pumps + water tankHeight 7 mt
Plant Configuration
Ground: Chiller Hall + Electrical + ExpansionHeight 9 mtCrane
Mezzanine: Offices + Control RoomIsolation from structure via vibration matt.
Roof: Cooling Tower
49
2012 GEC Ghani Workshop 3/23/2012
26
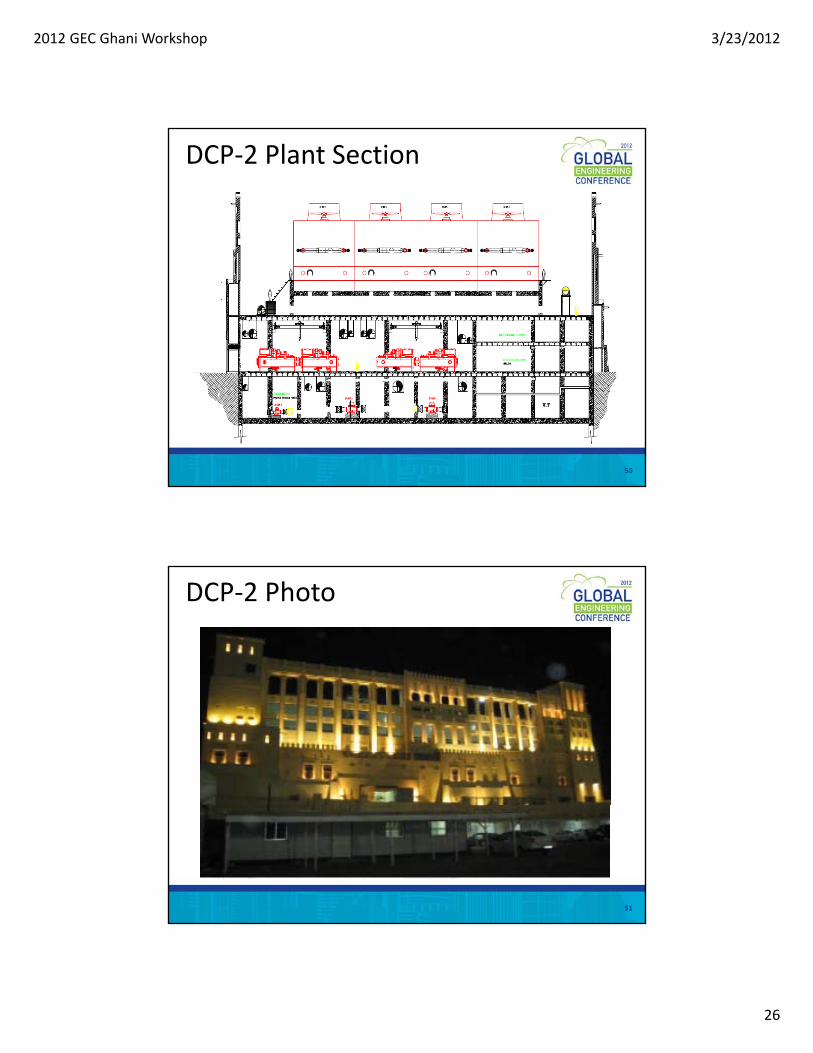
DCP‐2 Plant Section
50
DCP‐2 Photo
51
2012 GEC Ghani Workshop 3/23/2012
27
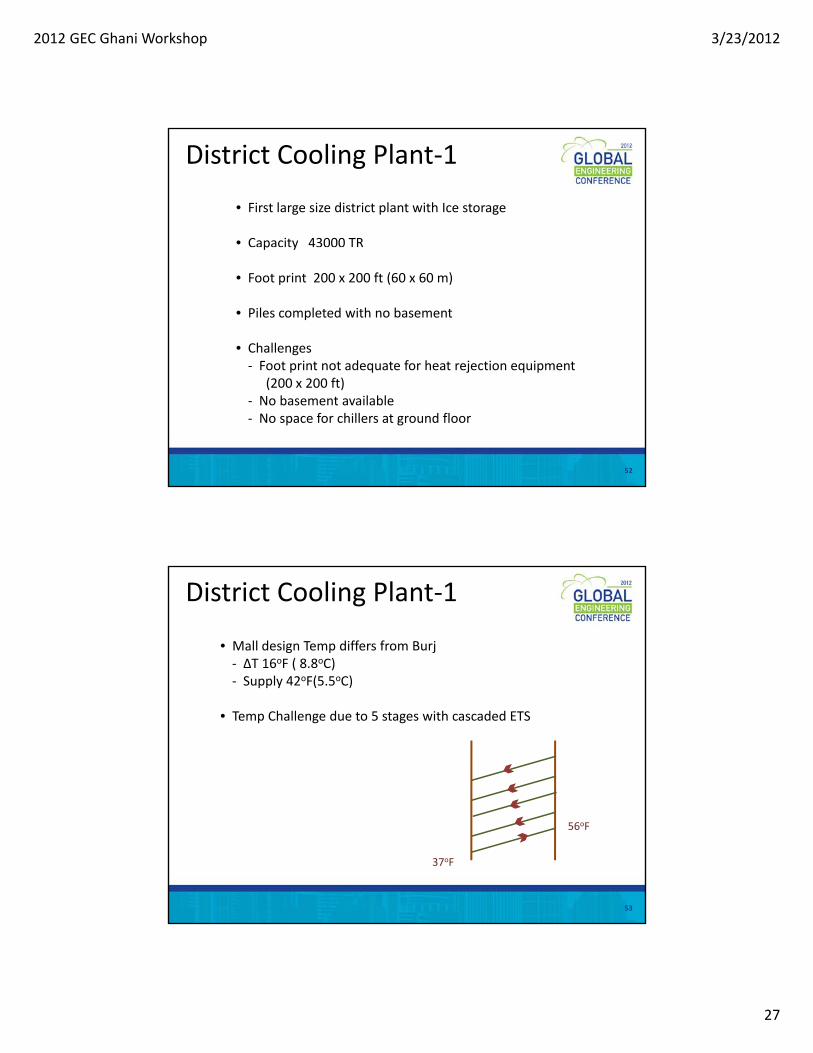
• First large size district plant with Ice storage
• Capacity 43000 TR
District Cooling Plant‐1
p y
• Foot print 200 x 200 ft (60 x 60 m)
• Piles completed with no basement
• Challenges‐ Foot print not adequate for heat rejection equipmentFoot print not adequate for heat rejection equipment
(200 x 200 ft)‐ No basement available ‐ No space for chillers at ground floor
52
• Mall design Temp differs from Burj‐ ΔT 16oF ( 8.8oC)‐ Supply 42oF(5.5oC)
District Cooling Plant‐1
Supply 42 F(5.5 C)
• Temp Challenge due to 5 stages with cascaded ETS
37oF
56oF
53
2012 GEC Ghani Workshop 3/23/2012
28
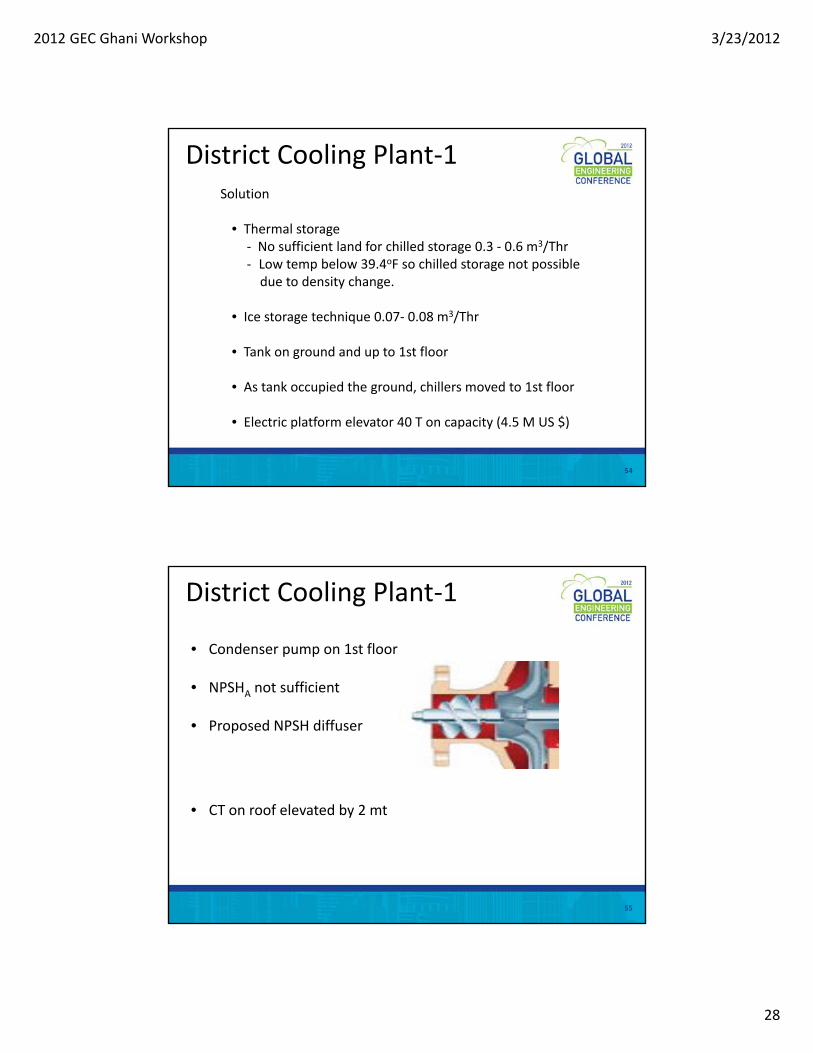
Solution
• Thermal storage ‐ No sufficient land for chilled storage 0 3 ‐ 0 6 m3/Thr
District Cooling Plant‐1
‐ No sufficient land for chilled storage 0.3 ‐ 0.6 m /Thr‐ Low temp below 39.4oF so chilled storage not possibledue to density change.
• Ice storage technique 0.07‐ 0.08 m3/Thr
• Tank on ground and up to 1st floor
• As tank occupied the ground, chillers moved to 1st floor
• Electric platform elevator 40 T on capacity (4.5 M US $)
54
• Condenser pump on 1st floor
• NPSH not sufficient
District Cooling Plant‐1
• NPSHA not sufficient
• Proposed NPSH diffuser
f l d b 2• CT on roof elevated by 2 mt
55
2012 GEC Ghani Workshop 3/23/2012
29
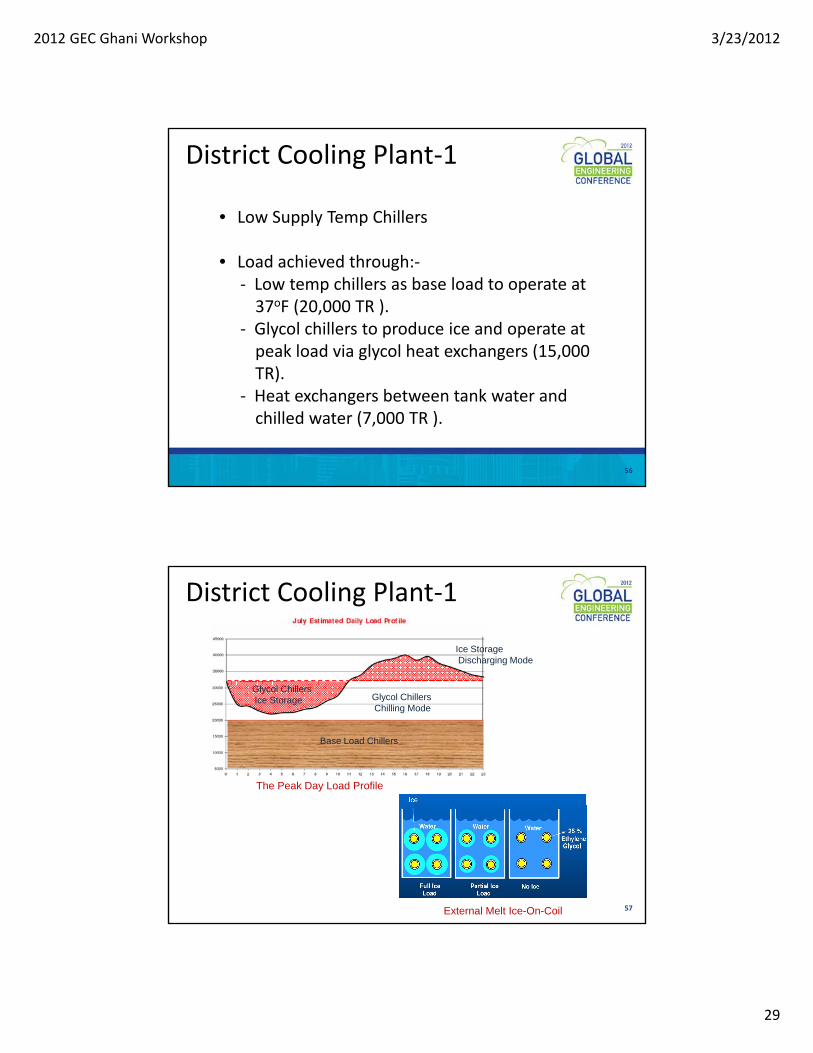
• Low Supply Temp Chillers
District Cooling Plant‐1
• Load achieved through:‐‐ Low temp chillers as base load to operate at 37oF (20,000 TR ).
‐ Glycol chillers to produce ice and operate at peak load via glycol heat exchangers (15,000
)TR).‐ Heat exchangers between tank water and chilled water (7,000 TR ).
56
Ice StorageDischarging Mode
District Cooling Plant‐1
The Peak Day Load Profile
Base Load Chillers
Glycol ChillersChilling Mode
Glycol ChillersIce Storage
External Melt Ice-On-Coil 57
2012 GEC Ghani Workshop 3/23/2012
30
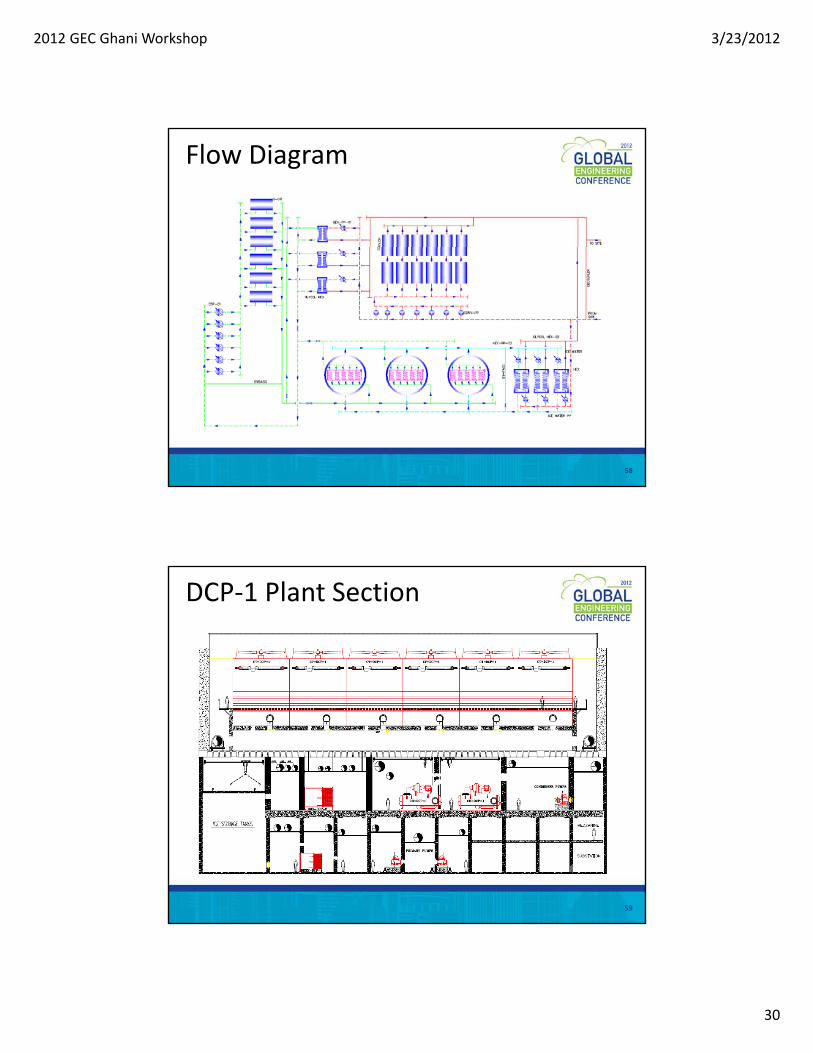
Flow Diagram
58
DCP‐1 Plant Section
59
2012 GEC Ghani Workshop 3/23/2012
31
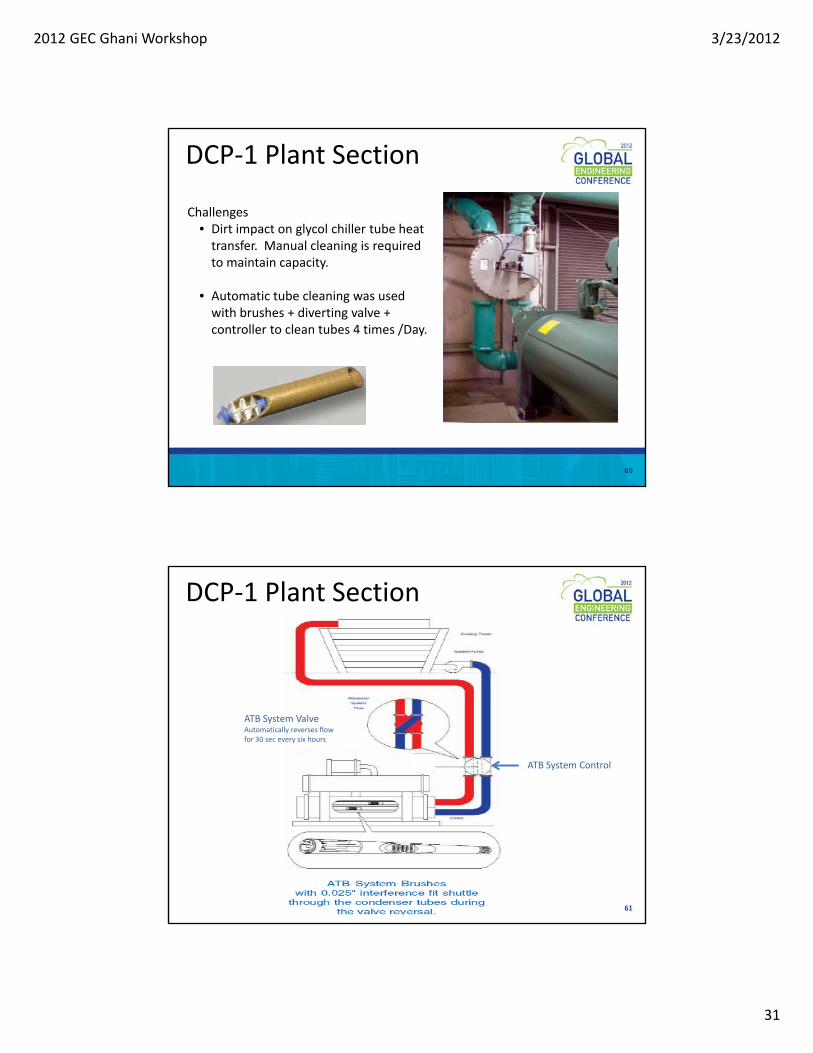
Challenges• Dirt impact on glycol chiller tube heat transfer Manual cleaning is required
DCP‐1 Plant Section
transfer. Manual cleaning is required to maintain capacity.
• Automatic tube cleaning was used with brushes + diverting valve + controller to clean tubes 4 times /Day.
60
DCP‐1 Plant Section
ATB System Control
ATB System ValveAutomatically reverses flow for 30 sec every six hours
61
2012 GEC Ghani Workshop 3/23/2012
32
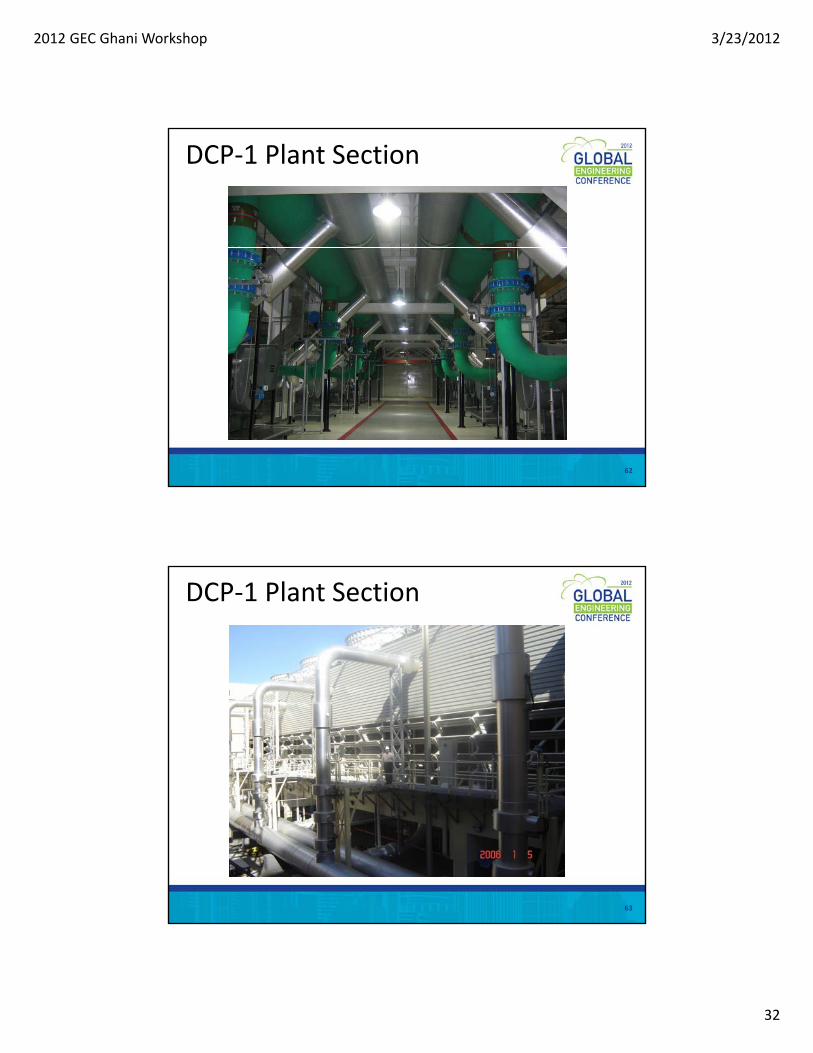
DCP‐1 Plant Section
62
DCP‐1 Plant Section
63

2012 GEC Ghani Workshop 3/23/2012
33
REMEMBER TO FILL OUT AND TURN IN THE EVALUATION FORM
Reminder: If you are registered in Florida, New York, or North Carolina, you must also sign the sheets in the back at the end of the session. Please print your name, include your registration number, and sign the sheet.
64