Embed Size (px)
Citation preview

2014 Annual Meeting of Stockholders
Dan Moore, President & Chief Executive OfficerSeptember 18, 2014

Safe Harbor Statement
2
This presentation includes forward looking statements.‐Forward looking statements may be identified by the use of forward looking terminology, including “may,” ‐ ‐“believe,” “will,” “expect,” “anticipate,” “estimate,” “plan,” “intend,” and “forecast,” or other similar words.Statements in this presentation are based on information presently available to us and assumptions that we believe to be reasonable.Investors are cautioned that all such statements involve risks and uncertainties.Forward looking statements in this presentation include statements concerning:‐
• Building stockholder value;• Achieving consistent sales and profitability targets and growth worldwide;• Achieving clinical, regulatory, product development and market development projects and goals; • Evaluating and advancing other medical device and neuroscience opportunities;• Completing the previously announced stock repurchase program; and• Fiscal guidance for fiscal year 2015.
Our actual results may differ materially.For a detailed discussion of the factors that may cause our actual results to differ, please refer to our most recent filings with the SEC, including our Annual Report on Form 10 K for the fiscal year ended April 25, ‐2014.

TOPICS
Highlights
FY2014 and FY2015 Q1 Overview— Sales— Financials
Strategic Focus Update
FY2015 Guidance
3

Highlight: Building Stockholder Value
4
4/24/09 4/30/10 4/29/11 4/27/12 4/26/13 4/25/14$0
$50
$100
$150
$200
$250
$300
$350
$400
$450
$500
COMPARISON OF 5 YEAR CUMULATIVE TOTAL RETURN*Among Cyberonics, Inc., the S&P 500 Index, and the S&P Health Care
Equipment Index
Cyberonics, Inc. S&P 500 S&P Health Care Equipment
*$100 invested on 4/24/09 in stock or 4/30/09 in index, including reinvestment of dividends. Indexes calculated on month-end basis.
Copyright© 2014 S&P, a division of The McGraw-Hill Companies Inc. All rights reserved.

Highlight: Building Shareholder Value
5
FY08 FY09 FY10 FY11 FY12 FY13 FY14($15)
$10
$35
$60
$85
$110
$135
$160
$185
$210
$235
$260
$285
$310
Net Sales Income from Operations Loss from Operations
$ in
Mill
ios
Adjusted non-GAAP income from operations for FY12 and FY14

6
FY2014 Annual Highlights
Net Sales $282 million 11%
U.S. Epilepsy sales $224 million 8%
International Epilepsy sales $55 million 25%
Adjusted Operating Income $87 million 12%
Adjusted EBITDA $104 million 10%
Adjusted Earnings per diluted share $2.04 17%
• Strong and consistent growth
* On a constant currency basis, international epilepsy sales revenue increased by 23%
** The company refers and makes comparisons to non-GAAP financial measures in this presentation: adjusted operating income, adjusted EBITDA and adjusted earnings per diluted share. Investors should consider non-GAAP measures in addition to, and not as a substitute for or superior to, financial performance measures prepared in accordance with GAAP. Please refer to the attached reconciliation between GAAP and non-GAAP measures for operating income, adjusted EBITDA, and adjusted earnings per share included in this presentation and in our earnings release dated June 4, 2014.
*
**
**
**

FY2015 Q1 Highlights
7
* The company refers and makes comparisons to non-GAAP financial measures in this presentation: adjusted income from operations, adjusted EBITDA, adjusted net income and adjusted income per diluted share. Investors should consider non-GAAP measures in addition to, and not as a substitute for or superior to, financial performance measures prepared in accordance with GAAP. Please refer to the reconciliation between GAAP and non-GAAP measures for adjusted income from operations, adjusted EBITDA, adjusted net income and adjusted Income per diluted share included in our earnings release dated August 21, 2014.
• Continued growth and leverage
Net Product Sales $72 million 7%
U.S. $59 million 4%
International $13 million 19%
Operating Income $22 million 12%
Adjusted EBITDA $27 million 12%
Adjusted Income per diluted share $0.53 18%
*
*
*
• Regulatory submission of ProGuardianREST™ System for FDA approval• Vitaria™ generator clinical module submitted (chronic heart failure)
• First regulatory approvals for the new manufacturing facility in Costa Rica

Sales
8

FY2014 and FY2015 Q1 Net Sales
9
• Strong international growth% Change
U.S. 56,358 57,882 53,020 58,194 58,838 4.4%International 11,047 12,219 13,071 14,009 13,166 19.2%
$67,404 $70,101 $66,091 $72,203 $72,004 6.8%
Single Country Order 2,100 2,646
Net Product Sales $67,404 $70,101 $68,191 $74,849 $72,004 6.8%
Licensing Total 1,468
Net Sales Total $68,872 $70,101 $68,191 $74,849 $72,004 4.5%
Q1 FY15 vs. Q1 FY14
Q1
FY 2015
Q1 Q2 Q3 Q4
FY 2014
*On a constant currency basis, international sales revenue grew by 14.5%
- Numbers in $000s- Represents revenue from sales of generators, leads, and other related devices
*

Continued Worldwide Net Product Sales Growth
10
- Represents revenue from sales of generators, leads, and other related devices
$72M
$10.0
$20.0
$30.0
$40.0
$50.0
$60.0
$70.0
Q1 Q2 Q3 Q4
Net
Pro
duct
Sal
es($
mill
ion)
• Year-over-year sales increases for the 25th consecutive quarter

FY2014 and FY2015 Q1 Unit Sales
11
% Change
U.S. 2,455 2,518 2,259 2,482 2,500 1.8%International 899 978 1,050 1,115 1,024 13.9%
3,354 3,496 3,309 3,597 3,524 5.1%
Single Country Order 100 126
Unit Sales Total 3,354 3,496 3,409 3,723 3,524 5.1%
Q1 FY15 vs. Q1 FY14
Q2 Q3 Q4 Q1Q1
FY 2014 FY 2015
• Strong international growth

Consistent U.S. ASP Growth for Generators
12
$20,418
• Increase of 3% over Q1 prior year
$10,000
$12,000
$14,000
$16,000
$18,000
$20,000
Q1 Q2 Q3 Q4
ASP
of U
.S. G
ener
ator
s

Financial Results
13

FY2014 Financial Results
14
FY14 FY13
NET SALES 282,014$ 254,320$ 27,694$ 10.9%
GROSS PROFIT 254,659$ 232,413$ 22,246$ 9.6%
GROSS PROFIT % 90.3% 91.4% (1.1%)
OPERATING EXPENSES
SG&A 120,642$ 112,515$ 8,127$ 7.2%
R&D 46,563$ 41,551$ 5,011$ 12.1%
Litigation 7,443$
TOTAL OPERATING EXPENSES 174,648$ 154,067$ 20,581$ 13.4%
INCOME FROM OPERATIONS 80,012$ 78,346$ 1,665$ 2.1%
OTHER EXPENSE, NET 133 3,072 (2,939)$
INCOME BEFORE INCOME TAXES 79,879$ 75,275$ 4,604$ 6.1%
INCOME TAX EXPENSE 24,988 28,917 (3,929)$ (13.6%)
NET INCOME 54,890$ 46,358$ 8,533$ 18.4%
Diluted Income per Share $2.00 $1.66 $0.34 20.5%
Outstanding Shares
Diluted 27,466 28,009 (543) (1.9%)
FY14 vs. FY13
- All numbers in $000s except for income per share
• Consistent revenue growth and gross profit margins

Reconciliation of Non-GAAP Financial Measures for FY2014
15
FY14 FY13
Operating Income 80,012$ 78,346$ 1,665$ 2.1%
Litigation settlement 7,443 -
Adjusted Operating Income 87,455$ 78,346$ 9,108$ 11.6%
Net Income 54,890$ 46,358$ 8,533$ 18.4%
Gain on warrants' liability (1,326)
Impairment of investment 3,812
Litigation Settlement 4,776 -
Discrete tax item (3,534) - Adjusted non-GAAP Net Income 56,133$ 48,844$ 7,289$ 14.9%
Diluted income per share 2.00$ 1.66$ 0.34$ 20.5%
Gain on warrants' liability (0.05)Impairment of investment 0.13
Litigation Settlement 0.17 -
Discrete tax item (0.13) - Adjusted non-GAAP diluted income per share 2.04$ 1.74$ 0.30$ 17.2%
FY14 vs. FY13
All numbers in 000s except for earnings per share

FY2015 Q1 Financial Results*
16
- All numbers in $000s except for income per share
* Please refer to the reconciliation between GAAP and non-GAAP measures for adjusted income from operations, adjusted EBITDA, adjusted net income and adjusted income per diluted share included in our earnings release dated August 21, 2014.
Q1 FY15 Q1 FY14
Net Sales $72,004 $68,872 4.5 %
Gross Profit 65,594 62,328 5.2 %Gross Profit % 91.1% 90.5%
SG&A 33,028 29,306 12.7 %R&D 10,563 11,975 (11.8)%Litigation settlement - 7,443
Total Operating Expenses 43,590 48,724 (10.5)%
Income From Operations $22,003 $13,604 61.7 %
Income tax expense 8,694 4,843 79.5 %
Net Income $13,519 $8,674 55.9 %
Outstanding shares - diluted 26,915 27,845 (3.3)%
Diluted income per share $0.50 $0.31 61.3 %
% Change

Reconciliation of Non-GAAP Financial Measures
17
- All numbers in $000s except for income per share
Q1 FY15 Q1 FY14
Income from operations $22,003 $13,604 61.7%Litigation settlement 7,443 License fee (1,468)
Adjusted non-GAAP income from operations $22,003 $19,579 12.4%
Net income $13,519 $8,674 55.9%Income tax adjustment 588 Benefit assumed from extension of R&D tax credit 217 Litigation settlement, net of tax 4,776 License fee, net of tax (921)
Adjusted non-GAAP net income $14,324 $12,529 14.3%
Diluted income per share $0.50 $0.31 61.3%Income tax adjustment 0.02 Benefit assumed from extension of R&D tax credit 0.01 Litigation settlement, net of tax 0.17 License fee, net of tax (0.03)
Adjusted non-GAAP diluted income per share $0.53 $0.45 17.8%
% change
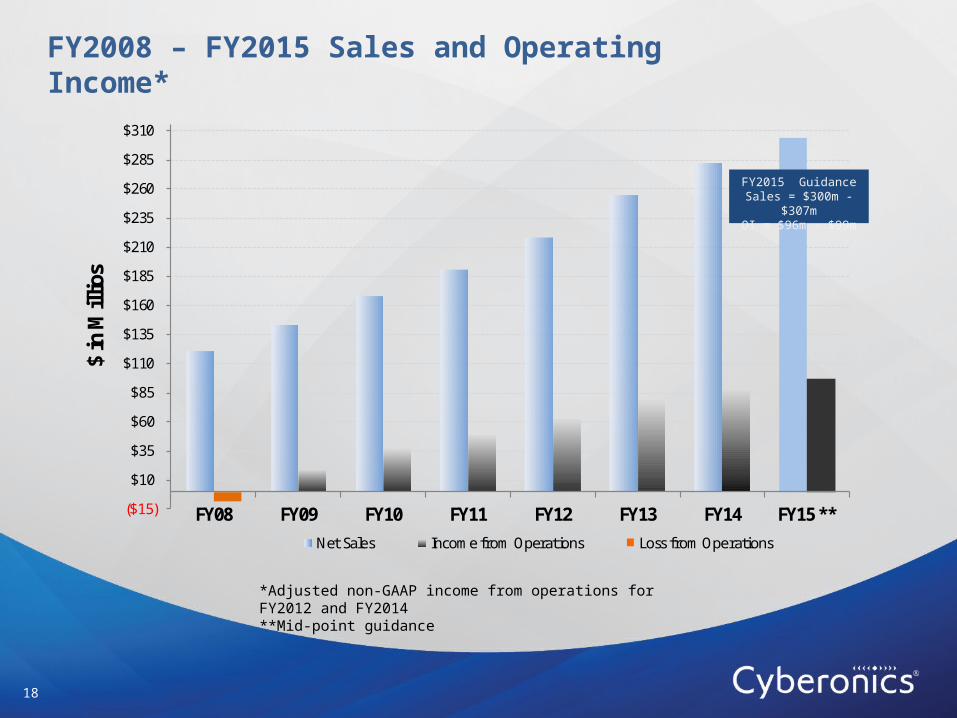
18
*Adjusted non-GAAP income from operations for FY2012 and FY2014**Mid-point guidance
FY2008 – FY2015 Sales and Operating Income*
($15)
$10
$35
$60
$85
$110
$135
$160
$185
$210
$235
$260
$285
$310
FY08 FY09 FY10 FY11 FY12 FY13 FY14 FY15 **
$ in
Mill
ios
Net Sales Income from Operations Loss from Operations
FY2015 GuidanceSales = $300m - $307m
OI = $96m - $99m

Strategic Focus
19

FY2014 Goals – Results
20
Build shareholder value through:
Continued leadership in epilepsy medical devices
Consistent sales & profitability growth worldwide
Achieving clinical & product development milestones
EU regulatory approval of the AspireSR® generatorEnrollment completed for AspireSR® E-37 clinical study
Evaluating & advancing other neuroscience opportunities
Apnex asset purchase (obstructive sleep apnea)Increased investments in Imthera™ & cerbomed

FY2015 Goals Update
21
Build shareholder value through:
Continued leadership in epilepsy medical devices
Consistent sales and profitability growth worldwide
Achieving clinical and product development milestones
ProGuardianREST™ regulatory submissionsCentro™ generator regulatory submissionsAspireSR® generator U.S. regulatory progress
Evaluating and advancing other neuroscience opportunitiesVitaria™ generator regulatory submission in Europe

Other Cyberonics Neuroscience Initiatives
• Other VNS Therapy indications— Chronic Heart Failure (CHF)
• Other neuroscience opportunities— ImThera for OSA
22
24 agreements with 19 partners

Fiscal FY2015 Guidance
23
$300 million - $307 millionNet Sales
$96 million - $99 millionIncome from Operations
$62 million - $64 millionAdjusted Net Income
$2.33 - $2.39Adjusted EPS

24

Investment Thesis
LEADERSHIP • Consistently met goals• Investing for global growth
STRATEGY • Focus on epilepsy market potential• Disciplined investing in other device opportunities
INNOVATION • Fueling growth through product development • Advancing patient care through innovation • Diversifying the epilepsy portfolio
COMMERCIALIZATION • Experienced team and strong track record• Accelerating new patient growth• Significant recurring revenue
EXPERIENCE • Strong patient satisfaction• >100,000 implants and >500,000 years of patient experience• >3,000 physicians using VNS Therapy®
FINANCIAL HIGHLIGHTS • Leveraging the income statement for consistent growth• Strong balance sheet• Focus on shareholder value
25

Q&A
26


![Margaret moore [warrior] - 14 - guerreiro em missão - margaret moore](https://img.pdfslide.tips/doc/110x75/55905a821a28ab7a208b459c/margaret-moore-warrior-14-guerreiro-em-missao-margaret-moore.jpg)