Embed Size (px)
Citation preview
2014 Annual Results Presentation
China Pacific Insurance (Group) Co., Ltd.
March 30, 2015
砥砺前行 Forging Ahead
These materials are for information purposes only and do not constitute or form part of an offer or
invitation to sell or issue or the solicitation of an offer or invitation to buy or subscribe for securities of
China Pacific Insurance (Group) Co., Ltd. (the “Company”) or any holding company or any of its
subsidiaries in any jurisdiction. No part of these materials shall form the basis of or be relied upon in
connection with any contract or commitment whatsoever.
The information contained in these materials has not been independently verified. No representation or
warranty expressed or implied is made as to, and no reliance should be placed on, the fairness,
accuracy, completeness or correctness of such information or opinions contained herein. The
information and opinions contained in these materials are provided as of the date of the presentation,
are subject to change without notice and will not be updated or otherwise revised to reflect any
developments, which may occur after the date of the presentation. The Company nor any of its
respective affiliates or any of its directors, officers, employees, advisers or representatives shall have
any liability whatsoever (in negligence or otherwise) for any loss howsoever arising from any
information contained or presented in these materials or otherwise arising in connection with these
materials.
These materials contain statements that reflect the Company’s current beliefs and expectations about
the future as of the respective dates indicated herein. These forward-looking statements are based on
a number of assumptions about the Company’s operations and factors beyond the Company’s control
and are subject to significant risks and uncertainties, and, accordingly, actual results may differ
materially from these forward-looking statements. You should not place undue reliance on any forward-
looking information. The Company assumes no obligations to update or otherwise revise these
forward-looking statements for new information, events or circumstances that occur subsequent to
such dates.
Disclaimer
2
3
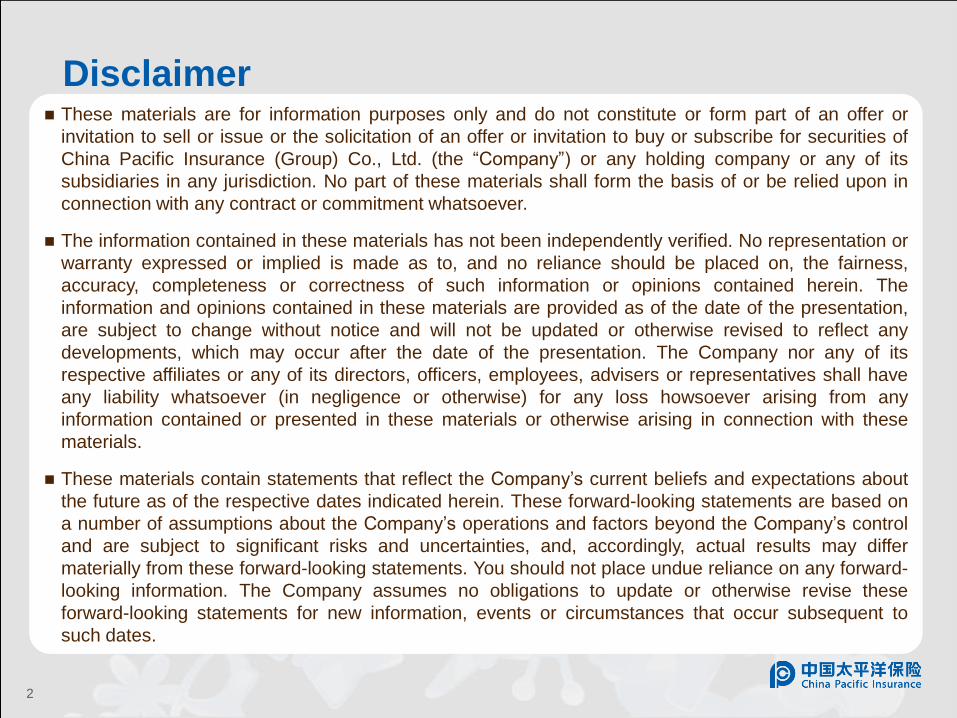
Optimising Insurance-based Portfolio
Government policies such as Opinions on Accelerating the Development of Modern
Insurance Industry and Opinions on Accelerating the Development of Commercial
Health Insurance present an important window of opportunity for insurance, and in
particular, for pension, health and agricultural insurance.
Provides professional health products and
services to mid and high-end customers
Enhances resources-sharing with other
subsidiaries of CPIC Group
Strengthens our capabilities, expertise and
competitive edge in agricultural insurance
Provides professional care to mid and high-
end customers
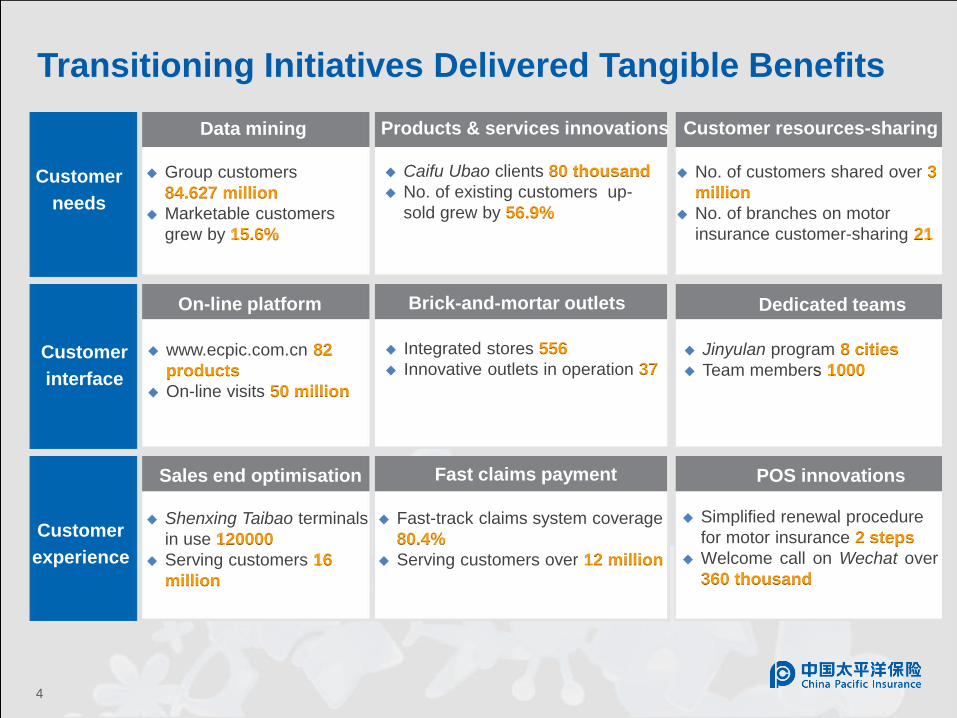
Customer
needs
Customer
interface
Customer
experience
Data mining
Group customers
84.627 million
Marketable customers
grew by 15.6%
Products & services innovations
Caifu Ubao clients 80 thousand
No. of existing customers up-
sold grew by 56.9%
Customer resources-sharing
No. of customers shared over 3
million
No. of branches on motor
insurance customer-sharing 21
On-line platform Brick-and-mortar outlets Dedicated teams
www.ecpic.com.cn 82
products
On-line visits 50 million
Integrated stores 556
Innovative outlets in operation 37 Jinyulan program 8 cities
Team members 1000
Sales end optimisation Fast claims payment POS innovations
Shenxing Taibao terminals
in use 120000
Serving customers 16
million
Fast-track claims system coverage
80.4%
Serving customers over 12 million
Simplified renewal procedure
for motor insurance 2 steps
Welcome call on Wechat over
360 thousand
4
Transitioning Initiatives Delivered Tangible Benefits
5
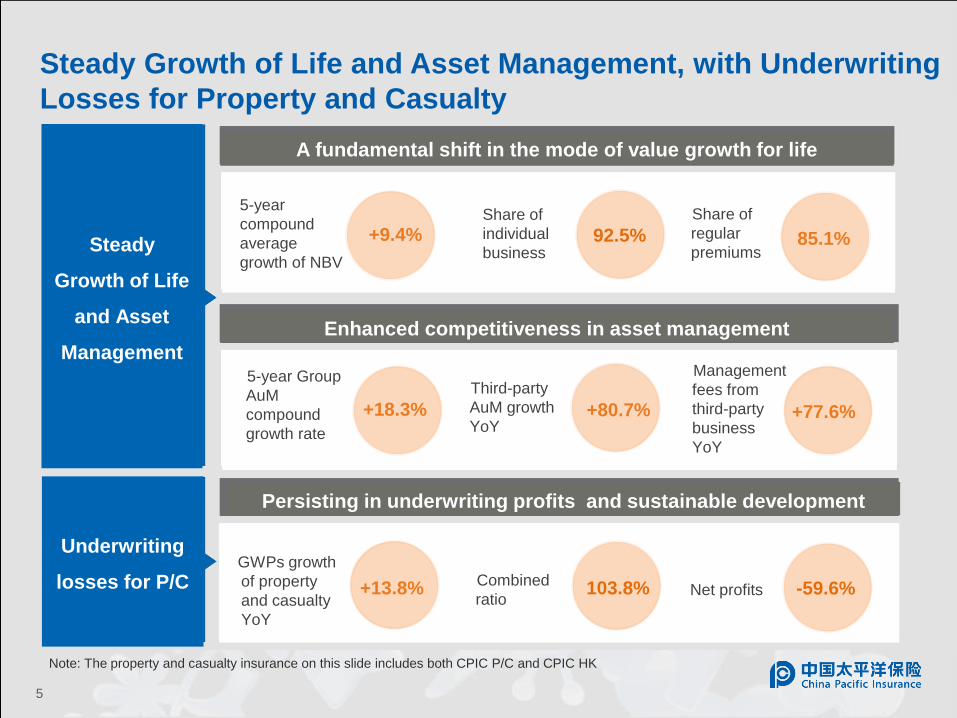
5-year
compound
average
growth of NBV
92.5% 85.1%
5-year Group
AuM
compound
growth rate
+18.3% +80.7% +77.6%
Combined
ratio
Share of
individual
business
Share of
regular
premiums
Third-party
AuM growth
YoY
Management
fees from
third-party
business
YoY
GWPs growth
of property
and casualty
YoY
Net profits
Steady
Growth of Life
and Asset
Management
A fundamental shift in the mode of value growth for life
Enhanced competitiveness in asset management
Persisting in underwriting profits and sustainable development
Note: The property and casualty insurance on this slide includes both CPIC P/C and CPIC HK
Underwriting
losses for P/C
+9.4%
+13.8% 103.8% -59.6%
Steady Growth of Life and Asset Management, with Underwriting
Losses for Property and Casualty
6
Performance Analysis
7
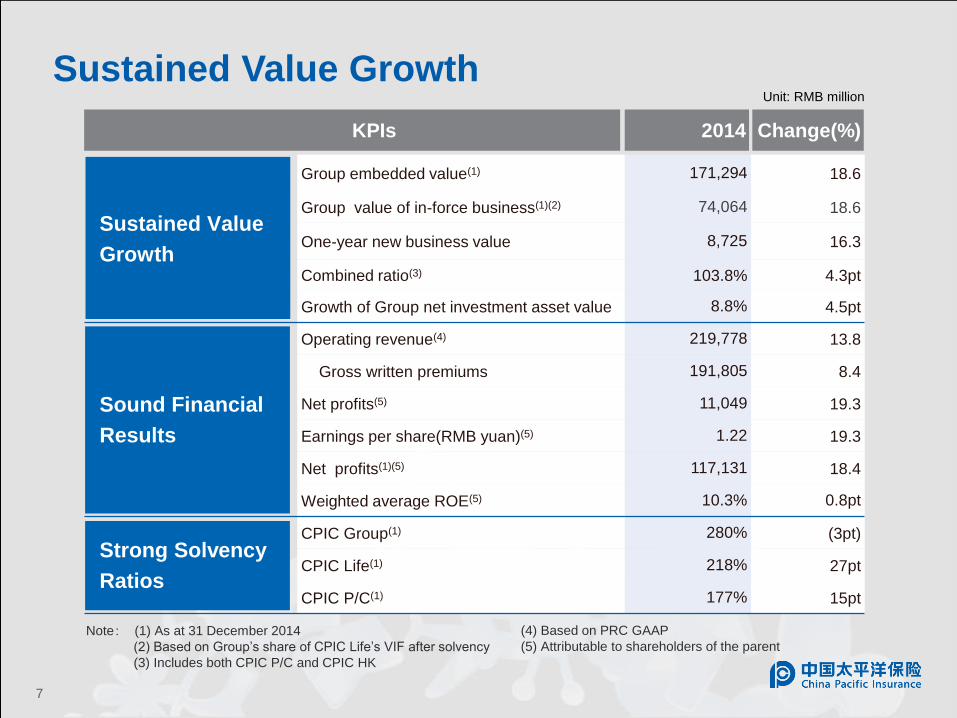
Sustained Value Growth Unit: RMB million
KPIs 2014 Change(%)
Sustained Value
Growth
Group embedded value(1) 171,294 18.6
Group value of in-force business(1)(2) 74,064 18.6
One-year new business value 8,725 16.3
Combined ratio(3) 103.8% 4.3pt
Growth of Group net investment asset value 8.8% 4.5pt
Sound Financial
Results
Operating revenue(4) 219,778 13.8
Gross written premiums 191,805 8.4
Net profits(5) 11,049 19.3
Earnings per share(RMB yuan)(5) 1.22 19.3
Net profits(1)(5) 117,131 18.4
Weighted average ROE(5) 10.3% 0.8pt
Strong Solvency
Ratios
CPIC Group(1) 280% (3pt)
CPIC Life(1) 218% 27pt
CPIC P/C(1) 177% 15pt
Note: (1) As at 31 December 2014
(2) Based on Group’s share of CPIC Life’s VIF after solvency
(3) Includes both CPIC P/C and CPIC HK
(4) Based on PRC GAAP
(5) Attributable to shareholders of the parent
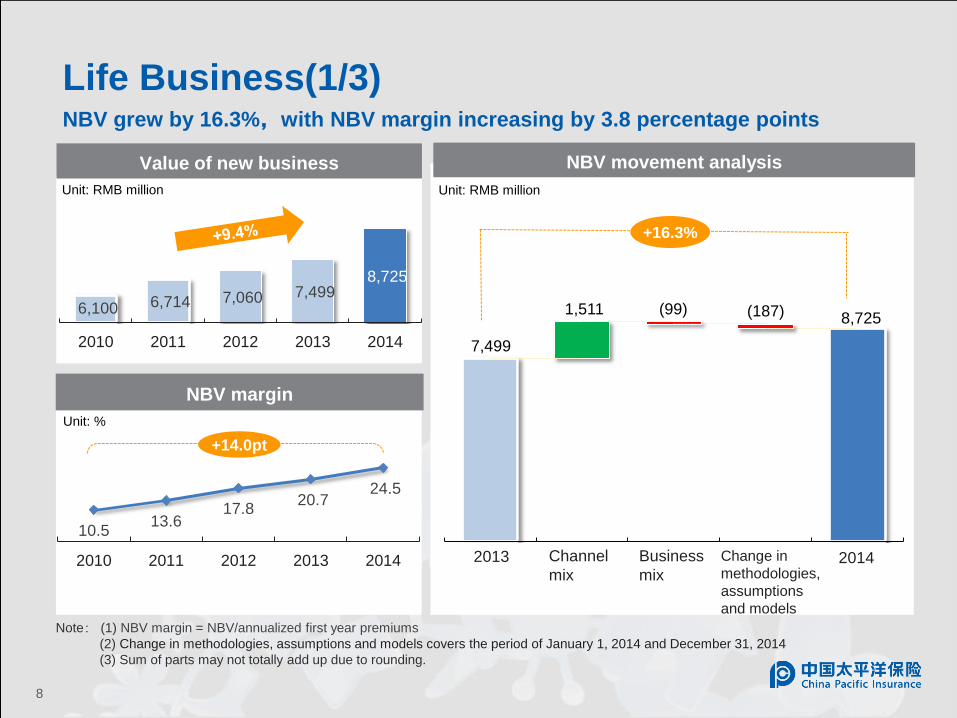
10.5 13.6
17.8 20.7
24.5
2010 2011 2012 2013 2014
7,499
1,511 (99) (187) 8,725 6,100 6,714 7,060 7,499
8,725
2010 2011 2012 2013 2014
NBV movement analysis
Life Business(1/3) NBV grew by 16.3%,with NBV margin increasing by 3.8 percentage points
Unit: RMB million
+16.3%
Value of new business
Unit: RMB million
Note: (1) NBV margin = NBV/annualized first year premiums
(2) Change in methodologies, assumptions and models covers the period of January 1, 2014 and December 31, 2014
(3) Sum of parts may not totally add up due to rounding.
2013 Channel
mix
Business
mix
Change in
methodologies,
assumptions
and models
2014
8
NBV margin
Unit: %
+14.0pt
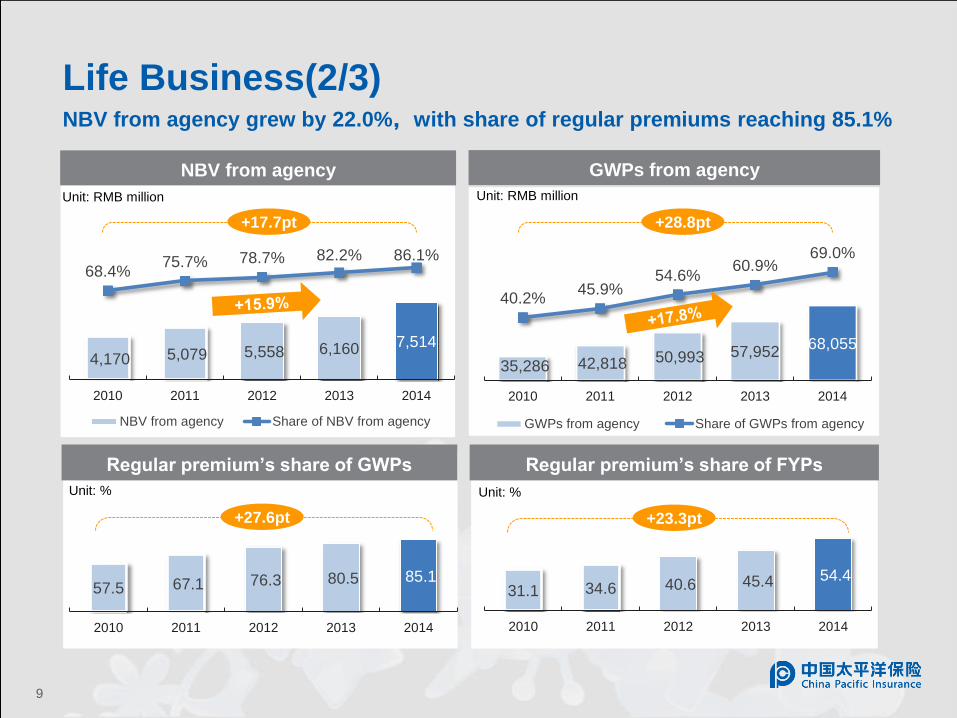
35,286 42,818 50,993 57,952 68,055
40.2% 45.9%
54.6% 60.9%
69.0%
2010 2011 2012 2013 2014
GWPs from agency Share of GWPs from agency
57.5 67.1 76.3 80.5 85.1
2010 2011 2012 2013 2014
Life Business(2/3)
NBV from agency grew by 22.0%,with share of regular premiums reaching 85.1%
4,170 5,079 5,558 6,160 7,514
68.4% 75.7% 78.7% 82.2% 86.1%
2010 2011 2012 2013 2014
NBV from agency Share of NBV from agency
NBV from agency GWPs from agency
Unit: RMB million Unit: RMB million
Regular premium’s share of GWPs
Unit: %
Regular premium’s share of FYPs
31.1 34.6 40.6 45.4 54.4
2010 2011 2012 2013 2014
Unit: %
+17.7pt +28.8pt
+27.6pt +23.3pt
9
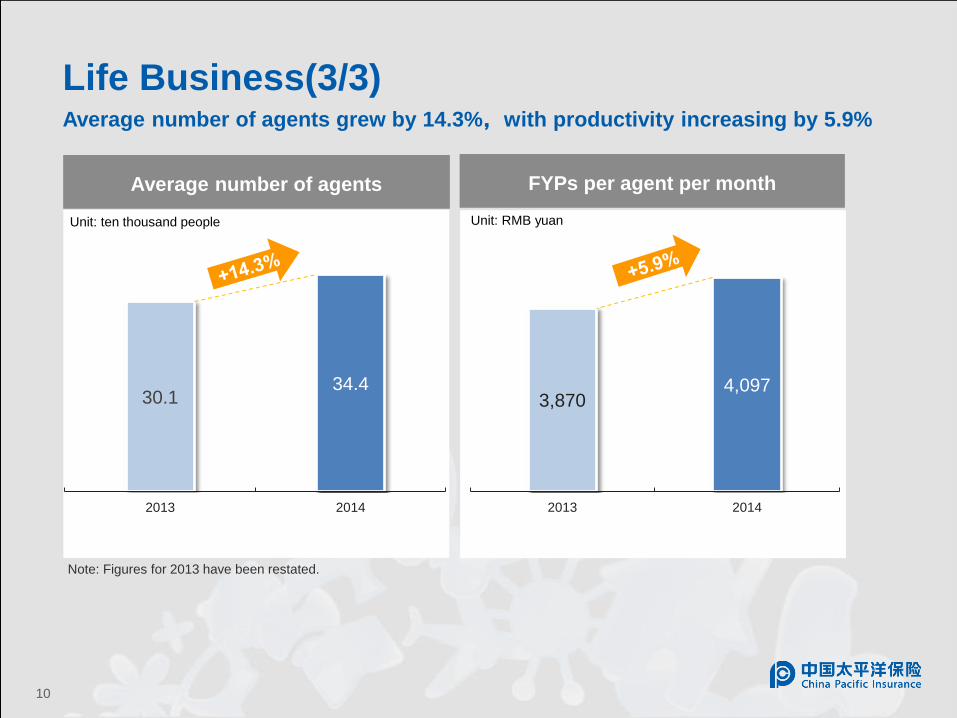
30.1 34.4
2013 2014
3,870 4,097
2013 2014
Life Business(3/3) Average number of agents grew by 14.3%,with productivity increasing by 5.9%
FYPs per agent per month Average number of agents
Unit: ten thousand people Unit: RMB yuan
Note: Figures for 2013 have been restated.
10
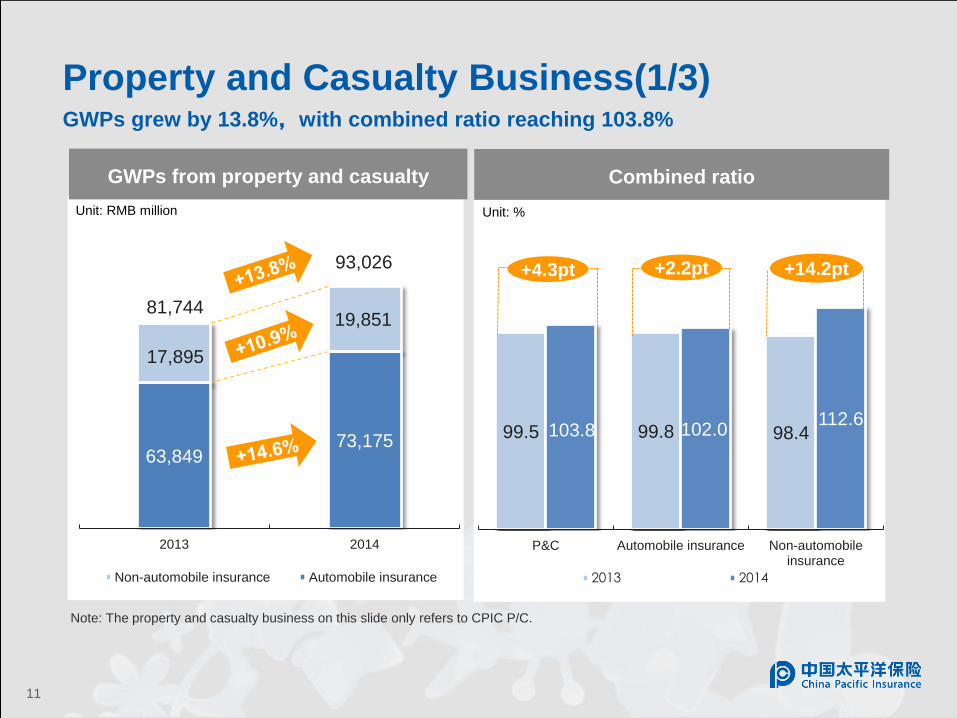
99.5 99.8 98.4 103.8 102.0 112.6
P&C Automobile insurance Non-automobileinsurance
2013 2014
63,849 73,175
17,895
19,851
2013 2014
Non-automobile insurance Automobile insurance
81,744
93,026
Property and Casualty Business(1/3) GWPs grew by 13.8%,with combined ratio reaching 103.8%
GWPs from property and casualty
Unit: RMB million
11
Unit: %
Combined ratio
Note: The property and casualty business on this slide only refers to CPIC P/C.
+14.2pt +2.2pt +4.3pt
100.2 98.7
107.4 103.8 102.0
112.6
P&C Automobile insurance Non-automobileinsurance
Excluding reserve estimate change Actual
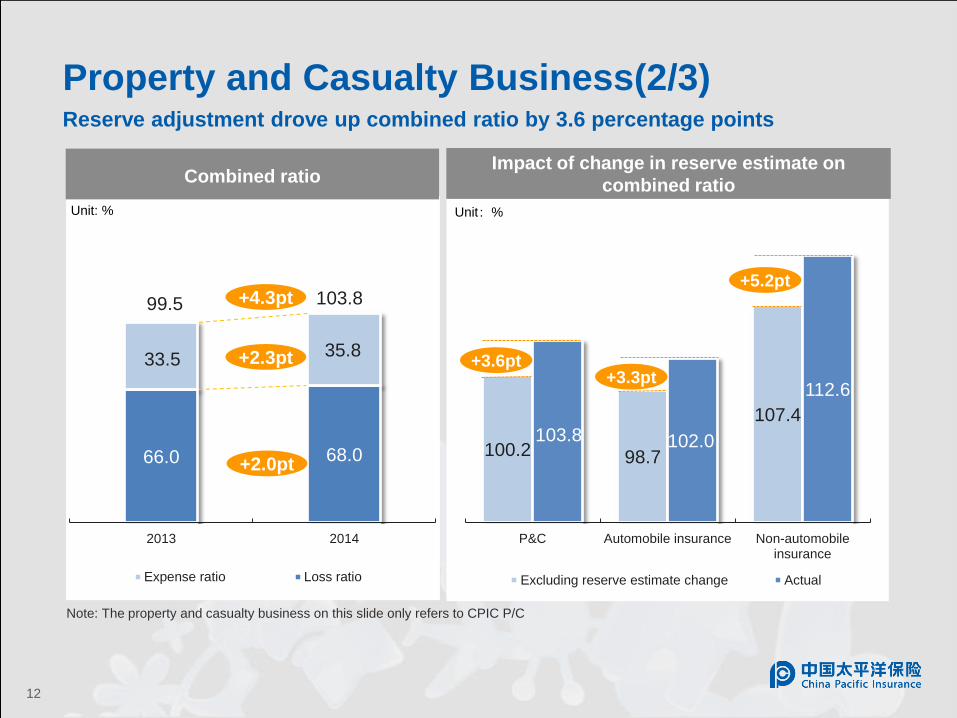
Property and Casualty Business(2/3) Reserve adjustment drove up combined ratio by 3.6 percentage points
Combined ratio
Unit: %
12
Unit:%
Impact of change in reserve estimate on
combined ratio
Note: The property and casualty business on this slide only refers to CPIC P/C
66.0 68.0
33.5 35.8
2013 2014
Expense ratio Loss ratio
99.5 103.8 +4.3pt
+2.3pt
+2.0pt
+5.2pt
+3.3pt +3.6pt
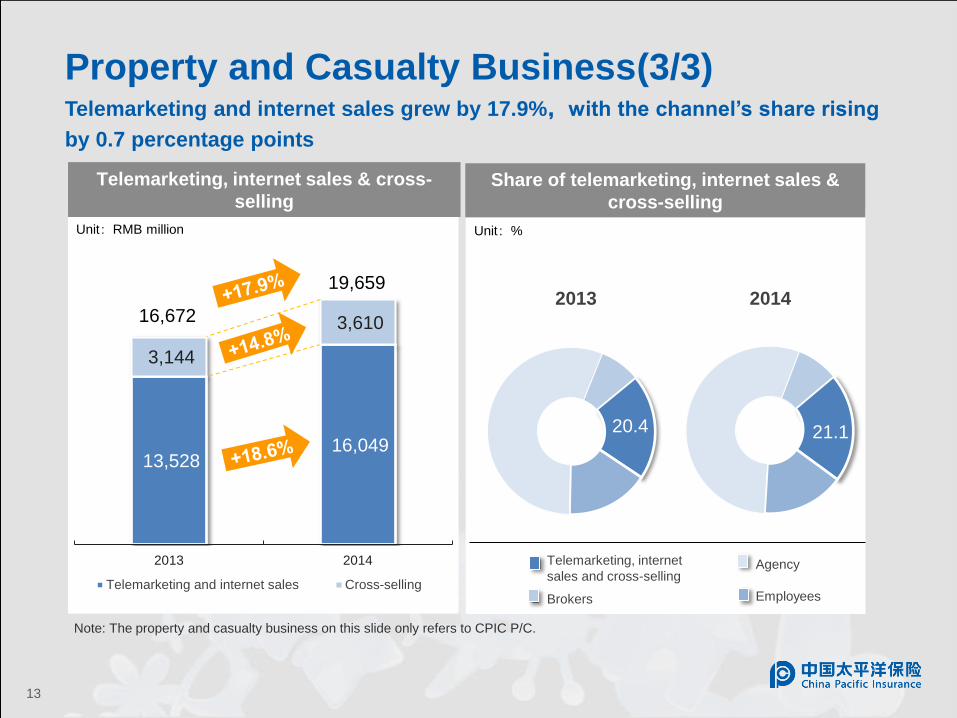
13,528 16,049
3,144
3,610
2013 2014
Telemarketing and internet sales Cross-selling
Telemarketing, internet sales & cross-
selling
Unit:RMB million
16,672
19,659
Unit:%
Share of telemarketing, internet sales &
cross-selling
13
Property and Casualty Business(3/3) Telemarketing and internet sales grew by 17.9%,with the channel’s share rising
by 0.7 percentage points
Agency
Employees
Telemarketing, internet
sales and cross-selling
2013 2014
20.4 21.1
Note: The property and casualty business on this slide only refers to CPIC P/C.
Brokers
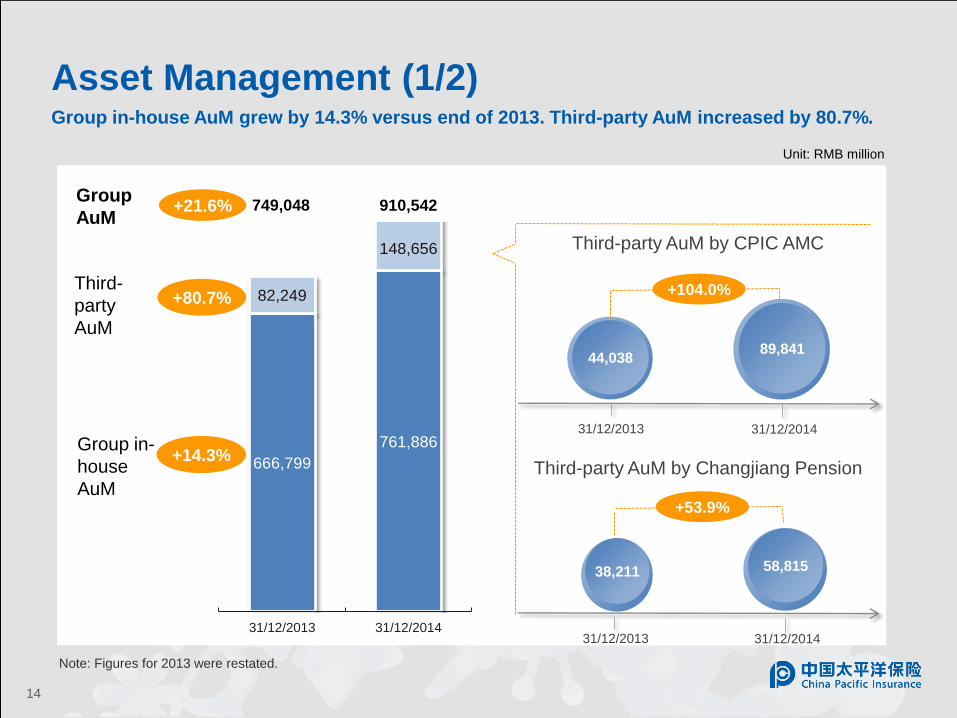
666,799
761,886
82,249
148,656
31/12/2013 31/12/2014
14
Group in-
house
AuM
Third-
party
AuM
Group
AuM +21.6%
Unit: RMB million
910,542 749,048
+14.3%
+80.7%
Third-party AuM by Changjiang Pension
Third-party AuM by CPIC AMC
44,038
31/12/2013 31/12/2014
89,841
38,211
31/12/2013 31/12/2014
58,815
+104.0%
+53.9%
Asset Management (1/2) Group in-house AuM grew by 14.3% versus end of 2013. Third-party AuM increased by 80.7%.
Note: Figures for 2013 were restated.
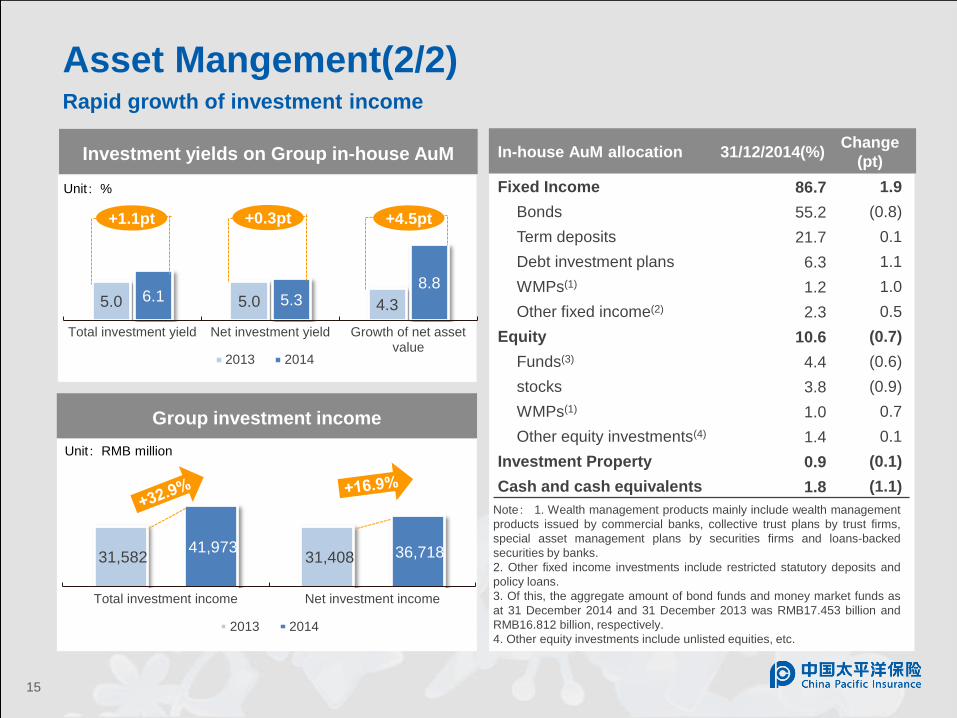
Note: 1. Wealth management products mainly include wealth management
products issued by commercial banks, collective trust plans by trust firms,
special asset management plans by securities firms and loans-backed
securities by banks.
2. Other fixed income investments include restricted statutory deposits and
policy loans.
3. Of this, the aggregate amount of bond funds and money market funds as
at 31 December 2014 and 31 December 2013 was RMB17.453 billion and
RMB16.812 billion, respectively.
4. Other equity investments include unlisted equities, etc.
Asset Mangement(2/2) Rapid growth of investment income
15
Investment yields on Group in-house AuM
Group investment income
5.0 5.0 4.3 6.1 5.3
8.8
Total investment yield Net investment yield Growth of net assetvalue
2013 2014
+1.1pt +4.5pt
31,582 31,408 41,973 36,718
Total investment income Net investment income
2013 2014
+0.3pt
Unit:%
Unit:RMB million
In-house AuM allocation 31/12/2014(%) Change
(pt)
Fixed Income 86.7 1.9
Bonds 55.2 (0.8)
Term deposits 21.7 0.1
Debt investment plans 6.3 1.1
WMPs(1) 1.2 1.0
Other fixed income(2) 2.3 0.5
Equity 10.6 (0.7)
Funds(3) 4.4 (0.6)
stocks 3.8 (0.9)
WMPs(1) 1.0 0.7
Other equity investments(4) 1.4 0.1
Investment Property 0.9 (0.1)
Cash and cash equivalents 1.8 (1.1)
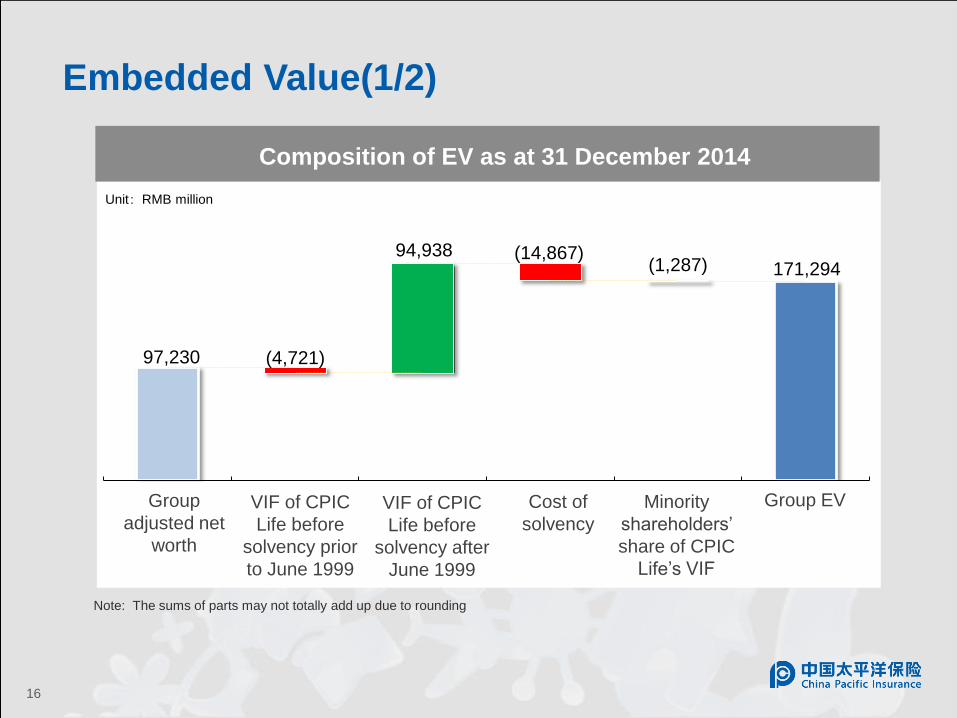
Composition of EV as at 31 December 2014
16
97,230 (4,721)
94,938 (14,867) (1,287) 171,294
Embedded Value(1/2)
Group
adjusted net
worth
VIF of CPIC
Life before
solvency after
June 1999
Cost of
solvency
Group EV VIF of CPIC
Life before
solvency prior
to June 1999
Minority
shareholders’
share of CPIC
Life’s VIF
Note: The sums of parts may not totally add up due to rounding
Unit:RMB million
144,378 10,373
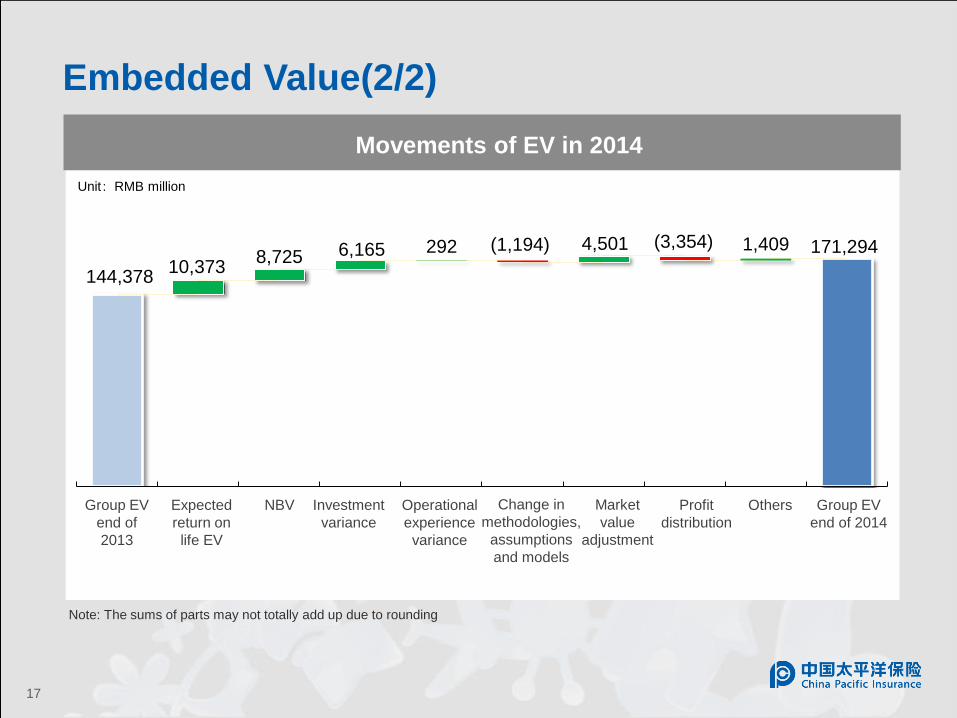
8,725 6,165 292 (1,194) 4,501 (3,354) 1,409 171,294
Movements of EV in 2014
17
Embedded Value(2/2)
Unit:RMB million
Group EV
end of
2013
Expected
return on
life EV
NBV Investment
variance
Operational
experience
variance
Change in
methodologies,
assumptions
and models
Profit
distribution
Others Group EV
end of 2014
Market
value
adjustment
Note: The sums of parts may not totally add up due to rounding
展望2015年
18 18
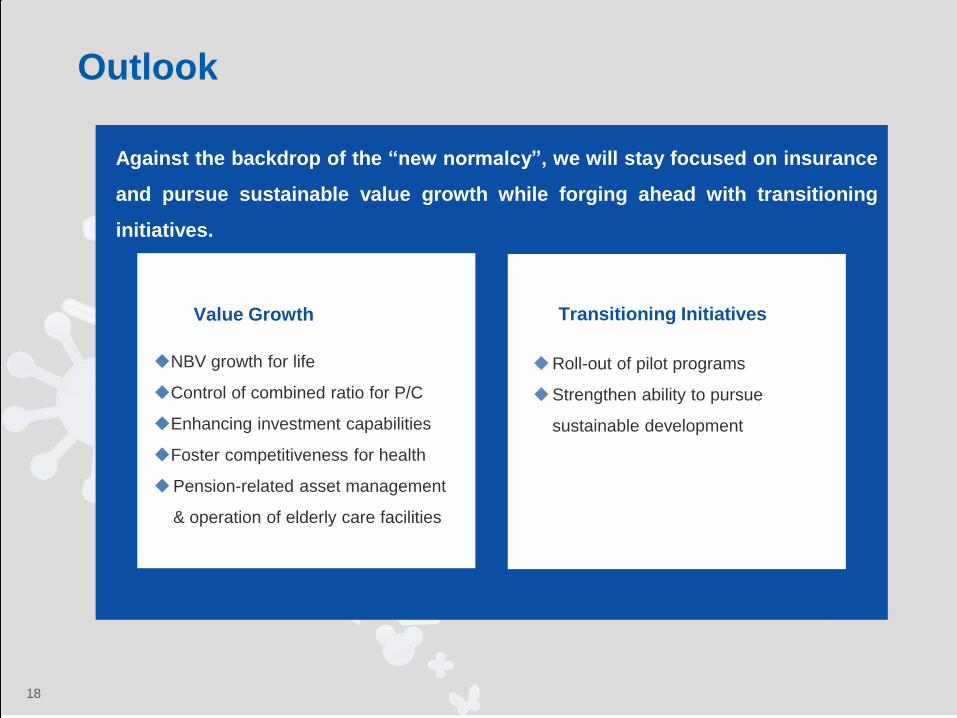
Outlook
18
Against the backdrop of the “new normalcy”, we will stay focused on insurance
and pursue sustainable value growth while forging ahead with transitioning
initiatives.
NBV growth for life
Control of combined ratio for P/C
Enhancing investment capabilities
Foster competitiveness for health
Pension-related asset management
& operation of elderly care facilities
Value Growth Transitioning Initiatives
Roll-out of pilot programs
Strengthen ability to pursue
sustainable development

Q & A


![Aegean News · Tsourakis Nikolaos Logging On Customers and associates of Aegean may visit the company’s web site [] to learn about the company’s activities. Bunkering customers](https://img.pdfslide.tips/doc/110x75/606ddf3dd3a58c178a6bc993/aegean-tsourakis-nikolaos-logging-on-customers-and-associates-of-aegean-may-visit.jpg)