Embed Size (px)
Citation preview
Chapter 3 - LEVORPHANOL 46 | P a g e
3.1 DRUG PROFILE
LEVORPHANOL
Levorphanol is an opioid medication used to treat severe pain. It is the
levorotatory stereoisomer of the synthetic morphinan (Dromoran) and a pure
opioid agonist, an orally active morphine-like analgesic. Morphinan is the
parent drug and prototype of a large series of opioid and/or NMDA antagonists
and opioid agonists used in medicine including nalbuphine, but orphanol,
dextromethorphan, and others. Levorphanol labeled with tritium was used in the
research which led to the discovery of opioid receptors in the human nervous
system, including the first study published in 1971. [1] Levorphanol has the same
properties as morphine with respect to the potential for habituation, tolerance,
physical dependence and withdrawal syndrome. It is 4 to 8 times as potent as
morphine and has a longer half-life. Approximately 30 mg of oral morphine is
roughly equianalgesic to 4 mg of oral levorphanol.[2] The levo isomer is the
source of the narcotic properties of the racemic drug Dromoran, but the dextro
isomers are also useful in medicine: in addition to acting on sigma receptors, the
O-methyl derivative of its dextrorotary isomer, dextromethorphan, is a common
NMDA receptor antagonist and pro-drug to dextrorphan.[3] Oral doses of
levorphanol come in 2 mg and 4 mg strengths or subcutaneous injection every 6
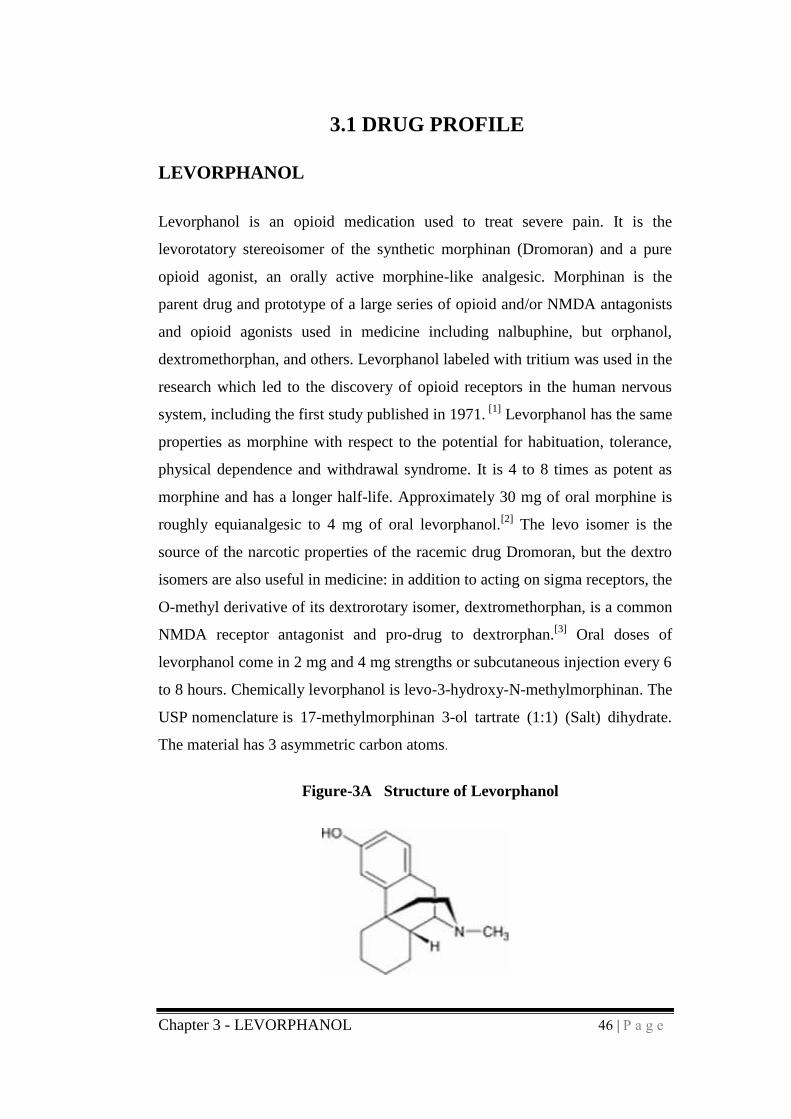
to 8 hours. Chemically levorphanol is levo-3-hydroxy-N-methylmorphinan. The
USP nomenclature is 17-methylmorphinan 3-ol tartrate (1:1) (Salt) dihydrate.
The material has 3 asymmetric carbon atoms.
Figure-3A Structure of Levorphanol
Chapter 3 - LEVORPHANOL 47 | P a g e
Mechanism of action: Like other mu-agonist opioids it is believed to act at
receptors in the peri-ventricular and peri-aqueductal gray matter in both the
brain and spinal cord to alter the transmission and perception of pain. Similar to
many mu-opioid drugs, levorphanol produces euphoria or has a positive effect
on mood in many individuals.
Physicochemical properties of Levorphanol: Levorphanol tartrate is a potent
opioid analgesic with a molecular formula of C17H23NO • C4H6O6 • 2H2O and
molecular weight 443.5. Each mg of Levorphanol tartrate is equivalent to 0.58
mg Levorphanol base. Levorphanol’s chemical name is levo-3-hydroxy-N-
methylmorphinan. The USP nomenclature is 17-methylmorphinan 3-ol tartrate
(1:1) (Salt) dihydrate. The material has 3 asymmetric carbon atoms. It is a white
odorless, crystalline powder. It is sparingly soluble in water, slightly soluble in
alcohol, and is insoluble in chloroform and ether. It melts at 109 degrees with
decomposition.
Clinical Indications: Levorphanol is indicated for the management of moderate
to severe pain or as a preoperative medication where an opioid analgesic is
appropriate. Clinical trials have been reported in the medical literature that
investigated the use of levorphanol as a preoperative medication, as a
postoperative analgesic, and in the management of chronic pain due primarily to
malignancy. In each of these clinical settings Levorphanol has been shown to be
an effective analgesic of the mu-opioid type and similar to morphine,
meperidine, or fentanyl.
Levorphanol has affinity to μ, κ, and δ opioid receptors, but lacks
complete cross-tolerance with morphine. The duration of action is generally
long compared to other comparable analgesics, and varies from 4 hours to as
much as 15 hours. For this reason levorphanol is useful in palliation of chronic
pain and similar conditions. Levorphanol's sigma receptor, SNRI properties
make it even more useful particularly for neuropathic pain. [4]
Chapter 3 - LEVORPHANOL 48 | P a g e
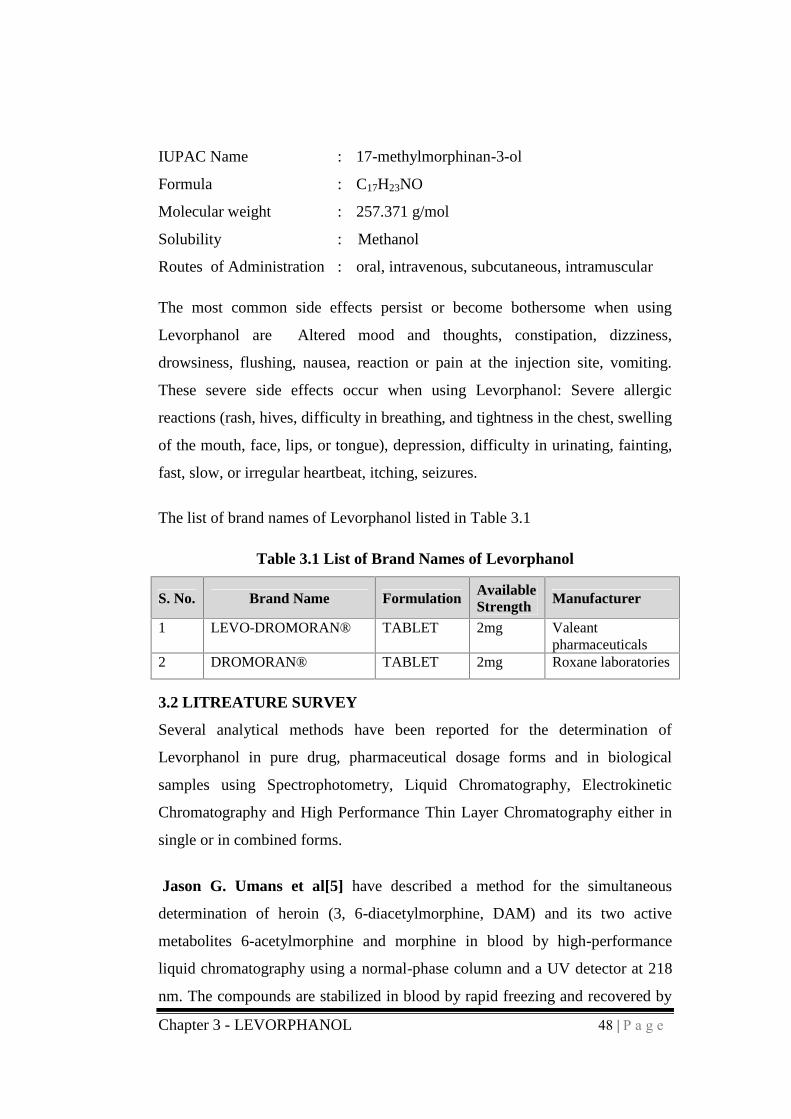
IUPAC Name : 17-methylmorphinan-3-ol
Formula : C17H23NO
Molecular weight : 257.371 g/mol
Solubility : Methanol
Routes of Administration : oral, intravenous, subcutaneous, intramuscular
The most common side effects persist or become bothersome when using
Levorphanol are Altered mood and thoughts, constipation, dizziness,
drowsiness, flushing, nausea, reaction or pain at the injection site, vomiting.
These severe side effects occur when using Levorphanol: Severe allergic
reactions (rash, hives, difficulty in breathing, and tightness in the chest, swelling
of the mouth, face, lips, or tongue), depression, difficulty in urinating, fainting,
fast, slow, or irregular heartbeat, itching, seizures.
The list of brand names of Levorphanol listed in Table 3.1
Table 3.1 List of Brand Names of Levorphanol
S. No. Brand Name Formulation AvailableStrength Manufacturer
1 LEVO-DROMORAN® TABLET 2mg Valeantpharmaceuticals
2 DROMORAN® TABLET 2mg Roxane laboratories
3.2 LITREATURE SURVEY
Several analytical methods have been reported for the determination of
Levorphanol in pure drug, pharmaceutical dosage forms and in biological
samples using Spectrophotometry, Liquid Chromatography, Electrokinetic
Chromatography and High Performance Thin Layer Chromatography either in
single or in combined forms.
Jason G. Umans et al[5] have described a method for the simultaneous
determination of heroin (3, 6-diacetylmorphine, DAM) and its two active
metabolites 6-acetylmorphine and morphine in blood by high-performance
liquid chromatography using a normal-phase column and a UV detector at 218
nm. The compounds are stabilized in blood by rapid freezing and recovered by
Chapter 3 - LEVORPHANOL 49 | P a g e
a multistep liquid—liquid extraction. The mobile phase is acetonitrile—
methanol (75:25, v/v) buffered to apparent pH 7 with ammonium hydroxide and
acetic acid. Usingl-α-acetylmethadol as an internal standard, UV detection and a
1-ml biofluid sample, the lower limit of sensitivity is 12.5ng/ml. commonly
used narcotic analgesics including codeine, propoxyphene, meperidine,
methadone and levorphanol do not interfere with the analysis. The method has
been applied to blood samples from humans and rats. Extracts of blood from a
patient who had received an intravenous dose of 14 mg of DAM contained
DAM and both of its active metabolites
John K.Baker et al [6] have described methods for Identification of drugs by
high-pressure liquid chromatography with dual wavelength ultraviolet detection. Using
three solvent-column systems, 101 drugs of forensic interest were characterized
by their high-pressure liquid chromatographic relative retention times and by
the ratio of their absorbances at 254 and 280 nm. Using relative retention times
alone, only 9% of the drugs could be distinguished; while when both the
retention times and absorbance ratios were used, 95% of the drugs could be
distinguished. The compounds were also characterized by comparisons of their
retention times on an adsorption column and a reversed-phase column; however
this pair of discriminators was less useful than the former techniques.
Maria pawula et al [7] have proposed a rapid and sensitive HPLC method for
the determination of codeine, norcodeine and morphine in small volumes of a
biological matrix, using a cyanopropyl column and a combination of
coulometric and UV detection. The compounds were isolated using C18 solid-
phase extraction cartridges prior to quantitative analysis. The limit of detection
was 250µg/ml for morphine and 5ng/ml for both norcodeine and codeine.
Recovery of each compound was greater than 90% and intra- and inter-assay
precision was better than 10%. The method has been used to study the
metabolism of codeine in microsomal incubations
Milan Meloun et al [8] has proposed the mixed dissociation constants of two
drugs—but orphanol and zolpidem at temperatures of (25 and 37) °C were
determined with the use of multi wavelength and multivariate treatments of
Chapter 3 - LEVORPHANOL 50 | P a g e
spectral data using SPECFIT/32 and SQUAD(84) nonlinear regression. The
factor analysis in the INDICES program predicts the correct number of
components, that is, the number of dissociated and non dissociated forms of the
molecules studied. The thermodynamic dissociation constant pKaT was
estimated by nonlinear regression of {pKa, I} data at (25 and 37) °C: for but
orphanol pKa,1T = 9.46(1) and 8.99(3) and pKa,2
T = 9.64(2) and 9.34(3); for
zolpidem pKa,1T = 6.33(3) and 6.14(1), where the standard deviation in last
significant digits is in parentheses. The proposed procedure involves chemical
model building, calculating the concentration profiles, and fitting the
protonation constants of the chemical model to multi wavelength and
multivariate data measured. If the proposed protonation model represents the
data adequately, the residuals should form a random pattern with a normal
distribution N (0, s2), with the residual mean equal to zero, and the standard
deviation of residuals being near to experimental noise. PALLAS and MARVIN
predict pKa based on the structural formulas of drug compounds in agreement
with the experimental.
3.2.1 Motivation for the method development: The primary purpose of this
research project was to develop and to validate a simple, precise and accurate
HPLC method for determination of Levorphanol in the Bulk and in finished
product. Levorphanol is indicated for the management of moderate to severe
pain or as a preoperative medication where an opioid analgesic is appropriate.
Clearly, it is highly important to accurately measure its concentration alone or
in combination with other compounds. A high speed method was sought to
measure the concentration of this compound within a short span of time. This is
beneficial in any pharmaceutical analysis/clinical environment. The high speed
method will eliminate/reduce any waste or costs that are required with the
preparation of the raw material.
There is no analytical method that has been reported for the determination of
Levorphanol in Bulk and Formulations at the time of commencement of
research work. The other methods reported mainly on the determination of
Levorphanol in plasma and blood samples. Such methods may not be suitable
Chapter 3 - LEVORPHANOL 51 | P a g e
for regular/routine analysis for Levorphanol in pharmaceutical industry because
of diversity and complexity in sample matrix. The determination of
Levorphanol in a Raw Material sample is yet to be found. In addition, stability-
indicating methods have been able to be found for the Levorphanol in fixed
dosage forms along with other nartcotic drugs. Such simultaneous estimations
are not adopted for single component analysis due to expensive factors.
Complete validation parameters were not able to be found in any of the methods
completed in the past. Studying the stability of a drug and being able to
monitor degradation products aids in the clinical treatments/early product
development and shelf life for the drug. One specific radioimmunoassay (RIA)
procedure has been developed for the determination of the narcotic analgesic,
levorphanol, in plasma using a rabbit antiserum to an albumin conjugate of (-)-
3-hydroxy-N-carboxymethylmorphinan. Such analytical methods based on have
major disadvantage that they are time consuming & cumbersome and laborious
and expensive. Also they are not suitable for regular/routine analysis in
pharmaceutical industry where sample size is more. Hence, by considering all
these factors, the author has made some humble attempts, hoping to fill this gap,
and succeeded in developing analytical methods using HPLC methods.
3.3 EXPERIMENTAL
3.3.1 Instrumentation
The analysis of the drug was carried out on Shimadzu HPLC model (VP series)
containing LC-10AT (VP series) pump, variable wave length programmable
UV/visible detector SPD-10AVP and rheodyne injector (7725i) with 20µl fixed
loop. Chromatographic analysis was performed using Inertsil ODS C-18 column
with 250 x 4.6mm internal diameter and 5µm particle size. Shimadzu electronic
balance (AX-200) was used for weighing.
3.3.2 Chemicals and Solvents
Tablets of combined dosage form were procured from the local market. Other
reagents used like Acetonitrile, Methanol, Ortho phosphoric acid are of HPLC
grade were purchased from E.Merck, Mumbai, India
3.3.3 The Mobile Phase
Chapter 3 - LEVORPHANOL 52 | P a g e
A mixture of solvents like Acetonitrile, Methanol and 1% orthophosphoric acid
in the ratio of 45:25:30%, v/v was prepared and used as mobile phase.
3.3.4 Standard Solution of the Drug
An accurately weighed sample of 100mg of Levorphanol (working standard)
was transferred into a 100ml volumetric flask gives 1000µg/ml. The solvent
methanol was added and sonicated to dissolve it completely and made up to the
mark with the same solvent. Further 1ml of the above stock solution was
pipetted into a 10ml volumetric flask and diluted up to the mark with methanol
gives 100µg/ml. Further dilutions were made using the same solution.
3.3.5 Sample (tablet) Solution:
Twenty tablets of (Leveodroman® - 2 mg) were weighed, and then powdered. A
sample of the powdered tablets, equivalent to 10 mg of the active ingredient,
was mixed with diluent in 10 ml volumetric flask. The mixture was allowed to
stand for 1 hr with intermittent sonication for complete solubility of the drug,
and then filtered through a 0.45 μm membrane filter, followed by addition of
diluent up 10 ml to obtain a stock solution to get the primary working sample
solution of 1000 µg/mL. The resultant solution was further diluted to get the
100 µg/mL and then filtered through Ultipor membrane sample filter paper
(0.45µ filter).
3.3.6 Calculations in Validation Studies:
Percentage recovery and area ration were calculated using the followingequation:
% recovery = ([Peak Area] sample / [Peak Area] Standard) x 100For a set of “n” replicate measurements, percentage relative standard diviation
was calculated as fallow: % RSD=SD/Average x 100
The detector sensitivity was determined by calculating the signal to noise ratiousing the following equation: Sensitivity = S/N = Signal / Noise
Signal = Amount of detector response to the peak from the middle of the noise
to the summit of the peak.
Chapter 3 - LEVORPHANOL 53 | P a g e
Noise = Amount of noise resulting from the detector that is taken from a portionof the baseline without any distortions.
3.4 METHOD DEVELOPMENT
Method development consists of selecting the appropriate chromatographic
conditions / factors like detection wave length, selection and optimization of
stationary and mobile phases. Systematic studies on various conditions / factors
have been done for developing a method by studying each parameter by
keeping all other parameters in constant. The following studies were conducted
for this purpose.
3.4.1 Detection Wavelength
The spectra of diluted solutions of the Levorphanol in methanol (at 1ppm and
3ppm concentration) were recorded separately on UV spectrophotometer .UV
absorption spectra revealed that the analyte had absorption maxima between
220 and 230 nm. To obtain the best signals, measurements were performed at
increasing wavelengths from 210 to 250 nm. (at 5nm interval). The largest
signal-to-noise ratio was obtained at 220 nm. PDA-wavelength detection at 228
nm was therefore chosen to obtain good sensitivity for the compound.
3.4.2 Selection of Stationary Phase Column chemistry with respective to the
compound polarity, solvent selectivity (solvent type), solvent strength (volume
fraction of organic solvent(s) in the mobile phase), additive strength, and detection
wavelength, were varied to determine the stationary phase giving the best
separation. Two analytical columns and various mobile phase compositions
were tried in order to reach an acceptable separation as well as a reasonable
chromatographic run time. A cyano-column was highly retentive for the
analytes, and thus resulted in late eluting peaks especially for Levorphanol (tR
24 min). In contrast, the base line chromatographic separation of the target
analyte was accomplished on an octyl-silica column of intermediate
hydrophobicity in 14 min under the described elution conditions.
Chapter 3 - LEVORPHANOL 54 | P a g e
Review of the literature found a variety of separation columns used in the
analysis of Levorphanol. From among those, the Waters Symmetry C8, 3.5 µm,
4.6 mm x150 mm ID, column (Waters Part No.WAT200630) was chosen for
use initially. However, this column was prone to fouling and also caused
significant back pressure in the HPLC, even when using a 5.0µm Symmetry
guard column ahead of the column. After the initial evaluation of analytical
range, this column was replaced with an Inertsil ODS C-18 column, 5.0 µ, 250
mmx4.6 mm ID. Both columns demonstrated acceptable separation of the
components, but the C18 column was selected for all subsequent analyses on
the HPLC because it was much less prone to fouling and did not cause
exceptional backpressure. Also it produced symmetrical peaks with good
resolution.
3.4.3 Selection of the Mobile Phase
To develop the efficient and reproducible method, different mobile phase
concentrations and rations were employed. Our preliminary trials using various
compositions of mobile phase consisting of water, methanol, Acetonitrile and
different ratios of this solution, did not give good peak shapes, resolutions and
analysis time. Additions of 0.5% o-phosphoric acid to mobile phase at pH 5.2
instead of water improved the peak shape of all investigated compounds as well
as the Pemetrexed disodium. In contrast to gradient mode of RP-HPLC,
isocratic elution needs only one pump, is cost-effective, and can easily be
adopted in most laboratories. Thus, isocratic elution was preferred in this study.
For analysis of compounds, for example, Pemetrexed disodium and its process
related impurities with ionizable basic groups, pH is an important condition in
the separation. Phosphate buffer as pH-modifier for initial preliminary test trials.
Because phosphate buffer may be deposited in the column and chromatograph
under some conditions, it was replaced with o-phosphoric acid was chosen as
pH modifier. Another reason for employing TFA is its compatibility with PDA
detector with less noise. To obtain the best chromatographic separation and
sensitivity in a short time, different mixtures of methanol, and water containing
o-phosphoric acid, and analytical columns with different packing materials,
Chapter 3 - LEVORPHANOL 55 | P a g e
were systematically investigated. The best separation was achieved with an
Intersil C18 analytical column and Methanol, Water and o-phosphoric acid.
Finally a mixture of Acetonitrile Methanol and Orthophosphoricacid in the ratio
of 45:25:30%, v/v was proved to be the most suitable combination of mobile
phase among all the tested combinations. The chromatographic peak obtained
was better defined and resolved and almost free from tailing.
3.4.4 Flow Rate
A minimum flow rate and minimum run time results the less usage of solvents.
Flow rate of the mobile phase was tested from 0.8 – 1.5 mL/min for optimum
separation and it was found that 1 ml/min flow rate was ideal for the
successful elution of the analyte.
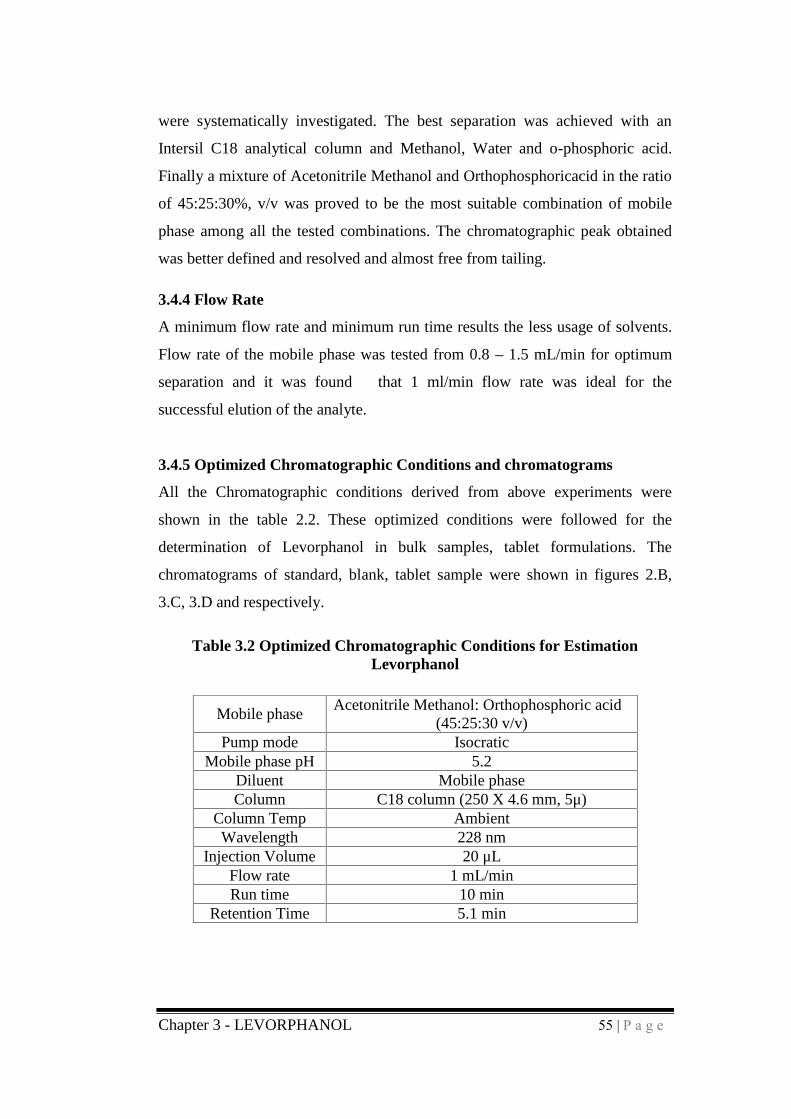
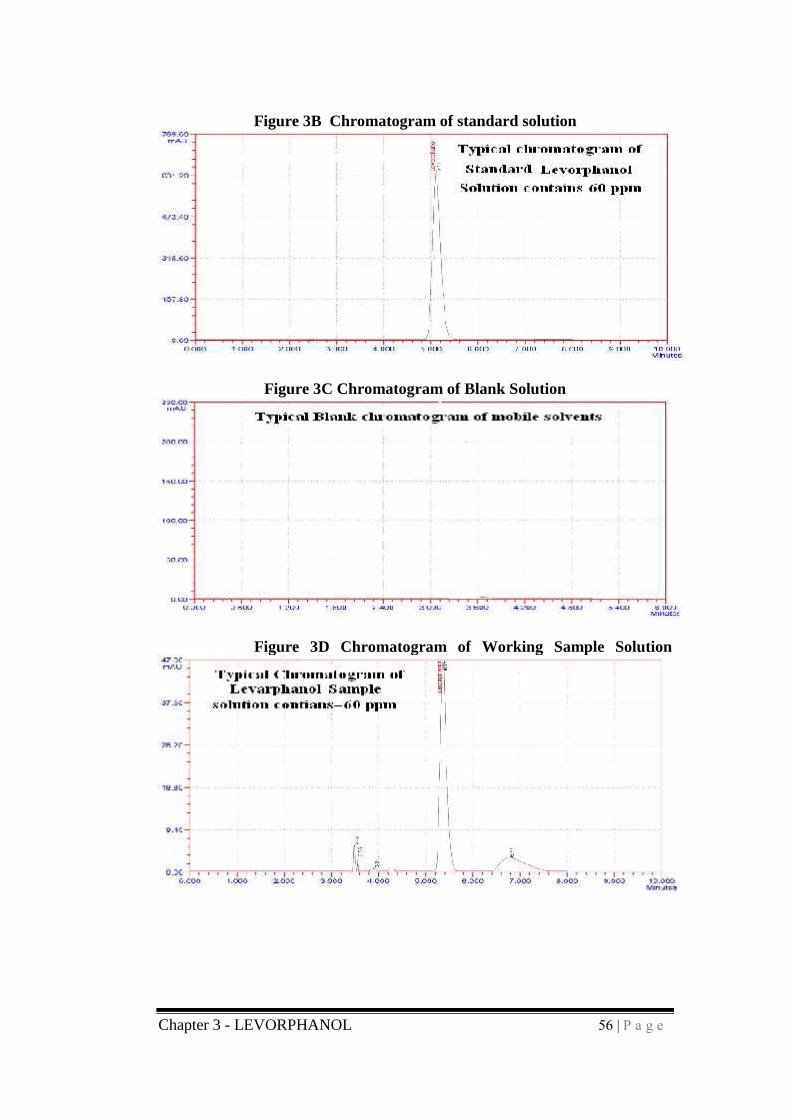
3.4.5 Optimized Chromatographic Conditions and chromatograms
All the Chromatographic conditions derived from above experiments were
shown in the table 2.2. These optimized conditions were followed for the
determination of Levorphanol in bulk samples, tablet formulations. The
chromatograms of standard, blank, tablet sample were shown in figures 2.B,
3.C, 3.D and respectively.
Table 3.2 Optimized Chromatographic Conditions for EstimationLevorphanol
Mobile phaseAcetonitrile Methanol: Orthophosphoric acid
(45:25:30 v/v)Pump mode Isocratic
Mobile phase pH 5.2Diluent Mobile phaseColumn C18 column (250 X 4.6 mm, 5μ)
Column Temp AmbientWavelength 228 nm
Injection Volume 20 μLFlow rate 1 mL/minRun time 10 min
Retention Time 5.1 min
Chapter 3 - LEVORPHANOL 56 | P a g e
Figure 3B Chromatogram of standard solution
Figure 3C Chromatogram of Blank Solution
Figure 3D Chromatogram of Working Sample Solution
Chapter 3 - LEVORPHANOL 57 | P a g e
3.5 VALIDATION OF THE PROPOSED METHOD
The proposed method was validated [9-25] as per ICH guidelines [10]. The
parameters studied for validation were specificity, linearity, precision, accuracy,
robustness, system suitability, limit of detection, limit of quantification, and
solution stability.
3.5.1 Specificity
The specificity of the method was assessed by comparing the chromatograms
obtained from drug standards and from placebo solution pre-pared from the
excipients most commonly used in pharmaceutical formulations. Each
Levorphanol tablet (LEVO-DROMORAN®) contains 2 mg levorphanol
tartrate, lactose, corn starch, stearic acid and talc. It was found that there is no
interference due to excipients in the tablet (sample) and also found good
correlation between the retention times of standard and sample. The specificity
results are shown in Table 3.3
Acceptance Criteria:
1. No interferences of the peak of interest in the control or the degraded
sample from the potential degradation products. In other words, the
minimum resolution between Levorphanol peak and the nearest eluting
peak should be NLT 1.50.
2. Peak purity of Levorphanol active ingredient should be NLT 0.99.
Table 3.3: Specificity study Results
Name of the Solution Peak Retention Time in Min’s
Blank No Peak
Levorphanol standard 5.1mins
3.5.2 Linearity and Range
Linearity was performed by preparing standard solutions of Levorphanol at
different concentration levels including working concentration mentioned in
experimental condition i.e. 60ppm. Twenty micro liters of each concentration
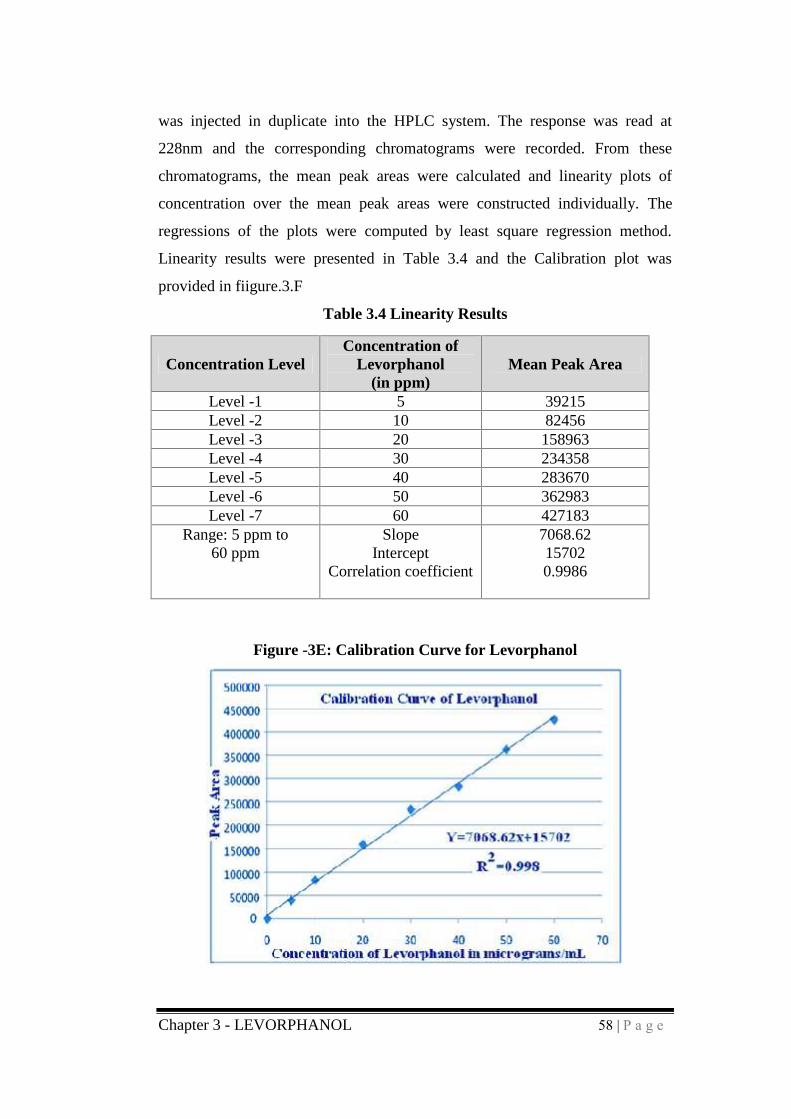
Chapter 3 - LEVORPHANOL 58 | P a g e
was injected in duplicate into the HPLC system. The response was read at
228nm and the corresponding chromatograms were recorded. From these
chromatograms, the mean peak areas were calculated and linearity plots of
concentration over the mean peak areas were constructed individually. The
regressions of the plots were computed by least square regression method.
Linearity results were presented in Table 3.4 and the Calibration plot was
provided in fiigure.3.F
Table 3.4 Linearity Results
Concentration LevelConcentration of
Levorphanol(in ppm)
Mean Peak Area
Level -1 5 39215Level -2 10 82456Level -3 20 158963Level -4 30 234358Level -5 40 283670Level -6 50 362983Level -7 60 427183
Range: 5 ppm to60 ppm
SlopeIntercept
Correlation coefficient
7068.62157020.9986
Figure -3E: Calibration Curve for Levorphanol
Chapter 3 - LEVORPHANOL 59 | P a g e
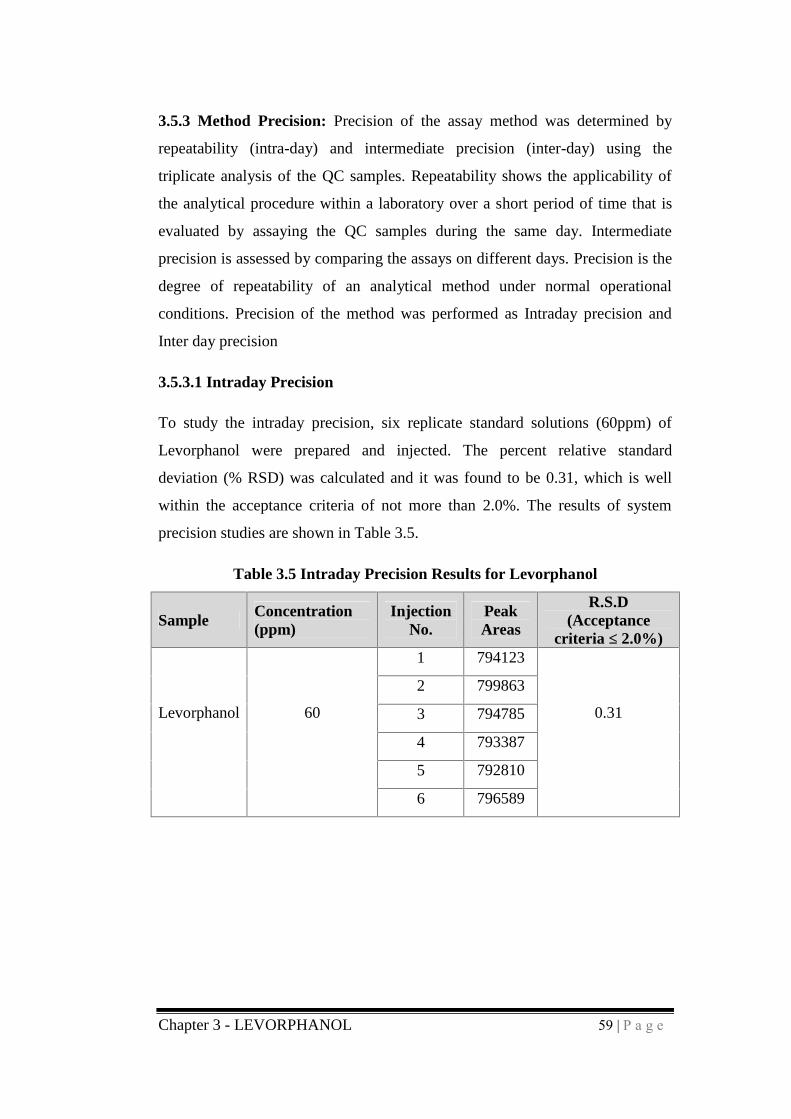
3.5.3 Method Precision: Precision of the assay method was determined by
repeatability (intra-day) and intermediate precision (inter-day) using the
triplicate analysis of the QC samples. Repeatability shows the applicability of
the analytical procedure within a laboratory over a short period of time that is
evaluated by assaying the QC samples during the same day. Intermediate
precision is assessed by comparing the assays on different days. Precision is the
degree of repeatability of an analytical method under normal operational
conditions. Precision of the method was performed as Intraday precision and
Inter day precision
3.5.3.1 Intraday Precision
To study the intraday precision, six replicate standard solutions (60ppm) of
Levorphanol were prepared and injected. The percent relative standard
deviation (% RSD) was calculated and it was found to be 0.31, which is well
within the acceptance criteria of not more than 2.0%. The results of system
precision studies are shown in Table 3.5.
Table 3.5 Intraday Precision Results for Levorphanol
SampleConcentration(ppm)
InjectionNo.
PeakAreas
R.S.D(Acceptance
criteria ≤ 2.0%)1 794123
2 799863
3 794785
4 793387
5 792810
Levorphanol 60
6 796589
0.31
Chapter 3 - LEVORPHANOL 60 | P a g e
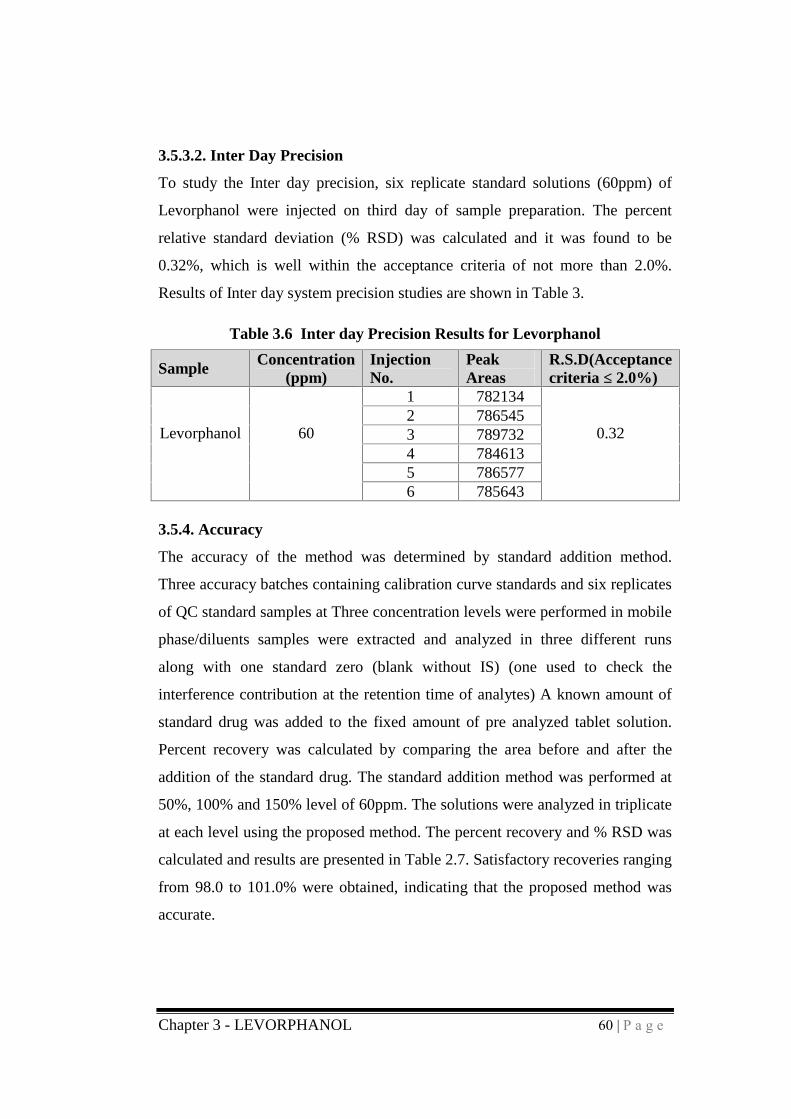
3.5.3.2. Inter Day Precision
To study the Inter day precision, six replicate standard solutions (60ppm) of
Levorphanol were injected on third day of sample preparation. The percent
relative standard deviation (% RSD) was calculated and it was found to be
0.32%, which is well within the acceptance criteria of not more than 2.0%.
Results of Inter day system precision studies are shown in Table 3.
Table 3.6 Inter day Precision Results for Levorphanol
Sample Concentration(ppm)
InjectionNo.
PeakAreas
R.S.D(Acceptancecriteria ≤ 2.0%)
1 7821342 7865453 7897324 7846135 786577
Levorphanol 60
6 785643
0.32
3.5.4. Accuracy
The accuracy of the method was determined by standard addition method.
Three accuracy batches containing calibration curve standards and six replicates
of QC standard samples at Three concentration levels were performed in mobile
phase/diluents samples were extracted and analyzed in three different runs
along with one standard zero (blank without IS) (one used to check the
interference contribution at the retention time of analytes) A known amount of
standard drug was added to the fixed amount of pre analyzed tablet solution.
Percent recovery was calculated by comparing the area before and after the
addition of the standard drug. The standard addition method was performed at
50%, 100% and 150% level of 60ppm. The solutions were analyzed in triplicate
at each level using the proposed method. The percent recovery and % RSD was
calculated and results are presented in Table 2.7. Satisfactory recoveries ranging
from 98.0 to 101.0% were obtained, indicating that the proposed method was
accurate.
Chapter 3 - LEVORPHANOL 61 | P a g e
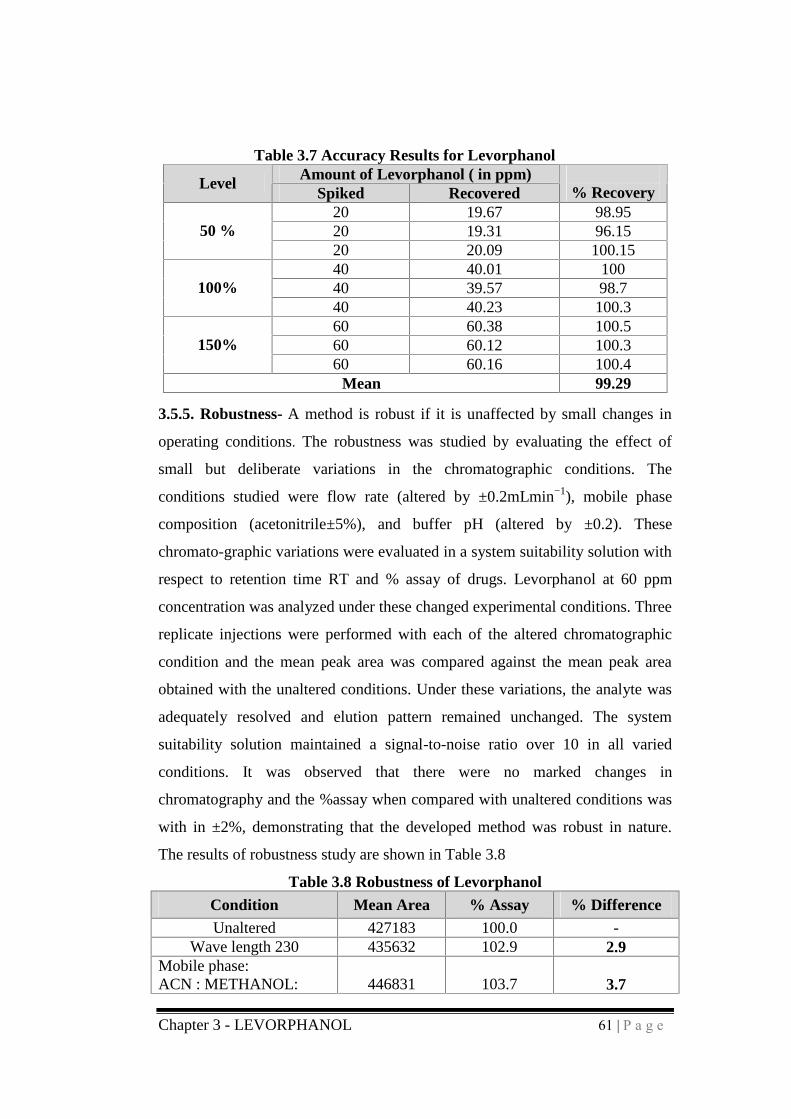
Table 3.7 Accuracy Results for LevorphanolAmount of Levorphanol ( in ppm)Level
Spiked Recovered % Recovery20 19.67 98.9520 19.31 96.1550 %20 20.09 100.1540 40.01 10040 39.57 98.7100%40 40.23 100.360 60.38 100.560 60.12 100.3150%60 60.16 100.4
Mean 99.29
3.5.5. Robustness- A method is robust if it is unaffected by small changes in
operating conditions. The robustness was studied by evaluating the effect of
small but deliberate variations in the chromatographic conditions. The
conditions studied were flow rate (altered by ±0.2mLmin−1), mobile phase
composition (acetonitrile±5%), and buffer pH (altered by ±0.2). These
chromato-graphic variations were evaluated in a system suitability solution with
respect to retention time RT and % assay of drugs. Levorphanol at 60 ppm
concentration was analyzed under these changed experimental conditions. Three
replicate injections were performed with each of the altered chromatographic
condition and the mean peak area was compared against the mean peak area
obtained with the unaltered conditions. Under these variations, the analyte was
adequately resolved and elution pattern remained unchanged. The system
suitability solution maintained a signal-to-noise ratio over 10 in all varied
conditions. It was observed that there were no marked changes in
chromatography and the %assay when compared with unaltered conditions was
with in ±2%, demonstrating that the developed method was robust in nature.
The results of robustness study are shown in Table 3.8
Table 3.8 Robustness of LevorphanolCondition Mean Area % Assay % DifferenceUnaltered 427183 100.0 -
Wave length 230 435632 102.9 2.9Mobile phase:ACN : METHANOL: 446831 103.7 3.7
Chapter 3 - LEVORPHANOL 62 | P a g e
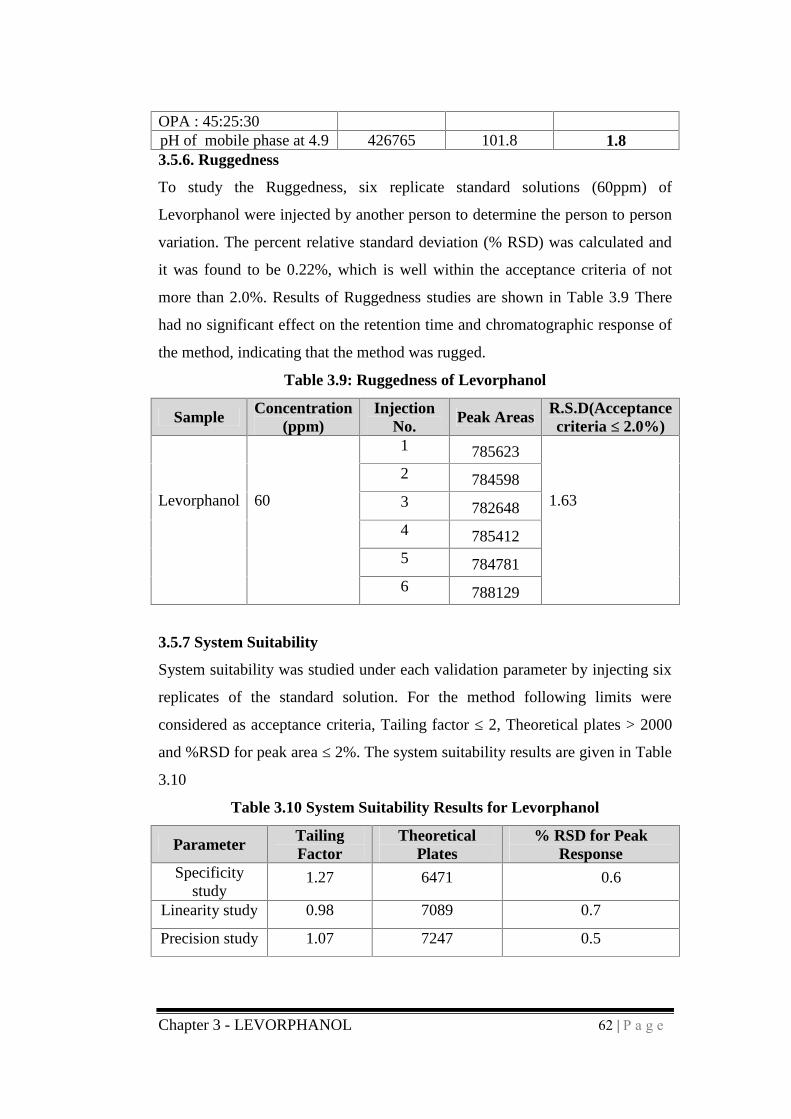
OPA : 45:25:30pH of mobile phase at 4.9 426765 101.8 1.83.5.6. Ruggedness
To study the Ruggedness, six replicate standard solutions (60ppm) of
Levorphanol were injected by another person to determine the person to person
variation. The percent relative standard deviation (% RSD) was calculated and
it was found to be 0.22%, which is well within the acceptance criteria of not
more than 2.0%. Results of Ruggedness studies are shown in Table 3.9 There
had no significant effect on the retention time and chromatographic response of
the method, indicating that the method was rugged.
Table 3.9: Ruggedness of Levorphanol
Sample Concentration(ppm)
InjectionNo.
Peak Areas R.S.D(Acceptancecriteria ≤ 2.0%)
1 7856232 7845983 7826484 7854125 784781
Levorphanol 60
6 788129
1.63
3.5.7 System Suitability
System suitability was studied under each validation parameter by injecting six
replicates of the standard solution. For the method following limits were
considered as acceptance criteria, Tailing factor ≤ 2, Theoretical plates > 2000
and %RSD for peak area ≤ 2%. The system suitability results are given in Table
3.10
Table 3.10 System Suitability Results for Levorphanol
Parameter TailingFactor
TheoreticalPlates
% RSD for PeakResponse
Specificitystudy
1.27 6471 0.6
Linearity study 0.98 7089 0.7
Precision study 1.07 7247 0.5
Chapter 3 - LEVORPHANOL 63 | P a g e
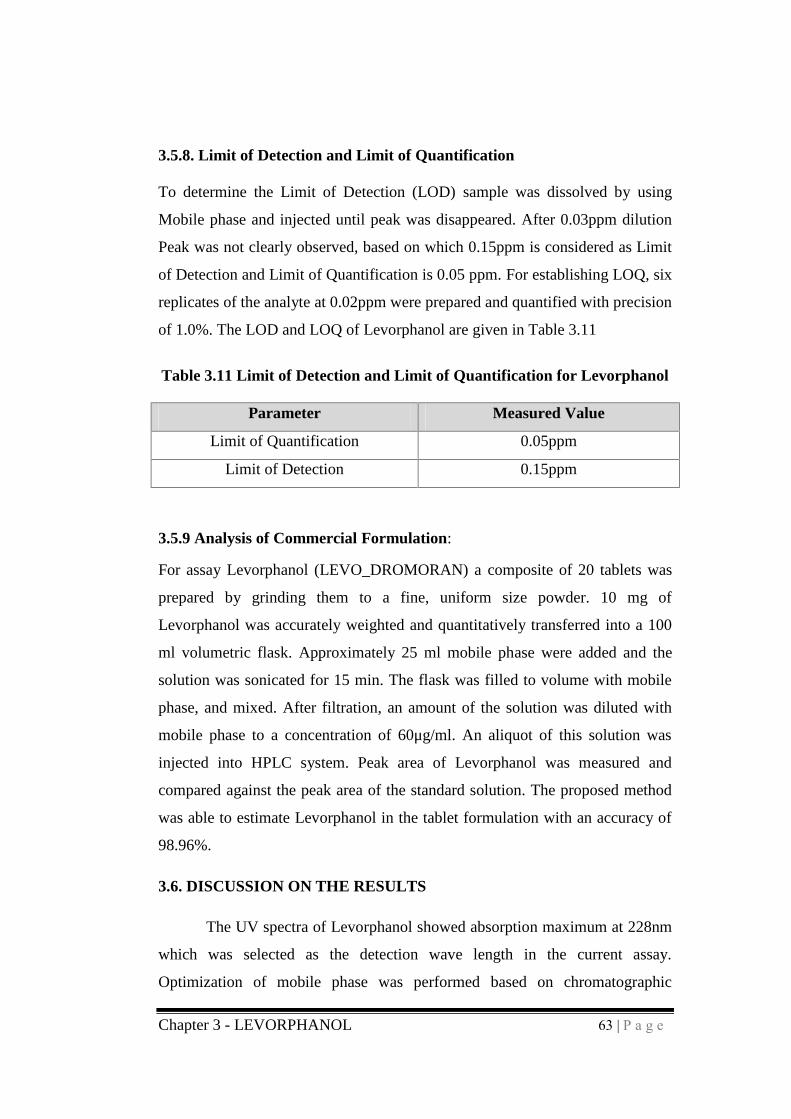
3.5.8. Limit of Detection and Limit of Quantification
To determine the Limit of Detection (LOD) sample was dissolved by using
Mobile phase and injected until peak was disappeared. After 0.03ppm dilution
Peak was not clearly observed, based on which 0.15ppm is considered as Limit
of Detection and Limit of Quantification is 0.05 ppm. For establishing LOQ, six
replicates of the analyte at 0.02ppm were prepared and quantified with precision
of 1.0%. The LOD and LOQ of Levorphanol are given in Table 3.11
Table 3.11 Limit of Detection and Limit of Quantification for Levorphanol
Parameter Measured Value
Limit of Quantification 0.05ppm
Limit of Detection 0.15ppm
3.5.9 Analysis of Commercial Formulation:
For assay Levorphanol (LEVO_DROMORAN) a composite of 20 tablets was
prepared by grinding them to a fine, uniform size powder. 10 mg of
Levorphanol was accurately weighted and quantitatively transferred into a 100
ml volumetric flask. Approximately 25 ml mobile phase were added and the
solution was sonicated for 15 min. The flask was filled to volume with mobile
phase, and mixed. After filtration, an amount of the solution was diluted with
mobile phase to a concentration of 60μg/ml. An aliquot of this solution was
injected into HPLC system. Peak area of Levorphanol was measured and
compared against the peak area of the standard solution. The proposed method
was able to estimate Levorphanol in the tablet formulation with an accuracy of
98.96%.
3.6. DISCUSSION ON THE RESULTS
The UV spectra of Levorphanol showed absorption maximum at 228nm
which was selected as the detection wave length in the current assay.
Optimization of mobile phase was performed based on chromatographic
Chapter 3 - LEVORPHANOL 64 | P a g e
separation, peak shape and peak area obtained. Different mobile phases were
tried but satisfactory separation, well resolved and good symmetrical peaks
were obtained with the mobile phase Acetonitrile: Methanol:
orthophosphoricacid in the ratio of 45:25:30%, v/v. The retention time of
Levorphanol was found to be 5.1 min, which is well separated from the solvent
front and from all other interfering peaks. The number of theoretical plates was
found to be >5000, which indicates efficient performance of the column. The
tailing factor was found to be <1.32, which indicates a relatively good
symmetry of the peak of interest. All these values meet the method system
suitability acceptance criteria and were shown in Table 3.10.
The calibration curve for Levorphanol was obtained by plotting the peak
area versus the concentration of Levorphanol over the range of 5-60ppm, and it
was found to be linear with “r” value > 0.995. The regression equation of
Levorphanol concentration over its peak area was found to be y = 7068.62x
+15702 (r= 0.997), where x is the concentration of Levorphanol (ppm) and y is
the respective peak area. The data of regression analysis of the calibration curve
was shown in table 1. Precision was evaluated using six independent
Levorphanol sample solutions (60ppm) prepared in the Mobile phase.
Percentage relative standard deviation (%RSD) was ( for Intraday-0.31, For
Inter day-0.32) found to be less than 2% for within day and day to day
variations, which proves that method is precise. Standard addition method at
50%, 100% and 150% of 40ppm was carried out to evaluate the Accuracy of the
method for estimatation of Levorphanol. The results showed good recoveries
ranging from 98.0% to 101.0%. The mean recovery data obtained for each level
as well as for all levels combined (Table 3.7) was within 2.0% of the label claim
for the active substance with an RSD of < 2.0%, which satisfied the acceptance
criteria set for the study.
The proposed method has been applied to the assay of commercial tablet
containing Levorphanol. Sample was analyzed for three times after extracting
the drug. The results presented good agreement with the labeled content. Low
Chapter 3 - LEVORPHANOL 65 | P a g e
values of standard deviation denoted very good repeatability of the
measurement.
The Ruggedness of Levorphanol was evaluated by injecting the six replicates of
standard solution (at 60ppm) to determine the variation of result between person
to person. Percentage relative standard deviation (%RSD) was 0.22% found to
be less than 2% which is in the acceptable range. Typical variations in liquid
chromatography conditions were used to evaluate the robustness of the assay
method. In this study, the chromatographic parameters monitored were retention
time, area, tailing factor and theoretical plates. The robustness acceptance
criteria set in the validation were same as established on system suitability test
described above.
Limit of detection (LOD) is defined as the lowest concentration of analyte that
gives a detectable response. Limit of quantification (LOQ) is defined as the
lowest Concentration that can be quantified reliably with a specified level of
accuracy and Precision. The Limit of detection and Limit of quantification for
Levorphanol was found to be 0.05ppm and 0.15ppm respectively.
Conclusion: This method represents a fast analytical procedure for the
simultaneous quantification of Levorphanol in tablet dosage forms. The sample
preparation is simple, the analysis time is short and the elution is isocratic. The
method is amenable to the analysis of large numbers of samples with excellent
precision and accuracy. Based on the presented data, it is concluded that the
High Performance Liquid Chromatography-UV Detection method for
determination of Levorphanol is Specific, Simple and Sensitive. Linearity,
Precision and Accuracy of the method over the concentration range of 5-60ppm
has successfully met the acceptance criteria. The Stability evaluation performed
on both standard solution and on the sample solution (prepared from tablet) has
demonstrated insignificant degradation of Levorphanol over the specified
storage conditions and duration. The current method can be successfully applied
to the estimation of Levorphanol in bulk and in pharmaceutical dosage forms as
part of Quality control analysis and quantification of Levorphanol.

Chapter 3 - LEVORPHANOL 66 | P a g e