Embed Size (px)
Citation preview
Te
ch
no
log
y T
ren
ds
3. Technology Trends
In this report we discuss the current state of big data, which is estimated to already exist in the exabyte range.
We also examine trends in analysis platform technology, and look at changes in the analysis of big data that
accompany the shift to real-time solutions.
The Current State of Big Data Analysis
3.1 The Current State of Big Data
The term “big data” has become a common word recently, but it is still very hard to paint a precise picture of what it is. The
main reasons for this are the fact that the meaning of “big data” differs substantially depending on the standpoint or opinion
of the speaker, and the fact that it can be effectively applied
in a broad array of cases across a range of industries.
In a 2013 survey conducted by the Ministry of Internal
Affairs and Communications that attempted to provide a
comprehensive understanding of the current state of big
data, it was reported that the amount of big data traffic in
Japan is increasing year by year.
Looking at the amount of traffic by media type, we can
see that a high total volume of data is obtained from POS,
RFID, and GPS, and over the years the amount of medical
data (electronic health records, diagnostic imaging) and
M2M data (GPS, RFID) has grown significantly. The survey
states that data is generated in a variety of ways and
covers a range of media types, and explains that data falls
under three categories in different data formats (Figure 1).
*1 http://www.soumu.go.jp/johotsusintokei/whitepaper/ja/h25/html/nc113220.html (in Japanese)
Figure 2: Big Data Traffic Estimates*1
Access logs
Blog and SNS posts
Weather data
RFID data
GPS data
E-commerce sales logs
Mobile phones
Static IP phones
CTI audio log data
Image diagnosis
Electronic health records
Business logs
Electronic receipts
POS data
Accounting data
Customer databases
2005
521
155
64,566
877
64,519
33,116
12
17,765
38,035
2,509
71
227
1
2
201,823
100
4
424,306
2008
1,008
379
121,085
1,958
309,559
104,928
28
36,068
80,958
5,662
191
636
2
4
371,272
161
7
1,033,904
2011
1,566
721
178,501
4,176
370,440
228,801
50
56,544
132,017
10,878
445
1,032
4
5
551,026
234
11
1,536,450
2012 (Year)
2,147
1,129
238,048
6,229
583,942
348,143
69
75,881
178,474
15,019
630
1,635
6
7
765,424
397
16
2,217,195
(Unit: TB)
TOTAL2005
2,500,000
(TB)
2,000,000
1,500,000
1,000,000
500,000
02008 2011 2012 (Year)
2,217,195
1,536,450
1,033,904
424,306
Figure 1: Three Types of Data in Different Formats
Bro
adly
Def
ined
Big
Dat
a
Nar
row
ly D
efin
ed B
ig D
ata
Personnel/Organization[data scientists, etc.]
Data Processing/Accumulation/Analysis Technology[Machine learning, statistical analysis, etc.]
Unstructured Data (New)[Audio, blogs/SNS, video/movies, ebooks, GPS, sensors, etc.]
Unstructured Data (Old)[Audio, radio, TV, newspapers, books, etc.]
Structured Data[Customer data, sales data, etc.]
34
Te
ch
no
log
y T
ren
ds
However, from a data analysis perspective, the unstructured data (new) group includes data with standard formats specified
such as POS, RFID, and GPS (in other words, structured data) in some cases. In other cases streamed data such as video,
audio, and text includes metadata including the title or author. This suggests we should actually consider these examples as
mixed data that includes both structured and unstructured data. Figure 2 indicates that big data traffic in Japan is dominated
by structured data rather than unstructured data.
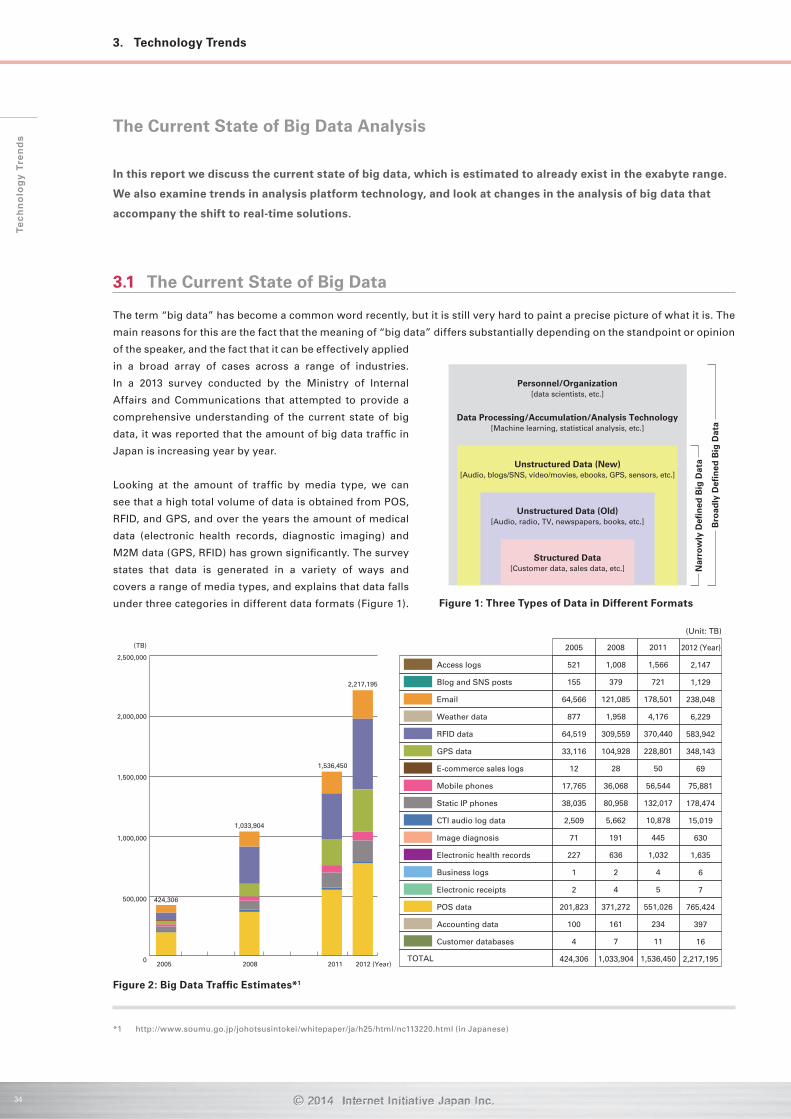
The figures below show estimated big data traffic by industry type (Figure 3) and accumulated volume (Figure 4), as reported
in the Ministry of Internal Affairs and Communications survey.
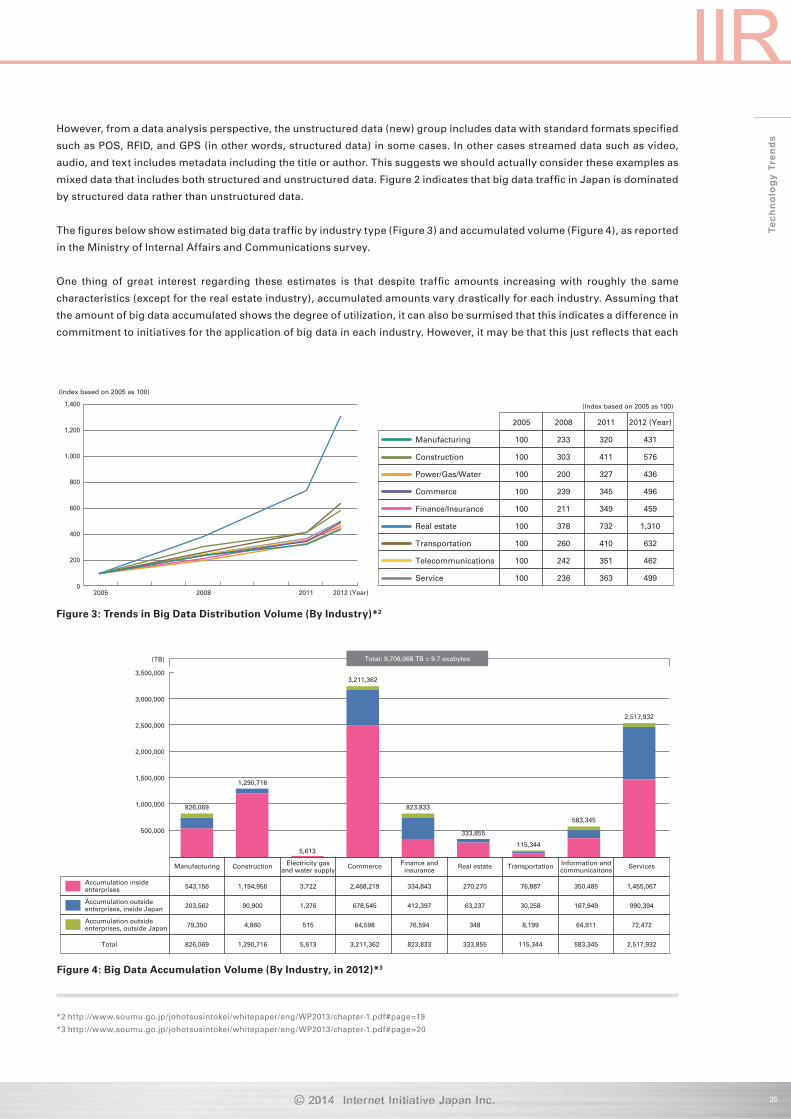
One thing of great interest regarding these estimates is that despite traffic amounts increasing with roughly the same
characteristics (except for the real estate industry), accumulated amounts vary drastically for each industry. Assuming that
the amount of big data accumulated shows the degree of utilization, it can also be surmised that this indicates a difference in
commitment to initiatives for the application of big data in each industry. However, it may be that this just reflects that each
*2 http://www.soumu.go.jp/johotsusintokei/whitepaper/eng/WP2013/chapter-1.pdf#page=19
*3 http://www.soumu.go.jp/johotsusintokei/whitepaper/eng/WP2013/chapter-1.pdf#page=20
Figure 3: Trends in Big Data Distribution Volume (By Industry)*2
Figure 4: Big Data Accumulation Volume (By Industry, in 2012)*3
Manufacturing
Construction
Power/Gas/Water
Commerce
Finance/Insurance
Real estate
Transportation
Telecommunications
Service
2005
100
100
100
100
100
100
100
100
100
2008
233
303
200
239
211
378
260
242
236
2011
320
411
327
345
349
732
410
351
363
2012 (Year)
431
576
436
496
459
1,310
632
462
499
(Index based on 2005 as 100)
2005
(Index based on 2005 as 100)
200
400
600
800
1,000
1,200
1,400
02008 2011 2012 (Year)
Manufacturing
543,156
203,562
79,350
826,069
Construction
1,194,956
90,900
4,860
1,290,716
Electricity gasand water supply
3,722
1,376
515
5,613
Commerce
2,468,219
678,545
64,598
3,211,362
Finance andinsurance
334,843
412,397
76,594
823,833
Real estate
270,270
63,237
348
333,855
Transportation
76,887
30,258
8,199
115,344
Information andcommunicaitons
350,485
167,949
64,911
583,345
Services
1,455,067
990,394
72,472
2,517,932
Accumulation insideenterprises
Accumulation outsideenterprises, inside Japan
Accumulation outsideenterprises, outside Japan
Total
500,000
826,069
5,613
1,290,716
823,833
333,855
115,344
583,345
2,517,932
3,211,362
1,000,000
1,500,000
2,000,000
2,500,000
3,000,000
3,500,000
(TB) Total: 9,708,068 TB = 9.7 exabytes
35
Te
ch
no
log
y T
ren
ds
industry has different practices. Looking at the amount of accumulated data by industry, it is evident that B2C industries
accumulate more data than B2B ones, and that most big data is kept private by its owners.
Given that exabytes of data is already in circulation according to the Ministry of Internal Affairs and Communications survey
results, it is fair to say that the use and application of big data has started. However, it is becoming clear that the primary
utilization of big data, namely to gain new knowledge by sorting and analyzing the big data collected and accumulated from
vast data sources, is only now beginning to happen.
With regard to discussion of issues relevant to big data for promoting and accelerating its future utilization and application,
two issues often raised are how to promote the sharing of big data, and how to obtain new knowledge through its analysis.
In this context, three key words that are frequently encountered are M2M, IoT, and CPS. To briefly cover the definitions of
each of these, Machine-to-Machine (M2M) is technology that enables communication between devices of the same type
using wired or wireless communication systems, while the Internet of Things (IoT) involves uniquely identifiable objects
represented virtually in an Internet-like structure. A Cyber-Physical System (CPS) is a system of cooperative computational
elements that control physical entities. Rather than independent concepts, it may be best to think of these as presenting three
perspectives on networks comprised of devices such as sensors. For example, package pickup and delivery management
using RFID tags involves attaching an RFID tag to each package, and when a package passes near an RFID reader, data with
location information added is generated. By collecting this data and tracing the location information for a particular package,
it is possible to check the route that package has taken, and where it is currently stored. Furthermore, if you trace all the
packages handled by the pickup and delivery management system, you can accurately ascertain the delivery centers where
packages are concentrated. With the proliferation of smartphones these days, the activities of people can also be tracked
using the same method. Collecting the data generated by each device creates big data, which it is believed would provide
knowledge useful for work optimizations and marketing.
3.2 Technology Trends in Big Data Analysis Platforms: A Shift to Real-Time Solutions
The analysis of big data generated from device networks based on the M2M, IoT, and CPS concepts described earlier
obviously demands immediacy. That means big data analysis platforms must accommodate the need for real-time analysis.
For many, platform technology for big data analysis calls to mind distributed processing platforms based on MapReduce,
in particular. However, applying MapReduce architecture designed for batch processing to real-time analysis presents
difficulties. Because the process results are not determined until a job finishes, a delay equal to the processing time occurs.
One solution for reducing this time is to optimize and speed up the processing itself, but naturally there are limitations.
Another measure is to reduce the size of batch processing, but when too small batch processing becomes meaningless.
Normally, MapReduce jobs require anywhere between a few minutes to a few hours to process, and reducing this to the
response time of a few seconds that is acceptable for web services is practically impossible.
Two approaches have been evaluated in research into real-time big data analysis platforms. The first involves responding
to user requests in real time, and this covers cases in which response performance is improved by enhancing the functions
of a MapReduce platform itself, as well as cases envisaged as platform systems that incorporate MapReduce, with
MapReduce used internally, and improvements to response performance made in other areas. The other approach is to
actually execute data processing in real time, using platform technology that implements so-called “real-time stream
processing” in place of MapReduce.
36
Te
ch
no
log
y T
ren
ds
MapReduce Online*4 is an example of enhancing the functions of the MapReduce platform itself. In this case, pipelines
are used to handle the delivery of data between Map processes and Reduce processes with a heavily modified version of
Hadoop. These enhancements enable users to check job status details during processing, in other words making event
monitoring possible. It also allows stream processing to be written into MapReduce applications.
Examples of platform systems that incorporate MapReduce include the two open source clones that follow the idea of
Google’s Dremel*5: “Apache Drill*6” and “Cloudera Impala*7.” Neither carry out data processing in real time, but they
demonstrate equivalent low delay query response performance.
Apache Storm (Twitter Storm)*8 is an example of real-time stream processing. Storm was originally a system developed by
BackType, which conducted Twitter analytics. After Twitter acquired BackType, Storm was made open source via the Apache
Project, but it is a versatile big data processing platform.
Storm incorporates a stream engine that enables Complex Event Processing (CEP), ensuring that lossless data streams are
supplied to the entities known as Spouts/Bolts that carry out big data processing. Storm stream flow is expressed in units
called tuples, with overall stream processing implemented by defining topologies that connect Spouts and Bolts. Spouts are
entities that represent data sources, and Bolts are entities that govern the conversion or processing of data. Their definitions
and functions are completely different, but they could be thought of as Map and Reduce in MapReduce.
Like Hadoop, Storm can be comprised of clusters, and it operates four types of software: the Nimbus, Zookeepers, Supervisors,
and Workers. The Nimbus is the master node that handles the scheduling and monitoring of Workers. Zookeepers are the
distributed lock managers that are also used in Hadoop. Supervisors receive requests from the Nimbus and control the
launch and termination of Workers. Workers function as the processes that carry out actual processing. Placing these pieces
of software appropriately in nodes within a cluster achieves high scalability and fault-tolerance. Storm itself is written in a
Lisp-like language called Clojure, and runs on a Java VM. Accordingly, Spouts and Bolts can be written using a variety of
development languages that run on Java VMs, such as Java.
Here we have introduced the challenges of enabling real-time big data analysis platforms, as well as a number of examples,
but it appears that more and more are seeing the appearance of Apache Storm as a trend towards a de facto standard
for these platforms. It seems a simple programming model in common with Hadoop (MapReduce) and Twitter analytic
performance are requirements expected of a versatile platform.
So, will Storm replace Hadoop as an open source big data analysis platform? The answer to this question seems likely to be
that both will continue to become compartmentalized. This is because immediacy is not required for all big data analysis.
As mentioned, those demanding big data analysis with a real-time response will transition to Storm, but those for which
conventional batch processing is sufficient (or necessary) will probably continue to use Hadoop. Hybrid system architecture
methods that utilize Storm for the preprocessing of Hadoop analysis (data shaping, filtering, and matching), or combine
batch processing with stream processing in what is known as Lambda architecture, have also been proposed. Currently, it is
generally accepted that both are mutually complementary.
*4 http://db.cs.berkeley.edu/papers/nsdi10-hop.pdf
*5 http://research.google.com/pubs/pub36632.html
*6 http://incubator.apache.org/drill/
*7 http://blog.cloudera.com/blog/2012/10/cloudera-impala-real-time-queries-in-apache-hadoop-for-real/
*8 http://storm.incubator.apache.org/
37
Te
ch
no
log
y T
ren
ds
3.3 Changes in Big Data Analysis Due to the Shift to Real-Time Solutions
The shift towards real-time big data analysis platforms is understood to be a response to improve velocity, which is one
of the often-quoted “3Vs” that define big data (Volume, Variety, and Velocity). According to Gartner, which coined the 3Vs
definition, velocity is the speed of data creation and processing. For example, the analysis of sensor and log data, the analysis
of spatiotemporal data using GPS information, and the analysis of stream data obtainable from social media are all specific
examples in which this velocity requirement must be met. For existing analysis cases such as these, there are well-known
examples of obtaining new knowledge from previously accumulated data, including records of abnormal behavior detection
and spatial migration, as well as sentiment analysis. However, due to improvements in the immediacy of real-time big data
analysis platforms, in the future it is thought that analysis methods will become more diverse, such as time-series analysis
that places more emphasis on timelines, and estimates based on this.
3.3.1 Wikipedia as Social Big Data
We are trying out trend analysis using Wikipedia Pageview Count (Wikipedia PVC: http://www.gryfon.iij-ii.co.jp/ranking/)
(in Japanese) as an example of analysis focused on the timeline of big data. As everyone knows, Wikipedia is the most
successful Internet encyclopedia. It has adopted an extremely open administration policy, and because its databases can be
obtained charge-free, it is utilized for research and a variety of other purposes. The Wikipedia PVC is part of the information
published, and has been available since around January 2013. It indicates the number of page views for each Wikipedia page
over the last hour, with updates posted every hour or two. By combining Wikipedia PVC and the Wikipedia database, they are
usable as time-series data for indicating social trends, and this can be considered as an example of social big data obtainable
via the Internet. Because it has the properties of an encyclopedia, the following characteristics apply compared to typical
social media sites (SNS or blogs).
- Users are allowed to make alterations themselves, but because there are measures in place to prevent venting through
article content using guidelines, etc., it is possible to find common denominators regarding society as a whole.
- Because it is an encyclopedia, the content is very thorough, with linked data formed within a close space.
- The service has high public recognition, and users use it to learn the details of topics they don’t know about, and discover
related information.
- It supports many languages, and in many cases each page is clearly mapped out for each language.
When performing text analysis using messages obtained from general social media for trend analysis, etc., the lack of
consistent terminology can hinder data analysis. However, this is less likely to be a problem with Wikipedia data that keeps
meaning-related outbursts in check, and as a result we believe that analysis results that are easily understandable by people
can be obtained.
3.3.2 Analysis of Wikipedia PVC Time-Series Fluctuations
For Wikipedia, which is well-known as an encyclopedia, the dominant usage pattern likely involves users finding the page
they want by searching for the topic they are interested in from the main page or a search engine.
By focusing on a certain Wikipedia page, and observing the time-series fluctuations in its PVC, we can confirm that a peak
is reached at some point, after which activity gradually subsides. In particular, after investigating a number of pages with
notable peaks further, we learned that pages dealing with topics reported on TV broadcasts or Internet news showed large
responses. In other words, this supports the hypothesis that viewers of TV programs and readers of Internet news look up
topics they don’t know about on Wikipedia when they arise.
To verify this hypothesis, we focused on serial dramas, surveying the relationship between each broadcast time and time-
series fluctuations in the Wikipedia PVC. We concentrated on serial dramas because we had confirmed it was highly likely for
the PVC peak for the Wikipedia page to occur at the same time as each episode was broadcast. Television dramas also have
viewer ratings, a widely-known index of viewer numbers, and it was important to investigate the relationship between this
and the Wikipedia PVC.
38
Te
ch
no
log
y T
ren
ds
Author:
Akito FujitaChief Architect, Business Strategy and Development Center, IIJ Innovation Institute Inc. (IIJ-II). Mr. Fujita joined IIJ in 2008. He is engaged in the research and development of cloud computing technology utilizing knowledge gained through structured overlay research.
Wikipedia PVC provides data on all 334 serial dramas broadcast on commercial stations since 2008. Of these, we used the
following method to analyze 244 dramas with complete sets of Wikipedia PVC data.
1. Assuming a broadcast time of one hour for each drama episode, we extracted a single set of time-series data for the 168
hours between the broadcast time and an hour before the next broadcast.
2. We performed regression analysis on the extracted time-series data, and used the coefficient obtained as the social
interest level of that episode.
3. We investigated the correlation between the social interest level and average viewer ratings for each episode, and
confirmed the significance of this.
For the regression analysis in step two, we used the regression formula pvc =α* exp(β*t) + γ, based on knowledge in
econometrics that “social events fluctuate exponentially.” We also adjusted peak values to take into consideration broadcast
time delays or expansion.
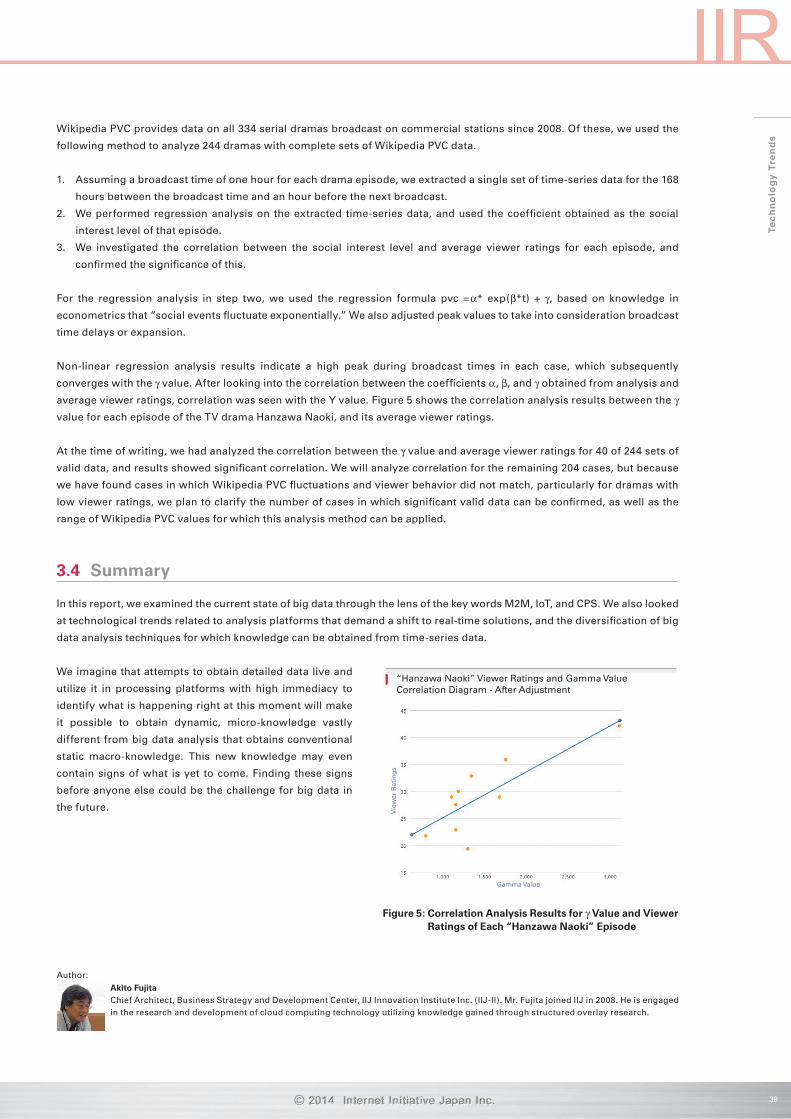
Non-linear regression analysis results indicate a high peak during broadcast times in each case, which subsequently
converges with the γ value. After looking into the correlation between the coefficients α, β, and γ obtained from analysis and
average viewer ratings, correlation was seen with the Y value. Figure 5 shows the correlation analysis results between the γ
value for each episode of the TV drama Hanzawa Naoki, and its average viewer ratings.
At the time of writing, we had analyzed the correlation between the γ value and average viewer ratings for 40 of 244 sets of
valid data, and results showed significant correlation. We will analyze correlation for the remaining 204 cases, but because
we have found cases in which Wikipedia PVC fluctuations and viewer behavior did not match, particularly for dramas with
low viewer ratings, we plan to clarify the number of cases in which significant valid data can be confirmed, as well as the
range of Wikipedia PVC values for which this analysis method can be applied.
3.4 Summary
In this report, we examined the current state of big data through the lens of the key words M2M, IoT, and CPS. We also looked
at technological trends related to analysis platforms that demand a shift to real-time solutions, and the diversification of big
data analysis techniques for which knowledge can be obtained from time-series data.
We imagine that attempts to obtain detailed data live and
utilize it in processing platforms with high immediacy to
identify what is happening right at this moment will make
it possible to obtain dynamic, micro-knowledge vastly
different from big data analysis that obtains conventional
static macro-knowledge. This new knowledge may even
contain signs of what is yet to come. Finding these signs
before anyone else could be the challenge for big data in
the future.
Figure 5: Correlation Analysis Results for γ Value and Viewer Ratings of Each “Hanzawa Naoki” Episode
“Hanzawa Naoki” Viewer Ratings and Gamma Value Correlation Diagram - After Adjustment
Vie
wer
Rat
ing
s
Gamma Value
39