Embed Size (px)
Citation preview
The Federative Republic of Brazil Study on the Introduction of Intelligent Transport Systems Final Report
3-63
3.3 TRAFFIC DEMAND FORECAST
3.3.1 Context of Traffic Demand Forecast
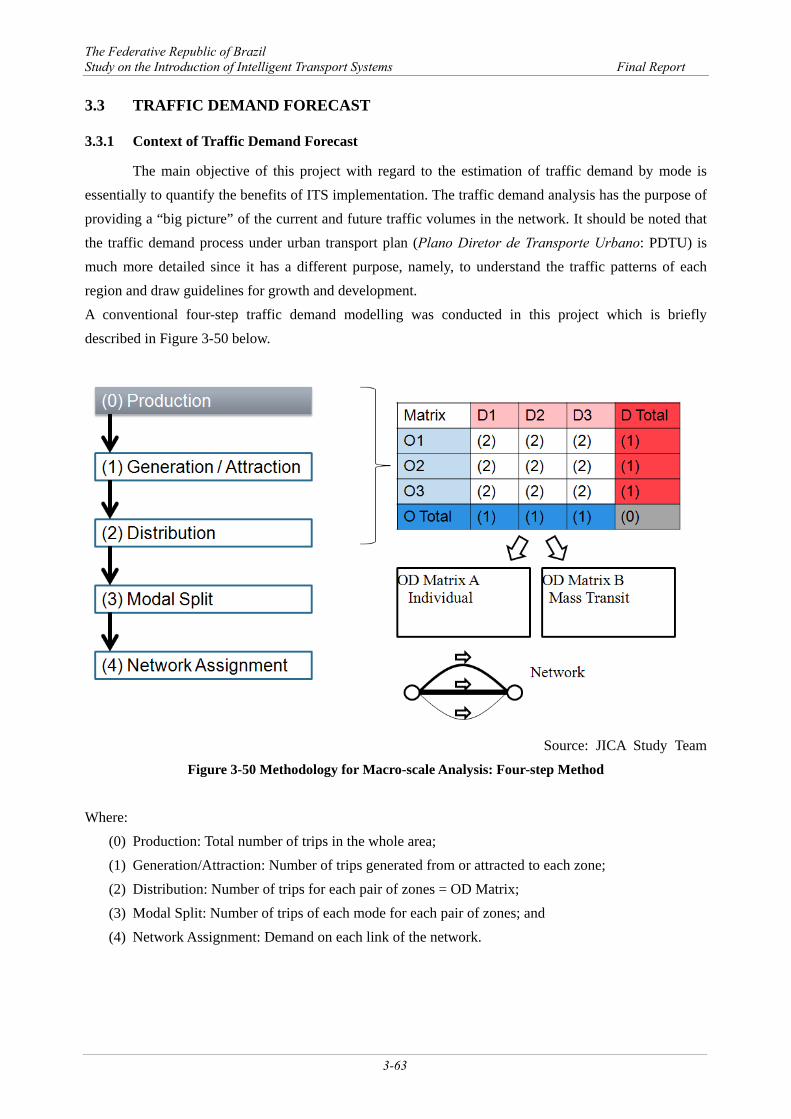
The main objective of this project with regard to the estimation of traffic demand by mode is essentially to quantify the benefits of ITS implementation. The traffic demand analysis has the purpose of providing a “big picture” of the current and future traffic volumes in the network. It should be noted that the traffic demand process under urban transport plan (Plano Diretor de Transporte Urbano: PDTU) is much more detailed since it has a different purpose, namely, to understand the traffic patterns of each region and draw guidelines for growth and development. A conventional four-step traffic demand modelling was conducted in this project which is briefly described in Figure 3-50 below.
Source: JICA Study Team Figure 3-50 Methodology for Macro-scale Analysis: Four-step Method
Where:
(0) Production: Total number of trips in the whole area; (1) Generation/Attraction: Number of trips generated from or attracted to each zone; (2) Distribution: Number of trips for each pair of zones = OD Matrix; (3) Modal Split: Number of trips of each mode for each pair of zones; and (4) Network Assignment: Demand on each link of the network.
The Federative Republic of Brazil Study on the Introduction of Intelligent Transport Systems Final Report
3-64
3.3.2 Review of Existing Transport Master Plans
As discussed in Section 3.1, the following three main studies were considered as the starting point for the supplementary traffic demand forecast conducted in this Study: PDTU/RMRJ 2005 (Current RMRJ Transport Master Plan); PDTU/RMRJ 2011 (Ongoing update of the 2005 Transport Master Plan); and Rio 2016 Transport Strategy (Strategic Plan for 2016 Olympic Games by the Secretaria
Municipal de Transportes: SMTR). These three studies are further summarized in the context of traffic demand forecast as follows:
(1) PDTU/RMRJ 2005 20 municipalities included as part of the RMRJ 485 traffic analysis zones (TAZ)
o 342 in the city of Rio de Janeiro, 143 in the RMRJ 34,000 households surveyed Travel demand forecast method: four-step model
o Trip generation: home-based work (40.2%), home-based school (33.1%), home-based other (23.4%) and non-home based (3.2%)
o Trip distribution.: gravity model o Modal split: logit model o Traffic assignment: not clear
Target years: 2008 and 2013 Based on 1991 and 2000 Brazilian Institute of Geography and Statistics (Instituto Brasileiro de
Geografia e Estatística: IBGE) Census Data Socioeconomic data used: population, employment, school enrollment, motorization rate, average
income Population growth of 1.5%/year and employment growth of 1.84%/year in the RMRJ
(2) PDTU/RMRJ 2011 (Summary) Target years: 2016 and 2021 Refined 2003 PDTU TAZs: 730 Over 100,000 surveys – still ongoing Origin-destination (OD) data not available - data analysis expected to be concluded in early 2013 Model to be developed using EMME 2 Master plan will suggest transit-oriented strategies as priority for future growth of RMRJ
The Federative Republic of Brazil Study on the Introduction of Intelligent Transport Systems Final Report
3-65
(3) Rio 2016 Transport Strategy Used the base OD matrix of PDTU 2005 as starting point 547 TAZs Base year: 2011; Target year: 2016 Conducted auxiliary traffic counts around RMRJ from 2009 to 2011 Based on 2000 and 2010 IBGE Census Data Socioeconomic data used: population, employment, school enrollment, motorization rate, and
average income Population growth of 1.01%/year and employment growth of 1.43%/year in RMRJ from 2011 to
2016 Travel demand forecast method: not clear – reference to EMME Algorithm developed by Hans
Spiess for OD balancing 10% growth on trips from 2011 to 2016 20% demand reduction (due to school vacation and other traffic measures) for 2016 Olympic
Game scenarios
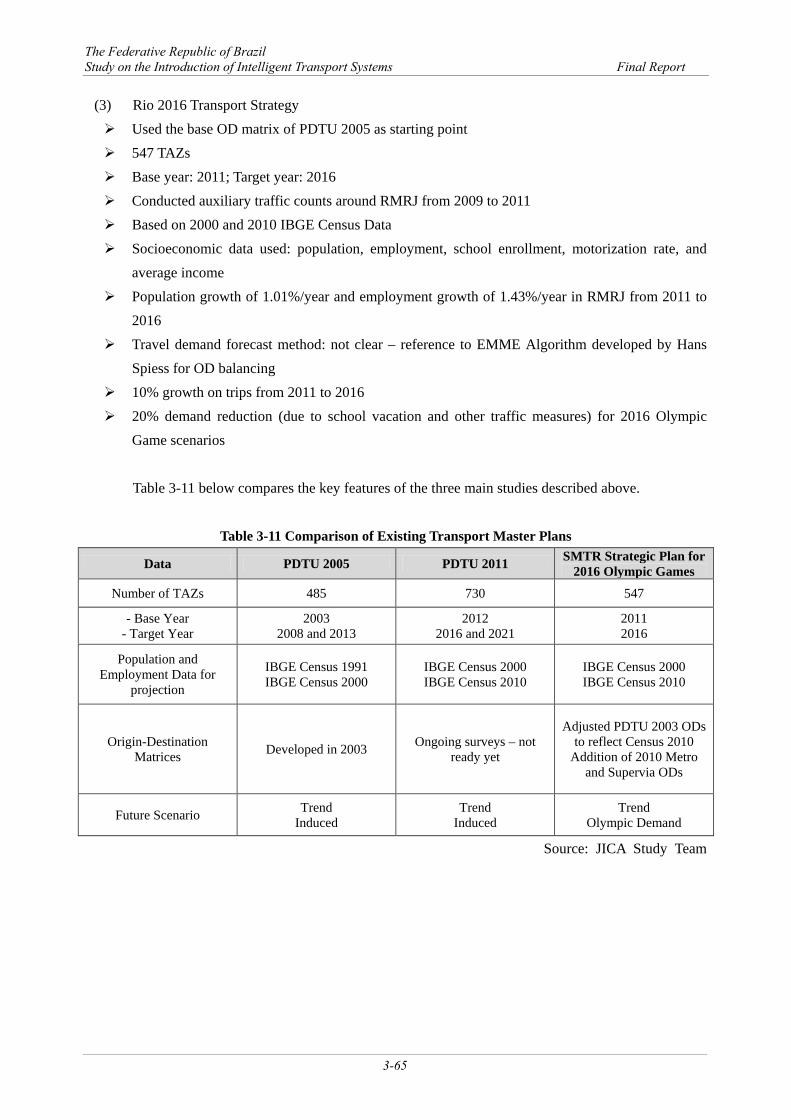
Table 3-11 below compares the key features of the three main studies described above.
Table 3-11 Comparison of Existing Transport Master Plans
Data PDTU 2005 PDTU 2011 SMTR Strategic Plan for 2016 Olympic Games
Number of TAZs 485 730 547
- Base Year - Target Year
2003 2008 and 2013
2012 2016 and 2021
2011 2016
Population and Employment Data for
projection
IBGE Census 1991 IBGE Census 2000
IBGE Census 2000 IBGE Census 2010
IBGE Census 2000 IBGE Census 2010
Origin-Destination Matrices Developed in 2003 Ongoing surveys – not
ready yet
Adjusted PDTU 2003 ODs to reflect Census 2010
Addition of 2010 Metro and Supervia ODs
Future Scenario Trend Induced
Trend Induced
Trend Olympic Demand
Source: JICA Study Team
The Federative Republic of Brazil Study on the Introduction of Intelligent Transport Systems Final Report
3-66
3.3.3 Methodology
(1) Methodology of Macroscopic Traffic Demand Forecast From the review of the three main sources discussed in the previous section, the JICA Study
Team found constraints on the availability of some data in the Rio 2016 Transport Strategy and PDTU 2011. These data were requested; however, they were neither available nor ready for replication and further analysis. In addition, given several discussions with the counterpart, the decentralization of a core business development center (downtown area) and creation of multiple sub-centers around the RMRJ have been acknowledged since 2003. The updated employment data and model validation were used to account for this change in the economic scenario. Based on the above, the 2003 base O-D matrix from PDTU 2005 was used as the basis for the traffic demand forecast. Initially, the team refined the PDTU 2005 TAZs from 485 to 547. The adopted base year was 2011 and the target years were 2016 and 2021. These items are described as follows:
(2) OD Assumptions 1) 2011 OD
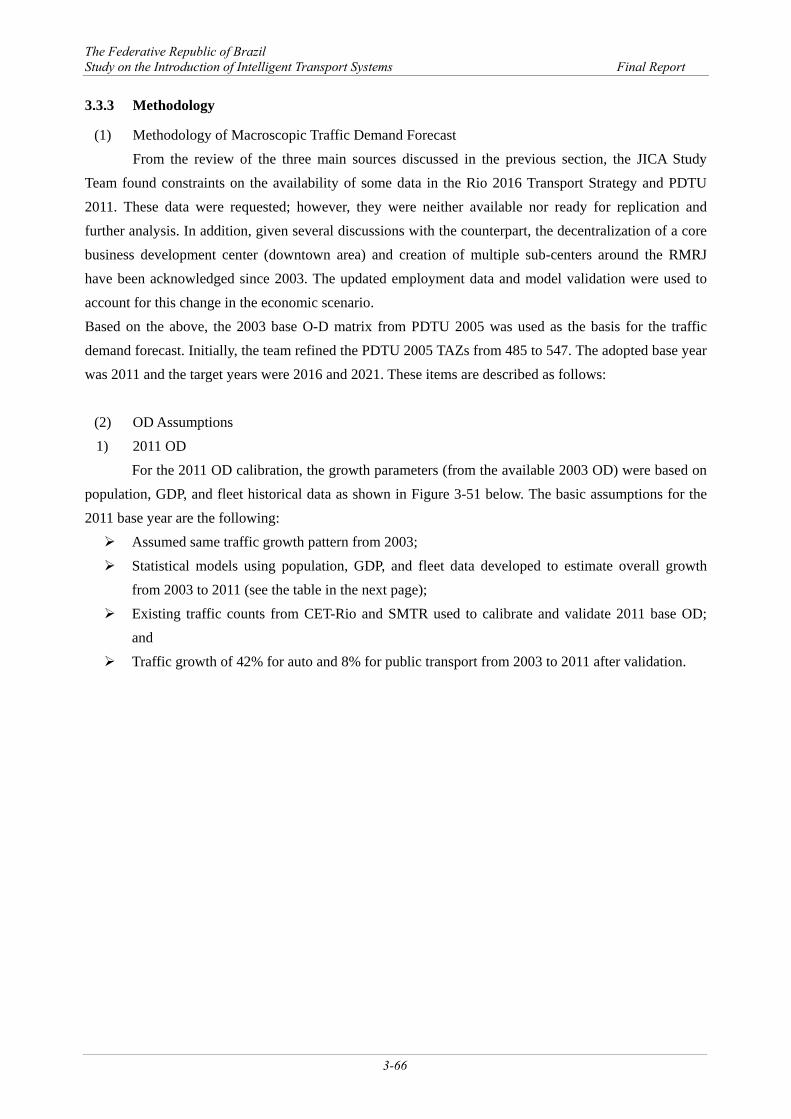
For the 2011 OD calibration, the growth parameters (from the available 2003 OD) were based on population, GDP, and fleet historical data as shown in Figure 3-51 below. The basic assumptions for the 2011 base year are the following: Assumed same traffic growth pattern from 2003; Statistical models using population, GDP, and fleet data developed to estimate overall growth
from 2003 to 2011 (see the table in the next page); Existing traffic counts from CET-Rio and SMTR used to calibrate and validate 2011 base OD;
and Traffic growth of 42% for auto and 8% for public transport from 2003 to 2011 after validation.
The Federative Republic of Brazil Study on the Introduction of Intelligent Transport Systems Final Report
3-67
Sources: IBGE, Detran, PDTU 2005, and IMF
Figure 3-51 Data Used to Estimate Gross Traffic Growth from 2003 to 2011
The Federative Republic of Brazil Study on the Introduction of Intelligent Transport Systems Final Report
3-68
For trip generation, distribution, modal split and assignment, the following assumptions are used for the 2011 base year: Bus Average Occupancy: 34 passengers/bus (SMTR Study) Van Average Occupancy: 5 passengers/van (SMTR Study) Auto Average Occupancy: 1.5 passengers/car (IPEA) Traffic Percentage (CET-Rio Data):
o 6.5% of daily traffic during evening peak hour and o 5.9% during morning peak hour
Assumed Capacity (HCM 2000 and Florida Dept of Transp. Quality/Level of Service 2009 Handbook): o Freeway: 2100 pcu/hour/lane o Major Arterial: 1800 pcu/hour/lane o Minor Arterial: 1000 pcu/hour/lane
Modal Split (PDTU 2005): o Auto: 26.3% o Bus: 64.9% o Train: 2.4% o Others (school bus, boat, cable tram): 3.6%
2) 2016 OD Developed from calibrated/validated 2011 base OD; Linear growth from socioeconomic data forecast (population, GDP, and fleet) (sources: IBGE,
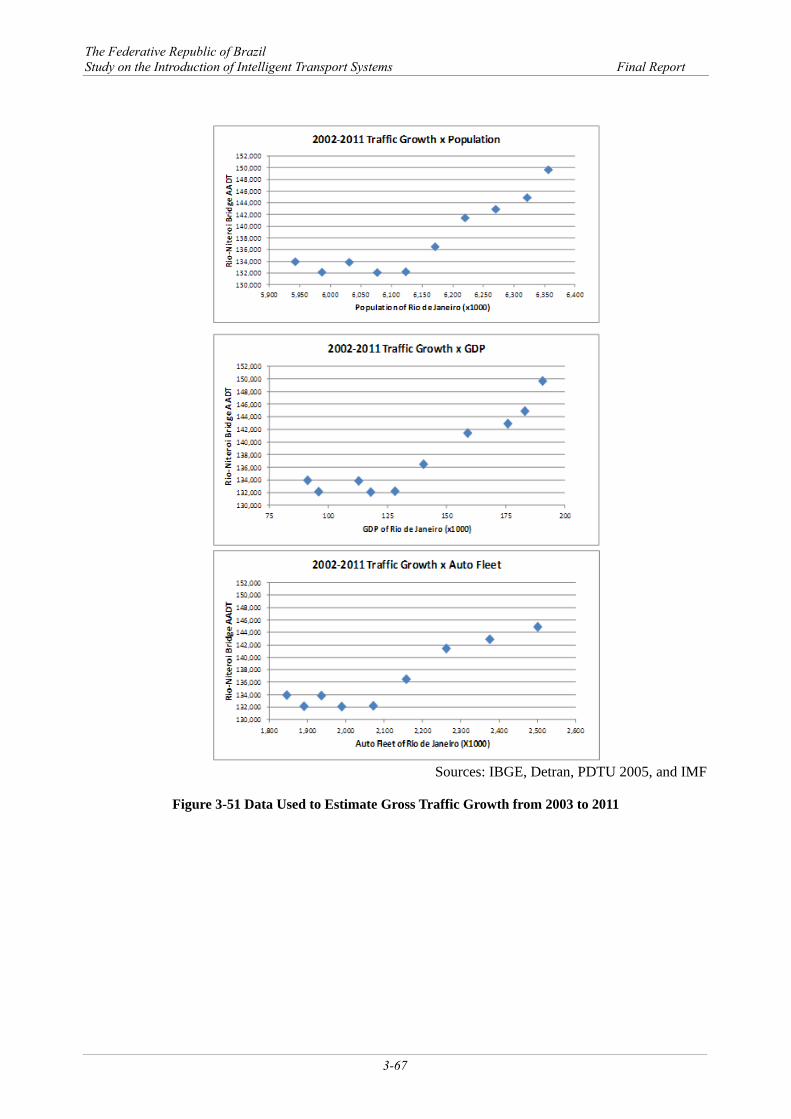
Detran and IMF); Two scenarios being developed: Regular traffic and Olympic Games (see Table 3-12 below); and Overall traffic growth of 4.9% from 2011 to 2016.
Table 3-12 Analysis Periods for Olympic Games Scenario
Day/Critical Hour Critical Zone Critical Demand Daily Demand for Olympic Games
3rd day/ 18:00 (Evening Peak) Barra 45,418 83,627
6th day/ 22:00 (Off-peak) Barra 45,877 104,495
9th day/ 8:00 (Morning Peak) Copacabana 14,316 170,231
10th day/ 21:00 (Off-peak) Maracana 81,202 303,741
11th day/ 16:00 (Off-peak)
Maracana Deodoro
66,378 15,180 102,495
Source: SMTR Strategic Plan for 2016 Olympic Games
The Federative Republic of Brazil Study on the Introduction of Intelligent Transport Systems Final Report
3-69
3) 2021 OD Developed from calibrated/validated 2011 base OD; Linear growth from socioeconomic data forecast (population, GDP, and fleet) (sources: IBGE,
Detran and IMF); and Overall traffic growth of 10.9% from 2011 to 2021.
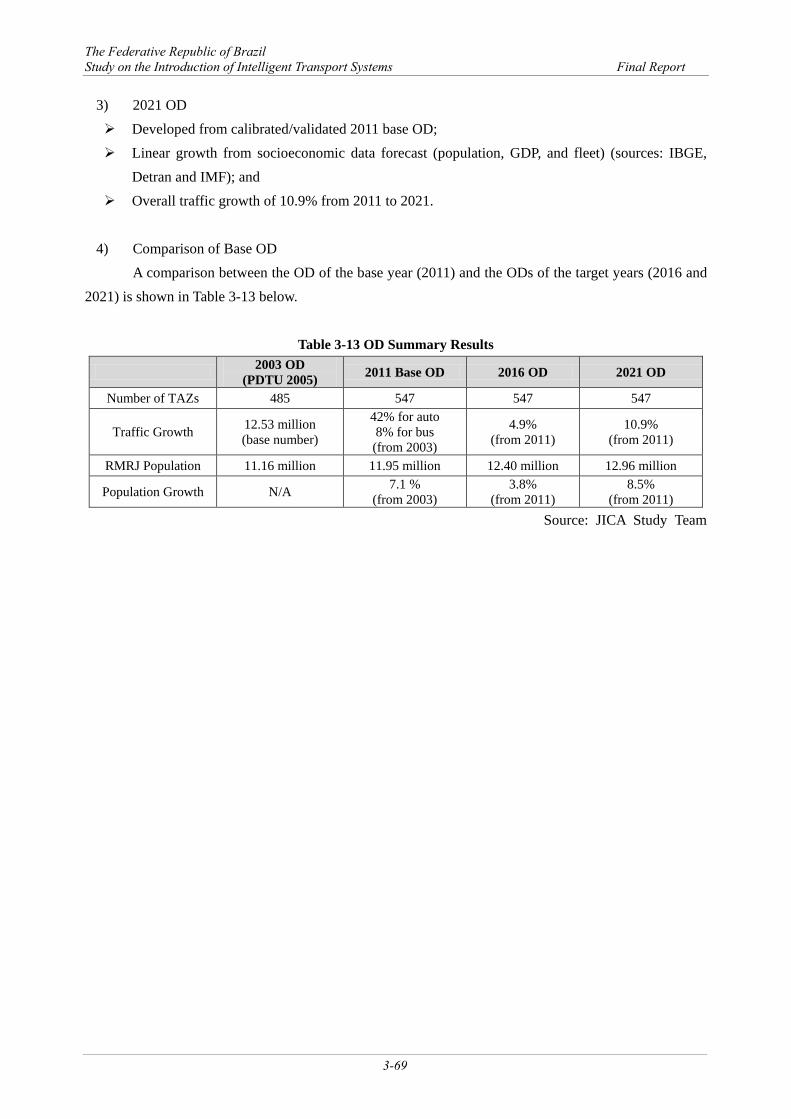
4) Comparison of Base OD
A comparison between the OD of the base year (2011) and the ODs of the target years (2016 and 2021) is shown in Table 3-13 below.
Table 3-13 OD Summary Results
2003 OD (PDTU 2005) 2011 Base OD 2016 OD 2021 OD
Number of TAZs 485 547 547 547
Traffic Growth 12.53 million (base number)
42% for auto 8% for bus (from 2003)
4.9% (from 2011)
10.9% (from 2011)
RMRJ Population 11.16 million 11.95 million 12.40 million 12.96 million
Population Growth N/A 7.1 % (from 2003)
3.8% (from 2011)
8.5% (from 2011)
Source: JICA Study Team
The Federative Republic of Brazil Study on the Introduction of Intelligent Transport Systems Final Report
3-70
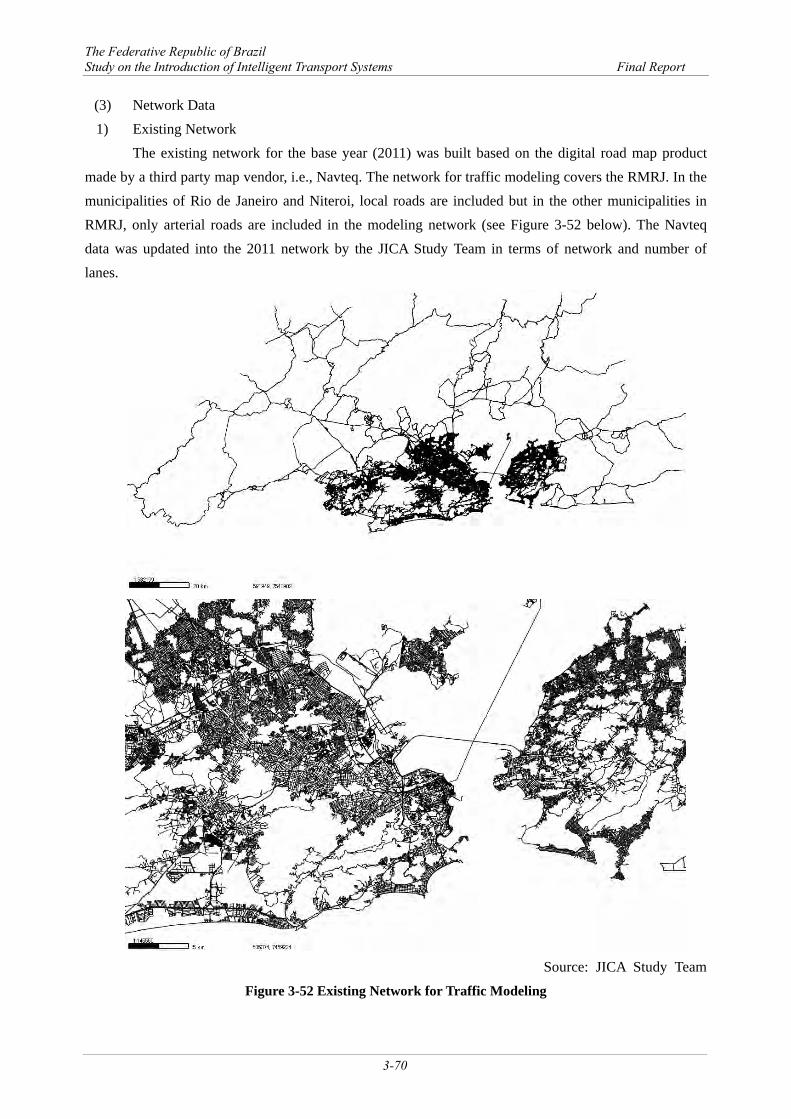
(3) Network Data 1) Existing Network
The existing network for the base year (2011) was built based on the digital road map product made by a third party map vendor, i.e., Navteq. The network for traffic modeling covers the RMRJ. In the municipalities of Rio de Janeiro and Niteroi, local roads are included but in the other municipalities in RMRJ, only arterial roads are included in the modeling network (see Figure 3-52 below). The Navteq data was updated into the 2011 network by the JICA Study Team in terms of network and number of lanes.
Source: JICA Study Team
Figure 3-52 Existing Network for Traffic Modeling
The Federative Republic of Brazil Study on the Introduction of Intelligent Transport Systems Final Report
3-71
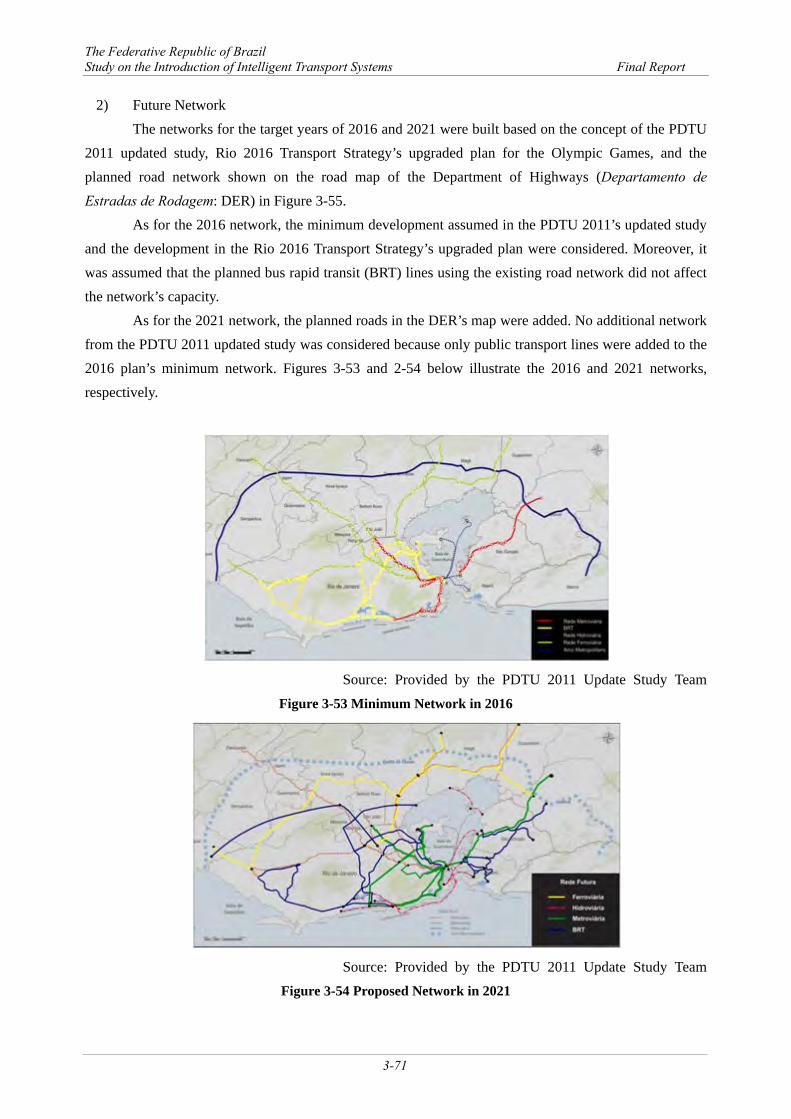
2) Future Network The networks for the target years of 2016 and 2021 were built based on the concept of the PDTU
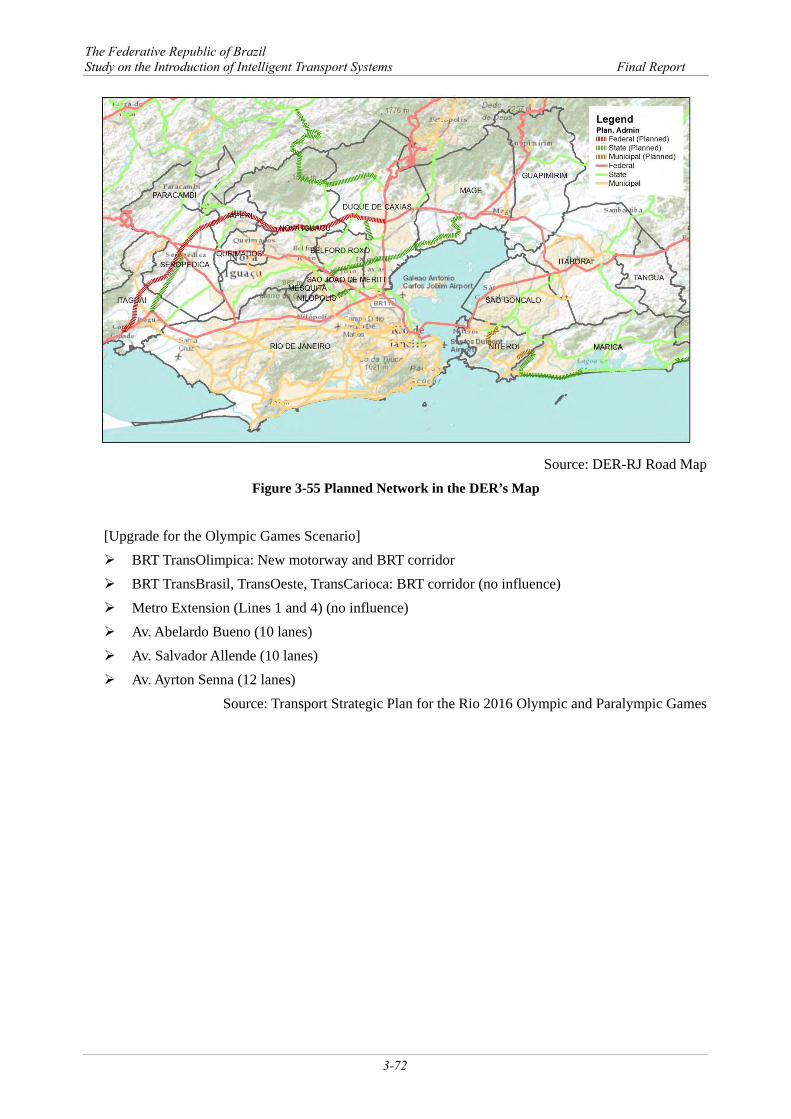
2011 updated study, Rio 2016 Transport Strategy’s upgraded plan for the Olympic Games, and the planned road network shown on the road map of the Department of Highways (Departamento de Estradas de Rodagem: DER) in Figure 3-55.
As for the 2016 network, the minimum development assumed in the PDTU 2011’s updated study and the development in the Rio 2016 Transport Strategy’s upgraded plan were considered. Moreover, it was assumed that the planned bus rapid transit (BRT) lines using the existing road network did not affect the network’s capacity.
As for the 2021 network, the planned roads in the DER’s map were added. No additional network from the PDTU 2011 updated study was considered because only public transport lines were added to the 2016 plan’s minimum network. Figures 3-53 and 2-54 below illustrate the 2016 and 2021 networks, respectively.
Source: Provided by the PDTU 2011 Update Study Team
Figure 3-53 Minimum Network in 2016
Source: Provided by the PDTU 2011 Update Study Team
Figure 3-54 Proposed Network in 2021
The Federative Republic of Brazil Study on the Introduction of Intelligent Transport Systems Final Report
3-72
Source: DER-RJ Road Map
Figure 3-55 Planned Network in the DER’s Map
[Upgrade for the Olympic Games Scenario] BRT TransOlimpica: New motorway and BRT corridor BRT TransBrasil, TransOeste, TransCarioca: BRT corridor (no influence) Metro Extension (Lines 1 and 4) (no influence) Av. Abelardo Bueno (10 lanes) Av. Salvador Allende (10 lanes) Av. Ayrton Senna (12 lanes)
Source: Transport Strategic Plan for the Rio 2016 Olympic and Paralympic Games
The Federative Republic of Brazil Study on the Introduction of Intelligent Transport Systems Final Report
3-73
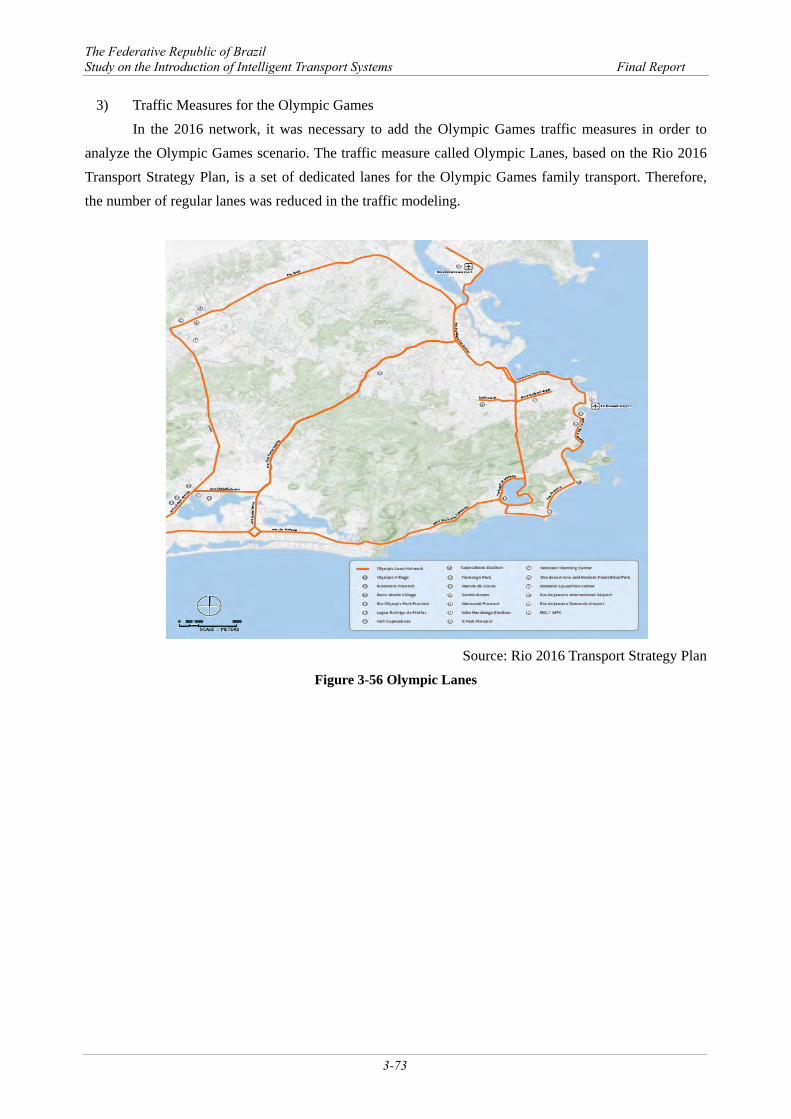
3) Traffic Measures for the Olympic Games In the 2016 network, it was necessary to add the Olympic Games traffic measures in order to
analyze the Olympic Games scenario. The traffic measure called Olympic Lanes, based on the Rio 2016 Transport Strategy Plan, is a set of dedicated lanes for the Olympic Games family transport. Therefore, the number of regular lanes was reduced in the traffic modeling.
Source: Rio 2016 Transport Strategy Plan
Figure 3-56 Olympic Lanes
The Federative Republic of Brazil Study on the Introduction of Intelligent Transport Systems Final Report
3-74
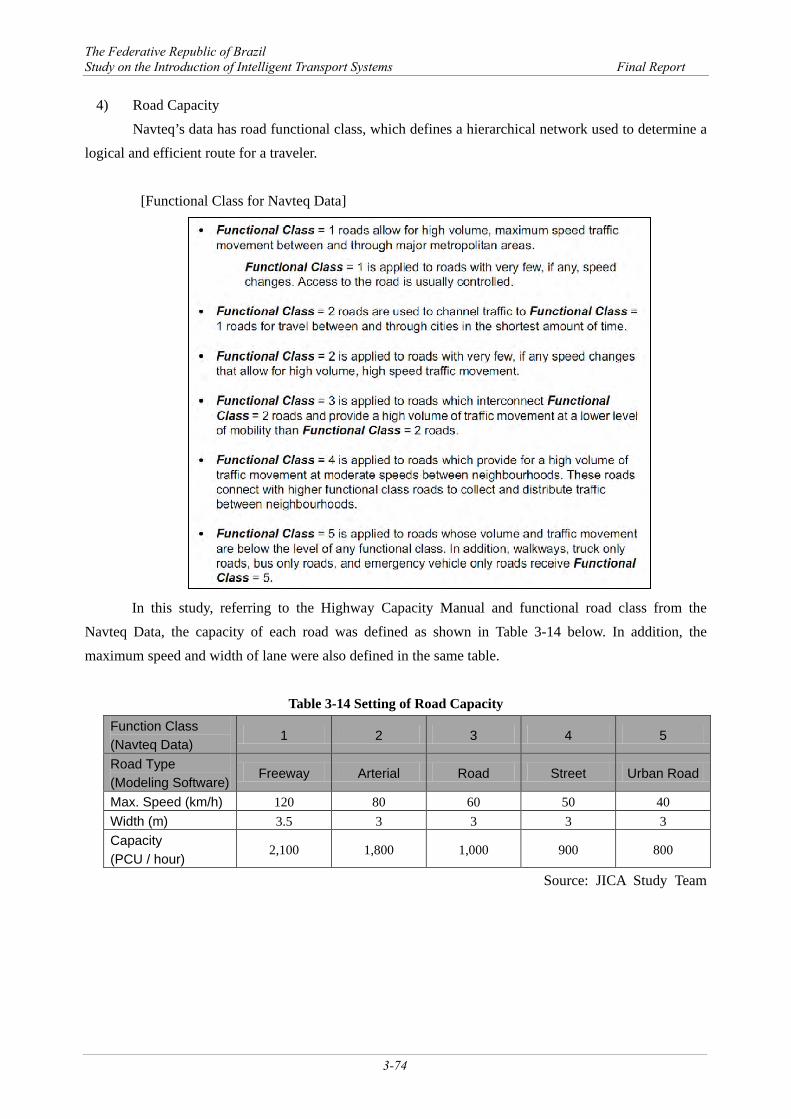
4) Road Capacity Navteq’s data has road functional class, which defines a hierarchical network used to determine a
logical and efficient route for a traveler.
[Functional Class for Navteq Data]
In this study, referring to the Highway Capacity Manual and functional road class from the
Navteq Data, the capacity of each road was defined as shown in Table 3-14 below. In addition, the maximum speed and width of lane were also defined in the same table.
Table 3-14 Setting of Road Capacity
Function Class (Navteq Data)
1 2 3 4 5
Road Type (Modeling Software)
Freeway Arterial Road Street Urban Road
Max. Speed (km/h) 120 80 60 50 40 Width (m) 3.5 3 3 3 3 Capacity (PCU / hour)
2,100 1,800 1,000 900 800
Source: JICA Study Team
The Federative Republic of Brazil Study on the Introduction of Intelligent Transport Systems Final Report
3-75
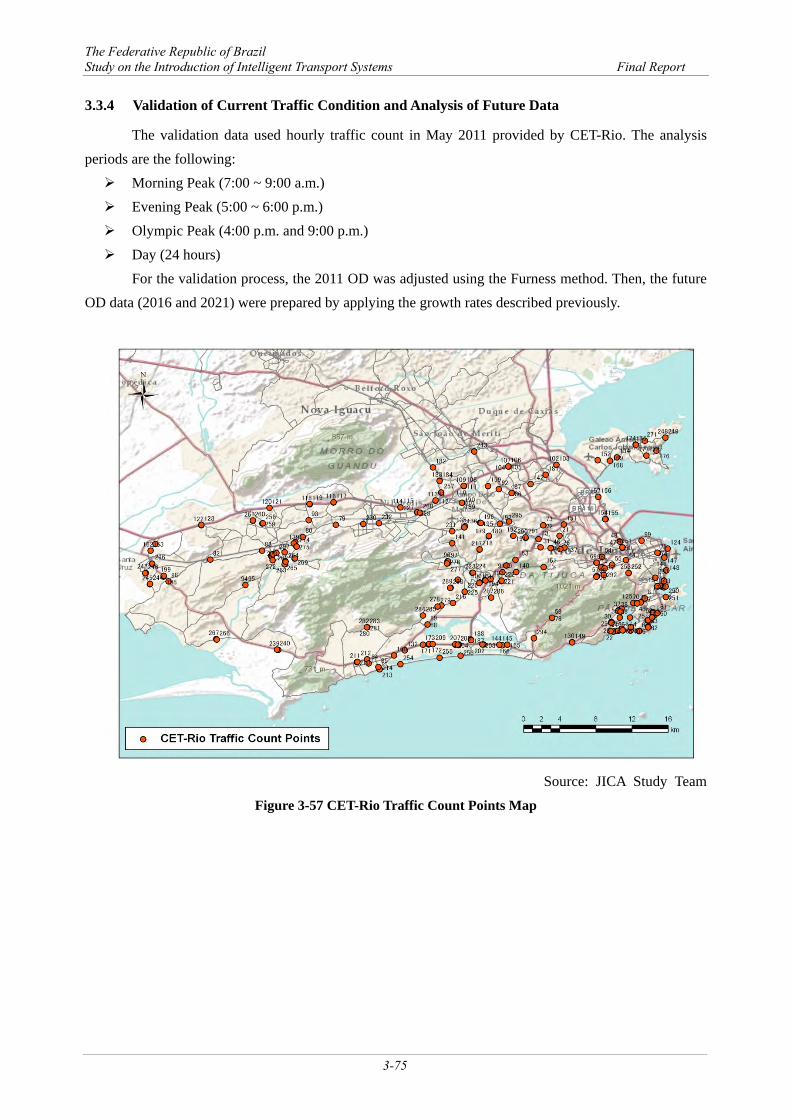
3.3.4 Validation of Current Traffic Condition and Analysis of Future Data
The validation data used hourly traffic count in May 2011 provided by CET-Rio. The analysis periods are the following: Morning Peak (7:00 ~ 9:00 a.m.) Evening Peak (5:00 ~ 6:00 p.m.) Olympic Peak (4:00 p.m. and 9:00 p.m.) Day (24 hours)
For the validation process, the 2011 OD was adjusted using the Furness method. Then, the future OD data (2016 and 2021) were prepared by applying the growth rates described previously.
Source: JICA Study Team
Figure 3-57 CET-Rio Traffic Count Points Map
The Federative Republic of Brazil Study on the Introduction of Intelligent Transport Systems Final Report
3-76
(1) Validation Result The assignment accuracy was evaluated by using the day (24 hours) assignment results. The
evaluation was conducted under two cases, namely, “arterial road” and “multilane arterial road”. Based on the results shown in Figures 3-58 and 3-59 below, the “multilane arterial road” case was adopted. [Arterial Road: Functional Road Class 1 and 2 (68 points)]
Source: JICA Study Team Figure 3-58 Assignment Accuracy in “Arterial Road” Case
[Multilane Arterial Road: Functional Road Class 1 and 2 and Number of Lanes: 4 (15 points)]
Source: JICA Study Team
Figure 3-59 Assignment Accuracy in “Multilane Arterial Road” Case
PCU (Car + 2 * Bus) Car
Real Data
Ass
igne
dre
sult
0
10000
20000
30000
40000
50000
60000
70000
80000
90000
100000
0 20000 40000 60000 80000 100000
Car_Assigned
0
10000
20000
30000
40000
50000
60000
70000
80000
90000
100000
0 20000 40000 60000 80000 100000
Vehicle_Assigned
Real Data
Ass
igne
dre
sult
R2 0.94% RMS 16%
R2 0.94% RMS 14%
Car PCU (Car + 2 * Bus)
0
10000
20000
30000
40000
50000
60000
70000
80000
90000
100000
0 20000 40000 60000 80000 100000
Car_Assigned
Real Data
Ass
igne
dre
sult
0
10000
20000
30000
40000
50000
60000
70000
80000
90000
100000
0 20000 40000 60000 80000 100000
Vehicle_Assigned
Real Data
Ass
igne
dre
sult
R2 0.89% RMS 23%
R2 0.89% RMS 23%
The Federative Republic of Brazil Study on the Introduction of Intelligent Transport Systems Final Report
3-77
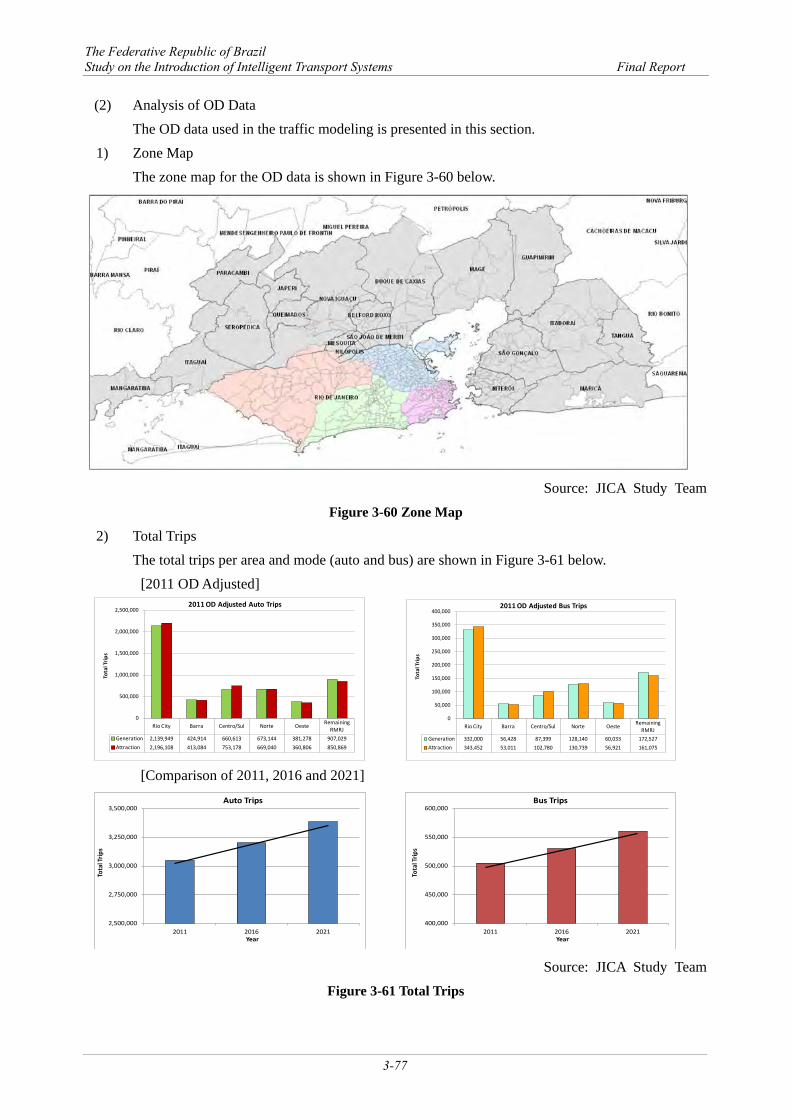
(2) Analysis of OD Data The OD data used in the traffic modeling is presented in this section.
1) Zone Map The zone map for the OD data is shown in Figure 3-60 below.
Source: JICA Study Team
Figure 3-60 Zone Map
2) Total Trips The total trips per area and mode (auto and bus) are shown in Figure 3-61 below.
[2011 OD Adjusted]
[Comparison of 2011, 2016 and 2021]
Source: JICA Study Team
Figure 3-61 Total Trips
400,000
450,000
500,000
550,000
600,000
2011 2016 2021
Tota
l Trip
s
Year
Bus Trips
2,500,000
2,750,000
3,000,000
3,250,000
3,500,000
2011 2016 2021
Tota
l Trip
s
Year
Auto Trips
Rio City Barra Centro/Sul Norte Oeste Remaining RMRJ
Generation 2,139,949 424,914 660,613 673,144 381,278 907,029Attraction 2,196,108 413,084 753,178 669,040 360,806 850,869
0
500,000
1,000,000
1,500,000
2,000,000
2,500,000
Tota
l Trip
s
2011 OD Adjusted Auto Trips
Rio City Barra Centro/Sul Norte Oeste Remaining RMRJ
Generation 332,000 56,428 87,399 128,140 60,033 172,527Attraction 343,452 53,011 102,780 130,739 56,921 161,075
0
50,000
100,000
150,000
200,000
250,000
300,000
350,000
400,000
Tota
l Tri
ps
2011 OD Adjusted Bus Trips
The Federative Republic of Brazil Study on the Introduction of Intelligent Transport Systems Final Report
3-78
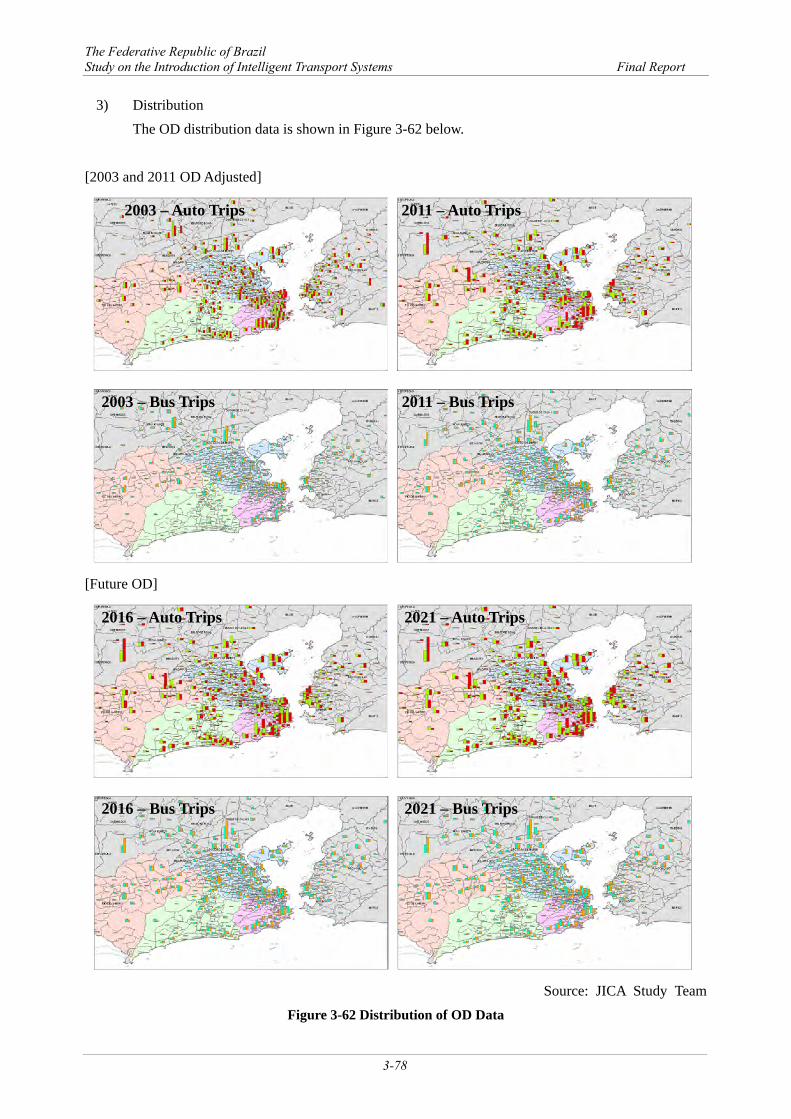
3) Distribution The OD distribution data is shown in Figure 3-62 below.
[2003 and 2011 OD Adjusted]
[Future OD]
Source: JICA Study Team Figure 3-62 Distribution of OD Data
2021 – Bus Trips 2016 – Bus Trips
2016 – Auto Trips 2021 – Auto Trips
2011 – Bus Trips 2003 – Bus Trips
2003 – Auto Trips 2011 – Auto Trips
The Federative Republic of Brazil Study on the Introduction of Intelligent Transport Systems Final Report
3-79
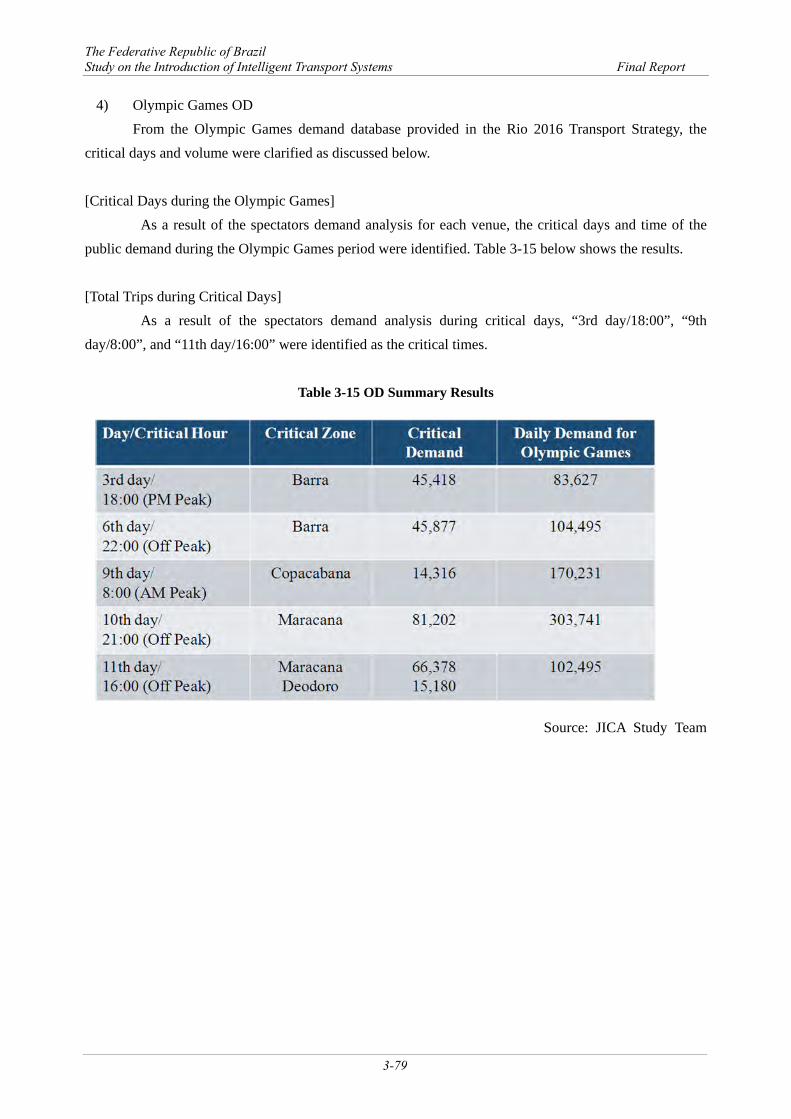
4) Olympic Games OD From the Olympic Games demand database provided in the Rio 2016 Transport Strategy, the
critical days and volume were clarified as discussed below. [Critical Days during the Olympic Games]
As a result of the spectators demand analysis for each venue, the critical days and time of the public demand during the Olympic Games period were identified. Table 3-15 below shows the results. [Total Trips during Critical Days]
As a result of the spectators demand analysis during critical days, “3rd day/18:00”, “9th day/8:00”, and “11th day/16:00” were identified as the critical times.
Table 3-15 OD Summary Results
Source: JICA Study Team
The Federative Republic of Brazil Study on the Introduction of Intelligent Transport Systems Final Report
3-80
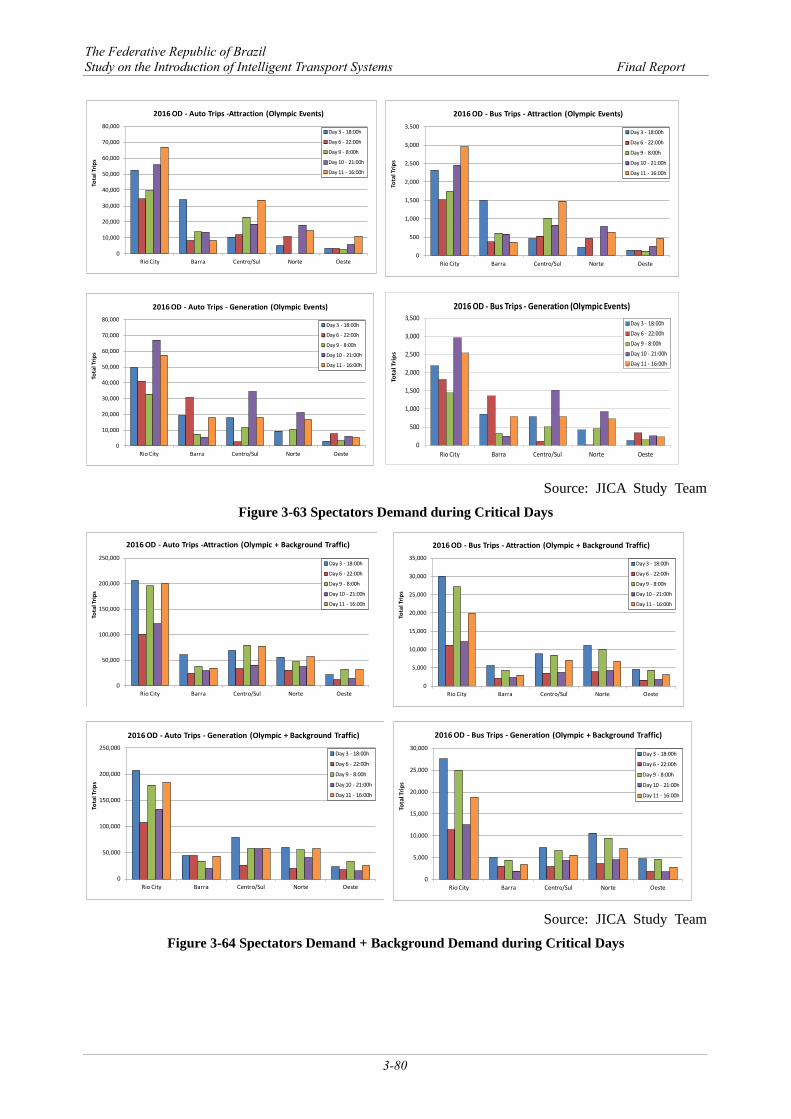
Source: JICA Study Team Figure 3-63 Spectators Demand during Critical Days
Source: JICA Study Team
Figure 3-64 Spectators Demand + Background Demand during Critical Days
0
50,000
100,000
150,000
200,000
250,000
Rio City Barra Centro/Sul Norte Oeste
Tota
l Trip
s
2016 OD - Auto Trips - Generation (Olympic + Background Traffic)
Day 3 - 18:00h
Day 6 - 22:00h
Day 9 - 8:00h
Day 10 - 21:00h
Day 11 - 16:00h
0
5,000
10,000
15,000
20,000
25,000
30,000
Rio City Barra Centro/Sul Norte Oeste
Tota
l Trip
s
2016 OD - Bus Trips - Generation (Olympic + Background Traffic)
Day 3 - 18:00h
Day 6 - 22:00h
Day 9 - 8:00h
Day 10 - 21:00h
Day 11 - 16:00h
0
50,000
100,000
150,000
200,000
250,000
Rio City Barra Centro/Sul Norte Oeste
Tota
l Trip
s
2016 OD - Auto Trips -Attraction (Olympic + Background Traffic)
Day 3 - 18:00h
Day 6 - 22:00h
Day 9 - 8:00h
Day 10 - 21:00h
Day 11 - 16:00h
0
5,000
10,000
15,000
20,000
25,000
30,000
35,000
Rio City Barra Centro/Sul Norte Oeste
Tota
l Trip
s
2016 OD - Bus Trips - Attraction (Olympic + Background Traffic)
Day 3 - 18:00h
Day 6 - 22:00h
Day 9 - 8:00h
Day 10 - 21:00h
Day 11 - 16:00h
0
10,000
20,000
30,000
40,000
50,000
60,000
70,000
80,000
Rio City Barra Centro/Sul Norte Oeste
Tota
l Trip
s
2016 OD - Auto Trips - Generation (Olympic Events)
Day 3 - 18:00h
Day 6 - 22:00h
Day 9 - 8:00h
Day 10 - 21:00h
Day 11 - 16:00h
0
10,000
20,000
30,000
40,000
50,000
60,000
70,000
80,000
Rio City Barra Centro/Sul Norte Oeste
Tota
l Trip
s
2016 OD - Auto Trips -Attraction (Olympic Events)
Day 3 - 18:00h
Day 6 - 22:00h
Day 9 - 8:00h
Day 10 - 21:00h
Day 11 - 16:00h
0
500
1,000
1,500
2,000
2,500
3,000
3,500
Rio City Barra Centro/Sul Norte Oeste
Tota
l Trip
s
2016 OD - Bus Trips - Attraction (Olympic Events)
Day 3 - 18:00h
Day 6 - 22:00h
Day 9 - 8:00h
Day 10 - 21:00h
Day 11 - 16:00h
0
500
1,000
1,500
2,000
2,500
3,000
3,500
Rio City Barra Centro/Sul Norte Oeste
Tota
l Tri
ps
2016 OD - Bus Trips - Generation (Olympic Events)
Day 3 - 18:00hDay 6 - 22:00hDay 9 - 8:00hDay 10 - 21:00hDay 11 - 16:00h
The Federative Republic of Brazil Study on the Introduction of Intelligent Transport Systems Final Report
3-81
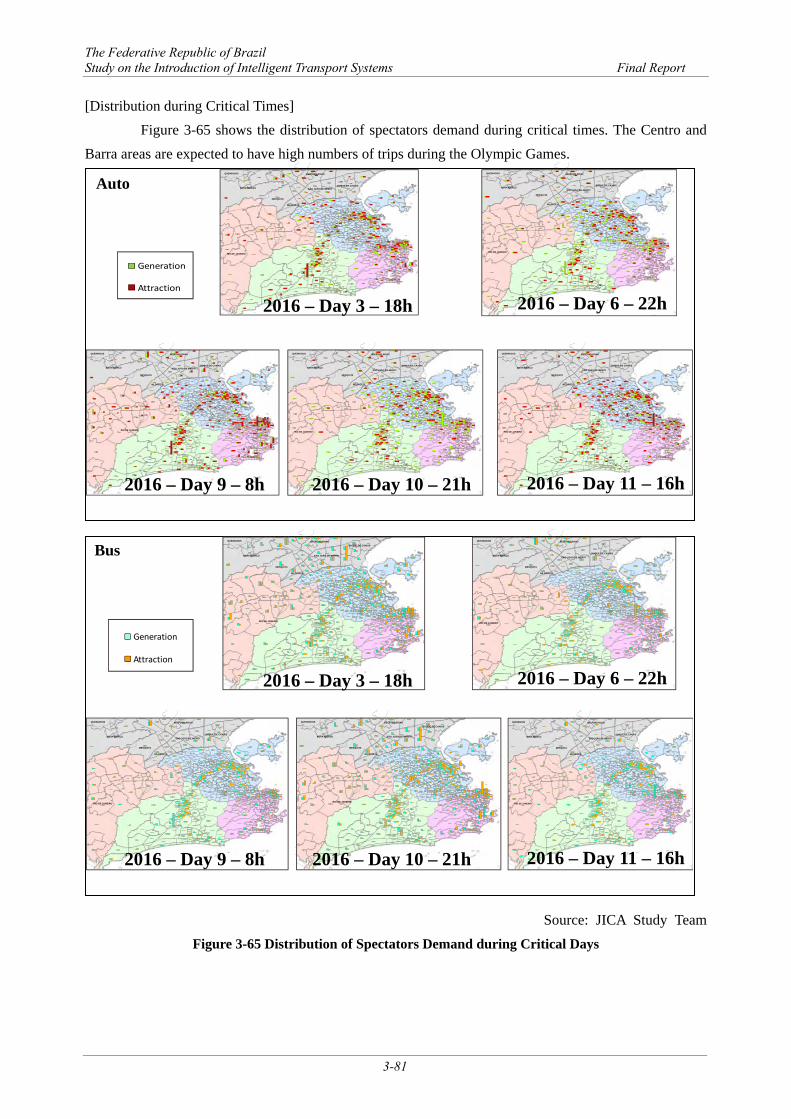
[Distribution during Critical Times] Figure 3-65 shows the distribution of spectators demand during critical times. The Centro and
Barra areas are expected to have high numbers of trips during the Olympic Games.
Source: JICA Study Team Figure 3-65 Distribution of Spectators Demand during Critical Days
RIO DE JANEIRO
NOVA IGUAÇU
MESQUITA
DUQUE DE CAXIAS
NILÓPOLIS
SÃO JOÃO DE MERITI
BELFORD ROXOQUEIMADOS
RIO DE JANEIRO
NOVA IGUAÇU
MESQUITA
DUQUE DE CAXIAS
NILÓPOLIS
SÃO JOÃO DE MERITI
BELFORD ROXOQUEIMADOS
RIO DE JANEIRO
NOVA IGUAÇU
MESQUITA
DUQUE DE CAXIAS
NILÓPOLIS
SÃO JOÃO DE MERITI
BELFORD ROXOQUEIMADOS
RIO DE JANEIRO
NOVA IGUAÇU
MESQUITA
DUQUE DE CAXIAS
NILÓPOLIS
SÃO JOÃO DE MERITI
BELFORD ROXOQUEIMADOS
RIO DE JANEIRO
NOVA IGUAÇU
MESQUITA
DUQUE DE CAXIAS
NILÓPOLIS
SÃO JOÃO DE MERITI
BELFORD ROXOQUEIMADOS
Bus
2016 – Day 3 – 18h 2016 – Day 6 – 22h
2016 – Day 11 – 16h2016 – Day 10 – 21h 2016 – Day 9 – 8h
Generation
Attraction
RIO DE JANEIRO
NOVA IGUAÇU
MESQUITA
DUQUE DE CAXIAS
NILÓPOLIS
SÃO JOÃO DE MERITI
BELFORD ROXOQUEIMADOS
RIO DE JANEIRO
NOVA IGUAÇU
MESQUITA
DUQUE DE CAXIAS
NILÓPOLIS
SÃO JOÃO DE MERITI
BELFORD ROXOQUEIMADOS
RIO DE JANEIRO
NOVA IGUAÇU
MESQUITA
DUQUE DE CAXIAS
NILÓPOLIS
SÃO JOÃO DE MERITI
BELFORD ROXOQUEIMADOS
RIO DE JANEIRO
NOVA IGUAÇU
MESQUITA
DUQUE DE CAXIAS
NILÓPOLIS
SÃO JOÃO DE MERITI
BELFORD ROXOQUEIMADOS
RIO DE JANEIRO
NOVA IGUAÇU
MESQUITA
DUQUE DE CAXIAS
NILÓPOLIS
SÃO JOÃO DE MERITI
BELFORD ROXOQUEIMADOS
Generation
Attraction
2016 – Day 3 – 18h 2016 – Day 6 – 22h
2016 – Day 11 – 16h2016 – Day 10 – 21h 2016 – Day 9 – 8h
Auto
The Federative Republic of Brazil Study on the Introduction of Intelligent Transport Systems Final Report
3-82
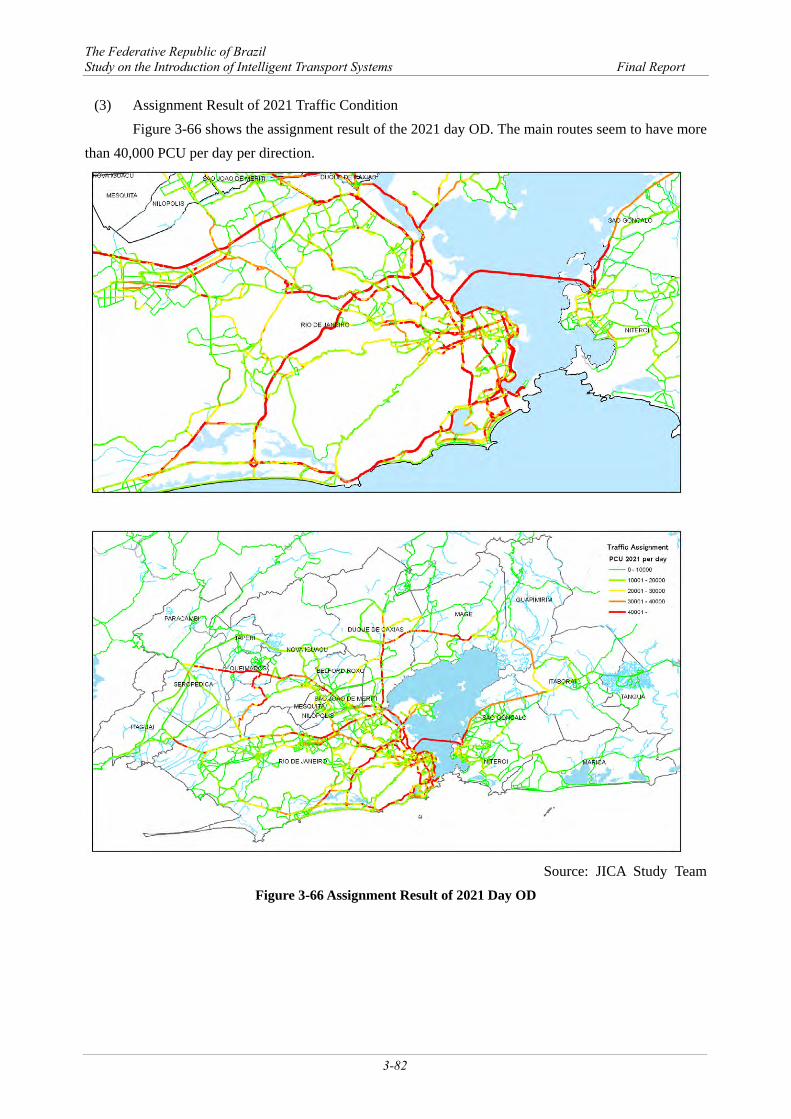
(3) Assignment Result of 2021 Traffic Condition Figure 3-66 shows the assignment result of the 2021 day OD. The main routes seem to have more
than 40,000 PCU per day per direction.
Source: JICA Study Team
Figure 3-66 Assignment Result of 2021 Day OD
The Federative Republic of Brazil Study on the Introduction of Intelligent Transport Systems Final Report
3-83
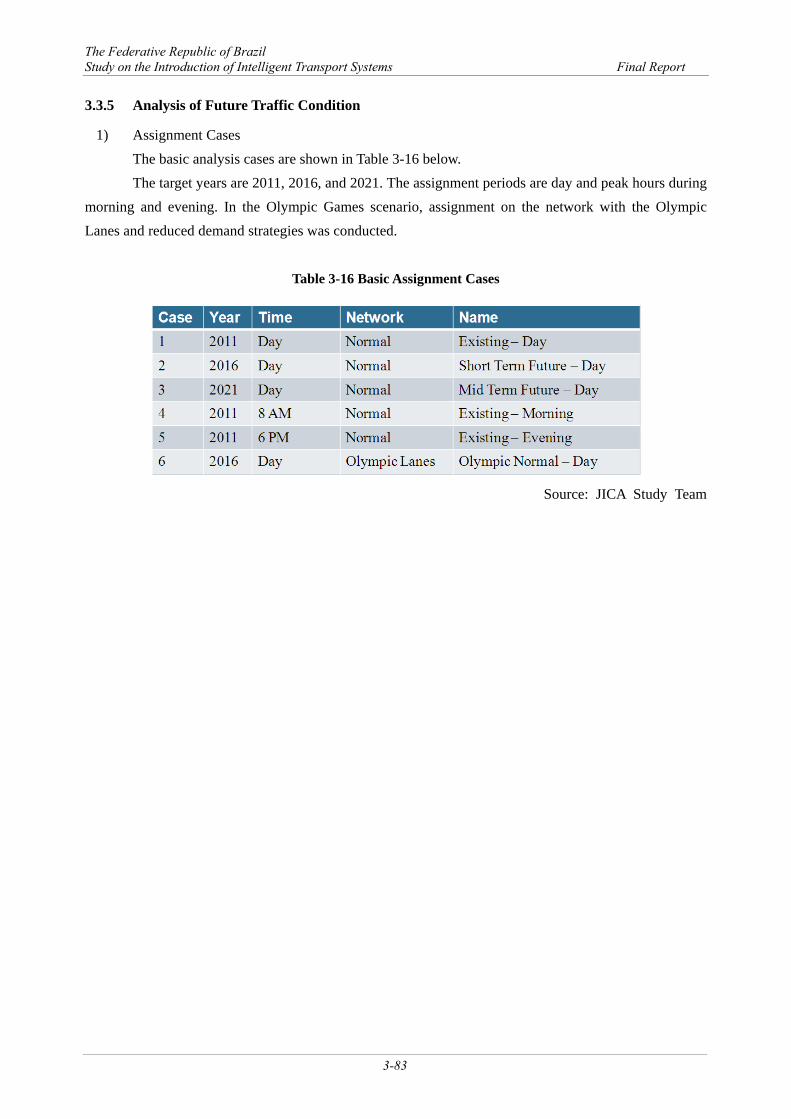
3.3.5 Analysis of Future Traffic Condition
1) Assignment Cases The basic analysis cases are shown in Table 3-16 below. The target years are 2011, 2016, and 2021. The assignment periods are day and peak hours during
morning and evening. In the Olympic Games scenario, assignment on the network with the Olympic Lanes and reduced demand strategies was conducted.
Table 3-16 Basic Assignment Cases
Source: JICA Study Team
The Federative Republic of Brazil Study on the Introduction of Intelligent Transport Systems Final Report
3-84
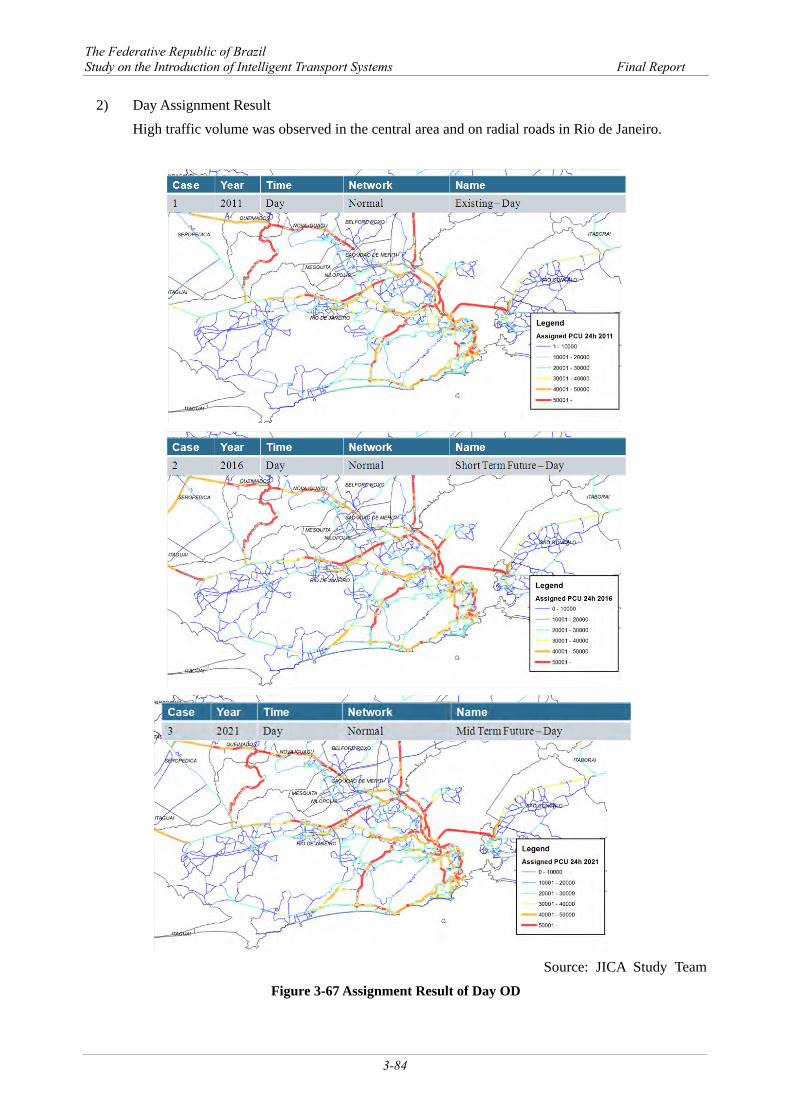
2) Day Assignment Result High traffic volume was observed in the central area and on radial roads in Rio de Janeiro.
Source: JICA Study Team
Figure 3-67 Assignment Result of Day OD
The Federative Republic of Brazil Study on the Introduction of Intelligent Transport Systems Final Report
3-85
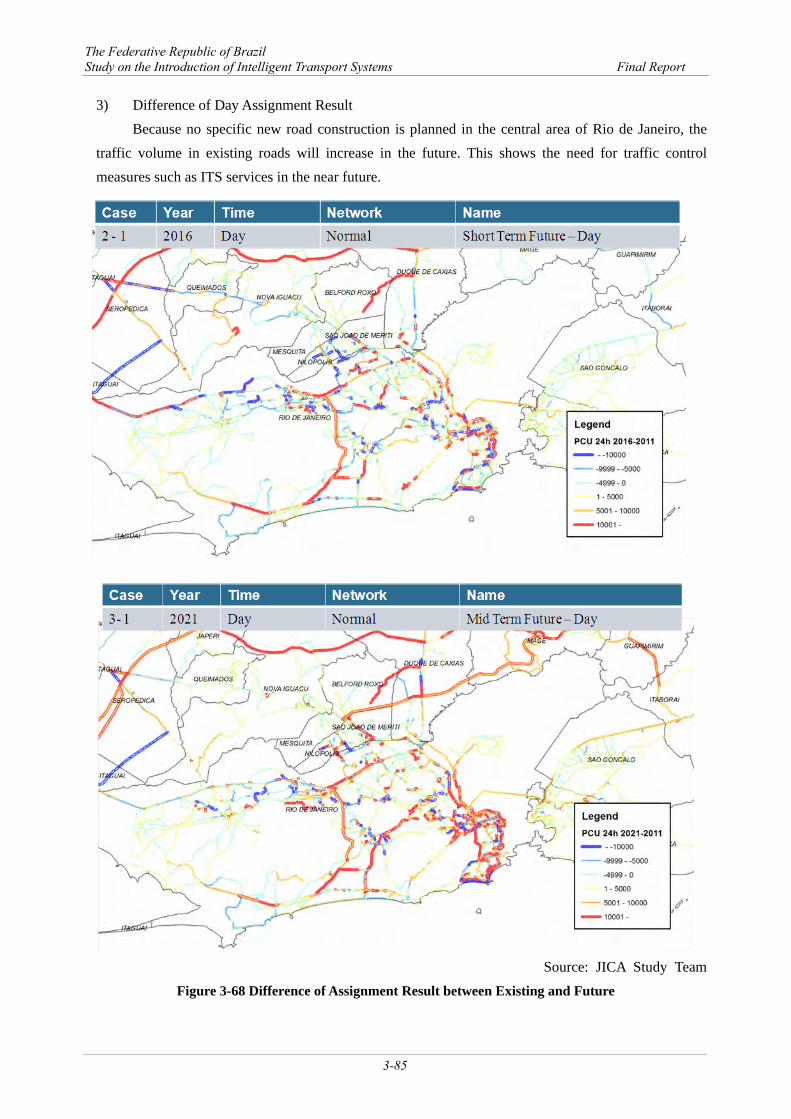
3) Difference of Day Assignment Result Because no specific new road construction is planned in the central area of Rio de Janeiro, the
traffic volume in existing roads will increase in the future. This shows the need for traffic control measures such as ITS services in the near future.
Source: JICA Study Team
Figure 3-68 Difference of Assignment Result between Existing and Future
The Federative Republic of Brazil Study on the Introduction of Intelligent Transport Systems Final Report
3-86
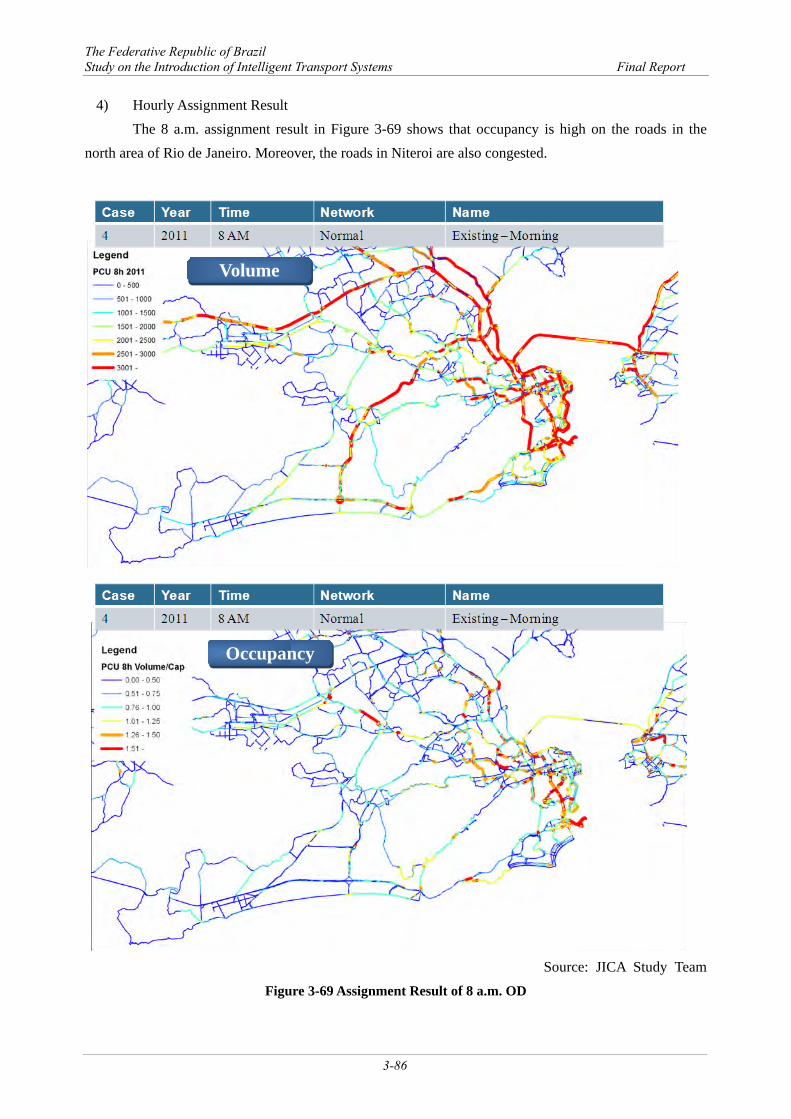
4) Hourly Assignment Result The 8 a.m. assignment result in Figure 3-69 shows that occupancy is high on the roads in the
north area of Rio de Janeiro. Moreover, the roads in Niteroi are also congested.
Source: JICA Study Team
Figure 3-69 Assignment Result of 8 a.m. OD
Occupancy
Volume
The Federative Republic of Brazil Study on the Introduction of Intelligent Transport Systems Final Report
3-87
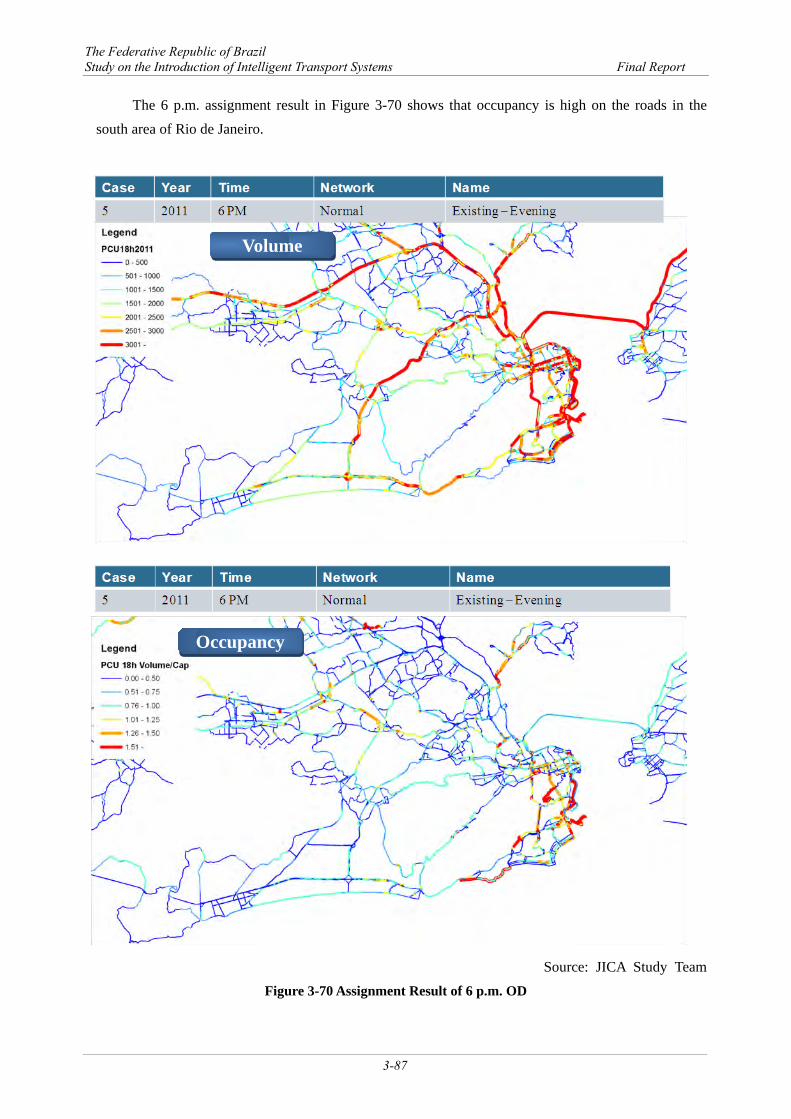
The 6 p.m. assignment result in Figure 3-70 shows that occupancy is high on the roads in the south area of Rio de Janeiro.
Source: JICA Study Team Figure 3-70 Assignment Result of 6 p.m. OD
Occupancy
Volume
The Federative Republic of Brazil Study on the Introduction of Intelligent Transport Systems Final Report
3-88
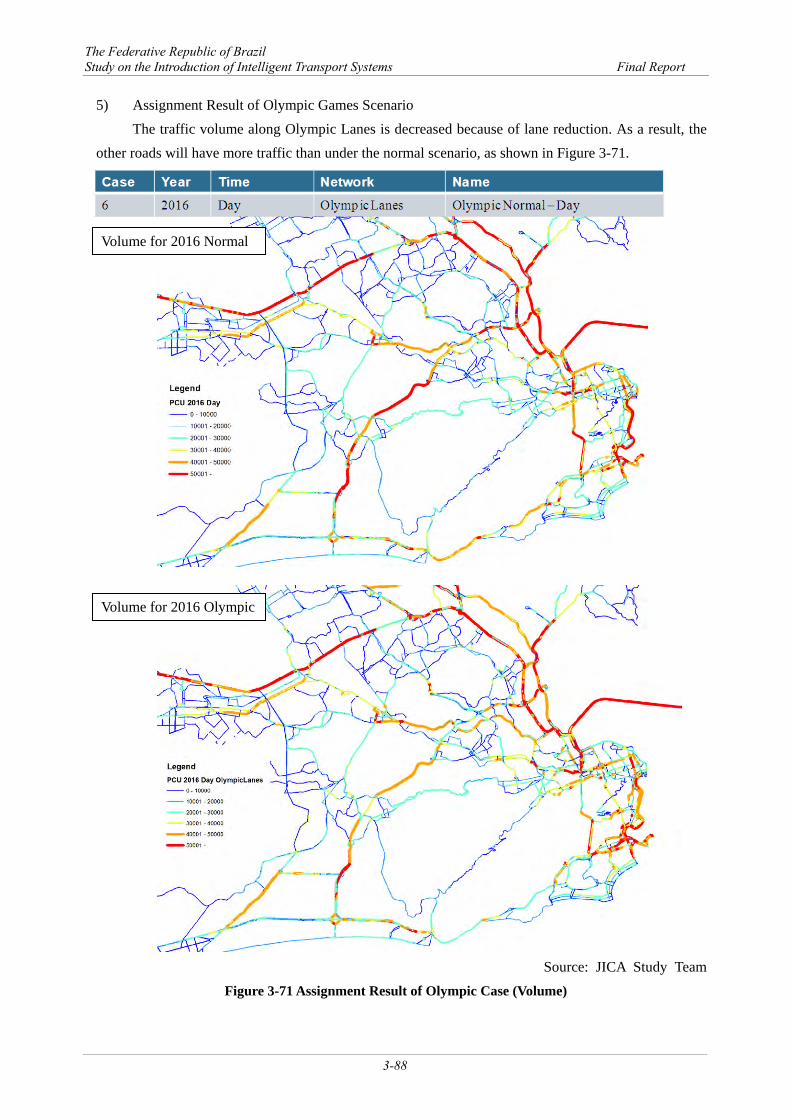
5) Assignment Result of Olympic Games Scenario The traffic volume along Olympic Lanes is decreased because of lane reduction. As a result, the
other roads will have more traffic than under the normal scenario, as shown in Figure 3-71.
Source: JICA Study Team
Figure 3-71 Assignment Result of Olympic Case (Volume)
Volume for 2016 Normal
Volume for 2016 Olympic
The Federative Republic of Brazil Study on the Introduction of Intelligent Transport Systems Final Report
3-89
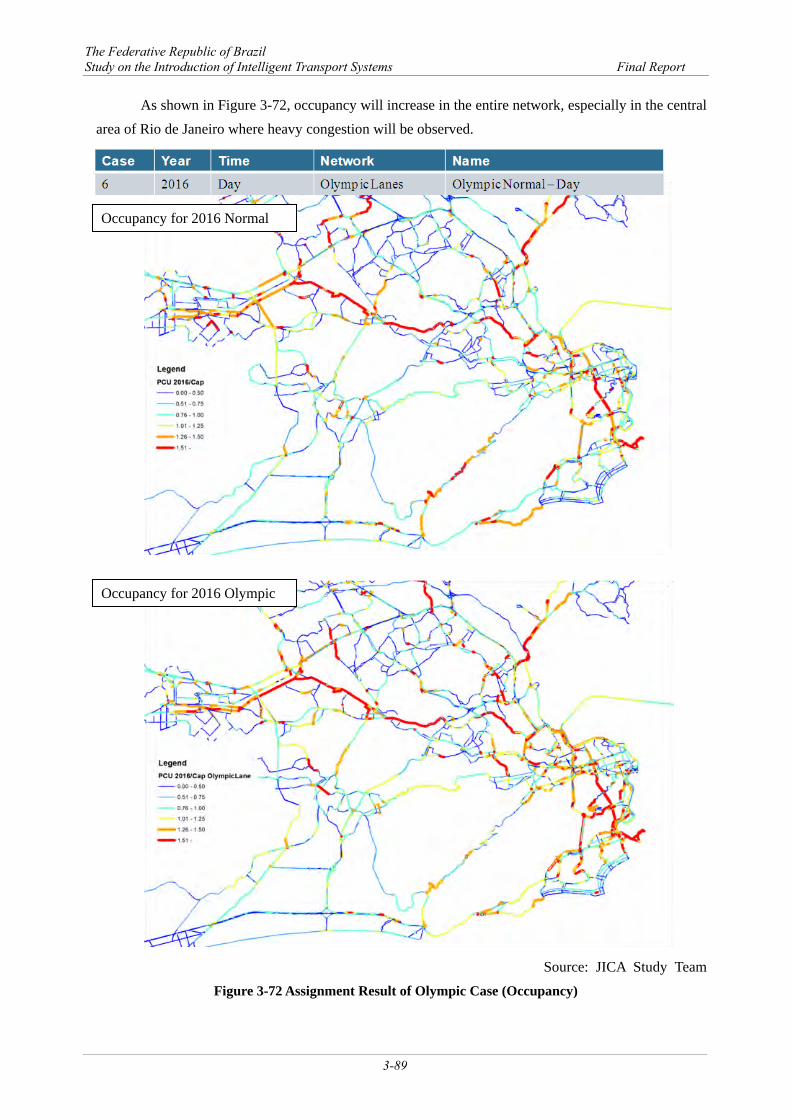
As shown in Figure 3-72, occupancy will increase in the entire network, especially in the central area of Rio de Janeiro where heavy congestion will be observed.
Source: JICA Study Team Figure 3-72 Assignment Result of Olympic Case (Occupancy)
Occupancy for 2016 Normal
Occupancy for 2016 Olympic
The Federative Republic of Brazil Study on the Introduction of Intelligent Transport Systems Final Report
3-90
3.3.6 Evaluation of ITS Installation
(1) Setting of Analysis Cases The purpose of traffic modeling, which is an area-wide traffic analysis, is as follows:
Transport/Traffic Analysis for Current and Future Situation Evaluation of ITS Menus
The evaluation of ITS menus is described hereafter.
1) Macroscale Macroscale analysis provides the static impacts of transport policy and wide-area range
simulation modeling. Accordingly, the ITS menus evaluated through macroscale modeling are as follows: > Reversible Lane Management
Lane management is already implemented in Rio de Janeiro. Hence, macroscopic economic impact shall be calculated in the static analysis.
> Electronic Road Pricing (ERP) This aims at the reduction of travel cost by car in the whole target area. The system costs shall be computed by summing up each component of ERP such as gantry, on-board unit (OBU), and monitoring center.
2) Mesoscale
Mesoscale analysis provides the dynamic impacts of transport policy and city-wide simulation modeling. Accordingly, the ITS menus evaluated through mesoscale modeling are as follows;
> Dynamic Traffic Information Provision to Every User
This aims at the reduction of travel cost by dynamic route search. The total system cost shall be computed by the additional system cost of existing equipment and integration cost.
3) Microscale
Microscale analysis provides the dynamic impacts of transport policy and target area simulation modeling. Accordingly, the ITS menus evaluated through microscale modeling are as follows:
> Bus / BRT Signal Optimization This aims at the reduction of waiting time or queue length. The total system cost shall be computed by the additional system cost of existing equipment and integration cost.
> Electronic Toll Collection (ETC) This aims at the reduction of waiting time at the toll gate. The system cost shall be the additional system cost of existing equipment.
The Federative Republic of Brazil Study on the Introduction of Intelligent Transport Systems Final Report
3-91
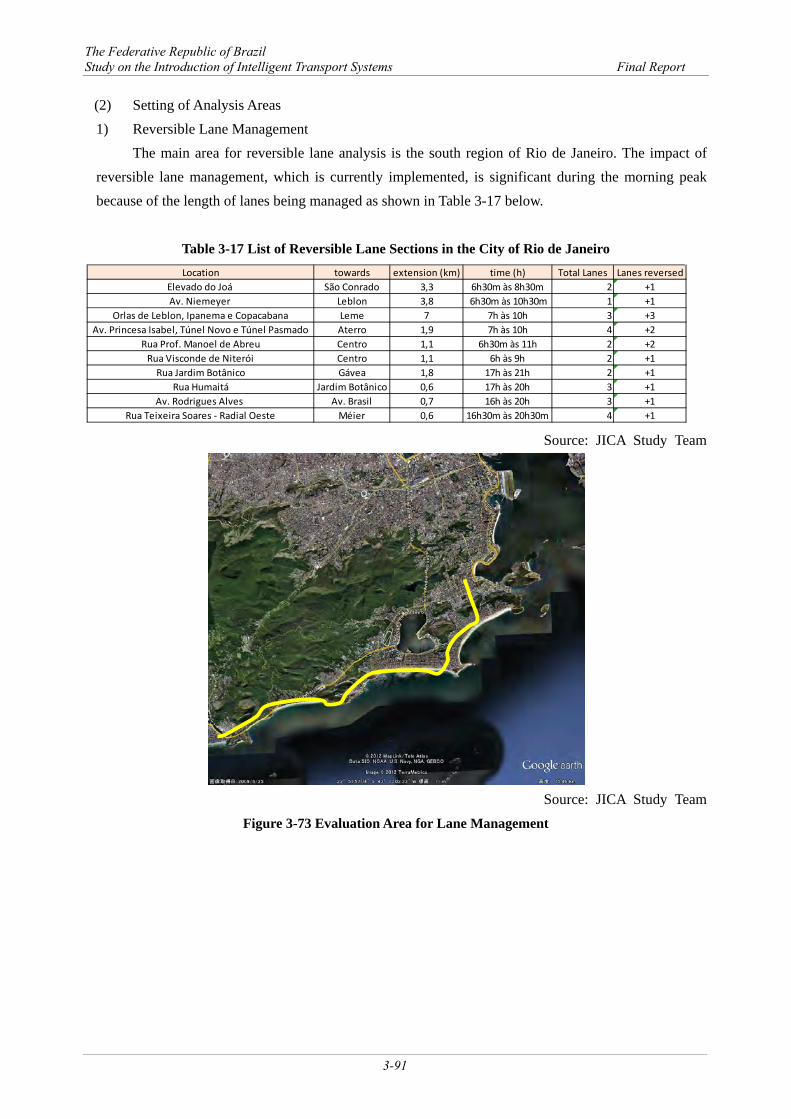
(2) Setting of Analysis Areas 1) Reversible Lane Management
The main area for reversible lane analysis is the south region of Rio de Janeiro. The impact of reversible lane management, which is currently implemented, is significant during the morning peak because of the length of lanes being managed as shown in Table 3-17 below.
Table 3-17 List of Reversible Lane Sections in the City of Rio de Janeiro
Source: JICA Study Team
Source: JICA Study Team
Figure 3-73 Evaluation Area for Lane Management
Location towards extension (km) time (h) Total Lanes Lanes reversedElevado do Joá São Conrado 3,3 6h30m às 8h30m 2 +1Av. Niemeyer Leblon 3,8 6h30m às 10h30m 1 +1
Orlas de Leblon, Ipanema e Copacabana Leme 7 7h às 10h 3 +3Av. Princesa Isabel, Túnel Novo e Túnel Pasmado Aterro 1,9 7h às 10h 4 +2
Rua Prof. Manoel de Abreu Centro 1,1 6h30m às 11h 2 +2Rua Visconde de Niterói Centro 1,1 6h às 9h 2 +1
Rua Jardim Botânico Gávea 1,8 17h às 21h 2 +1Rua Humaitá Jardim Botânico 0,6 17h às 20h 3 +1
Av. Rodrigues Alves Av. Brasil 0,7 16h às 20h 3 +1Rua Teixeira Soares - Radial Oeste Méier 0,6 16h30m às 20h30m 4 +1
The Federative Republic of Brazil Study on the Introduction of Intelligent Transport Systems Final Report
3-92
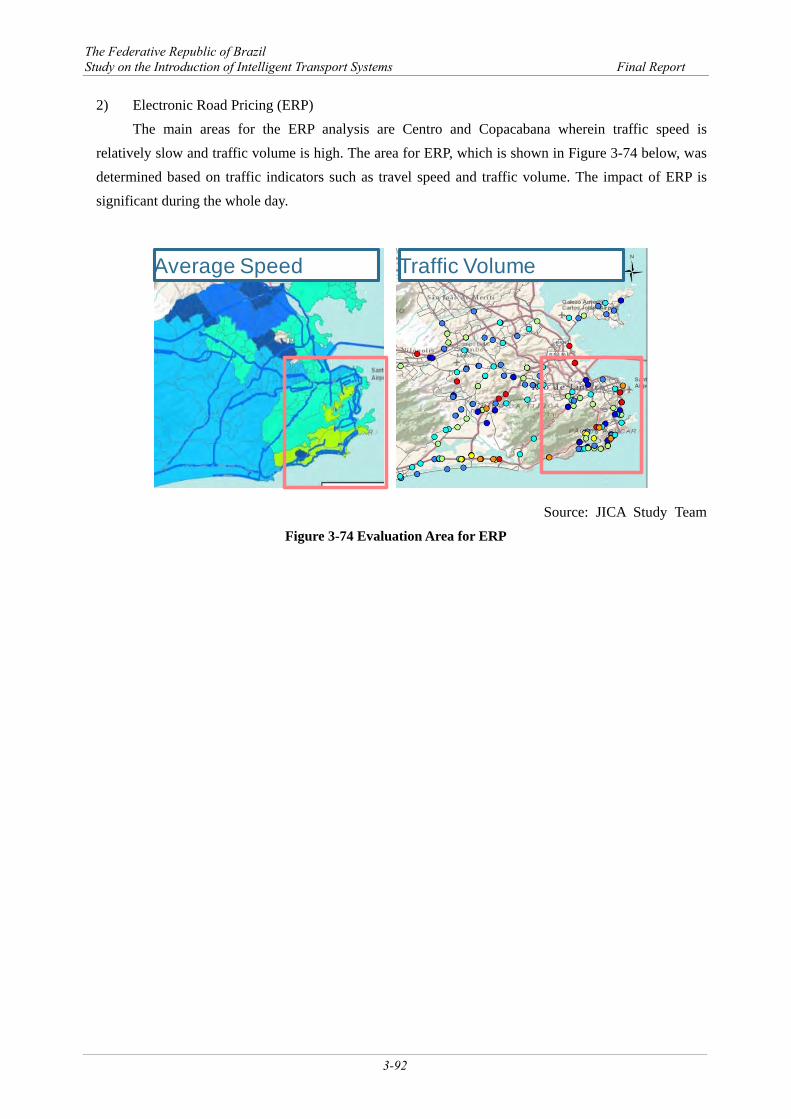
2) Electronic Road Pricing (ERP) The main areas for the ERP analysis are Centro and Copacabana wherein traffic speed is
relatively slow and traffic volume is high. The area for ERP, which is shown in Figure 3-74 below, was determined based on traffic indicators such as travel speed and traffic volume. The impact of ERP is significant during the whole day.
Source: JICA Study Team Figure 3-74 Evaluation Area for ERP
Average Speed Traffic Volume
The Federative Republic of Brazil Study on the Introduction of Intelligent Transport Systems Final Report
3-93
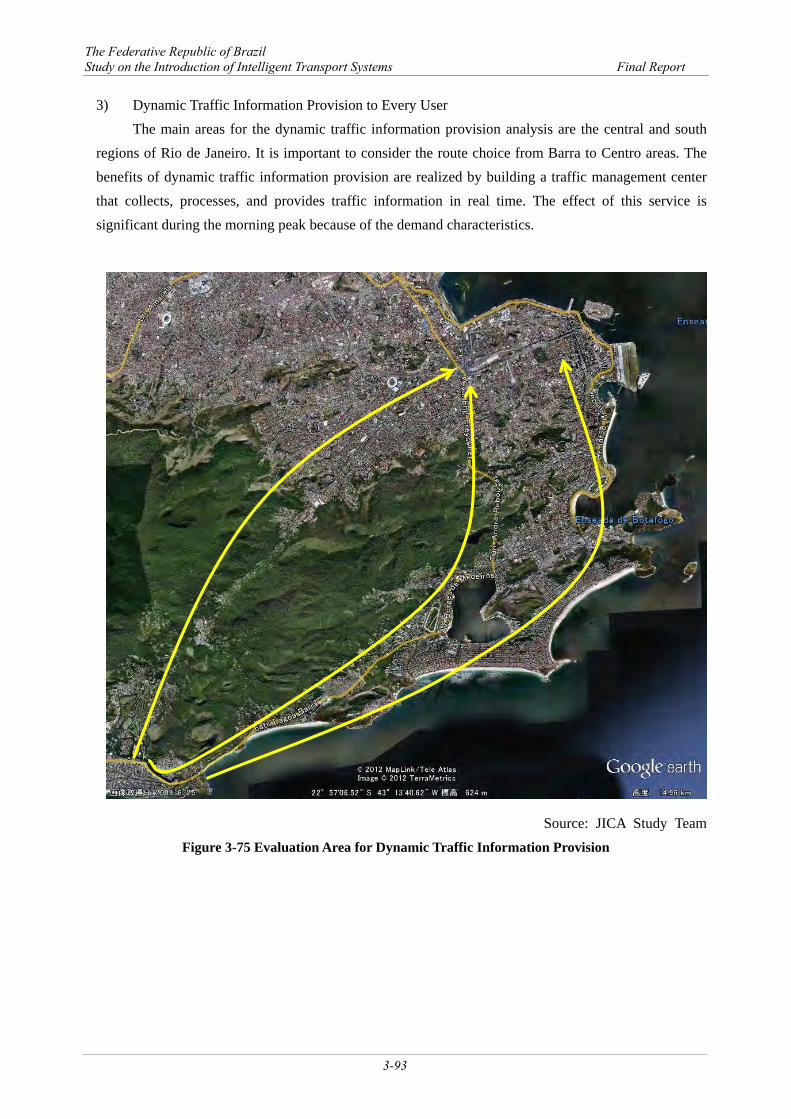
3) Dynamic Traffic Information Provision to Every User The main areas for the dynamic traffic information provision analysis are the central and south
regions of Rio de Janeiro. It is important to consider the route choice from Barra to Centro areas. The benefits of dynamic traffic information provision are realized by building a traffic management center that collects, processes, and provides traffic information in real time. The effect of this service is significant during the morning peak because of the demand characteristics.
Source: JICA Study Team Figure 3-75 Evaluation Area for Dynamic Traffic Information Provision
The Federative Republic of Brazil Study on the Introduction of Intelligent Transport Systems Final Report
3-94
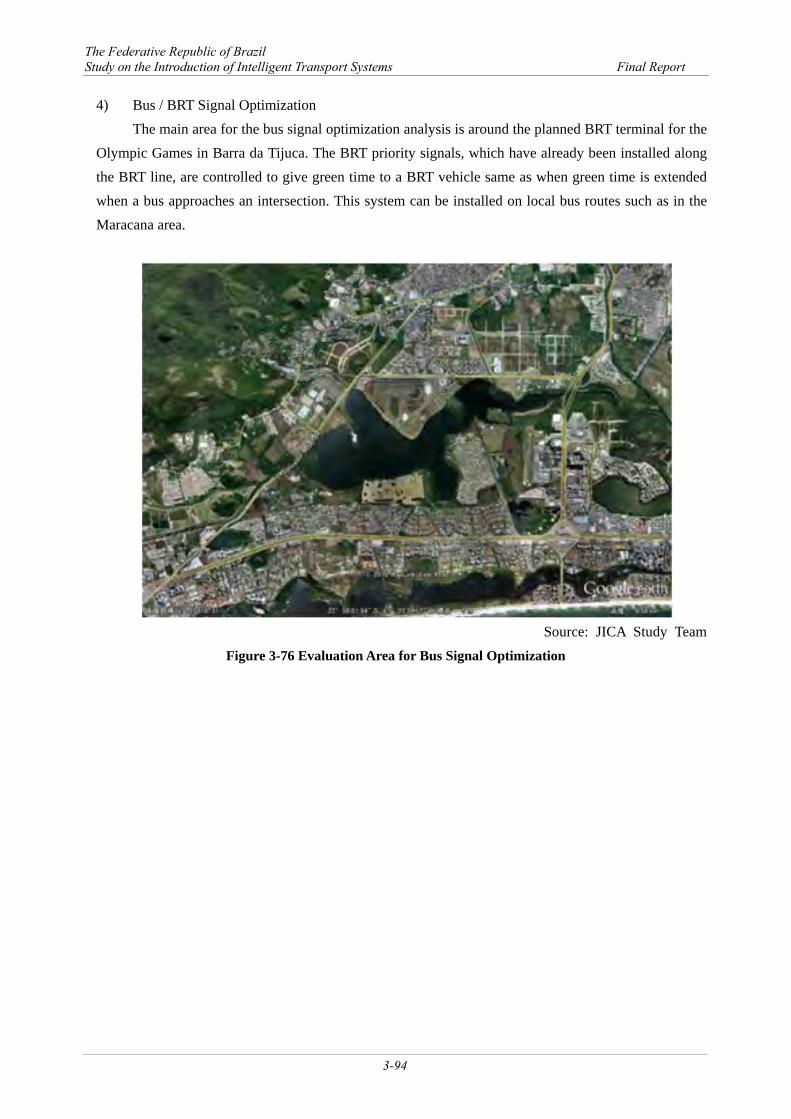
4) Bus / BRT Signal Optimization The main area for the bus signal optimization analysis is around the planned BRT terminal for the
Olympic Games in Barra da Tijuca. The BRT priority signals, which have already been installed along the BRT line, are controlled to give green time to a BRT vehicle same as when green time is extended when a bus approaches an intersection. This system can be installed on local bus routes such as in the Maracana area.
Source: JICA Study Team
Figure 3-76 Evaluation Area for Bus Signal Optimization
The Federative Republic of Brazil Study on the Introduction of Intelligent Transport Systems Final Report
3-95
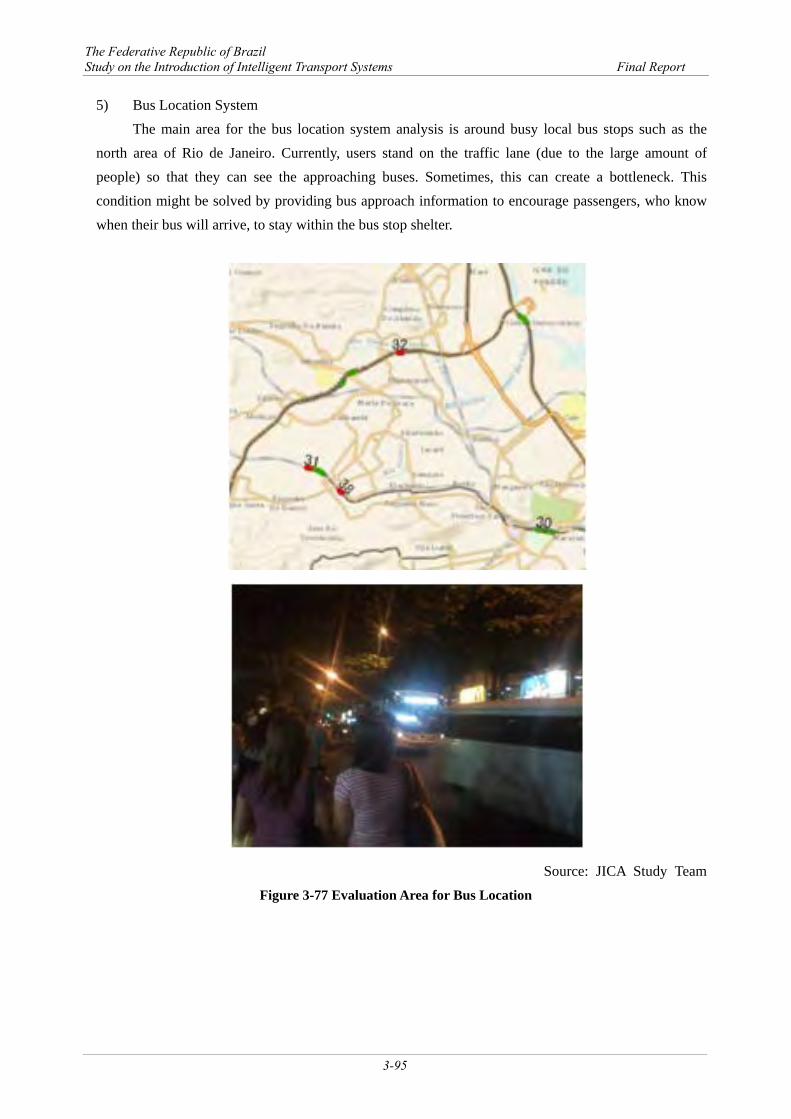
5) Bus Location System The main area for the bus location system analysis is around busy local bus stops such as the
north area of Rio de Janeiro. Currently, users stand on the traffic lane (due to the large amount of people) so that they can see the approaching buses. Sometimes, this can create a bottleneck. This condition might be solved by providing bus approach information to encourage passengers, who know when their bus will arrive, to stay within the bus stop shelter.
Source: JICA Study Team Figure 3-77 Evaluation Area for Bus Location
The Federative Republic of Brazil Study on the Introduction of Intelligent Transport Systems Final Report
3-96
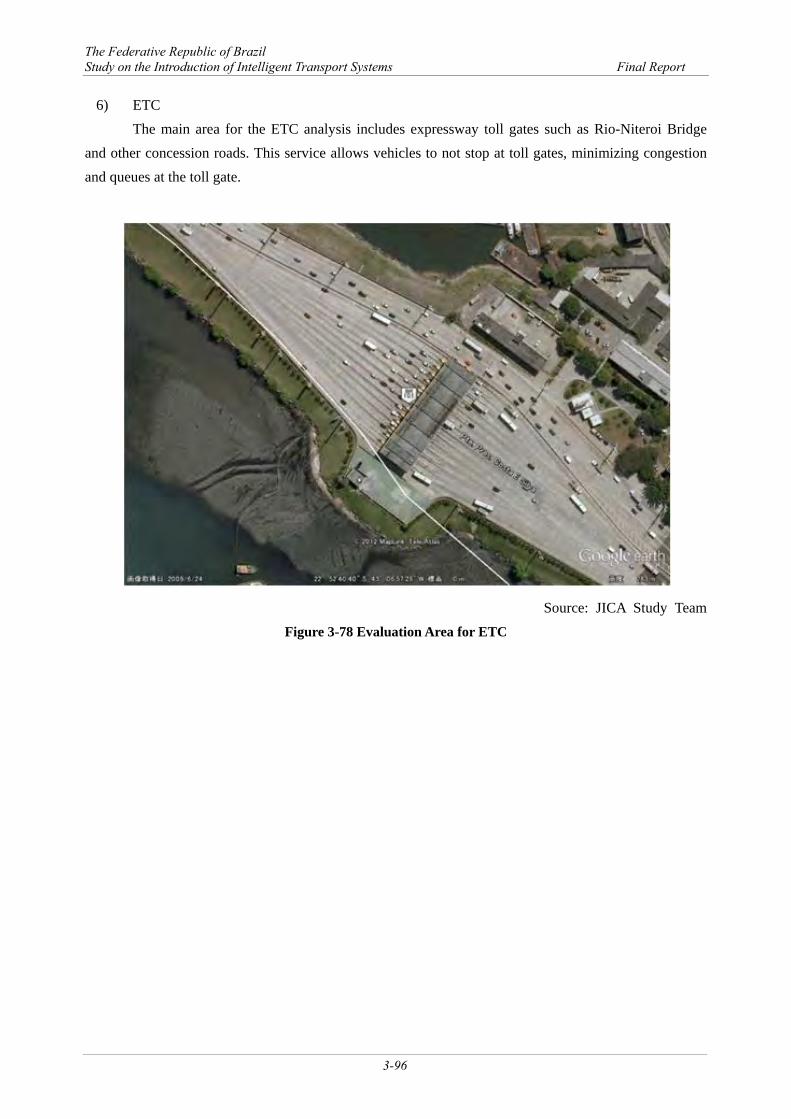
6) ETC The main area for the ETC analysis includes expressway toll gates such as Rio-Niteroi Bridge
and other concession roads. This service allows vehicles to not stop at toll gates, minimizing congestion and queues at the toll gate.
Source: JICA Study Team Figure 3-78 Evaluation Area for ETC
The Federative Republic of Brazil Study on the Introduction of Intelligent Transport Systems Final Report
3-97
(3) Analysis Result 1) Macroscopic Analysis
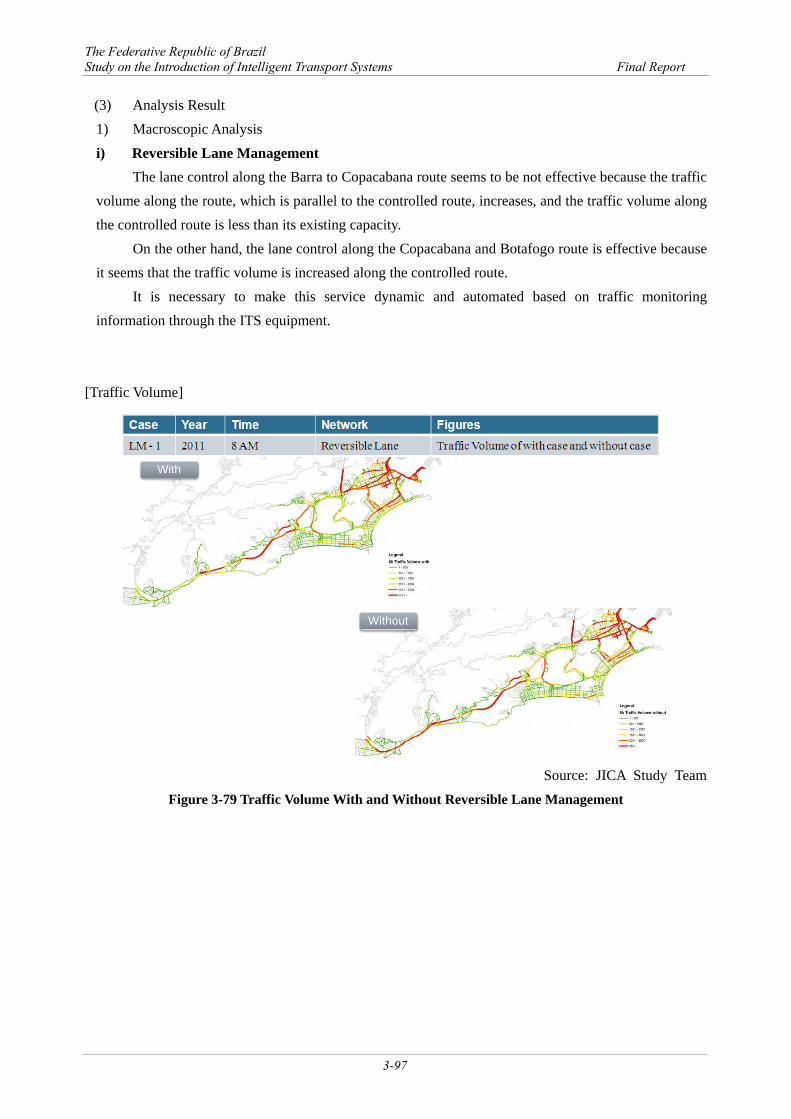
i) Reversible Lane Management The lane control along the Barra to Copacabana route seems to be not effective because the traffic
volume along the route, which is parallel to the controlled route, increases, and the traffic volume along the controlled route is less than its existing capacity.
On the other hand, the lane control along the Copacabana and Botafogo route is effective because it seems that the traffic volume is increased along the controlled route.
It is necessary to make this service dynamic and automated based on traffic monitoring information through the ITS equipment.
[Traffic Volume]
Source: JICA Study Team
Figure 3-79 Traffic Volume With and Without Reversible Lane Management
Without
With
The Federative Republic of Brazil Study on the Introduction of Intelligent Transport Systems Final Report
3-98
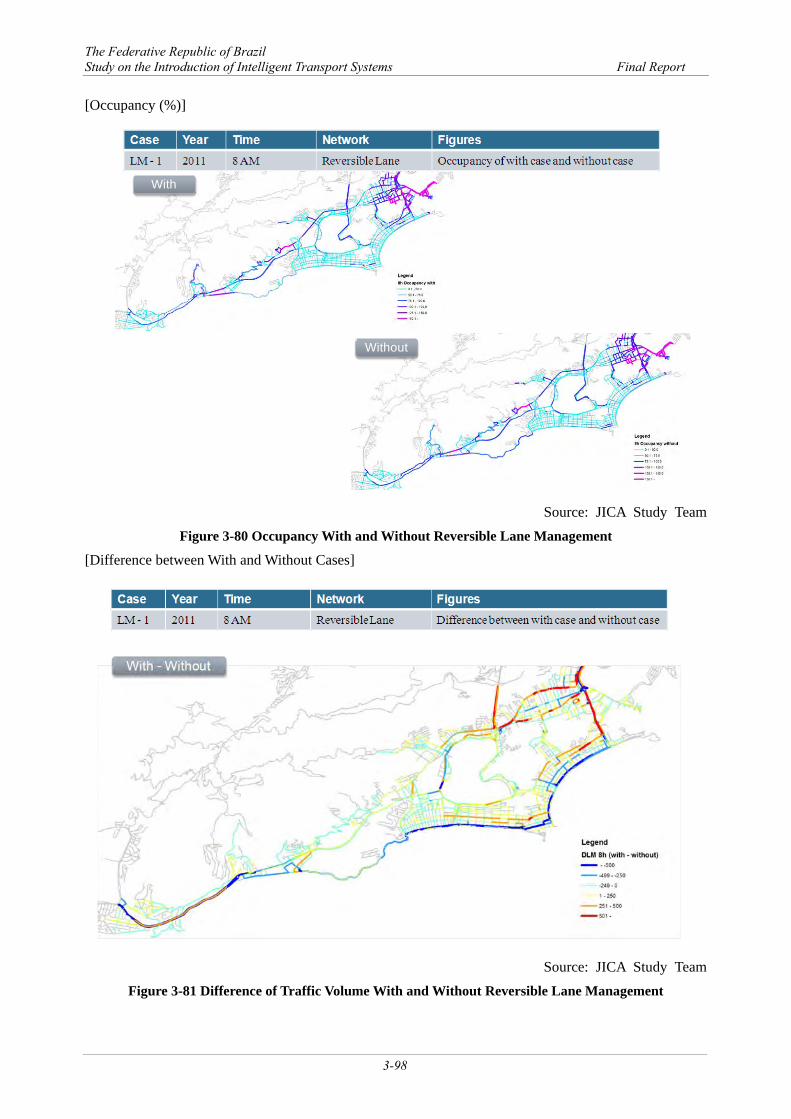
[Occupancy (%)]
Source: JICA Study Team
Figure 3-80 Occupancy With and Without Reversible Lane Management
[Difference between With and Without Cases]
Source: JICA Study Team Figure 3-81 Difference of Traffic Volume With and Without Reversible Lane Management
With
Without
The Federative Republic of Brazil Study on the Introduction of Intelligent Transport Systems Final Report
3-99
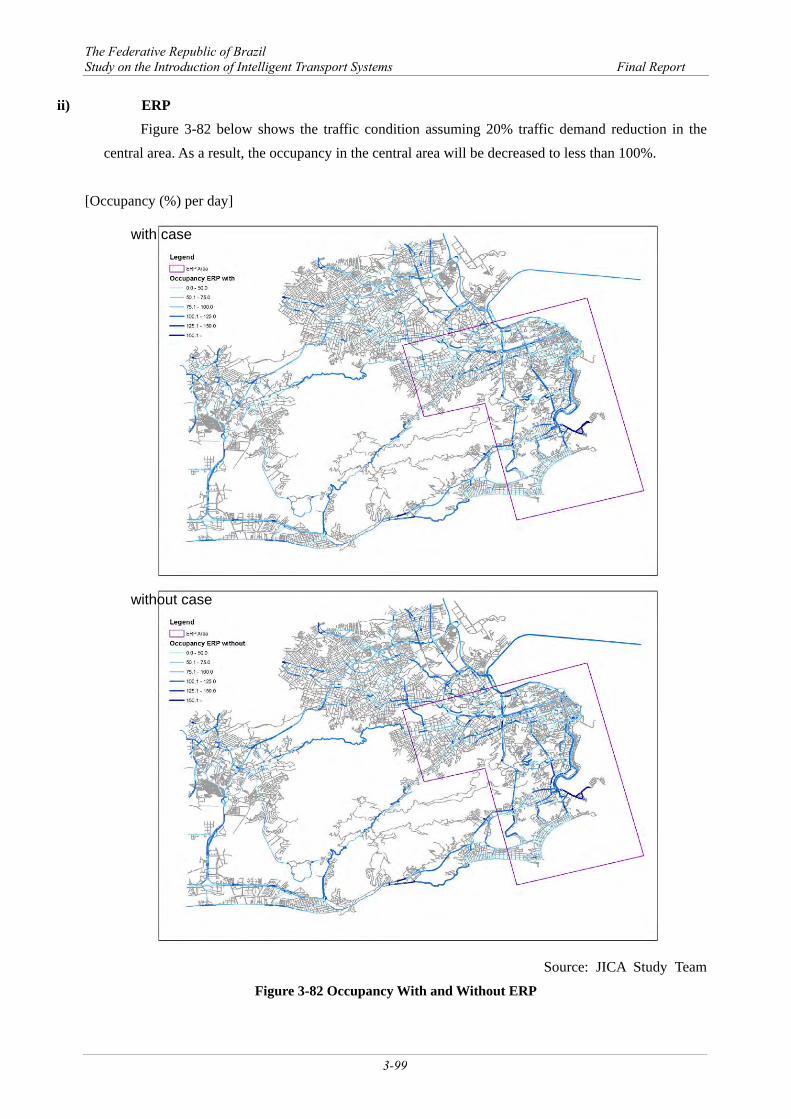
ii) ERP Figure 3-82 below shows the traffic condition assuming 20% traffic demand reduction in the
central area. As a result, the occupancy in the central area will be decreased to less than 100%.
[Occupancy (%) per day]
Source: JICA Study Team Figure 3-82 Occupancy With and Without ERP
with case
without case
The Federative Republic of Brazil Study on the Introduction of Intelligent Transport Systems Final Report
3-100
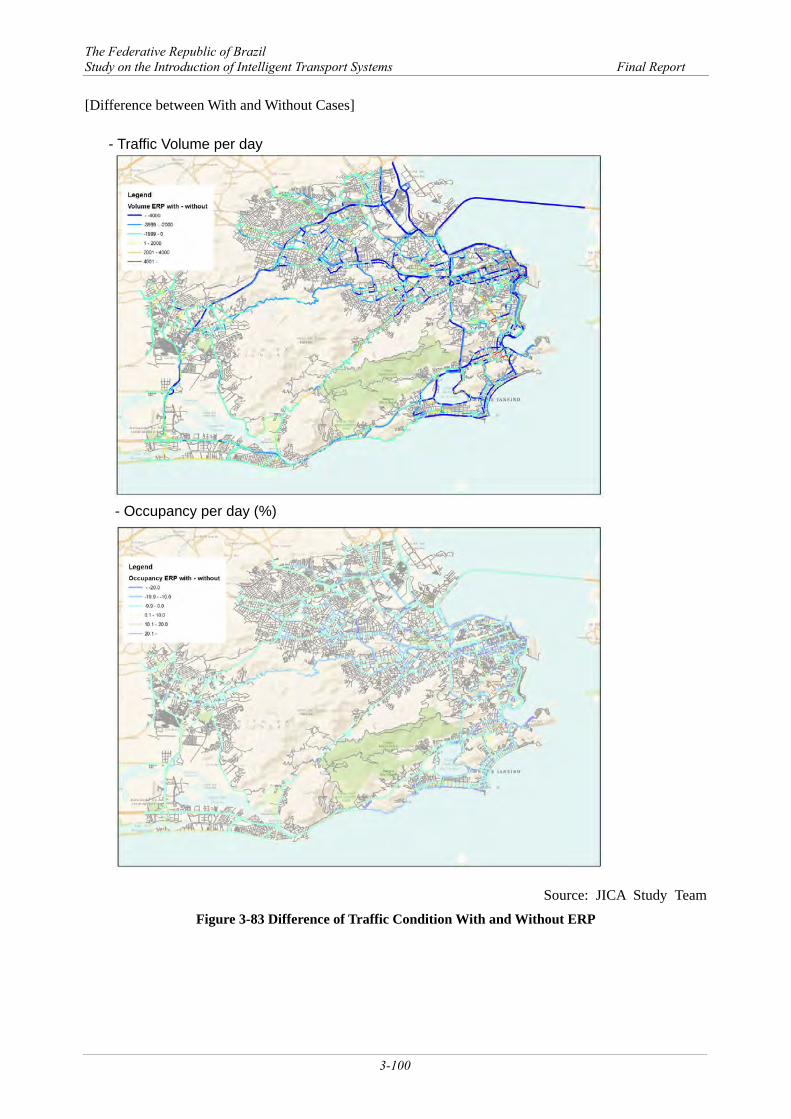
[Difference between With and Without Cases]
Source: JICA Study Team Figure 3-83 Difference of Traffic Condition With and Without ERP
- Traffic Volume per day
- Occupancy per day (%)
The Federative Republic of Brazil Study on the Introduction of Intelligent Transport Systems Final Report
3-101
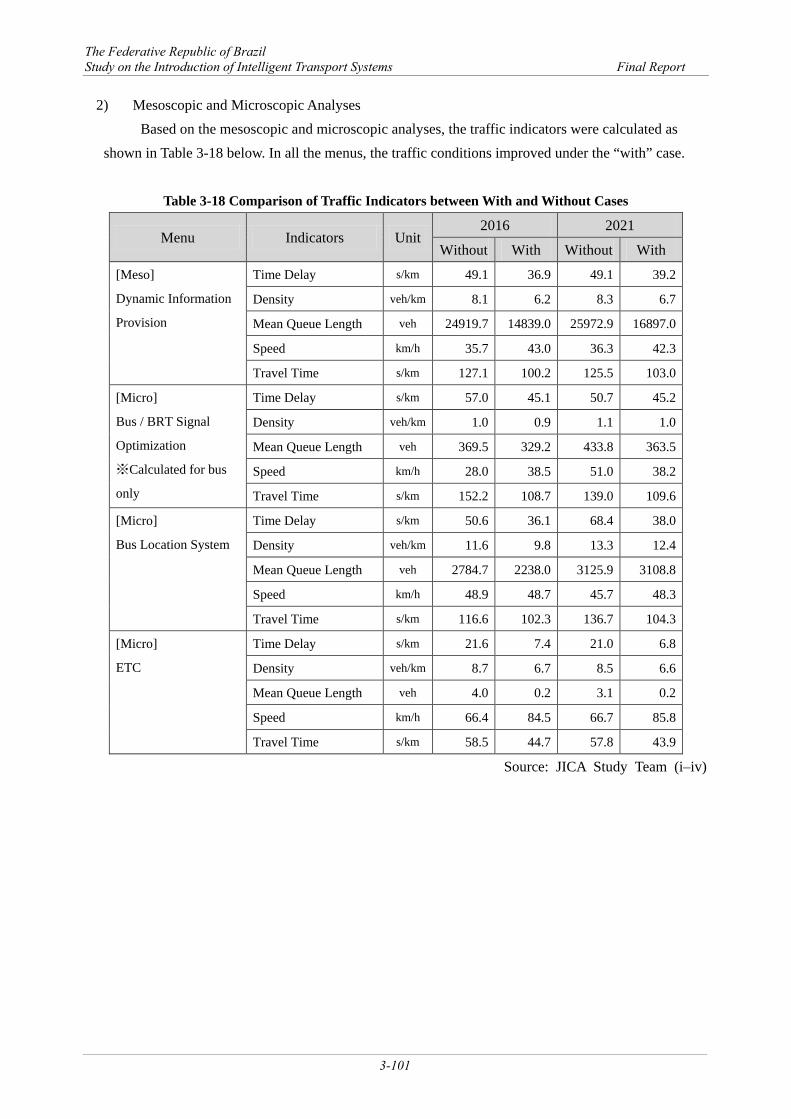
2) Mesoscopic and Microscopic Analyses Based on the mesoscopic and microscopic analyses, the traffic indicators were calculated as
shown in Table 3-18 below. In all the menus, the traffic conditions improved under the “with” case.
Table 3-18 Comparison of Traffic Indicators between With and Without Cases
Menu Indicators Unit 2016 2021
Without With Without With
[Meso]
Dynamic Information
Provision
Time Delay s/km 49.1 36.9 49.1 39.2
Density veh/km 8.1 6.2 8.3 6.7
Mean Queue Length veh 24919.7 14839.0 25972.9 16897.0
Speed km/h 35.7 43.0 36.3 42.3
Travel Time s/km 127.1 100.2 125.5 103.0
[Micro]
Bus / BRT Signal
Optimization
※Calculated for bus
only
Time Delay s/km 57.0 45.1 50.7 45.2
Density veh/km 1.0 0.9 1.1 1.0
Mean Queue Length veh 369.5 329.2 433.8 363.5
Speed km/h 28.0 38.5 51.0 38.2
Travel Time s/km 152.2 108.7 139.0 109.6
[Micro]
Bus Location System
Time Delay s/km 50.6 36.1 68.4 38.0
Density veh/km 11.6 9.8 13.3 12.4
Mean Queue Length veh 2784.7 2238.0 3125.9 3108.8
Speed km/h 48.9 48.7 45.7 48.3
Travel Time s/km 116.6 102.3 136.7 104.3
[Micro]
ETC
Time Delay s/km 21.6 7.4 21.0 6.8
Density veh/km 8.7 6.7 8.5 6.6
Mean Queue Length veh 4.0 0.2 3.1 0.2
Speed km/h 66.4 84.5 66.7 85.8
Travel Time s/km 58.5 44.7 57.8 43.9
Source: JICA Study Team (i–iv)
The Federative Republic of Brazil Study on the Introduction of Intelligent Transport Systems Final Report
3-102
3.4 OLYMPIC GAMES TRANSPORT STUDY
3.4.1 Background Demand Characteristics in 2016
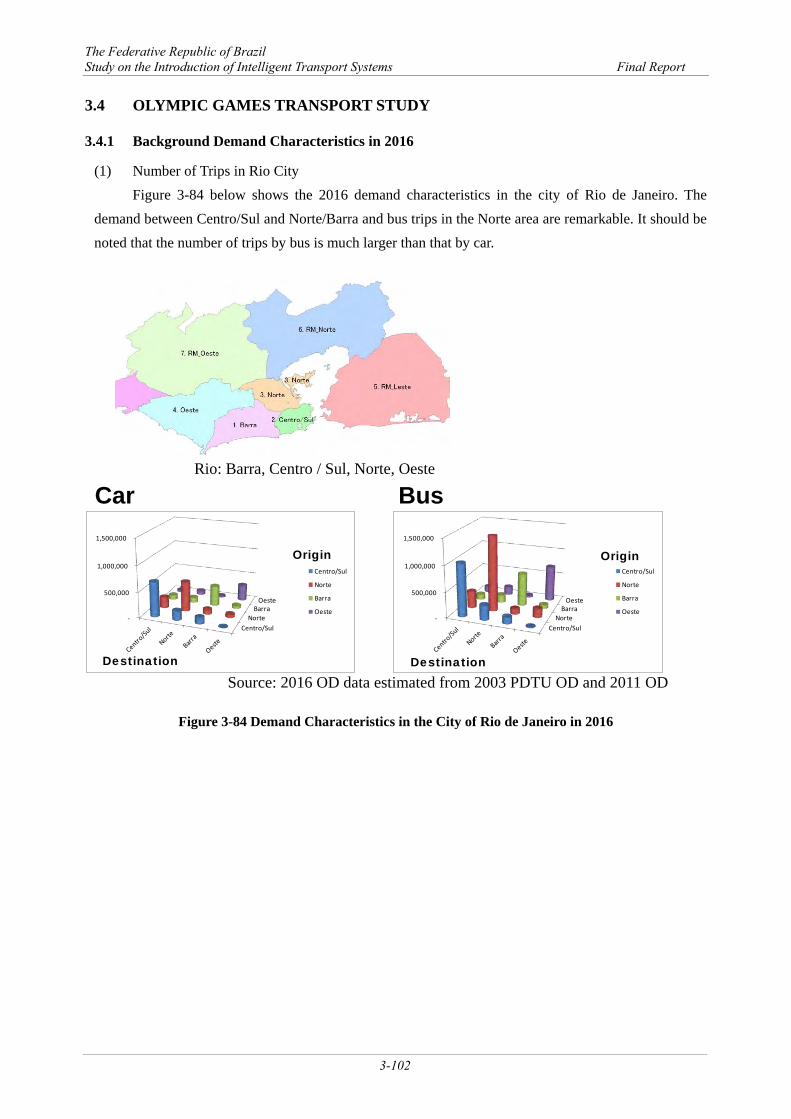
(1) Number of Trips in Rio City Figure 3-84 below shows the 2016 demand characteristics in the city of Rio de Janeiro. The
demand between Centro/Sul and Norte/Barra and bus trips in the Norte area are remarkable. It should be noted that the number of trips by bus is much larger than that by car.
Figure 3-84 Demand Characteristics in the City of Rio de Janeiro in 2016
Car
Bus
Centro/SulNorte
BarraOeste
-
500,000
1,000,000
1,500,000
Centro/Sul
Norte
Barra
Oeste
Origin
Destination
Centro/SulNorte
BarraOeste
-
500,000
1,000,000
1,500,000
Centro/Sul
Norte
Barra
Oeste
Origin
Destination
Source: 2016 OD data estimated from 2003 PDTU OD and 2011 OD
Rio: Barra, Centro / Sul, Norte, Oeste
The Federative Republic of Brazil Study on the Introduction of Intelligent Transport Systems Final Report
3-103
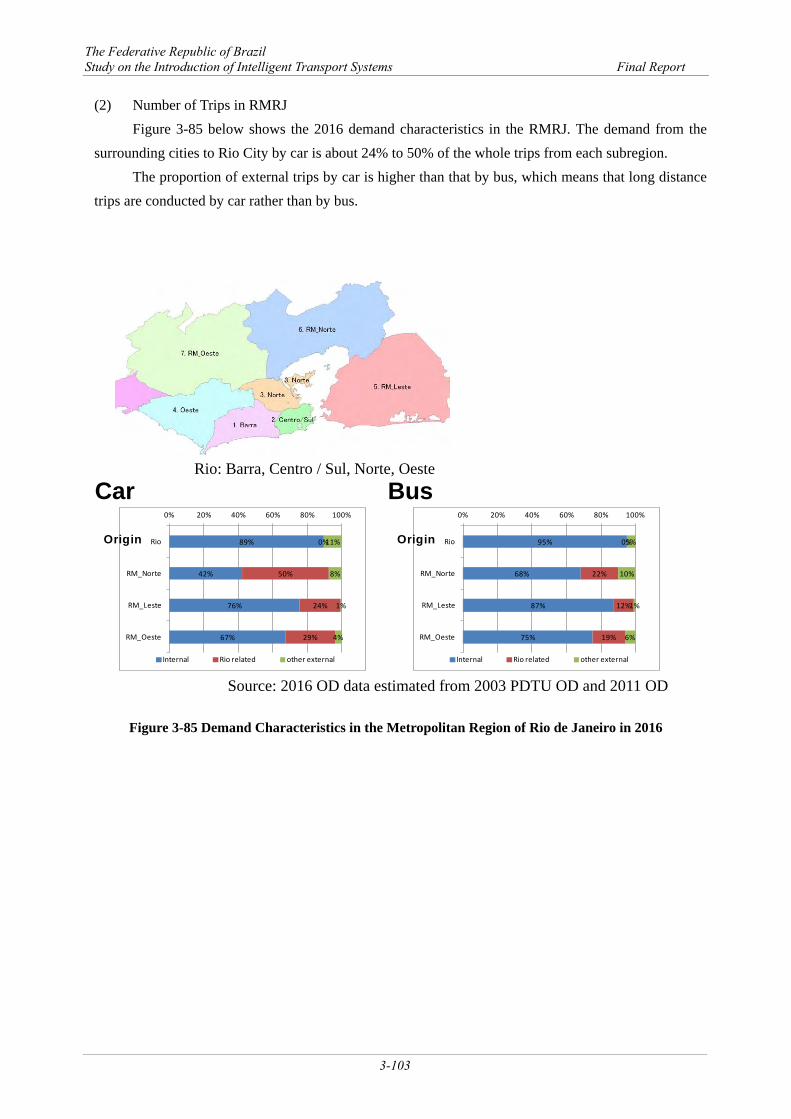
(2) Number of Trips in RMRJ Figure 3-85 below shows the 2016 demand characteristics in the RMRJ. The demand from the
surrounding cities to Rio City by car is about 24% to 50% of the whole trips from each subregion. The proportion of external trips by car is higher than that by bus, which means that long distance
trips are conducted by car rather than by bus.
Figure 3-85 Demand Characteristics in the Metropolitan Region of Rio de Janeiro in 2016
Source: 2016 OD data estimated from 2003 PDTU OD and 2011 OD
89%
42%
76%
67%
0%
50%
24%
29%
11%
8%
1%
4%
0% 20% 40% 60% 80% 100%
Rio
RM_Norte
RM_Leste
RM_Oeste
Internal Rio related other external
Origin 95%
68%
87%
75%
0%
22%
12%
19%
5%
10%
1%
6%
0% 20% 40% 60% 80% 100%
Rio
RM_Norte
RM_Leste
RM_Oeste
Internal Rio related other external
Origin
Car
Bus
Rio: Barra, Centro / Sul, Norte, Oeste
The Federative Republic of Brazil Study on the Introduction of Intelligent Transport Systems Final Report
3-104
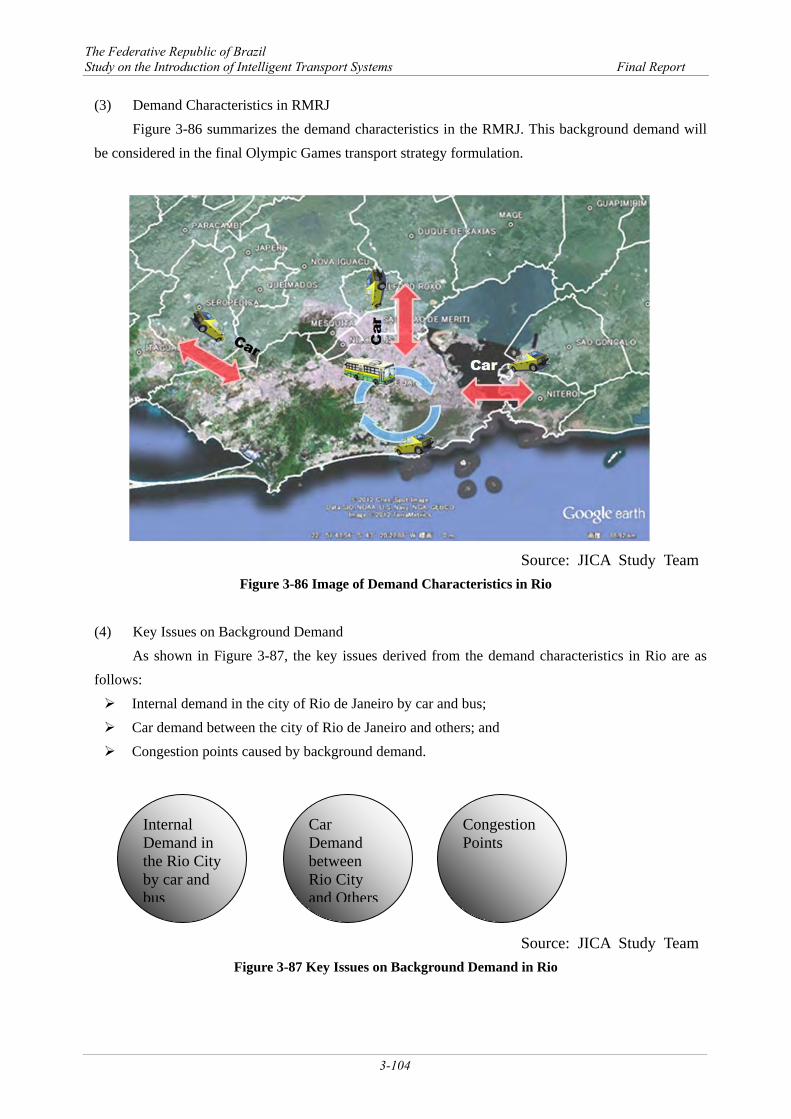
(3) Demand Characteristics in RMRJ Figure 3-86 summarizes the demand characteristics in the RMRJ. This background demand will
be considered in the final Olympic Games transport strategy formulation.
Source: JICA Study Team
Figure 3-86 Image of Demand Characteristics in Rio
(4) Key Issues on Background Demand
As shown in Figure 3-87, the key issues derived from the demand characteristics in Rio are as follows: Internal demand in the city of Rio de Janeiro by car and bus; Car demand between the city of Rio de Janeiro and others; and Congestion points caused by background demand.
Source: JICA Study Team Figure 3-87 Key Issues on Background Demand in Rio
Internal Demand in the Rio City by car and bus
Car Demand between Rio City and Others
Congestion Points
The Federative Republic of Brazil Study on the Introduction of Intelligent Transport Systems Final Report
3-105
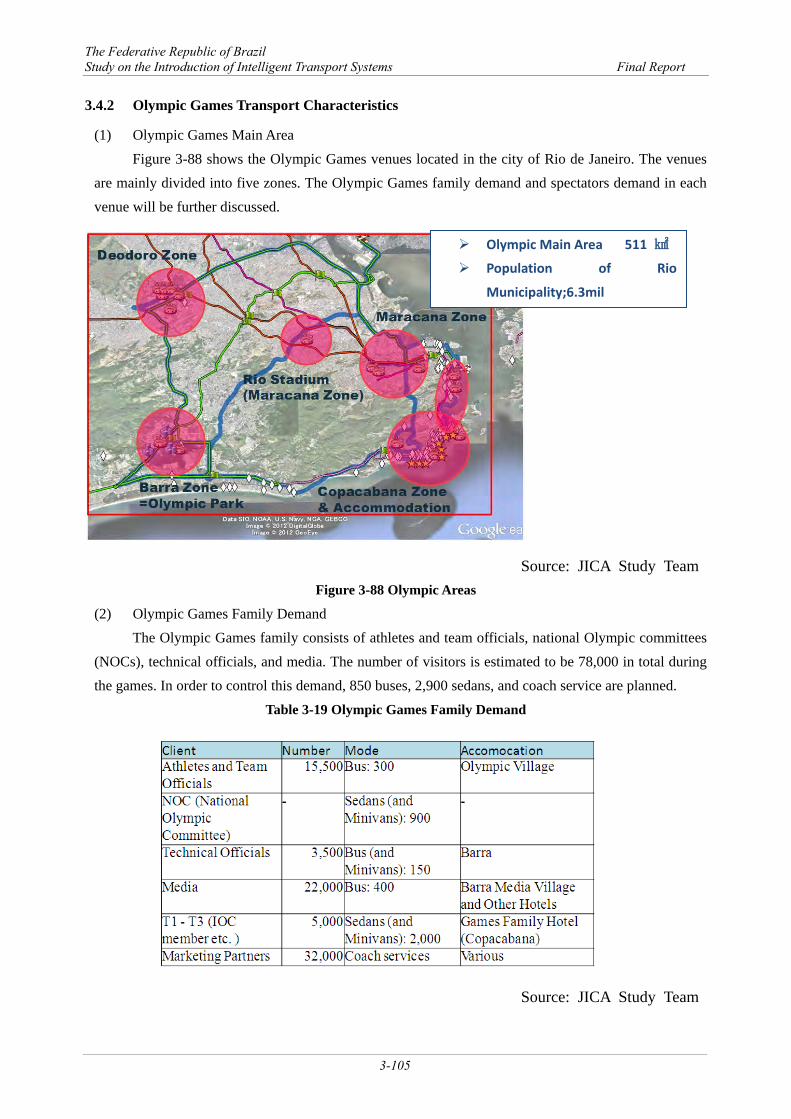
3.4.2 Olympic Games Transport Characteristics
(1) Olympic Games Main Area Figure 3-88 shows the Olympic Games venues located in the city of Rio de Janeiro. The venues
are mainly divided into five zones. The Olympic Games family demand and spectators demand in each venue will be further discussed.
Source: JICA Study Team Figure 3-88 Olympic Areas
(2) Olympic Games Family Demand The Olympic Games family consists of athletes and team officials, national Olympic committees
(NOCs), technical officials, and media. The number of visitors is estimated to be 78,000 in total during the games. In order to control this demand, 850 buses, 2,900 sedans, and coach service are planned.
Table 3-19 Olympic Games Family Demand
Source: JICA Study Team
Olympic Main Area 511 ㎢
Population of Rio
Municipality;6.3mil
The Federative Republic of Brazil Study on the Introduction of Intelligent Transport Systems Final Report
3-106
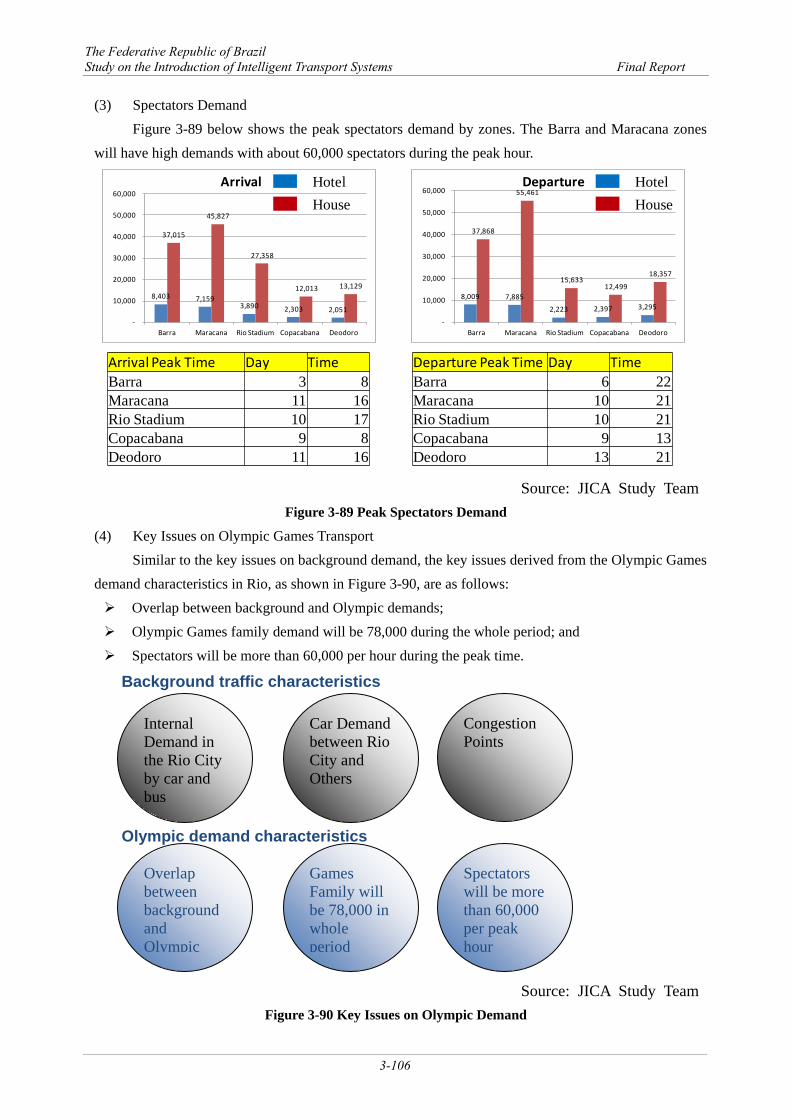
(3) Spectators Demand Figure 3-89 below shows the peak spectators demand by zones. The Barra and Maracana zones
will have high demands with about 60,000 spectators during the peak hour.
Source: JICA Study Team
Figure 3-89 Peak Spectators Demand
(4) Key Issues on Olympic Games Transport Similar to the key issues on background demand, the key issues derived from the Olympic Games
demand characteristics in Rio, as shown in Figure 3-90, are as follows: Overlap between background and Olympic demands; Olympic Games family demand will be 78,000 during the whole period; and Spectators will be more than 60,000 per hour during the peak time.
Source: JICA Study Team
Figure 3-90 Key Issues on Olympic Demand
Internal Demand in the Rio City by car and bus
Car Demand between Rio City and Others
Congestion Points
Background traffic characteristics
Olympic demand characteristics
Overlap between background and Olympic
Games Family will be 78,000 in whole period
Spectators will be more than 60,000 per peak hour
8,403 7,159 3,890 2,303 2,051
37,015
45,827
27,358
12,013 13,129
-
10,000
20,000
30,000
40,000
50,000
60,000
Barra Maracana Rio Stadium Copacabana Deodoro
Arrival
8,009 7,885
2,223 2,397 3,295
37,868
55,461
15,633 12,499
18,357
-
10,000
20,000
30,000
40,000
50,000
60,000
Barra Maracana Rio Stadium Copacabana Deodoro
Departure
Arrival Peak Time Day TimeBarra 3 8Maracana 11 16Rio Stadium 10 17Copacabana 9 8Deodoro 11 16
Departure Peak Time Day TimeBarra 6 22Maracana 10 21Rio Stadium 10 21Copacabana 9 13Deodoro 13 21
HotelHouse
HotelHouse
The Federative Republic of Brazil Study on the Introduction of Intelligent Transport Systems Final Report
3-107
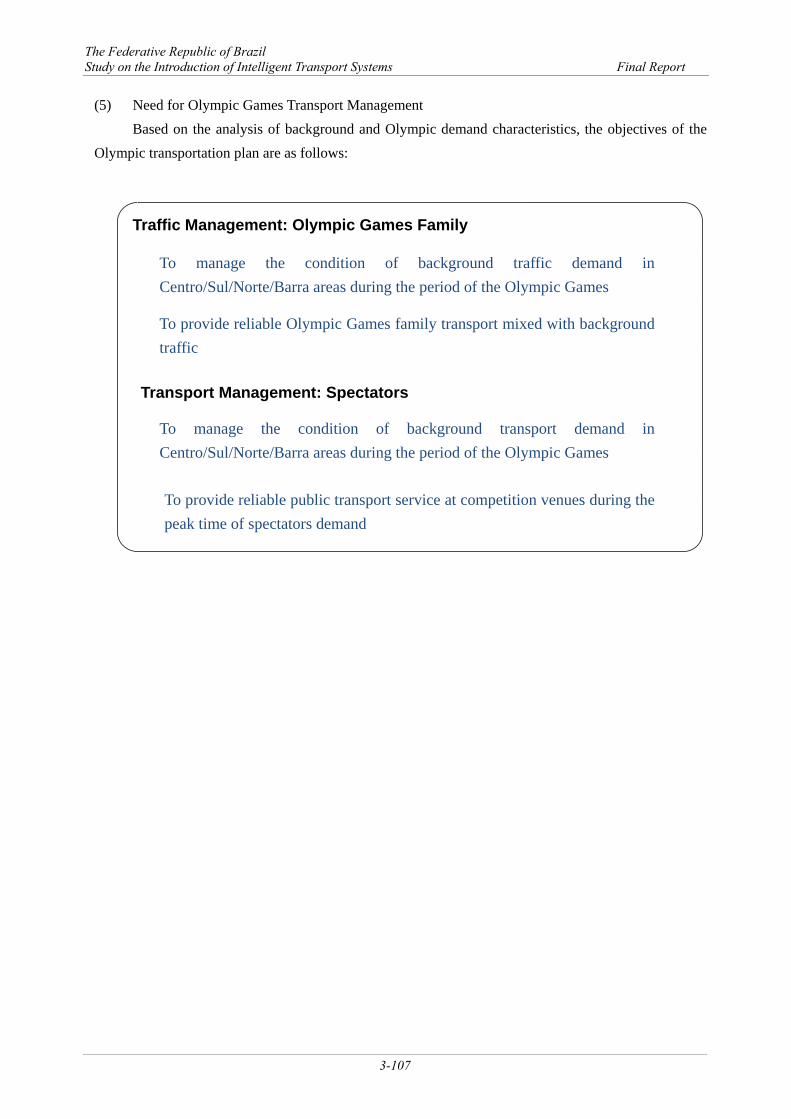
(5) Need for Olympic Games Transport Management Based on the analysis of background and Olympic demand characteristics, the objectives of the
Olympic transportation plan are as follows:
Traffic Management: Olympic Games Family
Transport Management: Spectators
To manage the condition of background transport demand in Centro/Sul/Norte/Barra areas during the period of the Olympic Games
To provide reliable public transport service at competition venues during the peak time of spectators demand
To manage the condition of background traffic demand in Centro/Sul/Norte/Barra areas during the period of the Olympic Games
To provide reliable Olympic Games family transport mixed with background traffic
The Federative Republic of Brazil Study on the Introduction of Intelligent Transport Systems Final Report
3-108
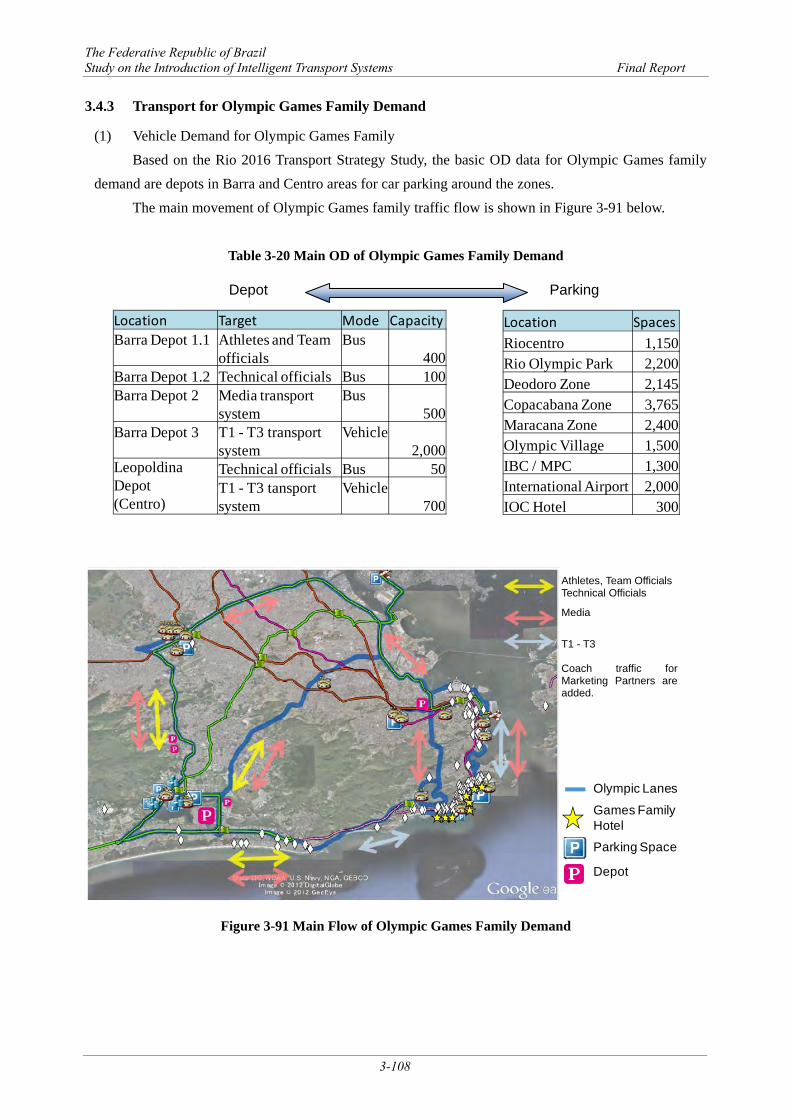
3.4.3 Transport for Olympic Games Family Demand
(1) Vehicle Demand for Olympic Games Family Based on the Rio 2016 Transport Strategy Study, the basic OD data for Olympic Games family
demand are depots in Barra and Centro areas for car parking around the zones. The main movement of Olympic Games family traffic flow is shown in Figure 3-91 below.
Table 3-20 Main OD of Olympic Games Family Demand
Figure 3-91 Main Flow of Olympic Games Family Demand
Athletes, Team Officials Technical Officials
Media
T1 - T3
Coach traffic for Marketing Partners are added.
!j
Parking Space
Depot
Games Family Hotel
Olympic Lanes
Depot Parking
Location Target Mode Capacity
Barra Depot 1.1 Athletes and Team officials
Bus400
Barra Depot 1.2 Technical officials Bus 100Barra Depot 2 Media transport
systemBus
500Barra Depot 3 T1 - T3 transport
systemVehicle
2,000LeopoldinaDepot(Centro)
Technical officials Bus 50T1 - T3 tansport system
Vehicle700
Location Spaces
Riocentro 1,150Rio Olympic Park 2,200Deodoro Zone 2,145Copacabana Zone 3,765Maracana Zone 2,400Olympic Village 1,500IBC / MPC 1,300International Airport 2,000IOC Hotel 300
The Federative Republic of Brazil Study on the Introduction of Intelligent Transport Systems Final Report
3-109
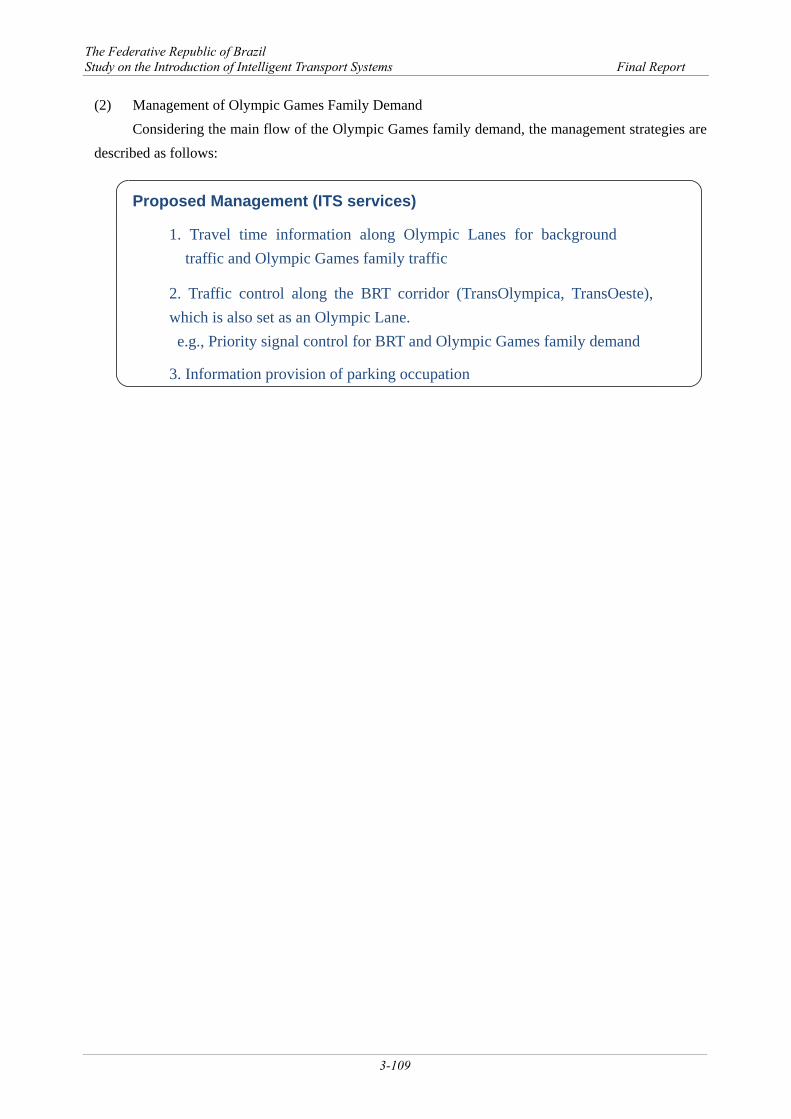
(2) Management of Olympic Games Family Demand Considering the main flow of the Olympic Games family demand, the management strategies are
described as follows:
Proposed Management (ITS services)
2. Traffic control along the BRT corridor (TransOlympica, TransOeste), which is also set as an Olympic Lane. e.g., Priority signal control for BRT and Olympic Games family demand
1. Travel time information along Olympic Lanes for background traffic and Olympic Games family traffic
3. Information provision of parking occupation


![An Ongoing Problem... Malnutrition in [insert name of your organisation]](https://img.pdfslide.tips/doc/110x75/56813223550346895d9884ff/an-ongoing-problem-malnutrition-in-insert-name-of-your-organisation-5687fb2f87d13.jpg)