Embed Size (px)
Citation preview
9. OKTOBER 20069 OCTOBER 2006 št./No 174
4 CENE PRICES št./No 22
INDEKSI CEN ŽIVLJENJSKIH POTREBŠČIN, SLOVENIJA, SEPTEMBER 2006 CONSUMER PRICE INDICES, SLOVENIA, SEPTEMBER 2006
Cene življenjskih potrebščin so se septembra 2006 v primerjavi s cenami v preteklem mesecu v povprečju zvišale za 0,4 %, na letni ravni pa so bile višje za 2,5 %.
Compared to August 2006, in September 2006 prices of consumer goods rose on average by 0.4%. The annual inflation rate was 2.5%.
V septembru so se najbolj zvišale cene v skupinah: − obleka in obutev (za 9,6 %) − komunikacije (za 2,6 %) − stanovanje (za 0,7 %) − gostinske in nastanitvene storitve (za 0,5 %).
In September prices rose the most in the following groups: − clothing and footwear (by 9.6%) − communication (by 2.6%) − housing, water, electricity, gas and other (by 0.7%) − restaurants and hotels (by 0.5%).
Najbolj so se znižale cene v skupinah: − rekreacija in kultura (za 4,2 %) − izobraževanje (za 1,9 %) − prevoz (za 0,8 %) − zdravje (za 0,1 %).
Prices fell the most in the following groups: − recreation and culture (by 4.2%) − education (by 1.9%) − transport (by 0.8%) − health (by 0.1%).
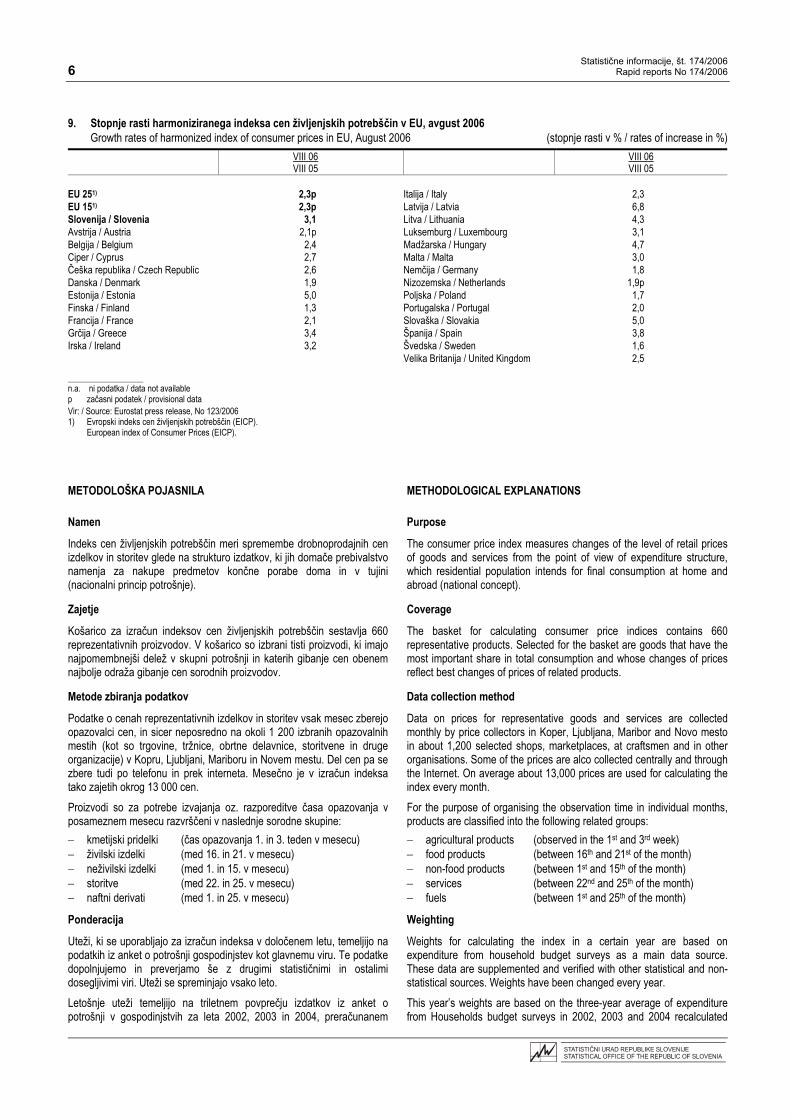
Letna stopnja inflacije v 25 državah EU, merjena s harmoniziranim indeksom cen življenjskih potrebščin, je avgusta 2006 v povprečju znašala 2,3 %. Najvišjo je imela Latvija (6,8 %), najnižjo Finska (1,3 %), v Sloveniji pa je bila 3,1 %.
The annual inflation rate in the EU-25, measured with the harmonised index of consumer prices, was in August 2006 on average 2.3%. It was the highest in Latvia (6.8%) and the lowest in Finland (1.3%). In Slovenia it was 3.1%.
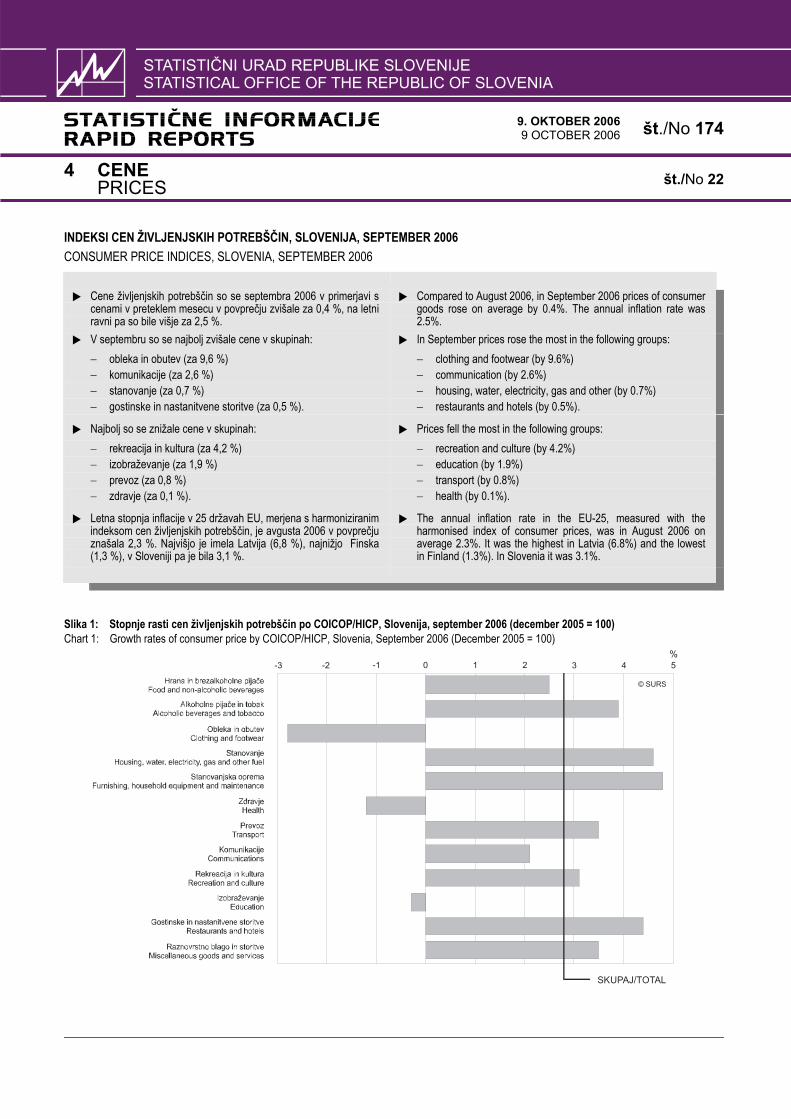
Slika 1: Stopnje rasti cen življenjskih potrebščin po COICOP/HICP, Slovenija, september 2006 (december 2005 = 100) Chart 1: Growth rates of consumer price by COICOP/HICP, Slovenia, September 2006 (December 2005 = 100)
%-2 0 3 54-1 21-3
© SURS
SKUPAJ/TOTAL
Statistične informacije, št. 174/2006 2 Rapid reports No 174/2006
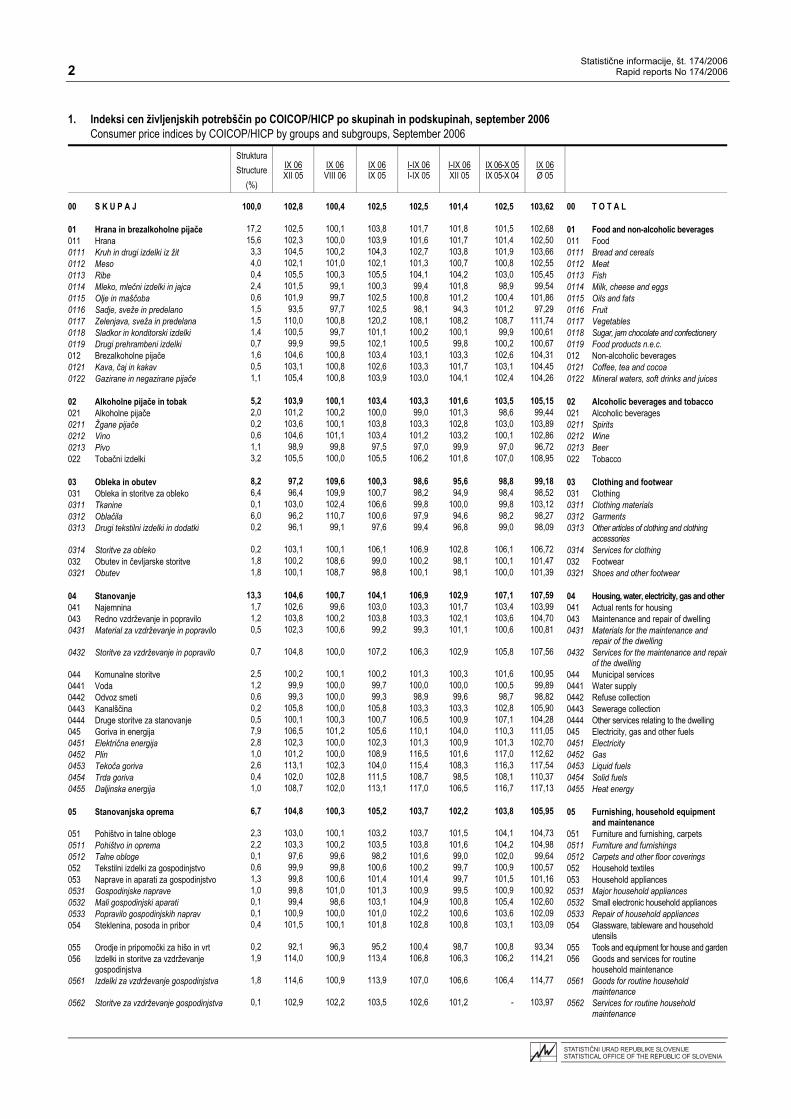
1. Indeksi cen življenjskih potrebščin po COICOP/HICP po skupinah in podskupinah, september 2006
Consumer price indices by COICOP/HICP by groups and subgroups, September 2006
Struktura Structure
(%)
IX 06 XII 05
IX 06 VIII 06
IX 06 IX 05
I-IX 06 I-IX 05
I-IX 06 XII 05
IX 06-X 05 IX 05-X 04
IX 06 Ø 05
00 S K U P A J 100,0 102,8 100,4 102,5 102,5 101,4 102,5 103,62 00 T O T A L 01 Hrana in brezalkoholne pijače 17,2 102,5 100,1 103,8 101,7 101,8 101,5 102,68 01 Food and non-alcoholic beverages 011 Hrana 15,6 102,3 100,0 103,9 101,6 101,7 101,4 102,50 011 Food 0111 Kruh in drugi izdelki iz žit 3,3 104,5 100,2 104,3 102,7 103,8 101,9 103,66 0111 Bread and cereals 0112 Meso 4,0 102,1 101,0 102,1 101,3 100,7 100,8 102,55 0112 Meat 0113 Ribe 0,4 105,5 100,3 105,5 104,1 104,2 103,0 105,45 0113 Fish 0114 Mleko, mlečni izdelki in jajca 2,4 101,5 99,1 100,3 99,4 101,8 98,9 99,54 0114 Milk, cheese and eggs 0115 Olje in maščoba 0,6 101,9 99,7 102,5 100,8 101,2 100,4 101,86 0115 Oils and fats 0116 Sadje, sveže in predelano 1,5 93,5 97,7 102,5 98,1 94,3 101,2 97,29 0116 Fruit 0117 Zelenjava, sveža in predelana 1,5 110,0 100,8 120,2 108,1 108,2 108,7 111,74 0117 Vegetables 0118 Sladkor in konditorski izdelki 1,4 100,5 99,7 101,1 100,2 100,1 99,9 100,61 0118 Sugar, jam chocolate and confectionery 0119 Drugi prehrambeni izdelki 0,7 99,9 99,5 102,1 100,5 99,8 100,2 100,67 0119 Food products n.e.c. 012 Brezalkoholne pijače 1,6 104,6 100,8 103,4 103,1 103,3 102,6 104,31 012 Non-alcoholic beverages 0121 Kava, čaj in kakav 0,5 103,1 100,8 102,6 103,3 101,7 103,1 104,45 0121 Coffee, tea and cocoa 0122 Gazirane in negazirane pijače 1,1 105,4 100,8 103,9 103,0 104,1 102,4 104,26 0122 Mineral waters, soft drinks and juices 02 Alkoholne pijače in tobak 5,2 103,9 100,1 103,4 103,3 101,6 103,5 105,15 02 Alcoholic beverages and tobacco 021 Alkoholne pijače 2,0 101,2 100,2 100,0 99,0 101,3 98,6 99,44 021 Alcoholic beverages 0211 Žgane pijače 0,2 103,6 100,1 103,8 103,3 102,8 103,0 103,89 0211 Spirits 0212 Vino 0,6 104,6 101,1 103,4 101,2 103,2 100,1 102,86 0212 Wine 0213 Pivo 1,1 98,9 99,8 97,5 97,0 99,9 97,0 96,72 0213 Beer 022 Tobačni izdelki 3,2 105,5 100,0 105,5 106,2 101,8 107,0 108,95 022 Tobacco 03 Obleka in obutev 8,2 97,2 109,6 100,3 98,6 95,6 98,8 99,18 03 Clothing and footwear 031 Obleka in storitve za obleko 6,4 96,4 109,9 100,7 98,2 94,9 98,4 98,52 031 Clothing 0311 Tkanine 0,1 103,0 102,4 106,6 99,8 100,0 99,8 103,12 0311 Clothing materials 0312 Oblačila 6,0 96,2 110,7 100,6 97,9 94,6 98,2 98,27 0312 Garments 0313 Drugi tekstilni izdelki in dodatki 0,2 96,1 99,1 97,6 99,4 96,8 99,0 98,09 0313 Other articles of clothing and clothing
accessories 0314 Storitve za obleko 0,2 103,1 100,1 106,1 106,9 102,8 106,1 106,72 0314 Services for clothing 032 Obutev in čevljarske storitve 1,8 100,2 108,6 99,0 100,2 98,1 100,1 101,47 032 Footwear 0321 Obutev 1,8 100,1 108,7 98,8 100,1 98,1 100,0 101,39 0321 Shoes and other footwear 04 Stanovanje 13,3 104,6 100,7 104,1 106,9 102,9 107,1 107,59 04 Housing, water, electricity, gas and other 041 Najemnina 1,7 102,6 99,6 103,0 103,3 101,7 103,4 103,99 041 Actual rents for housing 043 Redno vzdrževanje in popravilo 1,2 103,8 100,2 103,8 103,3 102,1 103,6 104,70 043 Maintenance and repair of dwelling 0431 Material za vzdrževanje in popravilo 0,5 102,3 100,6 99,2 99,3 101,1 100,6 100,81 0431 Materials for the maintenance and
repair of the dwelling 0432 Storitve za vzdrževanje in popravilo 0,7 104,8 100,0 107,2 106,3 102,9 105,8 107,56 0432 Services for the maintenance and repair
of the dwelling 044 Komunalne storitve 2,5 100,2 100,1 100,2 101,3 100,3 101,6 100,95 044 Municipal services 0441 Voda 1,2 99,9 100,0 99,7 100,0 100,0 100,5 99,89 0441 Water supply 0442 Odvoz smeti 0,6 99,3 100,0 99,3 98,9 99,6 98,7 98,82 0442 Refuse collection 0443 Kanalščina 0,2 105,8 100,0 105,8 103,3 103,3 102,8 105,90 0443 Sewerage collection 0444 Druge storitve za stanovanje 0,5 100,1 100,3 100,7 106,5 100,9 107,1 104,28 0444 Other services relating to the dwelling 045 Goriva in energija 7,9 106,5 101,2 105,6 110,1 104,0 110,3 111,05 045 Electricity, gas and other fuels 0451 Električna energija 2,8 102,3 100,0 102,3 101,3 100,9 101,3 102,70 0451 Electricity 0452 Plin 1,0 101,2 100,0 108,9 116,5 101,6 117,0 112,62 0452 Gas 0453 Tekoča goriva 2,6 113,1 102,3 104,0 115,4 108,3 116,3 117,54 0453 Liquid fuels 0454 Trda goriva 0,4 102,0 102,8 111,5 108,7 98,5 108,1 110,37 0454 Solid fuels 0455 Daljinska energija 1,0 108,7 102,0 113,1 117,0 106,5 116,7 117,13 0455 Heat energy 05 Stanovanjska oprema 6,7 104,8 100,3 105,2 103,7 102,2 103,8 105,95 05 Furnishing, household equipment
and maintenance 051 Pohištvo in talne obloge 2,3 103,0 100,1 103,2 103,7 101,5 104,1 104,73 051 Furniture and furnishing, carpets 0511 Pohištvo in oprema 2,2 103,3 100,2 103,5 103,8 101,6 104,2 104,98 0511 Furniture and furnishings 0512 Talne obloge 0,1 97,6 99,6 98,2 101,6 99,0 102,0 99,64 0512 Carpets and other floor coverings 052 Tekstilni izdelki za gospodinjstvo 0,6 99,9 99,8 100,6 100,2 99,7 100,9 100,57 052 Household textiles 053 Naprave in aparati za gospodinjstvo 1,3 99,8 100,6 101,4 101,4 99,7 101,5 101,16 053 Household appliances 0531 Gospodinjske naprave 1,0 99,8 101,0 101,3 100,9 99,5 100,9 100,92 0531 Major household appliances 0532 Mali gospodinjski aparati 0,1 99,4 98,6 103,1 104,9 100,8 105,4 102,60 0532 Small electronic household appliances 0533 Popravilo gospodinjskih naprav 0,1 100,9 100,0 101,0 102,2 100,6 103,6 102,09 0533 Repair of household appliances 054 Steklenina, posoda in pribor 0,4 101,5 100,1 101,8 102,8 100,8 103,1 103,09 054 Glassware, tableware and household
utensils 055 Orodje in pripomočki za hišo in vrt 0,2 92,1 96,3 95,2 100,4 98,7 100,8 93,34 055 Tools and equipment for house and garden056 Izdelki in storitve za vzdrževanje
gospodinjstva 1,9 114,0 100,9 113,4 106,8 106,3 106,2 114,21 056 Goods and services for routine
household maintenance 0561 Izdelki za vzdrževanje gospodinjstva 1,8 114,6 100,9 113,9 107,0 106,6 106,4 114,77 0561 Goods for routine household
maintenance 0562 Storitve za vzdrževanje gospodinjstva 0,1 102,9 102,2 103,5 102,6 101,2 - 103,97 0562 Services for routine household
maintenance
Statistične informacije, št. 174/2006 Rapid reports No 174/2006 3
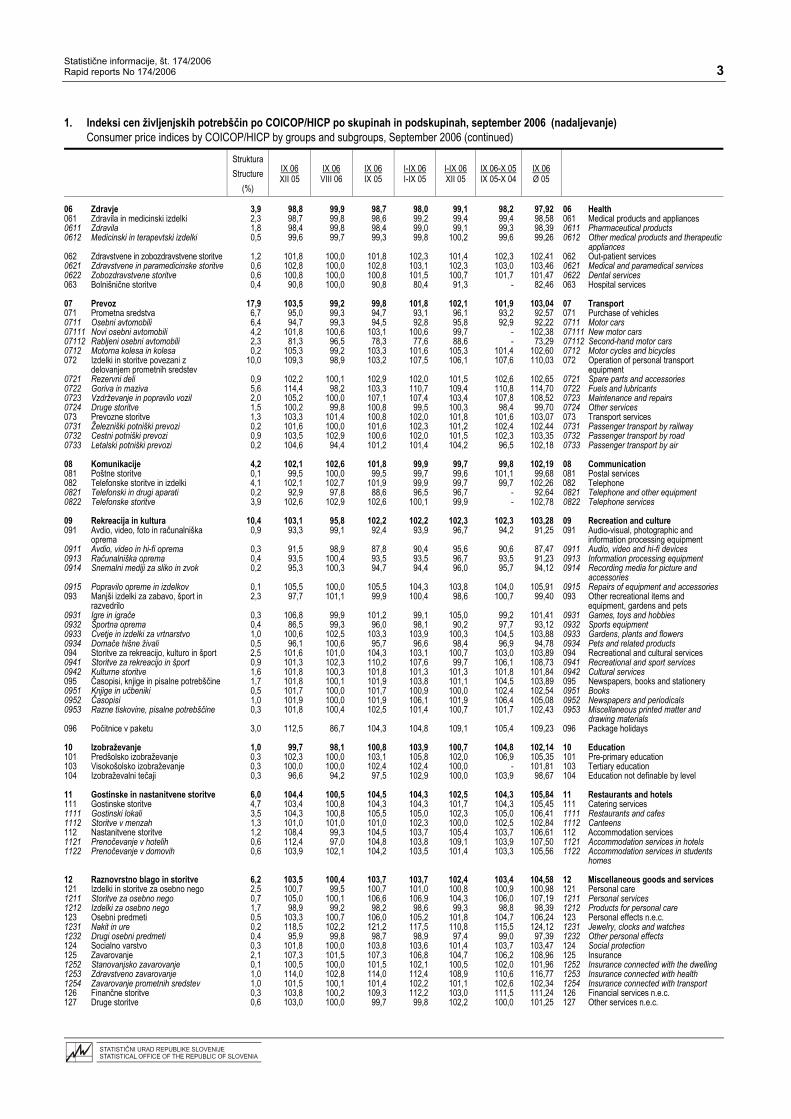
1. Indeksi cen življenjskih potrebščin po COICOP/HICP po skupinah in podskupinah, september 2006 (nadaljevanje)
Consumer price indices by COICOP/HICP by groups and subgroups, September 2006 (continued)
Struktura Structure
(%)
IX 06 XII 05
IX 06 VIII 06
IX 06 IX 05
I-IX 06 I-IX 05
I-IX 06 XII 05
IX 06-X 05 IX 05-X 04
IX 06 Ø 05
06 Zdravje 3,9 98,8 99,9 98,7 98,0 99,1 98,2 97,92 06 Health 061 Zdravila in medicinski izdelki 2,3 98,7 99,8 98,6 99,2 99,4 99,4 98,58 061 Medical products and appliances 0611 Zdravila 1,8 98,4 99,8 98,4 99,0 99,1 99,3 98,39 0611 Pharmaceutical products 0612 Medicinski in terapevtski izdelki 0,5 99,6 99,7 99,3 99,8 100,2 99,6 99,26 0612 Other medical products and therapeutic
appliances 062 Zdravstvene in zobozdravstvene storitve 1,2 101,8 100,0 101,8 102,3 101,4 102,3 102,41 062 Out-patient services 0621 Zdravstvene in paramedicinske storitve 0,6 102,8 100,0 102,8 103,1 102,3 103,0 103,46 0621 Medical and paramedical services 0622 Zobozdravstvene storitve 0,6 100,8 100,0 100,8 101,5 100,7 101,7 101,47 0622 Dental services 063 Bolnišnične storitve 0,4 90,8 100,0 90,8 80,4 91,3 - 82,46 063 Hospital services 07 Prevoz 17,9 103,5 99,2 99,8 101,8 102,1 101,9 103,04 07 Transport 071 Prometna sredstva 6,7 95,0 99,3 94,7 93,1 96,1 93,2 92,57 071 Purchase of vehicles 0711 Osebni avtomobili 6,4 94,7 99,3 94,5 92,8 95,8 92,9 92,22 0711 Motor cars 07111 Novi osebni avtomobili 4,2 101,8 100,6 103,1 100,6 99,7 - 102,38 07111 New motor cars 07112 Rabljeni osebni avtomobili 2,3 81,3 96,5 78,3 77,6 88,6 - 73,29 07112 Second-hand motor cars 0712 Motorna kolesa in kolesa 0,2 105,3 99,2 103,3 101,6 105,3 101,4 102,60 0712 Motor cycles and bicycles 072 Izdelki in storitve povezani z
delovanjem prometnih sredstev 10,0 109,3 98,9 103,2 107,5 106,1 107,6 110,03 072 Operation of personal transport
equipment 0721 Rezervni deli 0,9 102,2 100,1 102,9 102,0 101,5 102,6 102,65 0721 Spare parts and accessories 0722 Goriva in maziva 5,6 114,4 98,2 103,3 110,7 109,4 110,8 114,70 0722 Fuels and lubricants 0723 Vzdrževanje in popravilo vozil 2,0 105,2 100,0 107,1 107,4 103,4 107,8 108,52 0723 Maintenance and repairs 0724 Druge storitve 1,5 100,2 99,8 100,8 99,5 100,3 98,4 99,70 0724 Other services 073 Prevozne storitve 1,3 103,3 101,4 100,8 102,0 101,8 101,6 103,07 073 Transport services 0731 Železniški potniški prevozi 0,2 101,6 100,0 101,6 102,3 101,2 102,4 102,44 0731 Passenger transport by railway 0732 Cestni potniški prevozi 0,9 103,5 102,9 100,6 102,0 101,5 102,3 103,35 0732 Passenger transport by road 0733 Letalski potniški prevozi 0,2 104,6 94,4 101,2 101,4 104,2 96,5 102,18 0733 Passenger transport by air 08 Komunikacije 4,2 102,1 102,6 101,8 99,9 99,7 99,8 102,19 08 Communication 081 Poštne storitve 0,1 99,5 100,0 99,5 99,7 99,6 101,1 99,68 081 Postal services 082 Telefonske storitve in izdelki 4,1 102,1 102,7 101,9 99,9 99,7 99,7 102,26 082 Telephone 0821 Telefonski in drugi aparati 0,2 92,9 97,8 88,6 96,5 96,7 - 92,64 0821 Telephone and other equipment 0822 Telefonske storitve 3,9 102,6 102,9 102,6 100,1 99,9 - 102,78 0822 Telephone services 09 Rekreacija in kultura 10,4 103,1 95,8 102,2 102,2 102,3 102,3 103,28 09 Recreation and culture 091 Avdio, video, foto in računalniška
oprema 0,9 93,3 99,1 92,4 93,9 96,7 94,2 91,25 091 Audio-visual, photographic and
information processing equipment 0911 Avdio, video in hi-fi oprema 0,3 91,5 98,9 87,8 90,4 95,6 90,6 87,47 0911 Audio, video and hi-fi devices 0913 Računalniška oprema 0,4 93,5 100,4 93,5 93,5 96,7 93,5 91,23 0913 Information processing equipment 0914 Snemalni mediji za sliko in zvok 0,2 95,3 100,3 94,7 94,4 96,0 95,7 94,12 0914 Recording media for picture and
accessories 0915 Popravilo opreme in izdelkov 0,1 105,5 100,0 105,5 104,3 103,8 104,0 105,91 0915 Repairs of equipment and accessories 093 Manjši izdelki za zabavo, šport in
razvedrilo 2,3 97,7 101,1 99,9 100,4 98,6 100,7 99,40 093 Other recreational items and
equipment, gardens and pets 0931 Igre in igrače 0,3 106,8 99,9 101,2 99,1 105,0 99,2 101,41 0931 Games, toys and hobbies 0932 Športna oprema 0,4 86,5 99,3 96,0 98,1 90,2 97,7 93,12 0932 Sports equipment 0933 Cvetje in izdelki za vrtnarstvo 1,0 100,6 102,5 103,3 103,9 100,3 104,5 103,88 0933 Gardens, plants and flowers 0934 Domače hišne živali 0,5 96,1 100,6 95,7 96,6 98,4 96,9 94,78 0934 Pets and related products 094 Storitve za rekreacijo, kulturo in šport 2,5 101,6 101,0 104,3 103,1 100,7 103,0 103,89 094 Recreational and cultural services 0941 Storitve za rekreacijo in šport 0,9 101,3 102,3 110,2 107,6 99,7 106,1 108,73 0941 Recreational and sport services 0942 Kulturne storitve 1,6 101,8 100,3 101,8 101,3 101,3 101,8 101,84 0942 Cultural services 095 Časopisi, knjige in pisalne potrebščine 1,7 101,8 100,1 101,9 103,8 101,1 104,5 103,89 095 Newspapers, books and stationery 0951 Knjige in učbeniki 0,5 101,7 100,0 101,7 100,9 100,0 102,4 102,54 0951 Books 0952 Časopisi 1,0 101,9 100,0 101,9 106,1 101,9 106,4 105,08 0952 Newspapers and periodicals 0953 Razne tiskovine, pisalne potrebščine 0,3 101,8 100,4 102,5 101,4 100,7 101,7 102,43 0953 Miscellaneous printed matter and
drawing materials 096 Počitnice v paketu 3,0 112,5 86,7 104,3 104,8 109,1 105,4 109,23 096 Package holidays 10 Izobraževanje 1,0 99,7 98,1 100,8 103,9 100,7 104,8 102,14 10 Education 101 Predšolsko izobraževanje 0,3 102,3 100,0 103,1 105,8 102,0 106,9 105,35 101 Pre-primary education 103 Visokošolsko izobraževanje 0,3 100,0 100,0 102,4 102,4 100,0 - 101,81 103 Tertiary education 104 Izobraževalni tečaji 0,3 96,6 94,2 97,5 102,9 100,0 103,9 98,67 104 Education not definable by level 11 Gostinske in nastanitvene storitve 6,0 104,4 100,5 104,5 104,3 102,5 104,3 105,84 11 Restaurants and hotels 111 Gostinske storitve 4,7 103,4 100,8 104,3 104,3 101,7 104,3 105,45 111 Catering services 1111 Gostinski lokali 3,5 104,3 100,8 105,5 105,0 102,3 105,0 106,41 1111 Restaurants and cafes 1112 Storitve v menzah 1,3 101,0 101,0 101,0 102,3 100,0 102,5 102,84 1112 Canteens 112 Nastanitvene storitve 1,2 108,4 99,3 104,5 103,7 105,4 103,7 106,61 112 Accommodation services 1121 Prenočevanje v hotelih 0,6 112,4 97,0 104,8 103,8 109,1 103,9 107,50 1121 Accommodation services in hotels 1122 Prenočevanje v domovih 0,6 103,9 102,1 104,2 103,5 101,4 103,3 105,56 1122 Accommodation services in students
homes 12 Raznovrstno blago in storitve 6,2 103,5 100,4 103,7 103,7 102,4 103,4 104,58 12 Miscellaneous goods and services 121 Izdelki in storitve za osebno nego 2,5 100,7 99,5 100,7 101,0 100,8 100,9 100,98 121 Personal care 1211 Storitve za osebno nego 0,7 105,0 100,1 106,6 106,9 104,3 106,0 107,19 1211 Personal services 1212 Izdelki za osebno nego 1,7 98,9 99,2 98,2 98,6 99,3 98,8 98,39 1212 Products for personal care 123 Osebni predmeti 0,5 103,3 100,7 106,0 105,2 101,8 104,7 106,24 123 Personal effects n.e.c. 1231 Nakit in ure 0,2 118,5 102,2 121,2 117,5 110,8 115,5 124,12 1231 Jewelry, clocks and watches 1232 Drugi osebni predmeti 0,4 95,9 99,8 98,7 98,9 97,4 99,0 97,39 1232 Other personal effects 124 Socialno varstvo 0,3 101,8 100,0 103,8 103,6 101,4 103,7 103,47 124 Social protection 125 Zavarovanje 2,1 107,3 101,5 107,3 106,8 104,7 106,2 108,96 125 Insurance 1252 Stanovanjsko zavarovanje 0,1 100,5 100,0 101,5 102,1 100,5 102,0 101,96 1252 Insurance connected with the dwelling 1253 Zdravstveno zavarovanje 1,0 114,0 102,8 114,0 112,4 108,9 110,6 116,77 1253 Insurance connected with health 1254 Zavarovanje prometnih sredstev 1,0 101,5 100,1 101,4 102,2 101,1 102,6 102,34 1254 Insurance connected with transport 126 Finančne storitve 0,3 103,8 100,2 109,3 112,2 103,0 111,5 111,24 126 Financial services n.e.c. 127 Druge storitve 0,6 103,0 100,0 99,7 99,8 102,2 100,0 101,25 127 Other services n.e.c.
Statistične informacije, št. 174/2006 4 Rapid reports No 174/2006
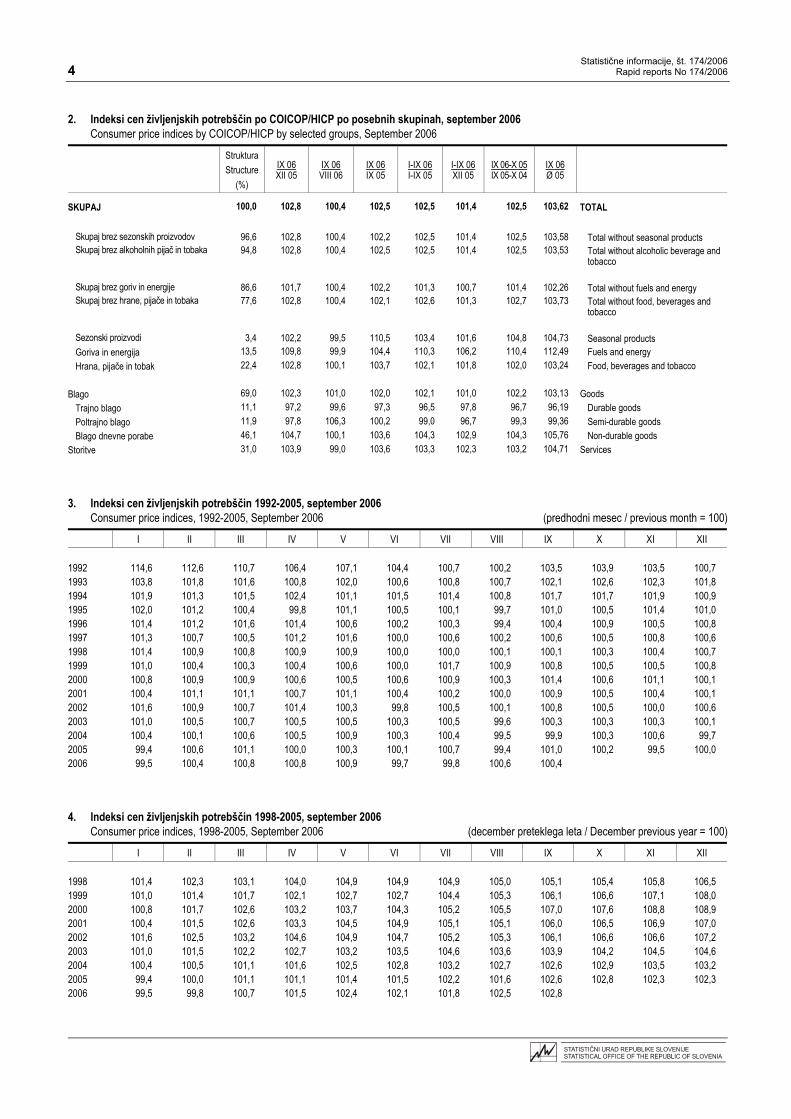
2. Indeksi cen življenjskih potrebščin po COICOP/HICP po posebnih skupinah, september 2006 Consumer price indices by COICOP/HICP by selected groups, September 2006
Struktura Structure
(%)
IX 06 XII 05
IX 06 VIII 06
IX 06 IX 05
I-IX 06 I-IX 05
I-IX 06 XII 05
IX 06-X 05 IX 05-X 04
IX 06 Ø 05
SKUPAJ 100,0 102,8 100,4 102,5 102,5 101,4 102,5 103,62 TOTAL
Skupaj brez sezonskih proizvodov 96,6 102,8 100,4 102,2 102,5 101,4 102,5 103,58 Total without seasonal products Skupaj brez alkoholnih pijač in tobaka 94,8 102,8 100,4 102,5 102,5 101,4 102,5 103,53 Total without alcoholic beverage and
tobacco Skupaj brez goriv in energije 86,6 101,7 100,4 102,2 101,3 100,7 101,4 102,26 Total without fuels and energy Skupaj brez hrane, pijače in tobaka 77,6 102,8 100,4 102,1 102,6 101,3 102,7 103,73 Total without food, beverages and
tobacco Sezonski proizvodi 3,4 102,2 99,5 110,5 103,4 101,6 104,8 104,73 Seasonal products Goriva in energija 13,5 109,8 99,9 104,4 110,3 106,2 110,4 112,49 Fuels and energy Hrana, pijače in tobak 22,4 102,8 100,1 103,7 102,1 101,8 102,0 103,24 Food, beverages and tobacco
Blago 69,0 102,3 101,0 102,0 102,1 101,0 102,2 103,13 Goods
Trajno blago 11,1 97,2 99,6 97,3 96,5 97,8 96,7 96,19 Durable goods Poltrajno blago 11,9 97,8 106,3 100,2 99,0 96,7 99,3 99,36 Semi-durable goods Blago dnevne porabe 46,1 104,7 100,1 103,6 104,3 102,9 104,3 105,76 Non-durable goods
Storitve 31,0 103,9 99,0 103,6 103,3 102,3 103,2 104,71 Services 3. Indeksi cen življenjskih potrebščin 1992-2005, september 2006
Consumer price indices, 1992-2005, September 2006 (predhodni mesec / previous month = 100)
I II III IV V VI VII VIII IX X XI XII 1992 114,6 112,6 110,7 106,4 107,1 104,4 100,7 100,2 103,5 103,9 103,5 100,7 1993 103,8 101,8 101,6 100,8 102,0 100,6 100,8 100,7 102,1 102,6 102,3 101,8 1994 101,9 101,3 101,5 102,4 101,1 101,5 101,4 100,8 101,7 101,7 101,9 100,9 1995 102,0 101,2 100,4 99,8 101,1 100,5 100,1 99,7 101,0 100,5 101,4 101,0 1996 101,4 101,2 101,6 101,4 100,6 100,2 100,3 99,4 100,4 100,9 100,5 100,8 1997 101,3 100,7 100,5 101,2 101,6 100,0 100,6 100,2 100,6 100,5 100,8 100,6 1998 101,4 100,9 100,8 100,9 100,9 100,0 100,0 100,1 100,1 100,3 100,4 100,7 1999 101,0 100,4 100,3 100,4 100,6 100,0 101,7 100,9 100,8 100,5 100,5 100,8 2000 100,8 100,9 100,9 100,6 100,5 100,6 100,9 100,3 101,4 100,6 101,1 100,1 2001 100,4 101,1 101,1 100,7 101,1 100,4 100,2 100,0 100,9 100,5 100,4 100,1 2002 101,6 100,9 100,7 101,4 100,3 99,8 100,5 100,1 100,8 100,5 100,0 100,6 2003 101,0 100,5 100,7 100,5 100,5 100,3 100,5 99,6 100,3 100,3 100,3 100,1 2004 100,4 100,1 100,6 100,5 100,9 100,3 100,4 99,5 99,9 100,3 100,6 99,7 2005 99,4 100,6 101,1 100,0 100,3 100,1 100,7 99,4 101,0 100,2 99,5 100,0 2006 99,5 100,4 100,8 100,8 100,9 99,7 99,8 100,6 100,4 4. Indeksi cen življenjskih potrebščin 1998-2005, september 2006
Consumer price indices, 1998-2005, September 2006 (december preteklega leta / December previous year = 100)
I II III IV V VI VII VIII IX X XI XII 1998 101,4 102,3 103,1 104,0 104,9 104,9 104,9 105,0 105,1 105,4 105,8 106,5 1999 101,0 101,4 101,7 102,1 102,7 102,7 104,4 105,3 106,1 106,6 107,1 108,0 2000 100,8 101,7 102,6 103,2 103,7 104,3 105,2 105,5 107,0 107,6 108,8 108,9 2001 100,4 101,5 102,6 103,3 104,5 104,9 105,1 105,1 106,0 106,5 106,9 107,0 2002 101,6 102,5 103,2 104,6 104,9 104,7 105,2 105,3 106,1 106,6 106,6 107,2 2003 101,0 101,5 102,2 102,7 103,2 103,5 104,6 103,6 103,9 104,2 104,5 104,6 2004 100,4 100,5 101,1 101,6 102,5 102,8 103,2 102,7 102,6 102,9 103,5 103,2 2005 99,4 100,0 101,1 101,1 101,4 101,5 102,2 101,6 102,6 102,8 102,3 102,3 2006 99,5 99,8 100,7 101,5 102,4 102,1 101,8 102,5 102,8
Statistične informacije, št. 174/2006 Rapid reports No 174/2006 5
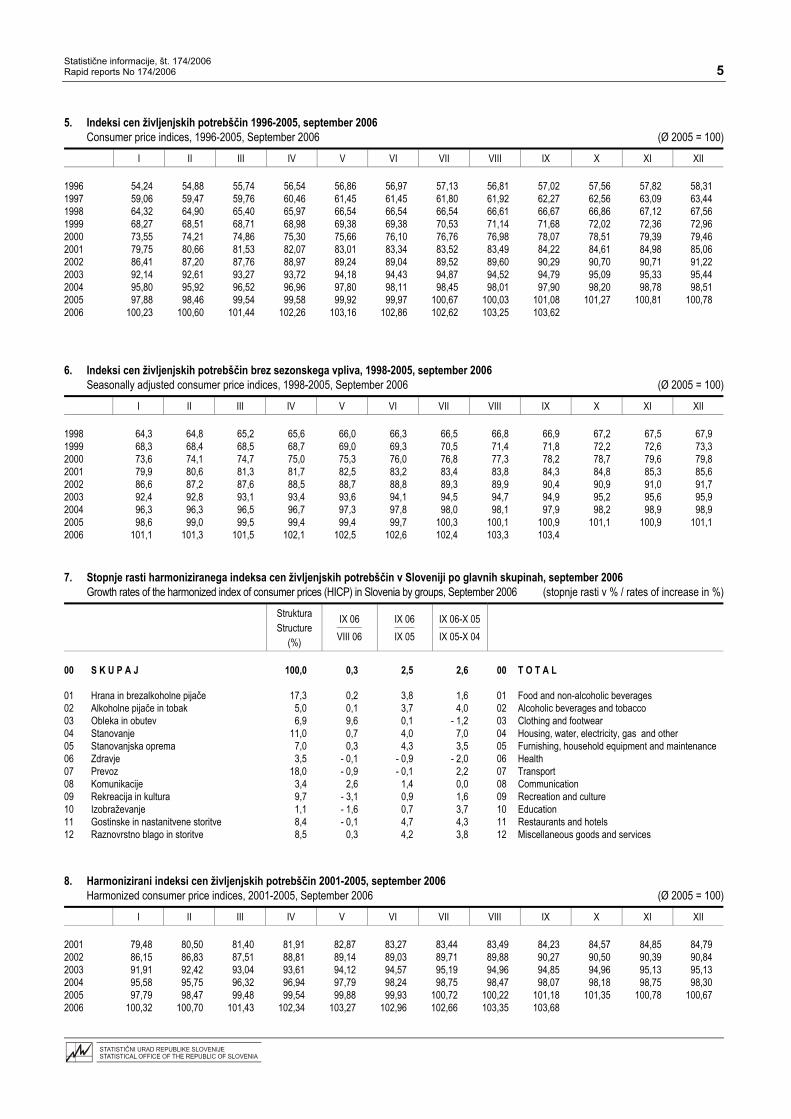
5. Indeksi cen življenjskih potrebščin 1996-2005, september 2006
Consumer price indices, 1996-2005, September 2006 (Ø 2005 = 100) I II III IV V VI VII VIII IX X XI XII 1996 54,24 54,88 55,74 56,54 56,86 56,97 57,13 56,81 57,02 57,56 57,82 58,31 1997 59,06 59,47 59,76 60,46 61,45 61,45 61,80 61,92 62,27 62,56 63,09 63,44 1998 64,32 64,90 65,40 65,97 66,54 66,54 66,54 66,61 66,67 66,86 67,12 67,56 1999 68,27 68,51 68,71 68,98 69,38 69,38 70,53 71,14 71,68 72,02 72,36 72,96 2000 73,55 74,21 74,86 75,30 75,66 76,10 76,76 76,98 78,07 78,51 79,39 79,46 2001 79,75 80,66 81,53 82,07 83,01 83,34 83,52 83,49 84,22 84,61 84,98 85,06 2002 86,41 87,20 87,76 88,97 89,24 89,04 89,52 89,60 90,29 90,70 90,71 91,22 2003 92,14 92,61 93,27 93,72 94,18 94,43 94,87 94,52 94,79 95,09 95,33 95,44 2004 95,80 95,92 96,52 96,96 97,80 98,11 98,45 98,01 97,90 98,20 98,78 98,51 2005 97,88 98,46 99,54 99,58 99,92 99,97 100,67 100,03 101,08 101,27 100,81 100,78 2006 100,23 100,60 101,44 102,26 103,16 102,86 102,62 103,25 103,62 6. Indeksi cen življenjskih potrebščin brez sezonskega vpliva, 1998-2005, september 2006
Seasonally adjusted consumer price indices, 1998-2005, September 2006 (Ø 2005 = 100) I II III IV V VI VII VIII IX X XI XII
1998 64,3 64,8 65,2 65,6 66,0 66,3 66,5 66,8 66,9 67,2 67,5 67,9 1999 68,3 68,4 68,5 68,7 69,0 69,3 70,5 71,4 71,8 72,2 72,6 73,3 2000 73,6 74,1 74,7 75,0 75,3 76,0 76,8 77,3 78,2 78,7 79,6 79,8 2001 79,9 80,6 81,3 81,7 82,5 83,2 83,4 83,8 84,3 84,8 85,3 85,6 2002 86,6 87,2 87,6 88,5 88,7 88,8 89,3 89,9 90,4 90,9 91,0 91,7 2003 92,4 92,8 93,1 93,4 93,6 94,1 94,5 94,7 94,9 95,2 95,6 95,9 2004 96,3 96,3 96,5 96,7 97,3 97,8 98,0 98,1 97,9 98,2 98,9 98,9 2005 98,6 99,0 99,5 99,4 99,4 99,7 100,3 100,1 100,9 101,1 100,9 101,1 2006 101,1 101,3 101,5 102,1 102,5 102,6 102,4 103,3 103,4 7. Stopnje rasti harmoniziranega indeksa cen življenjskih potrebščin v Sloveniji po glavnih skupinah, september 2006
Growth rates of the harmonized index of consumer prices (HICP) in Slovenia by groups, September 2006 (stopnje rasti v % / rates of increase in %)
Struktura Structure
(%)
IX 06 VIII 06
IX 06IX 05
IX 06-X 05IX 05-X 04
00 S K U P A J 100,0 0,3 2,5 2,6 00 T O T A L 01 Hrana in brezalkoholne pijače 17,3 0,2 3,8 1,6 01 Food and non-alcoholic beverages 02 Alkoholne pijače in tobak 5,0 0,1 3,7 4,0 02 Alcoholic beverages and tobacco 03 Obleka in obutev 6,9 9,6 0,1 - 1,2 03 Clothing and footwear 04 Stanovanje 11,0 0,7 4,0 7,0 04 Housing, water, electricity, gas and other 05 Stanovanjska oprema 7,0 0,3 4,3 3,5 05 Furnishing, household equipment and maintenance 06 Zdravje 3,5 - 0,1 - 0,9 - 2,0 06 Health 07 Prevoz 18,0 - 0,9 - 0,1 2,2 07 Transport 08 Komunikacije 3,4 2,6 1,4 0,0 08 Communication 09 Rekreacija in kultura 9,7 - 3,1 0,9 1,6 09 Recreation and culture 10 Izobraževanje 1,1 - 1,6 0,7 3,7 10 Education 11 Gostinske in nastanitvene storitve 8,4 - 0,1 4,7 4,3 11 Restaurants and hotels 12 Raznovrstno blago in storitve 8,5 0,3 4,2 3,8 12 Miscellaneous goods and services
8. Harmonizirani indeksi cen življenjskih potrebščin 2001-2005, september 2006 Harmonized consumer price indices, 2001-2005, September 2006 (Ø 2005 = 100)
I II III IV V VI VII VIII IX X XI XII 2001 79,48 80,50 81,40 81,91 82,87 83,27 83,44 83,49 84,23 84,57 84,85 84,79 2002 86,15 86,83 87,51 88,81 89,14 89,03 89,71 89,88 90,27 90,50 90,39 90,84 2003 91,91 92,42 93,04 93,61 94,12 94,57 95,19 94,96 94,85 94,96 95,13 95,13 2004 95,58 95,75 96,32 96,94 97,79 98,24 98,75 98,47 98,07 98,18 98,75 98,30 2005 97,79 98,47 99,48 99,54 99,88 99,93 100,72 100,22 101,18 101,35 100,78 100,67 2006 100,32 100,70 101,43 102,34 103,27 102,96 102,66 103,35 103,68
Statistične informacije, št. 174/2006 6 Rapid reports No 174/2006
9. Stopnje rasti harmoniziranega indeksa cen življenjskih potrebščin v EU, avgust 2006
Growth rates of harmonized index of consumer prices in EU, August 2006 (stopnje rasti v % / rates of increase in %)
VIII 06 VIII 05 VIII 06
VIII 05 EU 251) 2,3p Italija / Italy 2,3 EU 151) 2,3p Latvija / Latvia 6,8 Slovenija / Slovenia 3,1 Litva / Lithuania 4,3 Avstrija / Austria 2,1p Luksemburg / Luxembourg 3,1 Belgija / Belgium 2,4 Madžarska / Hungary 4,7 Ciper / Cyprus 2,7 Malta / Malta 3,0 Češka republika / Czech Republic 2,6 Nemčija / Germany 1,8 Danska / Denmark 1,9 Nizozemska / Netherlands 1,9p Estonija / Estonia 5,0 Poljska / Poland 1,7 Finska / Finland 1,3 Portugalska / Portugal 2,0 Francija / France 2,1 Slovaška / Slovakia 5,0 Grčija / Greece 3,4 Španija / Spain 3,8 Irska / Ireland 3,2 Švedska / Sweden 1,6 Velika Britanija / United Kingdom 2,5
n.a. ni podatka / data not available p začasni podatek / provisional data Vir: / Source: Eurostat press release, No 123/2006 1) Evropski indeks cen življenjskih potrebščin (EICP). European index of Consumer Prices (EICP). METODOLOŠKA POJASNILA METHODOLOGICAL EXPLANATIONS
Namen Purpose
Indeks cen življenjskih potrebščin meri spremembe drobnoprodajnih cenizdelkov in storitev glede na strukturo izdatkov, ki jih domače prebivalstvonamenja za nakupe predmetov končne porabe doma in v tujini(nacionalni princip potrošnje).
The consumer price index measures changes of the level of retail pricesof goods and services from the point of view of expenditure structure,which residential population intends for final consumption at home andabroad (national concept).
Zajetje Coverage
Košarico za izračun indeksov cen življenjskih potrebščin sestavlja 660reprezentativnih proizvodov. V košarico so izbrani tisti proizvodi, ki imajonajpomembnejši delež v skupni potrošnji in katerih gibanje cen obenemnajbolje odraža gibanje cen sorodnih proizvodov.
The basket for calculating consumer price indices contains 660representative products. Selected for the basket are goods that have themost important share in total consumption and whose changes of pricesreflect best changes of prices of related products.
Metode zbiranja podatkov Data collection method
Podatke o cenah reprezentativnih izdelkov in storitev vsak mesec zberejoopazovalci cen, in sicer neposredno na okoli 1 200 izbranih opazovalnihmestih (kot so trgovine, tržnice, obrtne delavnice, storitvene in drugeorganizacije) v Kopru, Ljubljani, Mariboru in Novem mestu. Del cen pa sezbere tudi po telefonu in prek interneta. Mesečno je v izračun indeksatako zajetih okrog 13 000 cen.
Data on prices for representative goods and services are collectedmonthly by price collectors in Koper, Ljubljana, Maribor and Novo mestoin about 1,200 selected shops, marketplaces, at craftsmen and in otherorganisations. Some of the prices are alco collected centrally and throughthe Internet. On average about 13,000 prices are used for calculating theindex every month.
Proizvodi so za potrebe izvajanja oz. razporeditve časa opazovanja vposameznem mesecu razvrščeni v naslednje sorodne skupine:
For the purpose of organising the observation time in individual months,products are classified into the following related groups:
− kmetijski pridelki (čas opazovanja 1. in 3. teden v mesecu) − agricultural products (observed in the 1st and 3rd week) − živilski izdelki (med 16. in 21. v mesecu) − food products (between 16th and 21st of the month) − neživilski izdelki (med 1. in 15. v mesecu) − non-food products (between 1st and 15th of the month) − storitve (med 22. in 25. v mesecu) − services (between 22nd and 25th of the month) − naftni derivati (med 1. in 25. v mesecu) − fuels (between 1st and 25th of the month)
Ponderacija Weighting
Uteži, ki se uporabljajo za izračun indeksa v določenem letu, temeljijo napodatkih iz anket o potrošnji gospodinjstev kot glavnemu viru. Te podatkedopolnjujemo in preverjamo še z drugimi statističnimi in ostalimidosegljivimi viri. Uteži se spreminjajo vsako leto.
Weights for calculating the index in a certain year are based onexpenditure from household budget surveys as a main data source.These data are supplemented and verified with other statistical and non-statistical sources. Weights have been changed every year.
Letošnje uteži temeljijo na triletnem povprečju izdatkov iz anket opotrošnji v gospodinjstvih za leta 2002, 2003 in 2004, preračunanem
This year’s weights are based on the three-year average of expenditurefrom Households budget surveys in 2002, 2003 and 2004 recalculated
Statistične informacije, št. 174/2006 Rapid reports No 174/2006 7
(indeksiranje) na cene decembra 2005, ki je tudi bazni mesec za izračunindeksov.
(indexed) to the prices of December 2005, which is also the index basemonth.
Izračun Calculation
Ko so v posameznem mesecu zbrane vse cene, sledijo izračuni najprejpovprečnih cen in nato indeksov cen.
When in particular month all prices are collected, than first average pricesare computed and than price indices.
Povprečno ceno vsakega posameznega proizvoda v kraju izračunamo znavadno aritmetično sredino iz cen, zbranih na vseh opazovalnih mestihv tem kraju.
The average price of each individual product in the locality is calculatedwith simple arithmetic mean from prices collected in all places ofobservation in that locality.
Povprečno nacionalno ceno vsakega proizvoda izračunamo s tehtanoaritmetično sredino iz predhodno izračunanih povprečnih krajevnih cen.
The average national price of each product is calculated with weightedarithmetic mean from previously calculated average prices in the locality.
Iz povprečnih nacionalnih cen vsakega tekočega in baznega meseca(december predhodnega leta) izračunamo za vsak posamezen proizvodindividualne indekse.
From average national prices in each current and base month (Decemberof the previous year) we calculate individual indices for each individualproduct.
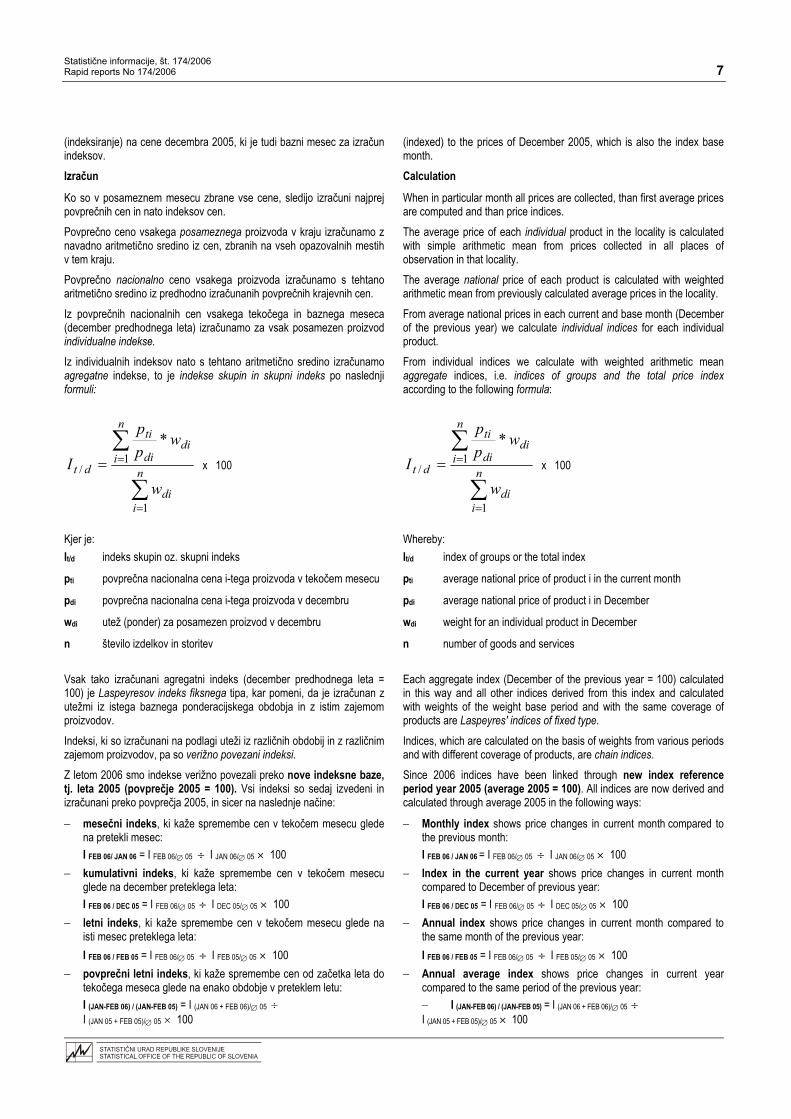
Iz individualnih indeksov nato s tehtano aritmetično sredino izračunamoagregatne indekse, to je indekse skupin in skupni indeks po naslednjiformuli:
From individual indices we calculate with weighted arithmetic meanaggregate indices, i.e. indices of groups and the total price indexaccording to the following formula:
∑
∑
=
== n
idi
n
idi
di
ti
dt
w
wpp
I
1
1/
* x 100
∑
∑
=
== n
idi
n
idi
di
ti
dt
w
wpp
I
1
1/
* x 100
Kjer je: Whereby: It/d indeks skupin oz. skupni indeks It/d index of groups or the total index
pti povprečna nacionalna cena i-tega proizvoda v tekočem mesecu pti average national price of product i in the current month
pdi povprečna nacionalna cena i-tega proizvoda v decembru pdi average national price of product i in December
wdi utež (ponder) za posamezen proizvod v decembru wdi weight for an individual product in December
n število izdelkov in storitev n number of goods and services Vsak tako izračunani agregatni indeks (december predhodnega leta =100) je Laspeyresov indeks fiksnega tipa, kar pomeni, da je izračunan zutežmi iz istega baznega ponderacijskega obdobja in z istim zajemomproizvodov.
Each aggregate index (December of the previous year = 100) calculatedin this way and all other indices derived from this index and calculatedwith weights of the weight base period and with the same coverage ofproducts are Laspeyres' indices of fixed type.
Indeksi, ki so izračunani na podlagi uteži iz različnih obdobij in z različnimzajemom proizvodov, pa so verižno povezani indeksi.
Indices, which are calculated on the basis of weights from various periodsand with different coverage of products, are chain indices.
Z letom 2006 smo indekse verižno povezali preko nove indeksne baze,tj. leta 2005 (povprečje 2005 = 100). Vsi indeksi so sedaj izvedeni inizračunani preko povprečja 2005, in sicer na naslednje načine:
Since 2006 indices have been linked through new index referenceperiod year 2005 (average 2005 = 100). All indices are now derived andcalculated through average 2005 in the following ways:
− mesečni indeks, ki kaže spremembe cen v tekočem mesecu gledena pretekli mesec:
− Monthly index shows price changes in current month compared tothe previous month:
I FEB 06/ JAN 06 = I FEB 06/∅ 05 ÷ I JAN 06/∅ 05 × 100 I FEB 06 / JAN 06 = I FEB 06/∅ 05 ÷ I JAN 06/∅ 05 × 100 − kumulativni indeks, ki kaže spremembe cen v tekočem mesecu
glede na december preteklega leta: − Index in the current year shows price changes in current month
compared to December of previous year: I FEB 06 / DEC 05 = I FEB 06/∅ 05 ÷ I DEC 05/∅ 05 × 100 I FEB 06 / DEC 05 = I FEB 06/∅ 05 ÷ I DEC 05/∅ 05 × 100
− letni indeks, ki kaže spremembe cen v tekočem mesecu glede naisti mesec preteklega leta:
− Annual index shows price changes in current month compared tothe same month of the previous year:
I FEB 06 / FEB 05 = I FEB 06/∅ 05 ÷ I FEB 05/∅ 05 × 100 I FEB 06 / FEB 05 = I FEB 06/∅ 05 ÷ I FEB 05/∅ 05 × 100 − povprečni letni indeks, ki kaže spremembe cen od začetka leta do
tekočega meseca glede na enako obdobje v preteklem letu: − Annual average index shows price changes in current year
compared to the same period of the previous year: I (JAN-FEB 06) / (JAN-FEB 05) = I (JAN 06 + FEB 06)/∅ 05 ÷ I (JAN 05 + FEB 05)/∅ 05 × 100
− I (JAN-FEB 06) / (JAN-FEB 05) = I (JAN 06 + FEB 06)/∅ 05 ÷ I (JAN 05 + FEB 05)/∅ 05 × 100
Statistične informacije, št. 174/2006 8 Rapid reports No 174/2006
− povprečni letošnji indeks, ki kaže spremembe cen od začetka letado tekočega meseca glede na december preteklega leta:
− Average index in the current year shows price changes in currentyear compared to December of previous year:
I (JAN-FEB 06) / XII 05 = (I JAN 06/XII 05 + I FEB 06/XII 05) ÷ 2 I (JAN-FEB 06) / XII 05 = (I JAN 06/XII 05 + I FEB 06/XII 05) ÷ 2 − 12-mesečni povprečni indeks, ki kaže spremembe cen v zadnjih
dvanajstih mesecih v primerjavi s preteklimi dvanajstimi meseci: − 12 month average index shows price changes in the latest 12
months to the average of the previous 12 months: I (JAN06-FEB05/JAN05-FEB04) = I (JAN06+DEC05+…+FEB05)/12 ÷ I (JAN05+DEC04+…+FEB04)/12
I (JAN06-FEB05/JAN05-FEB04) = I (JAN06+DEC05+…+FEB05)/12 ÷ I (JAN05+DEC04+…+FEB04)/12
Kjer je: Whereby: I FEB 06 / JAN 06 indeks za februar 2006 v primerjavi z Indeksom za januar 2006
I FEB 06 / JAN 06 index February 2006 in comparison to index January 2006
V preteklih letih so bili indeksi verižno povezani preko povprečja 2000. Zazagotovitev daljše časovne serije so ti indeksi preračunani tudi na novobazo tj. povprečje 2005, in sicer do leta 1996.
In previous years indices have been linked through index referenceperiod 2000=100. Indices until 1996 have also been recalculated on thenew index refernce period 2005=100 to provide longer time series.
Klasifikacija Classification
Od leta 1997 razvrščamo proizvode in računamo indekse cenživljenjskih potrebščin po novi klasifikaciji individualne porabesredstev (COICOP/HICP). Klasifikacija je bila z letom 2000 usklajenaz dokončno različico COICOP, sprejeto v letu 1999.
Since 1997 we have been using COICOP/HICP (Classification ofIndividual Consumption by Purpose) for classifying products andcalculating consumer price indices. In 2000 the classification was adaptedto the final version of COICOP, which was adopted in 1999.
Po omenjeni klasifikaciji razvrščamo proizvode (za namene računanja inobjavljanja indeksov) v:
According to the mentioned classification for the purpose of calculatingand publishing indices we classify products into
01 oddelke (npr. Hrana in brezalkoholne pijače), 01 divisions (e.g. Food and non-alcoholic beverages), 011 skupine (npr. Hrana) 011 groups (e.g. food) 0111 razrede (npr. Kruh in izdelki iz žit). 0111 classes (e.g. Bread and cereals).
Indekse praviloma objavljamo do ravni razreda, razen v primerih, ko jenjegova utež manjša od 0,1 %, ali v primerih, ko je razred zastopan le zenim proizvodom.
As a rule, indices are published at the level of class, except in caseswhen the weight of the class is below 0.1% or in cases when the class inrepresented by one product only.
Od leta 2000 v skladu z novo klasifikacijo izračunavamo še indekse zaposebne skupine, kot so * blago, * blago dnevne rabe, * poltrajno blago,* trajno blago, * storitve, * goriva in energija, * sezonski proizvodi,* skupni indeks brez alkohola in tobaka ter * skupni indeks brezsezonskih proizvodov. V letu 2001 pa smo omenjenim skupinam dodališe tri: * hrana, pijače in tobak, * skupni indeks brez hrane, pijač in tobakater * skupni indeks brez goriv in energije.
In accordance with the new classification, since January 2000 wecalculate indices for special groups such as * goods, * non-durablegoods, * semi-durable goods, * durable goods, * services, * fuel andenergy, * seasonal products, * total index without alcoholic beverages andtobacco, and * total index without seasonal products. In 2001 we addedthree new special groups: * food, beverages and tobacco, * total indexwithout food, beverages and tobacco and * total index without fuels andenergy.
Desezoniranje Seasonal adjustment
Z januarjem 2002 smo spremenili metodologijo desezoniranja indeksovcen življenjskih potrebščin. Metodo X-11 smo nadomestili z metodoTRAMO/SEATS, ki temelji na uporabi modelov ARIMA.
In January 2002 we changed the methodology of seasonal adjustment ofconsumer prices indices. The X-11 method was replaced by theTRAMO/SEATS method, which is based on the use of ARIMA models.
Pri oblikovanju modela smo upoštevali časovno obdobje od januarja 1996do januarja 2006.
In designing the model we took into account the period from January1996 to January 2006.
Desezonirane vrednosti vsebujejo trend-cikel in naključno komponento,vpliv sezone je izključen.
Seasonally adjusted values contain the trend-cycle and the randomcomponent with the seasonal component being eliminated.
Definicije Definitions
Harmonizirani indeks cen življenjskih potrebščin (HICŽP) merispremembe v ravni drobnoprodajnih cen izdelkov in storitev glede nasestavo izdatkov, ki jih potrošniki (domači in tuji) namenjajo za nakupepredmetom končne porabe na ozemlju Slovenije (domače načeloporabe).
Harmonized Index of Consumer Prices (HICP) measures changes inthe level of retail prices of goods and services from the point of view ofthe expenditure structure, which consumers (domestic and foreign) intendfor final consumption in the territory of Slovenia (domestic concept).
Za pripravo uteži se kot glavni vir uporabljajo podatki iz nacionalnihračunov o izdatkih gospodinjstev za končno potrošnjo. Tudi te podatke papreverjamo in dopolnjujemo s podatki iz drugih virov. Uteži za leto 2006temeljijo na podatkih o strukturi izdatkov za leto 2004, preračunanih na
Weighting has been based on the data from National Account on thestructure of household final consumption expenditure. These data arealso supplemented and verified with other statistical and non-statisticalsources. Weights for 2006 are based on the data for 2004 recalculated to
Statistične informacije, št. 174/2006 Rapid reports No 174/2006 9
cene decembra 2005; to je tudi referenčno cenovno obdobje. December 2005, which is also the price reference period. Je tudi primerljiv indeks cen življenjskih potrebščin, ki ga računajo državečlanice EU in se uporablja za primerjanje inflacijskih stopenj v tehdržavah oz. s temi državami. Računamo ga od leta 2001.
It is the comparable index of consumer prices produced by each MemberState and used for international comparison of consumer price inflation.Slovenia has been calculating it since 2001.
COICOP/HICP (Classification of Individual Consumption by Purpose/ Harmonized Index of Consumer Prices) je klasifikacija, ki razvrščaproizvode po namenu v 12 glavnih skupin in je prilagojena potrebamračunanja harmoniziranega indeksa cen življenjskih potrebščin.
COICOP/HICP (Classification of Individual Consumption by Purpose/ Harmonised Index of Consumer Prices) is a classification of productsby purpose into 12 main groups, adapted to the needs of the harmonisedindex of consumer prices.
Uteži pomenijo deleže potrošnje posameznega izdelka oz. storitve vskupni potrošnji in so namenjene tudi merjenju prispevka vplivaspremembe cene posameznega izdelka oz. storitve k skupni spremembicene.
Weights are shares of consumption of individual goods or services in thetotal consumption and are intended for measuring the impact of thechange in the price of individual goods or services in the total change ofthe price.
Referenčno (bazno) obdobje uteži je obdobje, običajno izbrano leto, nakaterega se nanašajo ocenjene vrednosti potrošnje, uporabljene priizračunu uteži.
Weight reference (base) period is the period, usually the selected year,to which the estimated values of consumption, used for calculatingweights, refer.
Referenčno (bazno) obdobje cen je obdobje, s katerega cenami se obvsakem izračunu indeksov primerjajo cene iz tekočega obdobja. V našemprimeru je bazno cenovno obdobje december preteklega leta (od leta1994).
Price reference (base) period is the period, the prices of which are inthe index calculation compared to the prices of the current period. In ourcase the price base period is December of the previous year (since1994).
Referenčno (bazno) obdobje indeksov je obdobje, običajno izbranoleto, v katerem je indeks enak 100.
Index reference (base) period is the period, usually the selected year, inwhich the index base is set to 100.
Blago dnevne rabe so proizvodi, katerih rok trajanja je zelo kratek,običajno do enega leta (npr. hrana, pijače).
Non-durable goods are products with very short durability, usually up toone year (e.g. food).
Poltrajno blago so proizvodi, katerih predvidena življenjska doba je okolienega leta in, katerih vrednost ni prav velika (npr. obleka in obutev).
Semi-durable goods are products with durability of about one year. Theymust not be very valuable (e.g. clothing and footwear).
Trajno blago so proizvodi z daljšo življenjsko dobo, obenem pa je tudinjihova vrednost precej velika (npr. pohištvo, prometna sredstva).
Durable goods are products with long durability. At the same time theycan be quite valuable (e.g. furniture, means of transport).
Sezonski proizvodi so proizvodi, katerih obseg ponudbe na trgu in s temtudi njihova cena sta zelo odvisni od letnega časa oz. drugih dejavnikov.V našem primeru so med sezonske proizvode uvrščeni sadje, zelenjavain ribe.
Seasonal goods are products whose market supply and price dependvery much on the season and other factors. In our case seasonalproducts are fruit, vegetables and fishes.. In our case seasonal productsare fruit, vegetables and fishes.
Goriva in energija je ena od posebnih skupin, ki jo sestavljajo proizvodiza ogrevanje in razsvetljavo stanovanj (045 Goriva in energija) terpogonska goriva (0722 Goriva in maziva).
Fuels and energy is one of the special groups, which is composite fromitems for heating and lightning (045 Electricity, gas and other fuels) andjuices (0711 Fuels and lubricants).
Publiciranje Publishing
Mesečno: Monthly: − Statistične informacije. Cene. Indeksi cen življenjskih potrebščin
(med 10. in 15. v naslednjem mesecu, Prva skrajšana objava pazadnji delovni dan v tekočem mesecu)
− Mesečni statistični pregled − Nekateri pomembnejši podatki RS − Podatkovna baza SI-STAT
− Rapid Reports. Prices. Consumer Price Indices (between the 10thand 15th day of the next month, Topical Data on the last day of thecurrent month)
− Monthly Statistical Review − Some Important Data of the Republic of Slovenia − SI-STAT database
Letno: Yearly: − Slovenija v številkah − Slovenia in Figures − Statistični letopis − Statistical Yearbook
KOMENTAR COMMENT
V primerjavi z lanskim septembrom, ko smo zabeležili 1-odstotno inflacijo,je bila rast cen v letošnjem septembru bistveno nižja. Cene življenjskihpotrebščin so bile namreč septembra v primerjavi s preteklim mesecem vpovprečju višje za 0,4 %; v prvih devetih mesecih letos pa je bila rast cen2,8-odstotna, to je za 0,2 odstotne točke več kot v enakem obdobju lani.
In contrast to September last year, when inflation stood at 1%, this yearprices grew much less. In September 2006 consumer prices were namelyup by 0.4% over the previous month, while in the first nine months of2006 they rose by 2.8% or 0.2 of a percentage point more than in thesame period last year.
Za gibanje cen v septembru je bilo značilno predvsem naraščanje cen The September 2006 increase in prices is the result of higher prices of
Statistične informacije, št. 174/2006 10 Rapid reports No 174/2006
blaga, saj je bilo to v povprečju dražje za 1 %. Med blagom se je najboljpodražilo poltrajno blago, in to za 6,3 %, blago dnevne rabe se je podražiloza 0,1 %, trajno blago pa se je celo nekoliko pocenilo (za 0,4 %). Prvič letospa so se znižale cene storitev, in sicer v povprečju za 1 %.
goods, on average by 1%. Among goods, prices of semi-durable goodsrose the most (by 6.3%), followed by non-durable goods with 0.1%, whileprices of durable goods were down by 0.4%. For the first time this year,prices of services were down (on average by 1%).
Rast cen, merjena s harmoniziranim indeksom cen življenjskihpotrebščin, je bila prav tako razmeroma nizka (0,3-odstotna); to jevplivalo tudi na 12-mesečno povprečno rast cen, merjeno z »EMUkonvergenčnim indeksom cen«, tako da se je ponovno znižala na 2,6 %.
The growth of prices measured with the harmonised index of consumerprices was relatively low at 0.3%, which resulted in the 12-month averageprice growth measured with the EMU convergence price index falling to2.6%.
Po zadnjih podatkih, tj. za avgust 2006, je konvergenčno merilo gledestopnje inflacije znašalo 2,8 %, kar pomeni, da smo bili v preteklemmesecu za 0,1 odstotne točke pod to vrednostjo.
According to the latest data for August 2006, the EMU convergencecriterion for inflation was 2.8%, which means that Slovenia was 0.1 of apercentage point below the value.
Septembra so se najbolj zvišale cene v skupinah obleka in obutev (za9,6 %), komunikacije (za 2,6 %), stanovanje (za 0,7 %), gostinske innastanitvene storitve (za 0,5 %), raznovrstno blago in storitve (0,4 %),stanovanjska oprema (0,3 %), hrana in brezalkoholne pijače ter alkoholnepijače in tobak (za 0,1 %).
In September prices increased the most in the groups clothing andfootwear (by 9.6%), communications (by 2.6%), housing, water,electricity, gas and other (by 0.7%), restaurants and hotels (by 0.5%),miscellaneous goods and services (by 0.4%), furnishing, householdequipment and maintenance (by 0.3%), and food and non-alcoholicbeverages, and alcoholic beverages and tobacco (by 0.1%).
Podobno kot v preteklih letih je bilo tudi za letošnji september značilno,da je prihod nove jesensko-zimske kolekcije v trgovine povzročilmočnejšo rast cen v skupini obleka in obutev. Oblačila so bila zaradi tegav povprečju dražja za 10,7 %, obutev pa za 8,7 %.
Similarly to previous years, in September 2006 the arrival of a new line ofclothes and footwear brought about higher prices in the group clothingand footwear. Clothing was on average 10.7% more expensive, whileprices of footwear were up by 8.7%.
Rast cen v skupini komunikacije je bila v pretežni meri posledica višjihcen telefonskih storitev, saj so se te podražile za 2,9 %.
The growth of prices in the group communications is mostly the result of2.9% higher prices of telephone services.
Rast cen v skupini stanovanje je bila v pretežni meri posledica višjih cengoriv in energije (za 1,2 %); tekoča goriva so bila dražja za 2,3 %, trdnagoriva so bila dražja za 2,8 %, podražila pa se je tudi daljinska energija,in sicer za 2 %.
Higher prices in the group housing, water, electricity, gas and other werecaused by prices of fuels and energy going up by 1.2%; liquid fuels were2.3% more expensive, while prices of solid fuels were up by 2.8% andheat energy price rose by 2%.
Višja rast cen je bila zabeležena tudi v skupini gostinske in nastanitvenestoritve (za 0,5 %); gostinske storitve so bile dražje za 0,8 %;nastanitvene storitve pa so se v povprečju celo nekoliko pocenile (za0,7 %).
Prices in the group restaurants and hotels were up by 0.5%; prices ofcatering services increased by 0.8% while prices of accommodationservices decreased on average by 0.7%.
K skupni rasti cen so višje cene oblačil in obutve prispevale 0,7 odstotnetočke, višje cene komunikacij, goriva in energija ter druge podražitve papo 0,1 odstotne točke.
Higher prices of clothing and footwear contributed 0.7 of a percentagepoint to the inflation rate, while communications, fuel and energy, andother prices added 0.1 of a percentage point each.
Znižanje cen smo v mesecu septembru zabeležili v skupinah rekreacija inkultura (za 4,2 %), izobraževanje (za 1,9 %), prevoz (za 0,8 %) in zdravje(za 0,1 %).
In September lower prices were registered in the groups recreation andculture (by 4.2%), education (by 1.9%), transport (by 0.8%) and health (by0.1%).
Na gibanje cen v skupini rekreacija in kultura so vplivale predvsem nižjecene počitnic v paketu (v povprečju za 13,3 %); na drugi strani pa so se vtej skupini kar precej podražile storitve za rekreacijo in šport (za 2,3 %).
The drop in prices in the group recreation and culture was the result oflower prices of package holidays (on average by 13.3%); on the otherhand, in this group prices of recreational and sport services were up by2.3%.
Cene v skupini izobraževanje so se znižale predvsem na račun cenejšihizobraževalnih tečajev, v tretji skupini pa so se najbolj pocenili rabljeniosebni avtomobili (za 3,5 %) in pogonska goriva (v povprečju za 1,8 %).Ob tem je potrebno dodati, da zadnja septembrska pocenitev naftnihderivatov še ni bila upoštevana.
The reason behind lower prices in the group education was lower pricesof education not definable by level, while in the group transport prices ofsecond-hand motor cars fell by 3.5% and prices of fuels by 1.8%. It has tobe emphasised that the recent September drop in oil prices has not yetbeen taken into account.
Nižje cene počitnic v paketu so znižale skupno rast cen za 0,5 odstotnetočke, cenejša pogonska goriva pa za 0,1 odstotne točke.
Lower prices of package holidays pushed the inflation rate down by 0.5 ofa percentage point, while cheaper fuels lowered the inflation by 0.1 p.p.
Nižja rast cen v mesecu septembru je vplivala tudi na občutnejši padecletne rasti cen, saj se je ta znižala na 2,5 %. Ugodnejša cenovna gibanjaso vplivala tudi na 12-mesečno povprečno rast cen; ta se je znižala za0,1 odstotne točke in zdaj znaša 2,5 %.
The lower monthly inflation rate in September resulted in a lower annualinflation rate, which fell to 2.5%. More favourable price trends influencedthe 12-month average price growth, which decreased by 0.1 of apercentage point to 2.5%.
V letu dni pa so se cene najbolj povišale v naslednjih skupinah:stanovanjska oprema za (5,2 %), gostinske in nastanitvene storitve (za4,5 %), stanovanje (za 4,1 %), hrana in brezalkoholne pijače (za 3,8 %),raznovrstno blago in storitve (za 3,7 %), alkoholne pijače in tobak (za
In one year prices grew the most in these groups: furnishing, householdequipment and maintenance (by 5.2%), restaurants and hotels (by 4.5%),housing, water, electricity, gas and other (by 4.1%), food and non-alcoholic beverages (by 3.8%), miscellaneous goods and services (by
Statistične informacije, št. 174/2006 Rapid reports No 174/2006 11
3,4 %) ter rekreacija in kultura (za 2,2 %). Za izdelke in storitve v skupinizdravje in prevoz pa velja, da so bile njihove cene v povprečju nižje kotpred enim letom – v prvi skupini za 1,3 %, v drugi pa za 0,2 %.
3.7%), alcoholic beverages and tobacco (by 3.4%) and recreation andculture (by 2.2%). Compared to a year ago, prices of goods and serviceswere lower in the groups health (by 1.3%) and transport (by 0.2%).
Sestavili / Prepared by: Vlasta Kohek, Mojca Maček Kenk Izdaja, založba in tisk Statistični urad Republike Slovenije, Ljubljana, Vožarski pot 12 - Uporaba in objava podatkov dovoljena le z navedbo vira - Odgovarja generalna direktorica mag. Irena Križman - Urednica zbirke Statistične informacije Marina Urbas - Urednica podzbirke Mojca Maček Kenk - Slovensko besedilo jezikovno uredila Ivanka Zobec - Angleško besedilo jezikovno uredil Boris Panič - Naklada 145 izvodov - ISSN zbirke Statistične informacije 1408-192X - ISSN podzbirke Cene 1408-8894 - Informacije daje Informacijsko središče, tel.: (01) 241 51 04 - El. pošta: [email protected] - http://www.stat.si.
Edited, published and printed by the Statistical Office of the Republic of Slovenia, Ljubljana, Vožarski pot 12 - These data can be used provided the source is acknowledged - Director-General Irena Križman - Rapid Reports editor Marina Urbas - Subject-matter editor Mojca Maček Kenk - Slovene language editor Ivanka Zobec - English language editor Boris Panič - Total print run 145 copies - ISSN of Rapid Reports 1408-192X - ISSN of subcollection Prices 1408-8894 - Information is given by the Information Centre of the Statistical Office of the Republic of Slovenia, tel.: +386 1 241 51 04 - E-mail: [email protected] - http://www.stat.si.