Embed Size (px)
Citation preview

8/21/2019 408-2012-Lec03 DCF2
http://slidepdf.com/reader/full/408-2012-lec03-dcf2 1/1003
• Interest – Real and Nominal
• Project Evaluation Methods
– Discounted Cash Flow
MIN E 408: Mining Enterprise Economics
Review of Economic Indicators
Resources: Any economics book
A class ic: Runge, 1998. Mining Economics and Strategy. 295 p.
Slides modified from Dr. Oy Leuangthong
Nominal And Effective Rates
• If m = # of compounding periods per year and m > 1, thenthe effective interest rate, ie > i, the interest rate percompounding period;
• the nominal interest im is given as i*m; and
• the effective interest rate ie is given by
(1 ) 1
m
e
i i
8/21/2019 408-2012-Lec03 DCF2
http://slidepdf.com/reader/full/408-2012-lec03-dcf2 2/1003
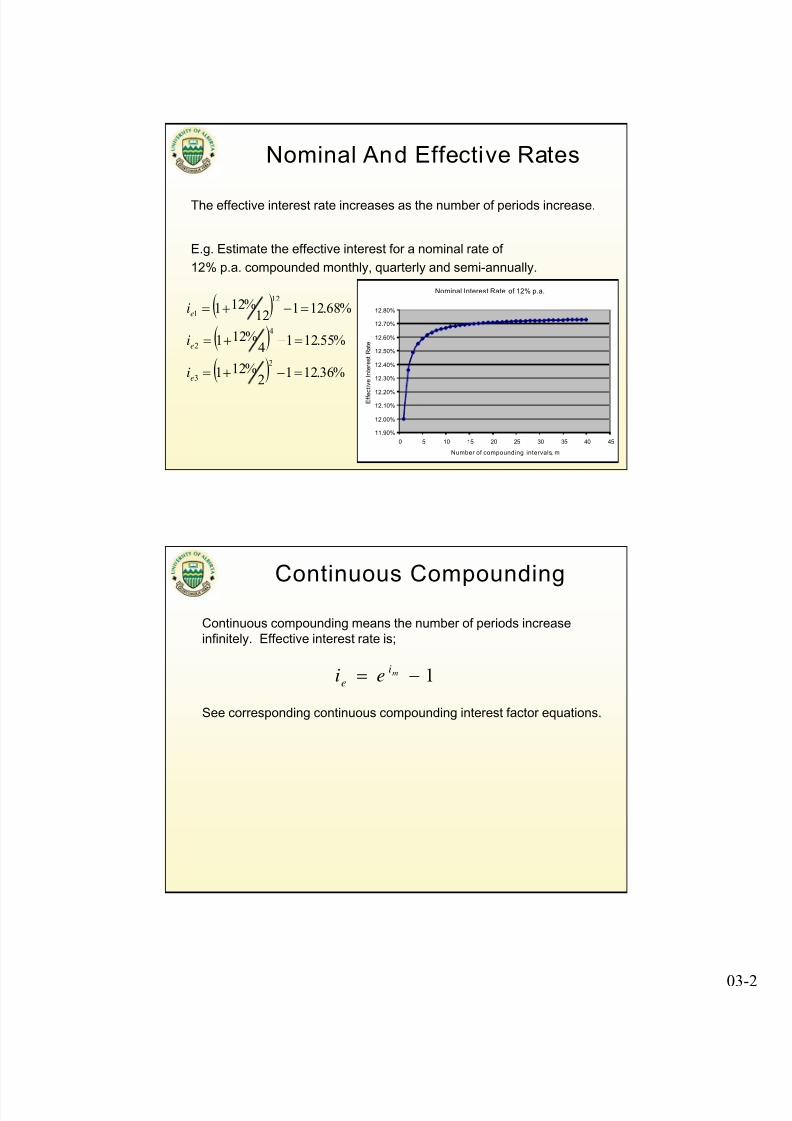
The effective interest rate increases as the number of periods increase.
E.g. Estimate the effective interest for a nominal rate of
12% p.a. compounded monthly, quarterly and semi-annually.
Nominal And Effective Rates
%36.1212
%121
%55.1214
%121
%68.12112
%121
2
3
4
2
12
1
e
e
e
i
i
i
Nominal Interest Rate of 12% p.a.
11.90%
12.00%
12.10%
12.20%
12.30%
12.40%
12.50%
12.60%
12.70%
12.80%
0 5 10 15 20 25 30 35 40 45
Number of compounding intervals, m
E f f e c t i v e I n t e r e s t R a t e
Continuous Compounding
Continuous compounding means the number of periods increaseinfinitely. Effective interest rate is;
See corresponding continuous compounding interest factor equations.
1mi
ei e
8/21/2019 408-2012-Lec03 DCF2
http://slidepdf.com/reader/full/408-2012-lec03-dcf2 3/1003
Interest Rate Formulae For ContinuousCompounding With Discrete Payments
• Finding F when P is Given:-
The future value can be calculated;
• Using daily compounding (365 days):
• Using monthly compounding:
• Using annual compoundi ng
/ , ,mi n
mF Pe P F P i n
(365)m
i nF Pe
(12)m
i nF Pe
mi n
F Pe
Fundamental Economic Indicators
• Interest rates
– Cost of borrow ed money
– Determined by suppl y of and demand for money and
– Inflationary rates
• Inflation and escalation
– Decline in the value of money measured by its purchasing pow er.
– Weighted average price escalation rate for various sectors of theeconomy.

8/21/2019 408-2012-Lec03 DCF2
http://slidepdf.com/reader/full/408-2012-lec03-dcf2 4/1003
• Real interest rates
– Nominal interest rate adjusted for inf lation.
If a bank pays 10% (nominal) on deposits
$1000 deposited wil l yield $1100 in a year
If liter of gas cost $1 → $1000 will purchase 1000 liters today
Suppose inflati on rate is 6% after a year
Liter of gas will cost $1.06
The purchasing power of $1100 is in a year 1100/1.06=1,038 liters
Real return on $1000 = 3.8%
Fundamental Economic Indicators
• Real Interest rate
1 Nominal interest rateReal interest rate 1
1 Inflation rate
approximated byReal interest rate Nominal rate - inflation
Fundamental Economic Indicators

8/21/2019 408-2012-Lec03 DCF2
http://slidepdf.com/reader/full/408-2012-lec03-dcf2 5/1003
• Cash flow and Inflation
Like interest rates cash flows can be expressed in either real or nominalterms.
Nominal if actual/current dollars to be received is used.
Real if cash flows are deflated –expressed in terms of current dollar.
Example
Gas price is 50¢ per liter today. Expect prices to appreciate by 4% p.a. forthe next five years. If inflation is 6% p.a. Calculate the nominal and realfuel cost per year if your annual demand is 2 million liters. Determine the
PV of your costs if nominal discount rate is 12%.
Fundamental Economic Indicators
Cash flow and Inflation
Year Nominalcost/liter
Realcost/liter
Nominal cost(m$)
Real cost(m$)
0 0.50 0.50 1.00 1.00
1 0.52 0.49 1.04 0.98
2 0.54 0.48 1.08 0.96
3 0.56 0.47 1.12 0.94
4 0.58 0.46 1.17 0.93
5 0.61 0.45 1.22 0.91
Fundamental Economic Indicators

8/21/2019 408-2012-Lec03 DCF2
http://slidepdf.com/reader/full/408-2012-lec03-dcf2 6/1003
• Real discount rate = 1.12/1.06 – 1= 5.66%
Year Nominalcost (m$)
Realcost(m$)
PV ofNominalCost(m$)
PV of RealCost(m$)
0 1.00 1.00 1 1
1 1.04 0.98 0.93 0.93
2 1.08 0.96 0.86 0.86
3 1.12 0.94 0.80 0.80
4 1.17 0.93 0.74 0.74
5 1.22 0.91 0.69 0.69
PV 5.03 5.03
Nominal cash
flows are
discounted with
nominal discount
rate and real
cash flows are
discounted with
real rates.
Discounting- Real or Nominal interest rate?
Project Evaluation Methods

8/21/2019 408-2012-Lec03 DCF2
http://slidepdf.com/reader/full/408-2012-lec03-dcf2 7/1003
1. Discounted Cash Flow (DCF):Cash flow discounted at an investor arbitrarily selected discount rate
– Net Present Value (NPV).
– Internal Rate Of Return (IRR).
– Profitability Index Or Benefit Cost Ratio.
– Payback And Discounted Payback Period.
2. Capital Asset Pricing Method (CAPM):
Discount rate quantitatively modeled using the beta of a security or project withcomparable risk as project.
3. Option Pricing Method:
Uses Portfolio replication to duplicate the project as consisting of certain basicassets that are risk free. The resulting portfolio of assets must have a returnequal to the risk f ree rate.
Project Evaluation Methods
NET PRESENT VALUE (NPV)
• Decision Criteria - Take project if NPV>0
Example
• XYZ Resources is considering an expansion project; immediate cost is$120,000
• Project would increase cash flows by $15,000 per year for 10 years(starting next year)
• Residual salvage value: $48,000
• Should XYZ take project if discount rate = 10%?
returnof rate-
11
0
RRR
RRR
CF I NPV
T
t
t
t
Investment Decision Criteria

8/21/2019 408-2012-Lec03 DCF2
http://slidepdf.com/reader/full/408-2012-lec03-dcf2 8/1003
Investment Decision Criteria: NPV
• Take project if PI > 1.
0
0
0
1
0
PV
I
PV I
PV I
0
(Cash inflow)
(Cash Outflow)
PV PI
I
Investment Decision Criteria:
PROFITABILTY INDEX (Benefit Cost ratio)
0 NPV
IRR – internal rate of return, NPV = 0• Solve for simple eqn’s• Guess and test• Goal seek in Excel

8/21/2019 408-2012-Lec03 DCF2
http://slidepdf.com/reader/full/408-2012-lec03-dcf2 9/1003
• For any given project the NPV method and the PI will provide thesame accept/ reject decision
• Mutually exclusive projects ??
• Scale issue
50200NPV
50300PV of cash outflow (m$)
100500PV of Cash Inflow (m$)
Project BProject A
PI 1.67 2.0
Investment Decision Criteria:PROFITABILTY INDEX (Benefit Cost ratio)
• What happens to the remaining $400m if p roject B i s accepted?
• If there is a project C , PI of A compared with the composite PI ofB and C
• Capital rationing – firm has capital constraints
– There is ranking of projects
• PI may be used for ranking - Requires smaller projects to exactlyuse up budget else
• Consider NPV of all feasible combinations of projects with in thebudget.
Investment Decision Criteria:
PROFITABILTY INDEX (Benefit Cost ratio)

8/21/2019 408-2012-Lec03 DCF2
http://slidepdf.com/reader/full/408-2012-lec03-dcf2 10/1003-
Review Of Main Points
• Discounted Cash Flow (DCF) is one of the mostcommon approaches to project evaluation
• Various measures that are used for decision making: – Net Present Value (NPV)
• If NPV > 0, then project will provide benefit
– Profitability Index (PI) or Benefit Cost Ratio
• If PI > 1.0, then NPV > 0
• Can be used to rank projects
• Higher PI, higher the return per dollar on investment


![Lec03-1 : Classification Abstraction...nattapong songneam] การพัฒนาระบบ • เมื่อได รับมอบหมาย จาก หน วยงาน](https://img.pdfslide.tips/doc/110x75/5fbbf829d93b85003a107bfa/lec03-1-classification-abstraction-nattapong-songneam-aaaaaaaaaaaa.jpg)