Embed Size (px)
DESCRIPTION
Line Plots, Frequency Tables, and Histograms. 6-5. Course 1. Warm Up. Problem of the Day. Lesson Presentation. Warm Up Create a bar graph of the data. Favorite rides at fair: Ferris wheel = 5, loop the loop = 4, merry-go-round = 3, bumper cars = 7, sit and spin = 9. - PowerPoint PPT Presentation
Citation preview
Course 1
6-5Line Plots, Frequency Tables, and Histograms6-5
Line Plots, Frequency Tables, and Histograms
Course 1
Warm UpWarm Up
Lesson PresentationLesson Presentation
Problem of the DayProblem of the Day

Course 1
6-5Line Plots, Frequency Tables, and Histograms
Warm UpCreate a bar graph of the data.
Favorite rides at fair:Ferris wheel = 5, loop the loop = 4, merry-go-round = 3, bumper cars = 7, sit and spin = 9
Favorite Rides at Fair
0
2
4
6
8
10
Ferris Wheel Loop the loop Merry-go-round
Bumper cars Sit and spin
Course 1
6-5Line Plots, Frequency Tables, and Histograms
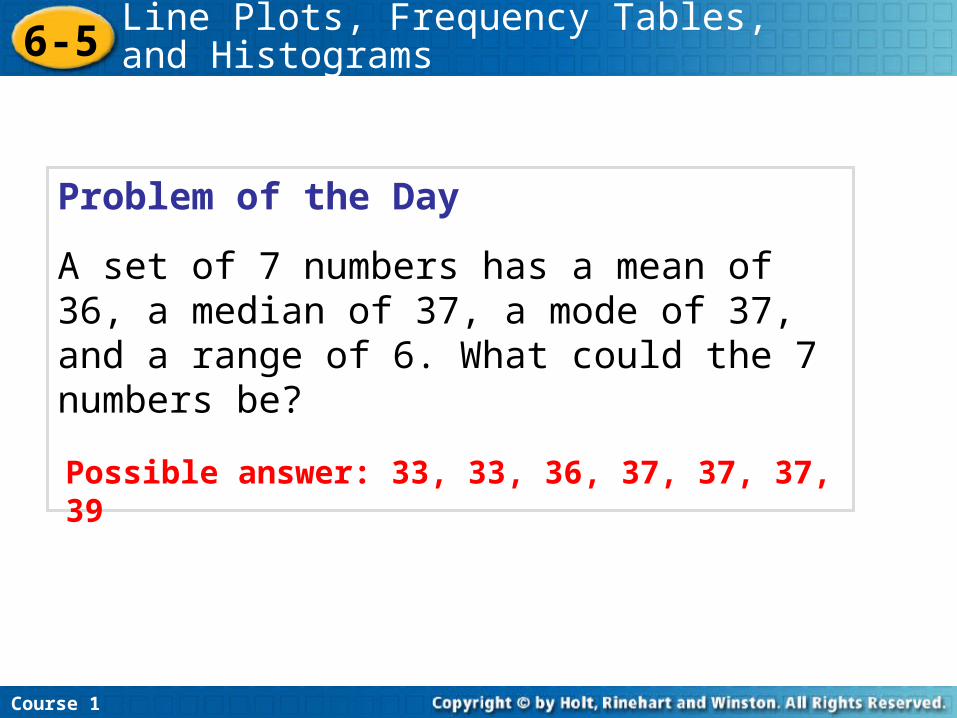
Problem of the Day
A set of 7 numbers has a mean of 36, a median of 37, a mode of 37, and a range of 6. What could the 7 numbers be?
Possible answer: 33, 33, 36, 37, 37, 37, 39
Course 1
6-5Line Plots, Frequency Tables, and Histograms
Learn to organize data in line plots, frequency tables and histograms.
Course 1
6-5Line Plots, Frequency Tables, and Histograms
Vocabulary
line plot
frequency table
histogram

Course 1
6-5Line Plots, Frequency Tables, and HistogramsAdditional Example 1: Making a Tally Table
Students in Mr. Ray’s class recorded their fingerprint patterns. Which type of pattern do most students in Mr. Ray’s class have?
whorl loop whorl loop
arch arch loop whorl
loop arch whorl arch
arch whorl arch loop
Make a tally table to organize the data.

Course 1
6-5Line Plots, Frequency Tables, and Histograms
A group of four tally marks with a line through it means five. t llll = 5 llll llll = 10
Reading Math

Course 1
6-5Line Plots, Frequency Tables, and Histograms
Additional Example 1 Continued
Students in Mr. Ray’s class recorded their fingerprint patterns. Which type of pattern do more students in Mr. Ray’s class have?
whorl loop whorl loop
arch arch loop whorl
loop arch whorl arch
arch whorl arch loop
Step 1: Make a column for each fingerprint pattern.
Step 2: For each fingerprint, make a tally mark in the appropriate column.
Number of Fingerprint Patterns
Whorl Arch Loop
l l l l l l l l l l l l l
Most students in Mr. Ray’s class have an arch fingerprint.

Course 1
6-5Line Plots, Frequency Tables, and Histograms
Check It Out: Example 1
Students in Ms. Gracie’s class recorded their fingerprint patterns. Which type of pattern do more students in Ms. Gracie’s class have?
Make a tally table to organize the data.
whorl loop whorl loop
arch whorl loop whorl
loop whorl whorl arch
arch whorl arch loop

Course 1
6-5Line Plots, Frequency Tables, and Histograms
Check It Out: Example 1 Continued
Students in Ms. Gracie’s class recorded their fingerprint patterns. Which type of pattern do more students in Ms. Gracie’s class have?
Step 1: Make a column for each fingerprint pattern.
whorl loop whorl loop
arch whorl loop whorl
loop whorl whorl arch
arch whorl arch loop
Step 2: For each fingerprint, make a tally mark in the appropriate column.
Number of Fingerprint Patterns
Whorl Arch Loop
l l l l l l l l l l l l l l
Most students in Ms. Gracie’s class have a whorl fingerprint.

Course 1
6-5Line Plots, Frequency Tables, and Histograms
A line plot uses a number line and x’s or other symbols to show frequencies of values.

Course 1
6-5Line Plots, Frequency Tables, and Histograms
Additional Example 2: Making a Line Plot
Step 1: Draw a number line.
Step 2: For each tennis ball, use an x on the number line to represent how many were collected.
Students collected tennis balls for a project. The number of balls collected by the students is recorded in the table. Make a line plot of the data.
Tennis Balls Collected
10 14 11 16 11 10
14 10 15 15 10 11
x x x x
5 6 7 8 9 10 11 12 13 14 15 16
x x x
x x
x x x
Course 1
6-5Line Plots, Frequency Tables, and Histograms
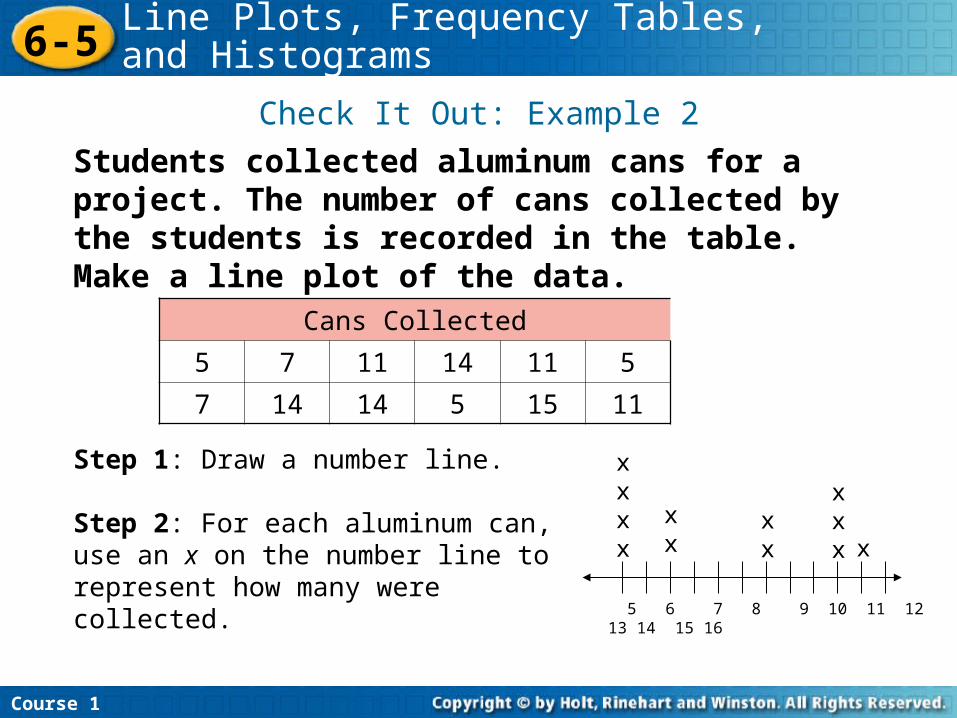
Check It Out: Example 2
Step 1: Draw a number line.
Step 2: For each aluminum can, use an x on the number line to represent how many were collected.
Students collected aluminum cans for a project. The number of cans collected by the students is recorded in the table. Make a line plot of the data.
Cans Collected
5 7 11 14 11 5
7 14 14 5 15 11
x x x x
5 6 7 8 9 10 11 12 13 14 15 16
x x
x x
x x x x
Course 1
6-5Line Plots, Frequency Tables, and Histograms
A frequency table tells the number of times an event, category, or group occurs.

Course 1
6-5Line Plots, Frequency Tables, and Histograms
Additional Example 3: Making a Frequency Table with Intervals
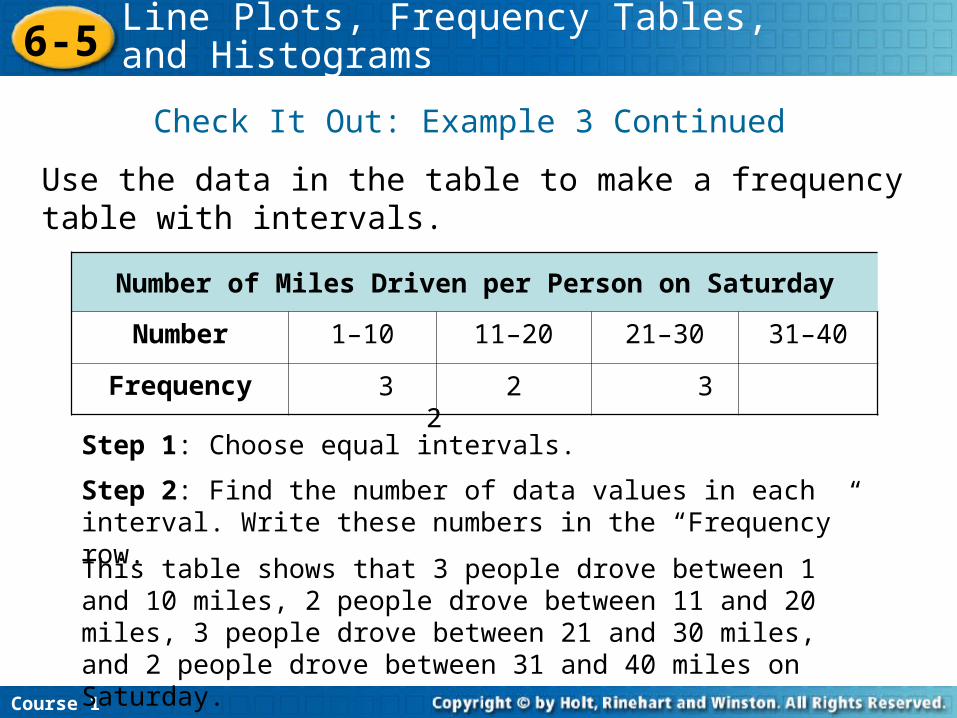
Use the data in the table to make a frequency table with intervals.
Pages Read per Student Last Weekend
12 15 40 19 7
5 22 34 37 18

Course 1
6-5Line Plots, Frequency Tables, and Histograms
Additional Example 3 Continued
Use the data in the table to make a frequency table with intervals
Pages Read per Student Last Weekend
Number 1–10 11–20 21–30 31–40
Frequency
This table shows that 2 students read between 1 and 10 pages, 4 students read between 11 and 20 pages, 1 person read between 21 and 30 pages, and 3 people read between 31 and 40 pages last weekend.
2 4 1 3
Step 1: Choose equal intervals.
Step 2: Find the number of data values in each interval. Write these numbers in the “Frequency” row.

Course 1
6-5Line Plots, Frequency Tables, and Histograms
Check It Out: Example 3
Use the data in the table to make a frequency table with intervals.
Number of Miles Driven per Person on Saturday
17 29 9 19 7
5 27 34 21 38
Course 1
6-5Line Plots, Frequency Tables, and Histograms
Check It Out: Example 3 Continued
Use the data in the table to make a frequency table with intervals.
Number of Miles Driven per Person on Saturday
Number 1–10 11–20 21–30 31–40
Frequency
This table shows that 3 people drove between 1 and 10 miles, 2 people drove between 11 and 20 miles, 3 people drove between 21 and 30 miles, and 2 people drove between 31 and 40 miles on Saturday.
3 2 3 2
Step 1: Choose equal intervals.
Step 2: Find the number of data values in each interval. Write these numbers in the “Frequency” row.
Course 1
6-5Line Plots, Frequency Tables, and Histograms
A histogram is a bar graph that shows the number of data items that occur within each interval.

Course 1
6-5Line Plots, Frequency Tables, and Histograms
Additional Example 4: Making a Histogram
Use the frequency table in Additional Example 3 to make a histogram.
Step 1: Choose an appropriate scale and interval.
Step 2: Draw a bar for the number of students in each interval. The bars should touch but not overlap.
Step 3: Title the graph and label the axes.

Course 1
6-5Line Plots, Frequency Tables, and Histograms
Check It Out: Example 4
Use the frequency table in Check It Out: Example 3 to make a histogram.
Step 1: Choose an appropriate scale and interval.
Step 2: Draw a bar for the number of students in each interval. The bars should touch but not overlap.
Step 3: Title the graph and label the axes.
0
1
2
3
4
1- 10 11- 20 21- 30 31- 40
Number of Pages Read per Student Last Weekend
Number of Pages
Stu
den
ts
Course 1
6-5Line Plots, Frequency Tables, and Histograms
Lesson Quiz: Part I
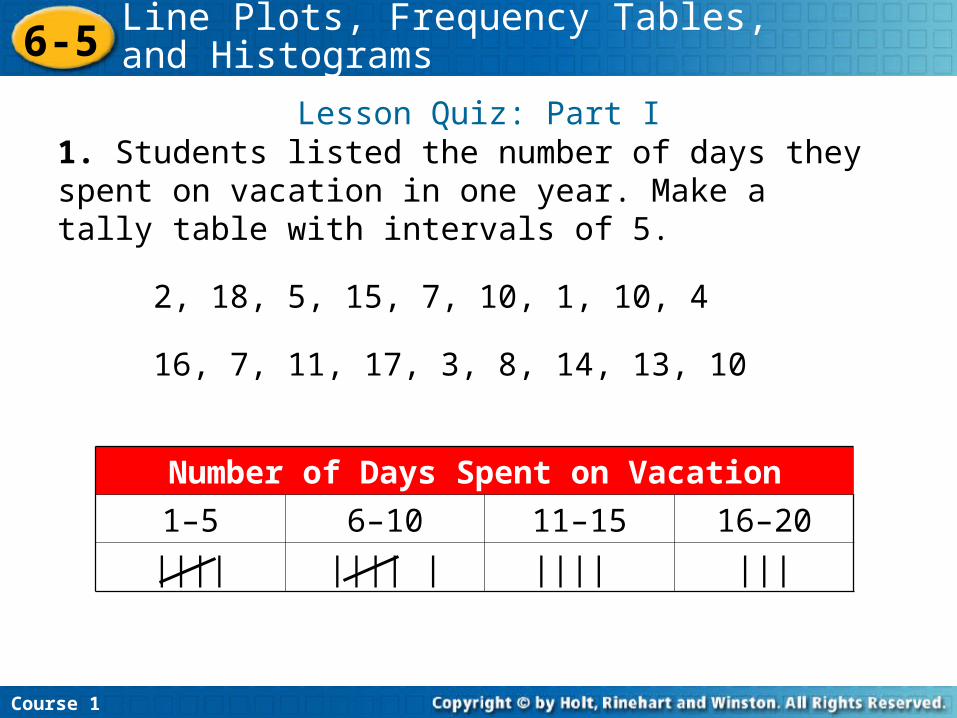
1. Students listed the number of days they spent on vacation in one year. Make a tally table with intervals of 5.
2, 18, 5, 15, 7, 10, 1, 10, 4
16, 7, 11, 17, 3, 8, 14, 13, 10
Number of Days Spent on Vacation
1–5 6–10 11–15 16–20
|||| |||| | |||| |||
Course 1
6-5Line Plots, Frequency Tables, and Histograms
Lesson Quiz: Part II
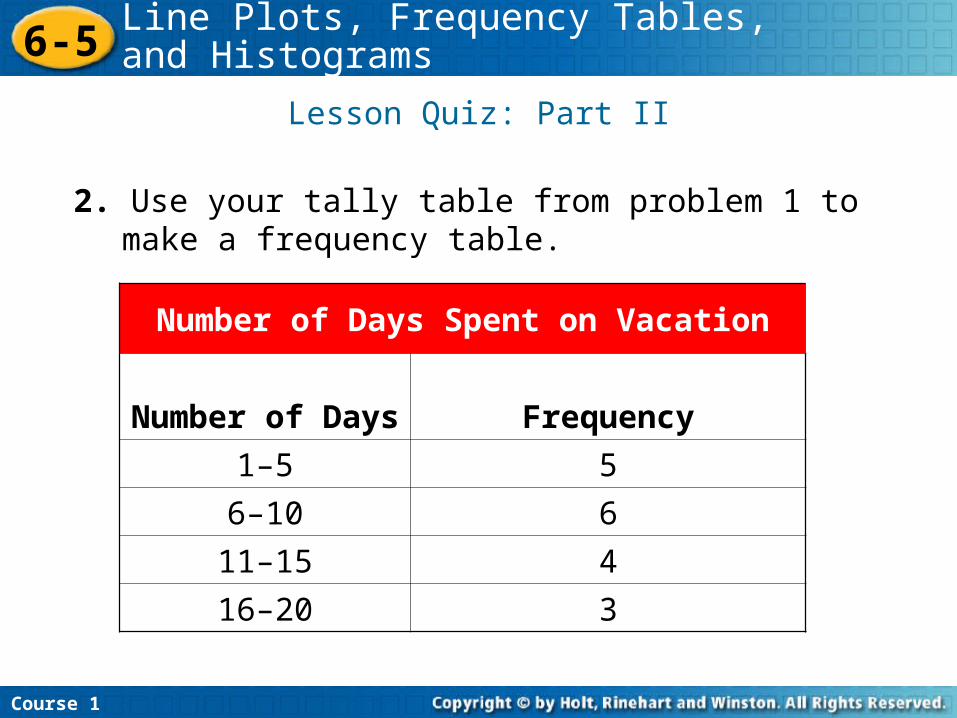
2. Use your tally table from problem 1 to make a frequency table.
Number of Days Spent on Vacation
Number of Days Frequency
1–5 5
6–10 6
11–15 4
16–20 3


![COB80 - PATLITE...¢xSl 7pw] 0 S&MMh` bs{S]z C «Ìt UsM Ôùx º æ ¢s`p ZYMh` b{( º æ ¢ 6/ $ 5 6/ $ 5 6/ $ 6- 6/ $ 6- 6/ $ 5 6/ $ 5 6/ $ 6- 6/ $ 6- 6/ $ 5 6/ $ 5 6/ $ 6- 6/ $](https://img.pdfslide.tips/doc/110x75/613905f5a4cdb41a985b700b/cob80-patlite-xsl-7pw-0-smmh-bssz-c-oet-usm-x-sp.jpg)