Embed Size (px)
DESCRIPTION
dfgdgdgfg
Citation preview
Annex 7.6
Able Marine Energy Park
Dredging Strategy
(Able UK)

ENVIRONMENTAL RESOURCES MANAGEMENT ABLE UK LTD.
X.X1
ABLE MARINE ENERGY PARK
DREDGING STRATEGY
APRIL 2011
Able UK Ltd Able House,
Billingham Reach Industrial Estate, Teesside TS23 1PX
Tel: 01642 806080 Fax: 01642 655655
ABLE MARINE ENERGY PARK
DREDGING STRATEGY APRIL 2011
RC.JD.AMEP.E.D11/0016 Page 2 of 19
APPROVAL & REVISION REGISTER
Originator: R. Cram Checked: J. Dawes Approved: R. Cram
Revision Comments Date
A Issued for comment and inclusion in Annex 7 of AMEP ES 19/04/2011
B Revised dredging quantities in Berthing Pocket 14/06/2011
C Revised in light of Harbour Master comments (30/06/11) 26/07/2011
D Additional testing results added & quantities revised 12/10/2011
E Amended as per MMO comments (23/11/2011) 24/11/2011
CONTENTS
1 INTRODUCTION .................................................................................. 4
1.1 General ................................................................................................ 4
2 DESCRIPTION OF THE SITE ................................................................. 4
2.1 Existing Bathymetry ............................................................................... 4
2.2 Published Geology.................................................................................. 4
2.3 Site Investigation .................................................................................. 5
3 DREDGE VOLUMES .............................................................................. 5
3.1 Introduction .......................................................................................... 5
3.2 Turning Area ......................................................................................... 5
3.3 Approach Channel .................................................................................. 5
3.4 Berthing Pocket ..................................................................................... 6
3.5 Reclamation Area ................................................................................... 6
4 GEOTECHNICAL CHARACTERISATION OF ARISINGS ........................... 6
4.1 Introduction .......................................................................................... 6
4.2 Alluvium and Soft Clays .......................................................................... 6
4.3 Silty and Gravelly Sands ......................................................................... 7
4.4 Glacial Till ............................................................................................. 7
4.5 Material Type and Dredging Plant ............................................................ 8
5 CHEMICAL CHARACTERISATION OF ARISINGS ................................... 9
6 DISPOSAL SITES ................................................................................. 9
6.1 General ................................................................................................ 9
6.2 Erodible Materials .................................................................................. 9
6.3 Non-erodible Materials ........................................................................... 10
6.4 Dredging Plant and Programme .............................................................. 10
6.5 Maintenance Dredging ........................................................................... 10
6.6 Impacts on Existing and Future Maintenance Dredging Requirements .......... 11
7 IN-COMBINATION PROJECTS ............................................................ 12
7.1 General ............................................................................................... 12
7.2 Quay 2005 ........................................................................................... 12
7.3 Immingham Oil Terminal (IOT) Approach Channel Deepening..................... 12
7.4 Grimsby Ro-Ro ..................................................................................... 12
7.5 Hull Riverside Bulk Terminal ................................................................... 13
7.6 Green Port Hull ..................................................................................... 13
7.7 Summary............................................................................................. 13
8 REFERENCES ..................................................................................... 13
ABLE MARINE ENERGY PARK
DREDGING STRATEGY APRIL 2011
RC.JD.AMEP.E.D11/0016 Page 3 of 15
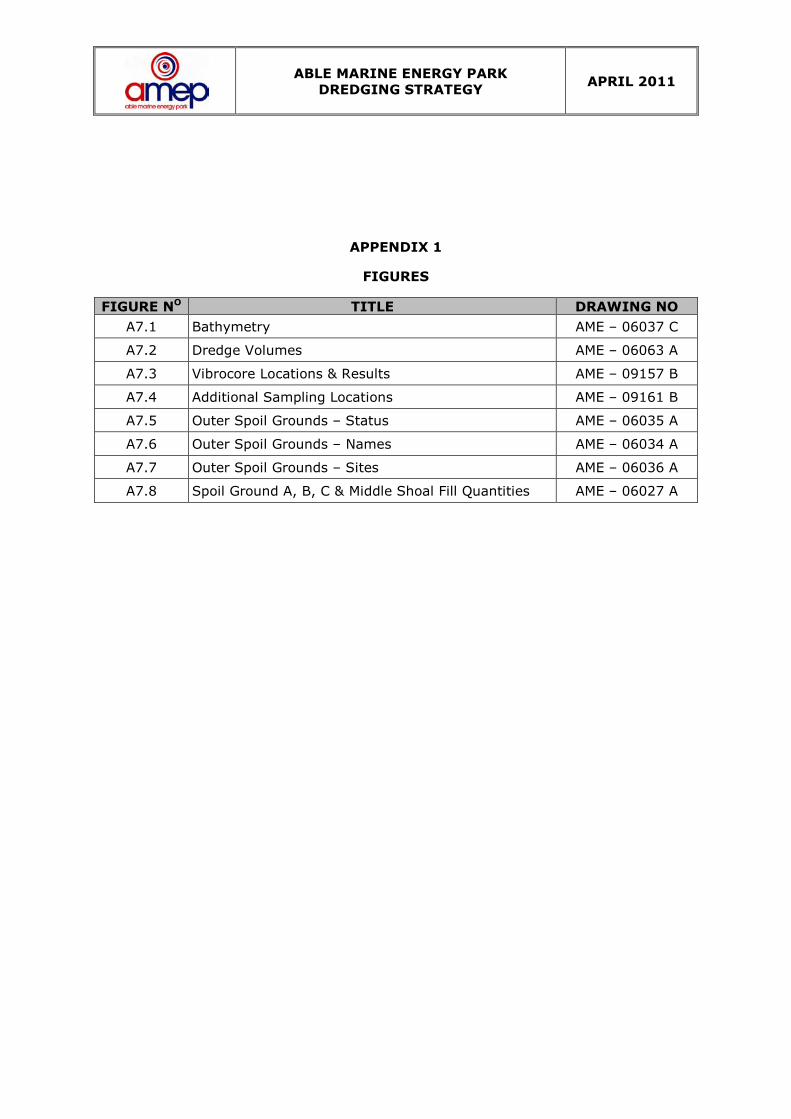
APPENDICES
APPENDIX 1 – FIGURES
FIGURE NO TITLE DRAWING NO
A7.1 Bathymetry AME – 06037 C
A7.2 Dredge Volumes AME – 06063 A
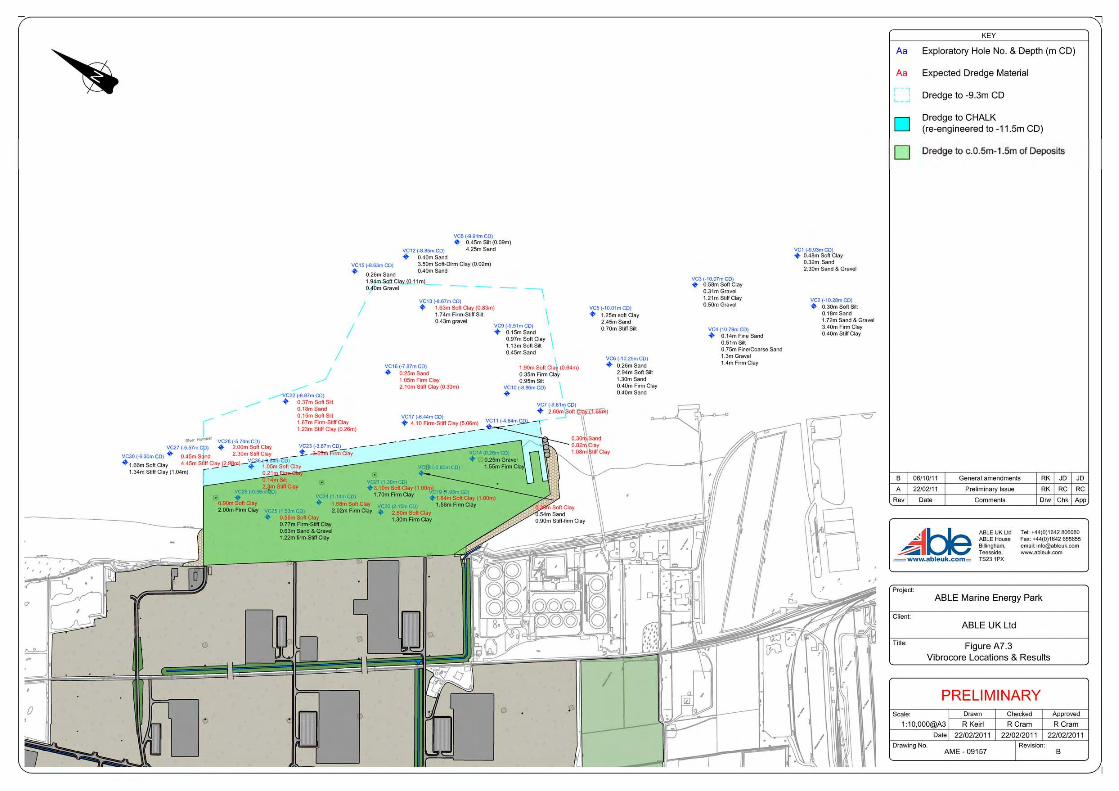
A7.3 Vibrocore Locations & Results AME – 09157 B
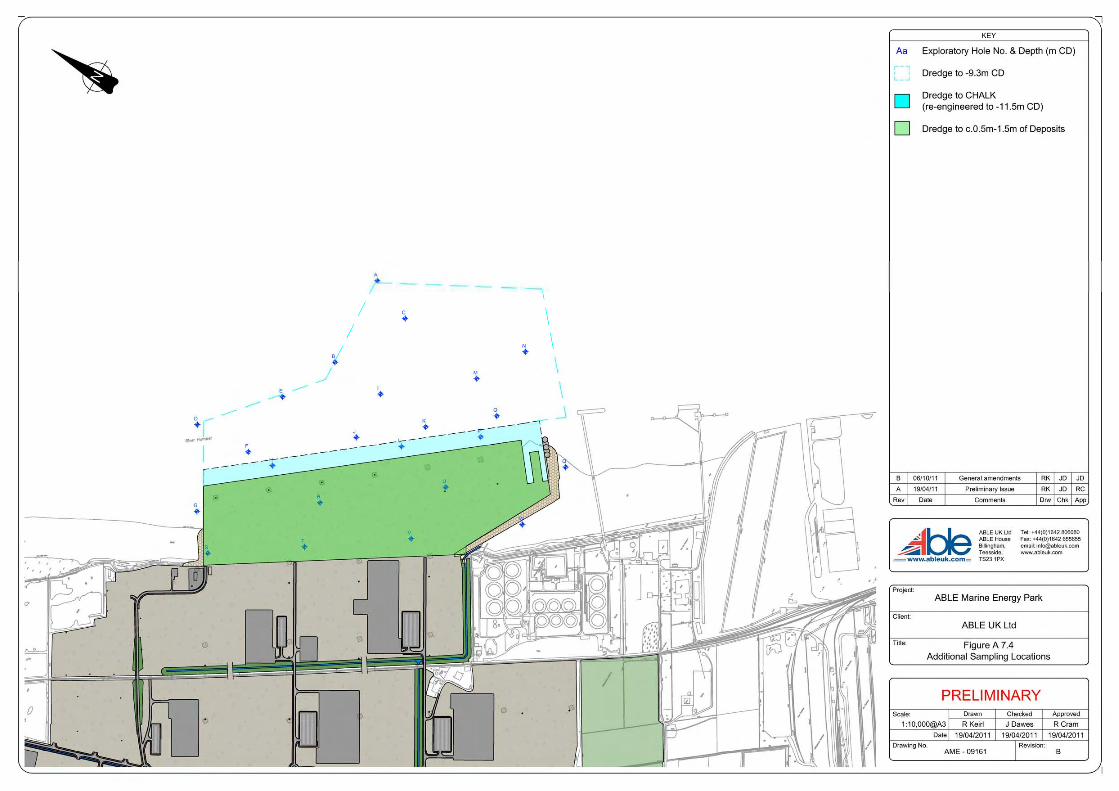
A7.4 Additional Sampling Locations AME – 09161 B
A7.5 Outer Spoil Grounds – Status AME – 06035 A
A7.6 Outer Spoil Grounds – Names AME – 06034 A
A7.7 Outer Spoil Grounds – Sites AME – 06036 A
A7.8 Spoil Ground A, B, C & Middle Shoal Fill Quantities AME – 06027 A
APPENDIX 2 – DREDGE METHODOLOGY
APPENDIX 3 – SWEEPING AND PLOUGHING (Outfall Maintenance Dredging)
APPENDIX 4 – CEFAS RESULTS
APPENDIX 5 – MARINE MANAGEMENT ORGANISATION CORRESPONDENCE
ABLE MARINE ENERGY PARK
DREDGING STRATEGY APRIL 2011
RC.JD.AMEP.E.D11/0016 Page 4 of 15
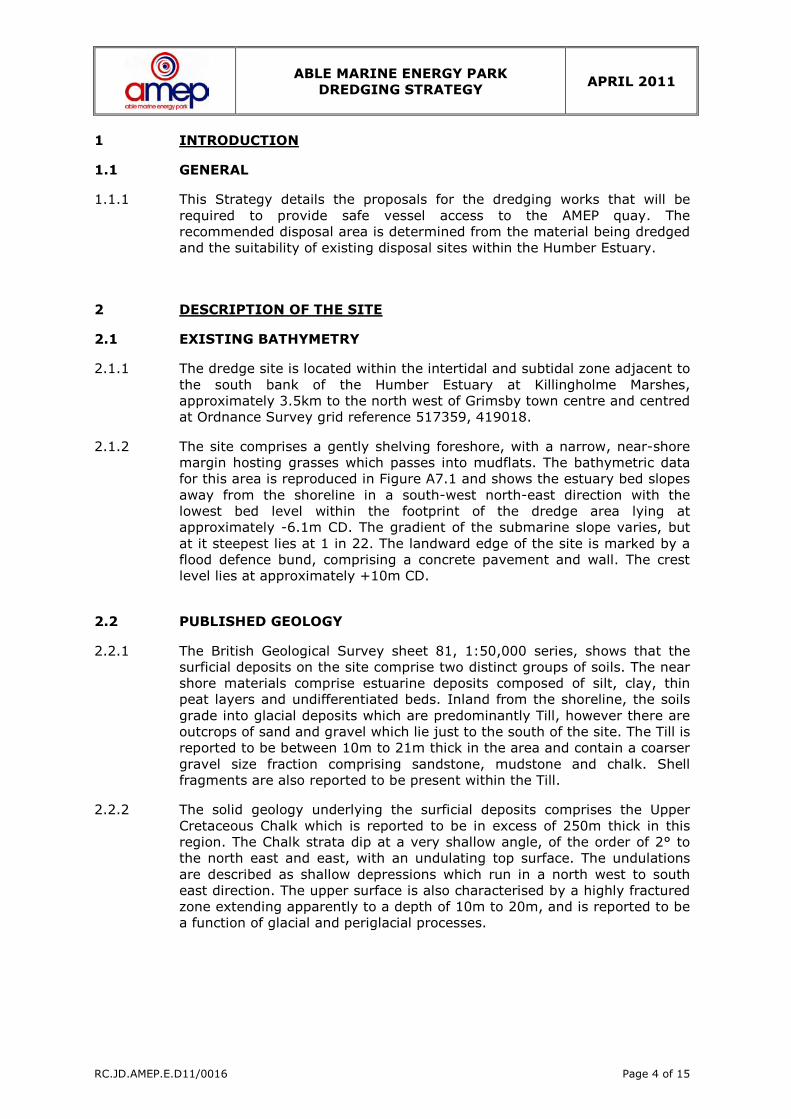
1 INTRODUCTION
1.1 GENERAL
1.1.1 This Strategy details the proposals for the dredging works that will be
required to provide safe vessel access to the AMEP quay. The
recommended disposal area is determined from the material being dredged
and the suitability of existing disposal sites within the Humber Estuary.
2 DESCRIPTION OF THE SITE
2.1 EXISTING BATHYMETRY
2.1.1 The dredge site is located within the intertidal and subtidal zone adjacent to
the south bank of the Humber Estuary at Killingholme Marshes,
approximately 3.5km to the north west of Grimsby town centre and centred
at Ordnance Survey grid reference 517359, 419018.
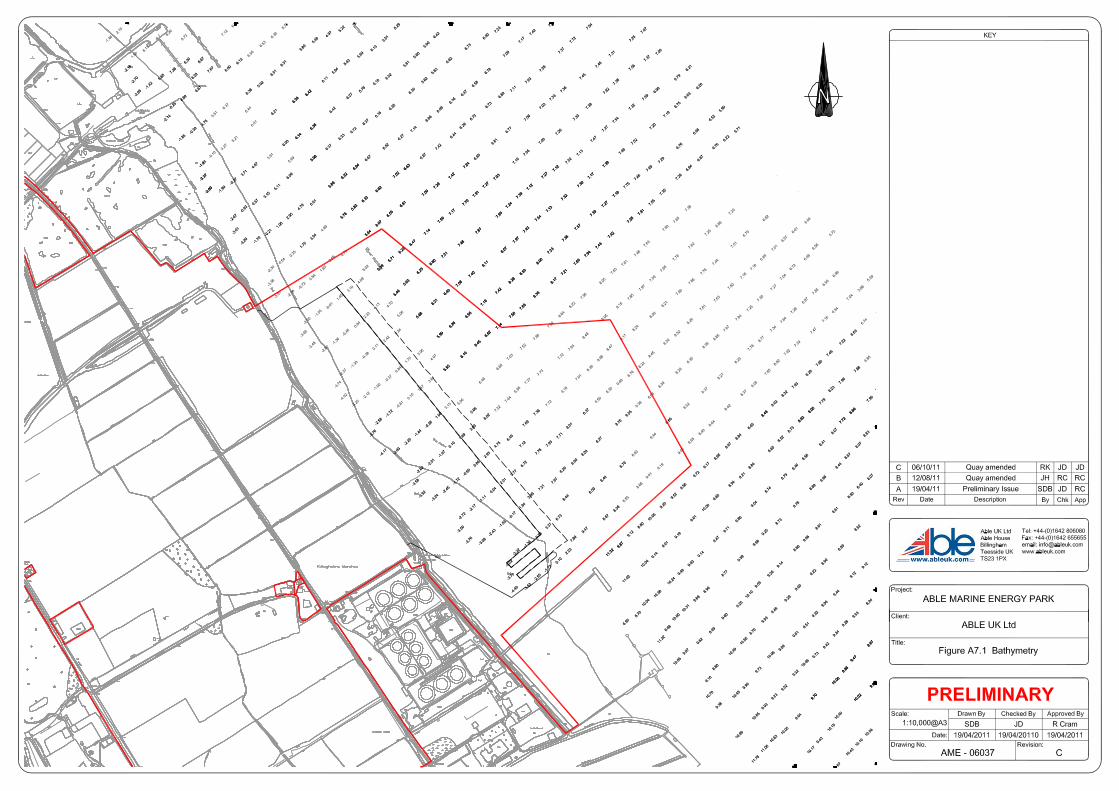
2.1.2 The site comprises a gently shelving foreshore, with a narrow, near-shore
margin hosting grasses which passes into mudflats. The bathymetric data
for this area is reproduced in Figure A7.1 and shows the estuary bed slopes
away from the shoreline in a south-west north-east direction with the
lowest bed level within the footprint of the dredge area lying at
approximately -6.1m CD. The gradient of the submarine slope varies, but
at it steepest lies at 1 in 22. The landward edge of the site is marked by a
flood defence bund, comprising a concrete pavement and wall. The crest
level lies at approximately +10m CD.
2.2 PUBLISHED GEOLOGY
2.2.1 The British Geological Survey sheet 81, 1:50,000 series, shows that the
surficial deposits on the site comprise two distinct groups of soils. The near
shore materials comprise estuarine deposits composed of silt, clay, thin
peat layers and undifferentiated beds. Inland from the shoreline, the soils
grade into glacial deposits which are predominantly Till, however there are
outcrops of sand and gravel which lie just to the south of the site. The Till is
reported to be between 10m to 21m thick in the area and contain a coarser
gravel size fraction comprising sandstone, mudstone and chalk. Shell
fragments are also reported to be present within the Till.
2.2.2 The solid geology underlying the surficial deposits comprises the Upper
Cretaceous Chalk which is reported to be in excess of 250m thick in this
region. The Chalk strata dip at a very shallow angle, of the order of 2° to
the north east and east, with an undulating top surface. The undulations
are described as shallow depressions which run in a north west to south
east direction. The upper surface is also characterised by a highly fractured
zone extending apparently to a depth of 10m to 20m, and is reported to be
a function of glacial and periglacial processes.
ABLE MARINE ENERGY PARK
DREDGING STRATEGY APRIL 2011
RC.JD.AMEP.E.D11/0016 Page 5 of 15
2.3 SITE INVESTIGATION
2.3.1 A ground investigation was undertaken by Soil Engineering Ltd (part of the
Technology Division of VINCI Construction UK Limited) between 15th June
and 15th July 2010. The scope of works was defined by Buro Happold. The
work was concentrated on the offshore section of the site and comprised
the following work:
• 30 No vibrocores
• Bathymetric Survey
• Magnetometer Survey
• Unexploded Ordnance Desk Study
2.3.2 The results of the investigation are reported in the factual ground
investigation report by Soil Engineering, included in Appendix 7.5 of the ES.
2.3.3 At the request of the Marine Management Organisation (MMO), Able UK
arranged for samples of the estuary bed and mudflats (between 0.5 to 3m
depth) within the proposed dredging area to be collected for CEFAS
analysis. Samples were collected via vibrocores in May 2011. Results are
discussed in Section 5 of this report and presented in Appendix 4.
3 DREDGE VOLUMES
3.1 INTRODUCTION
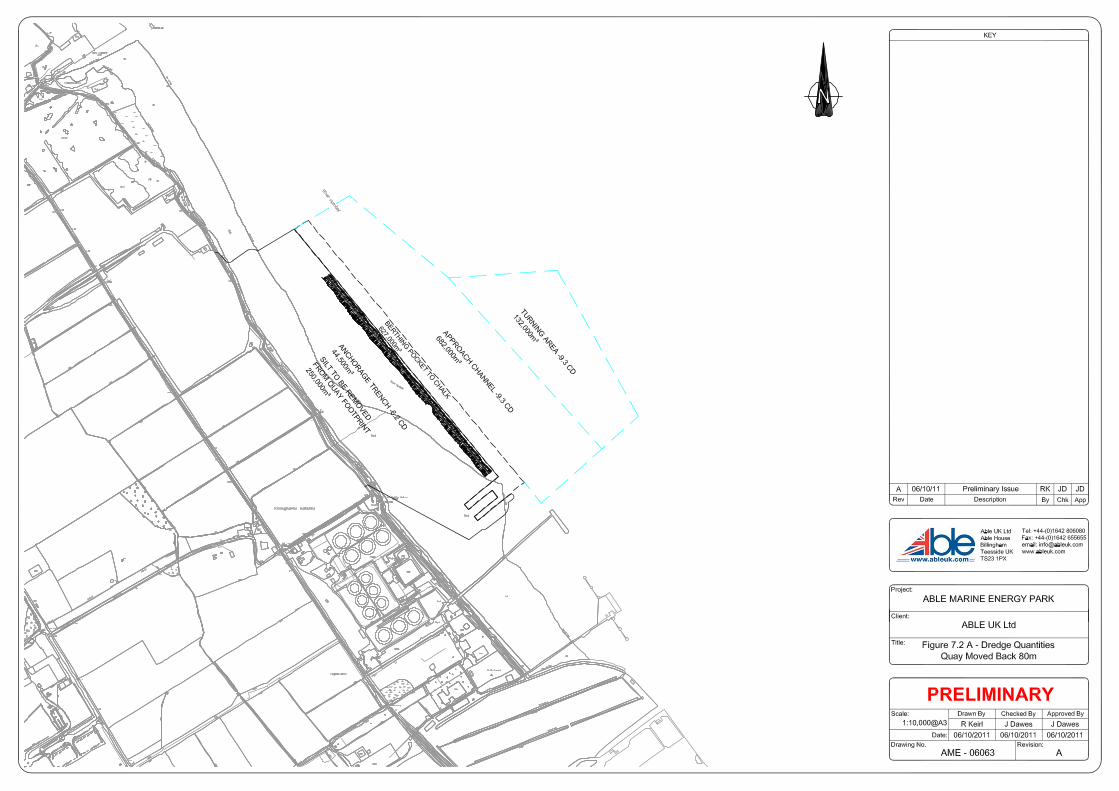
3.1.1 The proposed dredge depths and anticipated arisings are shown in Figure
A7.2. This section details the volumes expected to be dredged from four
defined areas:
• Turning Area; • Approach Channel;
• Berthing Pocket; and
• Reclamation Area
3.2 TURNING AREA
3.2.1 The turning area is located close to the Humber deep water channel and is
to be dredged to a maintained depth of -9.0m CD; with an initial over-
dredge of 300mm. To the south, the existing bathymetry is between -8.8 to
-9.7m CD; over the northern section the ground rises to around -7.0m CD.
3.2.2 A total of 132,000m3 of spoil will be removed from this location.
3.3 APPROACH CHANNEL
3.3.1 This area is to be dredged to a maintained depth of -9.0m CD; with an
initial over-dredge of 300mm. To the south, the existing bathymetry is
between -8.4 to -10.1m CD; over the northern section the ground rises to
around -5.4m CD.
3.3.2 A total of 682,000m3 of spoil will be removed from this location.
ABLE MARINE ENERGY PARK
DREDGING STRATEGY APRIL 2011
RC.JD.AMEP.E.D11/0016 Page 6 of 15
3.4 BERTHING POCKET
3.4.1 A 60m wide berthing pocket will be created parallel to the quay front. The
berthing pocket will be dredged to rockhead and a suitable aggregate
deposited to -11.5m CD in order to create a stable footing for use by jack-
up vessels.
3.4.2 At present the existing bathymetry in the south is -5.5m CD; over the
northern section, the ground rises to a maximum -4.1m CD. Rockhead is
estimated to lie between -12m CD and -20m CD.
3.4.3 A total of 827,000m3 of spoil will be removed in total from this location.
3.5 RECLAMATION AREA
3.5.1 The reclamation area is located within the footprint of the quay. It is
anticipated that 250,000m3 of silt material will be dredged from this area to
reduce consolidation settlement of the reclamation area. An additional
44,500m3 will be removed from the anchorage trench which requires
dredging to -6.2m CD. Total dredge quantities for the reclamation area will
be 294,500m3.
4 GEOTECHNICAL CHARACTERISATION OF ARISINGS
4.1 INTRODUCTION
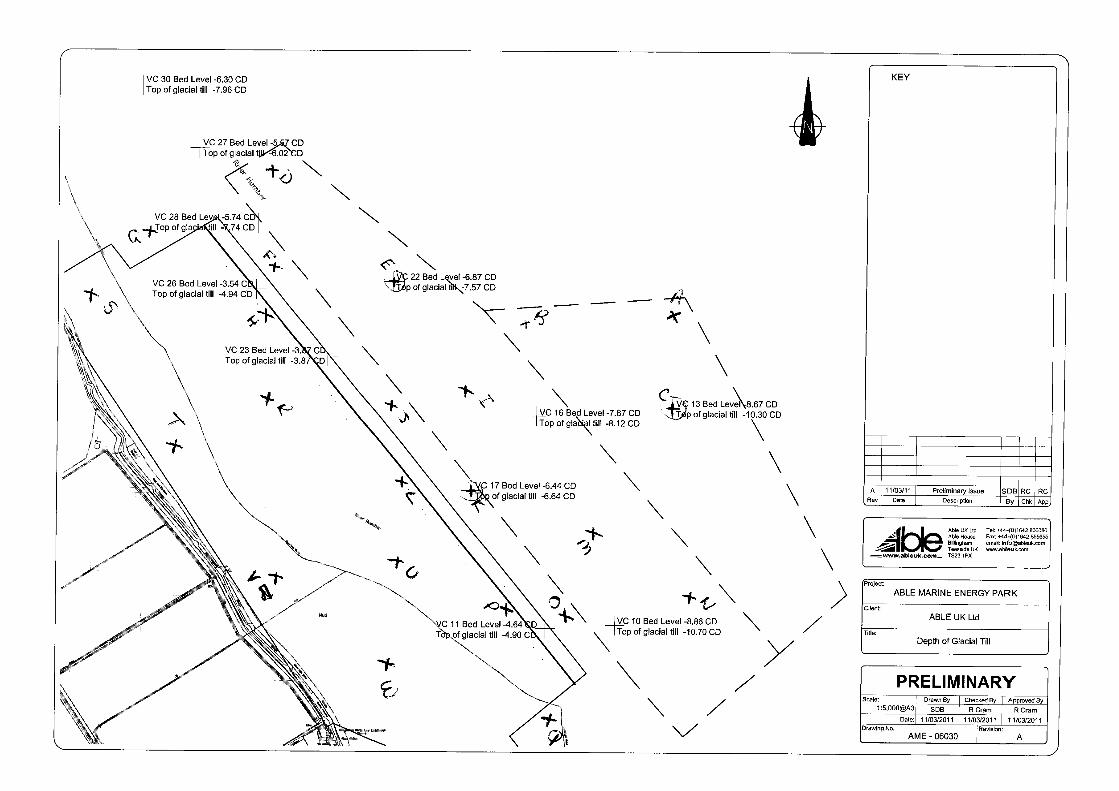
4.1.1 Summary of the surficial geology encountered in the 2010 vibrocore ground
investigation are presented on Figure A7.3 in Appendix 1. Anticipated
dredge material is shown in red text.
4.2 ALLUVIUM AND SOFT CLAYS
4.2.1 With the exception of vibrocores 11, 14, 18, 23 and 28, alluvial clays and
silts were encountered to depths varying between 0.3m (VC 8) and 3.90m
(VC12). The Atterberg limits tests undertaken on this material show it to
range between a low to high plasticity clay with bands of low and high
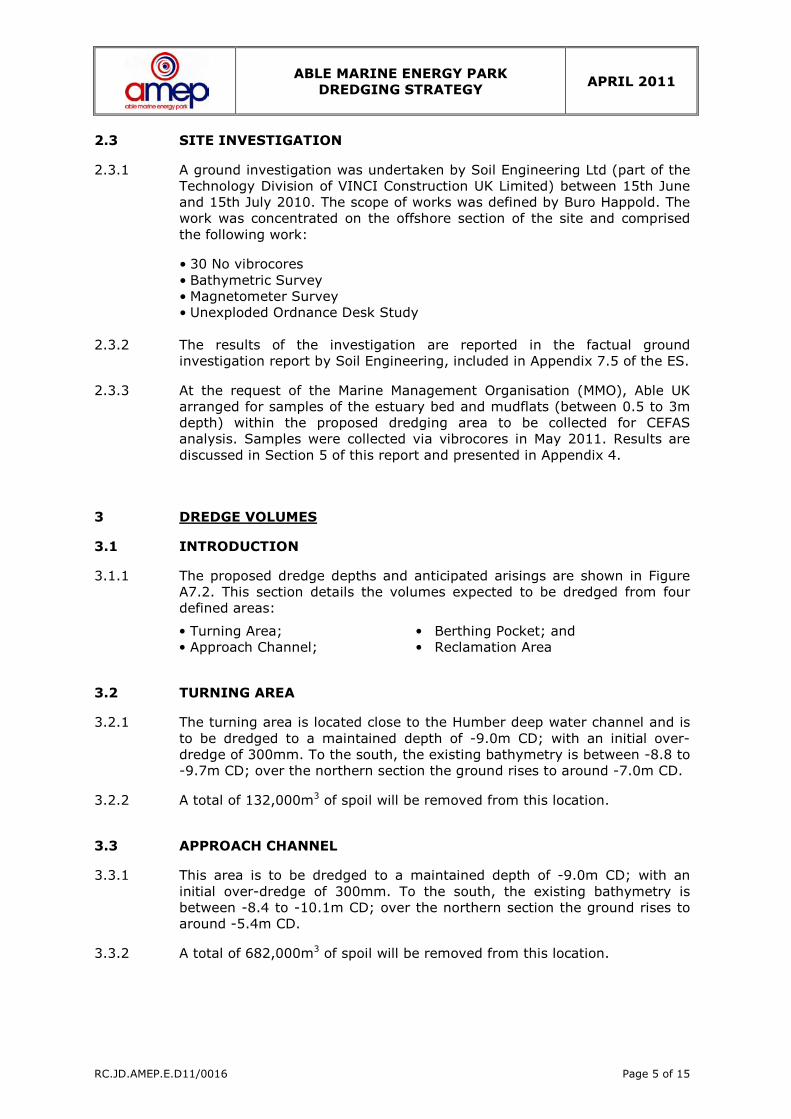
plasticity silt. The grading curves (Chart 4.1) show the particle size
distribution to vary, and compositionally the material ranges from gravelly
clay to silty clay with the clay fraction ranging from 11% to 35%. The
undrained shear strength of the alluvium is very low. The maximum shear
strength recorded was 20kN/m2; however, there is a significant proportion
of the data which is less than 5kN/m2.
4.2.2 Peat layers were encountered within the alluvial clays at 6 vibrocore
locations (VC 05, 07, 09, 12, 13 & 15). The peat is generally described as
occurring in thin lenses, which range in thickness from <10mm to <30mm.
At one location however, VC13, two thicker, persistent bands of peat are
recorded, each less than 100mm thick.
ABLE MARINE ENERGY PARK
DREDGING STRATEGY APRIL 2011
RC.JD.AMEP.E.D11/0016 Page 7 of 15
Chart: 4.1 Particle Size Distribution Curve: Alluvium
4.3 SILTY AND GRAVELLY SANDS
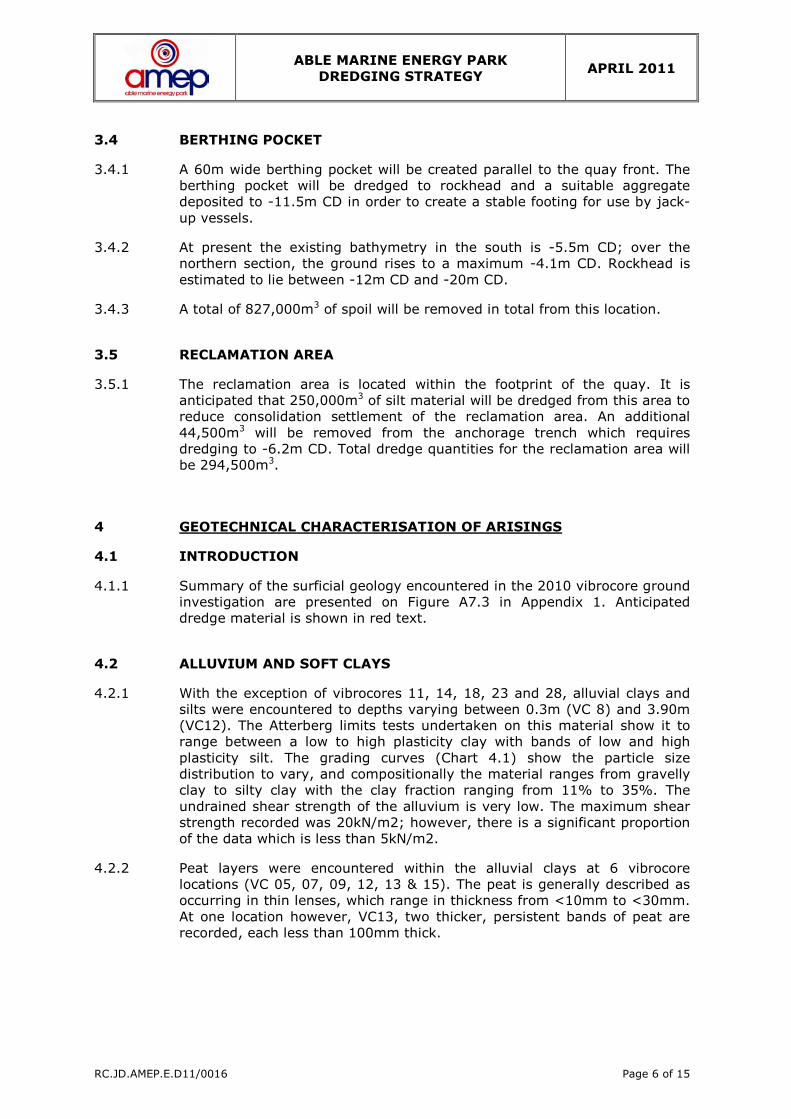
4.3.1 In general terms the grading test results (Chart 4.2) show the granular
soils to vary between silty sand and gravel, gravelly sand to silty fine sand.
The layer thickness of these granular soils varied generally between 0.3m
and 4.25m
Chart 4.2: Particle Size Distribution Curve: Sands & Gravels
4.4 GLACIAL TILL
4.4.1 The glacial till was encountered in the majority of the vibrocore locations
but was not encountered in VC 07, 08, 09 12 & 15. The till comprises
generally soft to firm, firm, and stiff, low to intermediate plasticity clay. The
undrained strength data shows the strength range to lie generally between
30kN/m2 and 110kN/m2.
ABLE MARINE ENERGY PARK
DREDGING STRATEGY APRIL 2011
RC.JD.AMEP.E.D11/0016 Page 8 of 15
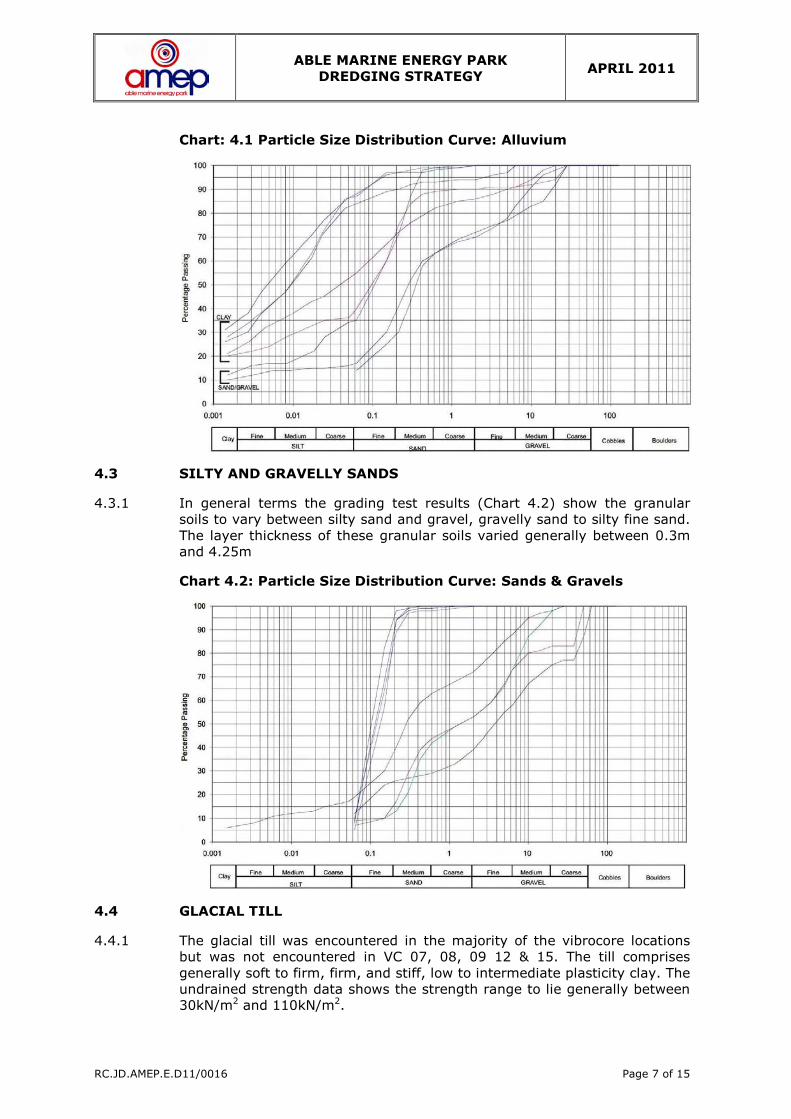
4.4.2 The Atterberg Limits of the material lie in a tight range with the plasticity
index (PI) varying between 7% and 25%. The grading curves (Chart 4.3)
show the material to be well graded, with a size fraction ranging from fine
to medium gravel to clay. The clay content ranges between 22% and 62%.
4.4.3 The gravel fraction generally comprises sandstone, mudstone and chalk,
however at certain locations, VC 05, 10, 13, 16 and 22 there is a very high
proportion of chalk present.
Chart 4.3: Particle Size Distribution Curve: Glacial Till
4.5 MATERIAL TYPE AND DREDGING PLANT
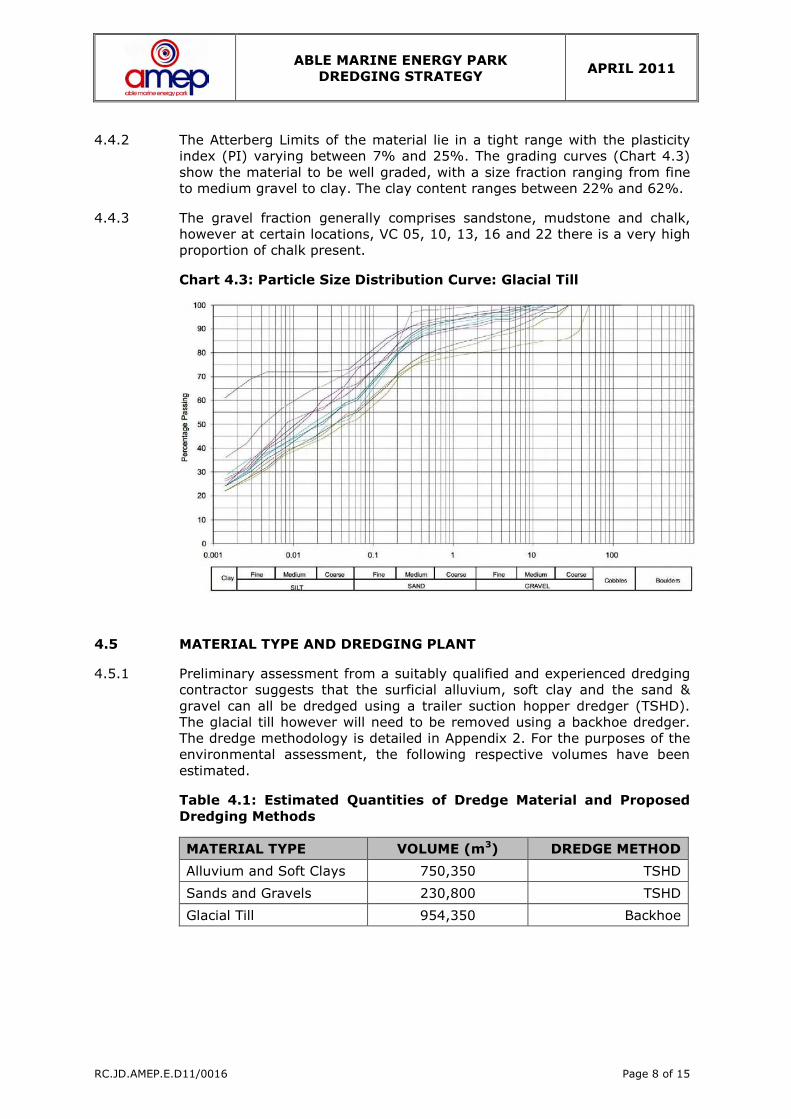
4.5.1 Preliminary assessment from a suitably qualified and experienced dredging
contractor suggests that the surficial alluvium, soft clay and the sand &
gravel can all be dredged using a trailer suction hopper dredger (TSHD).
The glacial till however will need to be removed using a backhoe dredger.
The dredge methodology is detailed in Appendix 2. For the purposes of the
environmental assessment, the following respective volumes have been
estimated.
Table 4.1: Estimated Quantities of Dredge Material and Proposed
Dredging Methods
MATERIAL TYPE VOLUME (m3) DREDGE METHOD
Alluvium and Soft Clays 750,350 TSHD
Sands and Gravels 230,800 TSHD
Glacial Till 954,350 Backhoe
ABLE MARINE ENERGY PARK
DREDGING STRATEGY APRIL 2011
RC.JD.AMEP.E.D11/0016 Page 9 of 15
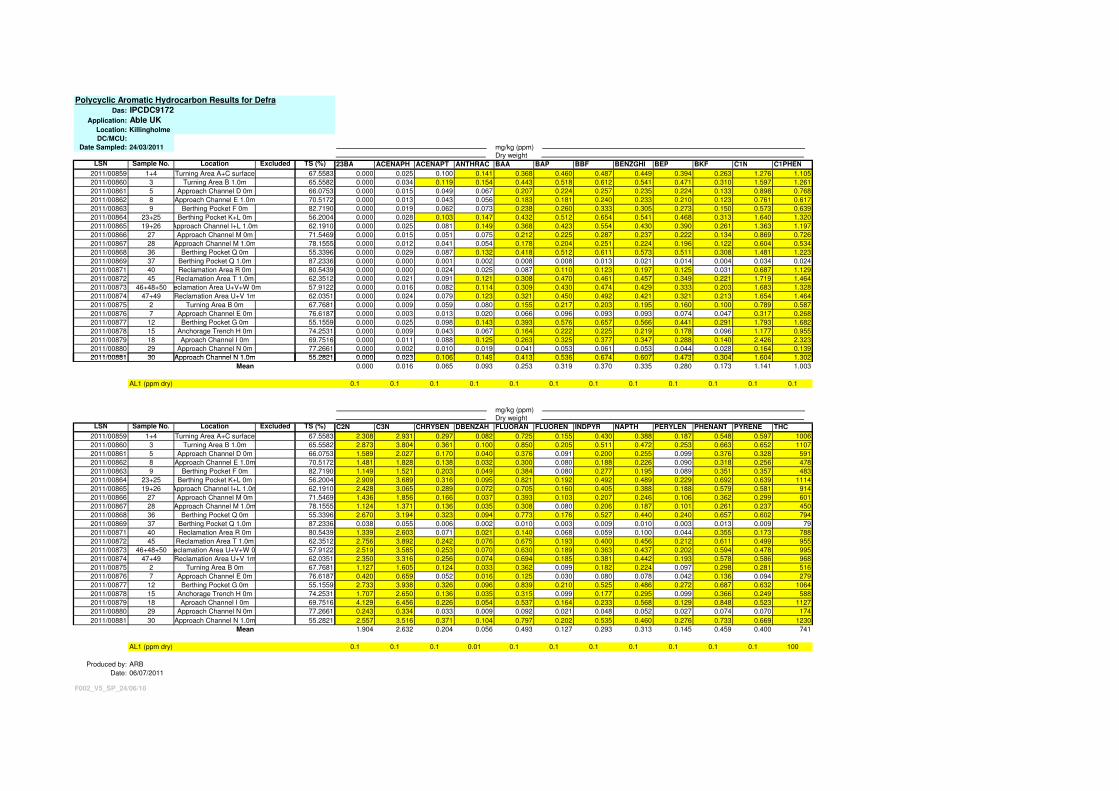
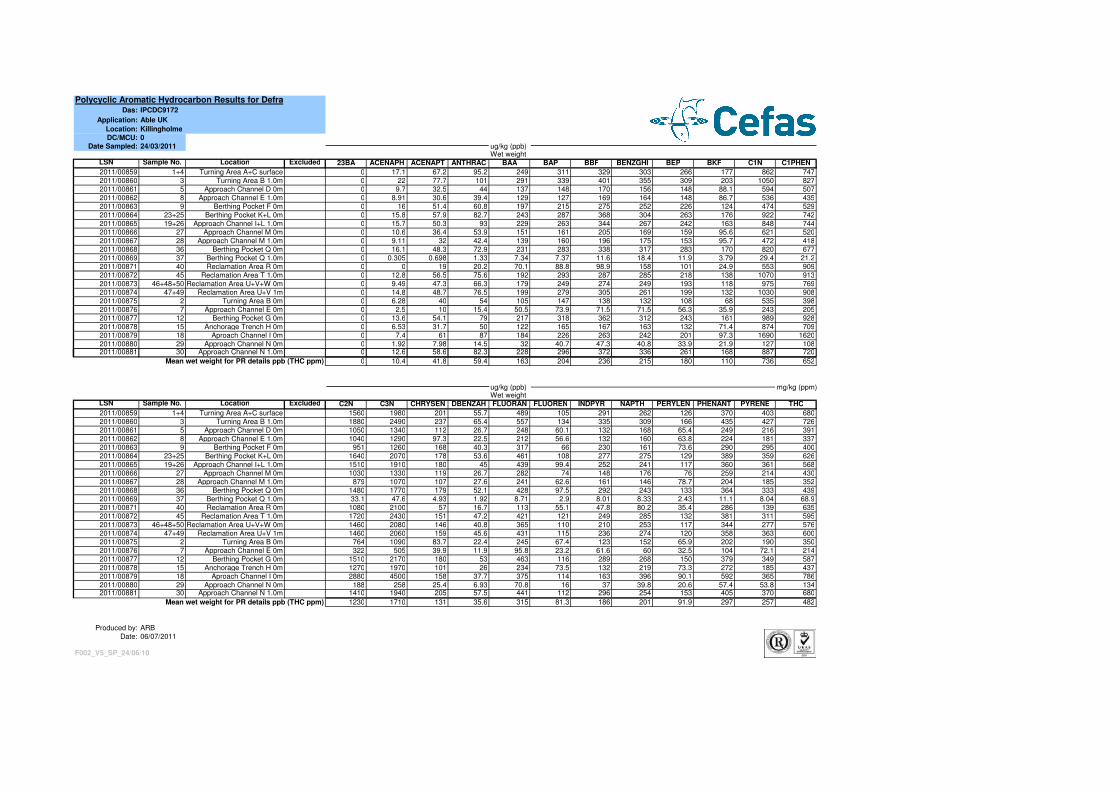
5 CHEMICAL CHARACTERISATION OF ARISINGS
5.1.1 Testing has been undertaken in accordance with the sampling plan
provided by Marine Management Organisation (MMO). Samples were
analysed by CEFAS and results are presented in Appendix 4.
5.1.2 In a letter received from Allyn Hogg 27th July 2011 ref: DC9172 (Appendix
5), the MMO confirmed, that “the material to be dredged is suitable for
disposal within the Humber Estuary”.
6 DISPOSAL SITES
6.1 GENERAL
6.1.1 In the absence of any other beneficial use, the default option is to dispose
of all material within the estuary and thereby maintain the sediment
supply. A number of disposal sites are open in the estuary for the deposit of
dredge arisings and these are shown in Figure A7.5. Sites are divided
between those that receive erodible deposits, such as the alluvium and
sands and gravels, and those that receive non-erodible deposits such as the
glacial till.
6.2 ERODIBLE MATERIALS
6.2.1 The closest deposit ground from the site is Humber 3A. This mainly
receives material arising from Immingham Dock, its entrance and riverside
berths as well as Humber Sea Terminal. Dredge volumes from Immingham
has ranged from 1,245,246 – 7,346,646 wet tonnes during the period 1985
-2007. The Harbour Master has advised that, based on current
maintenance dredging, this site is close to capacity. It is assumed not to
have capacity for AMEP dredging.
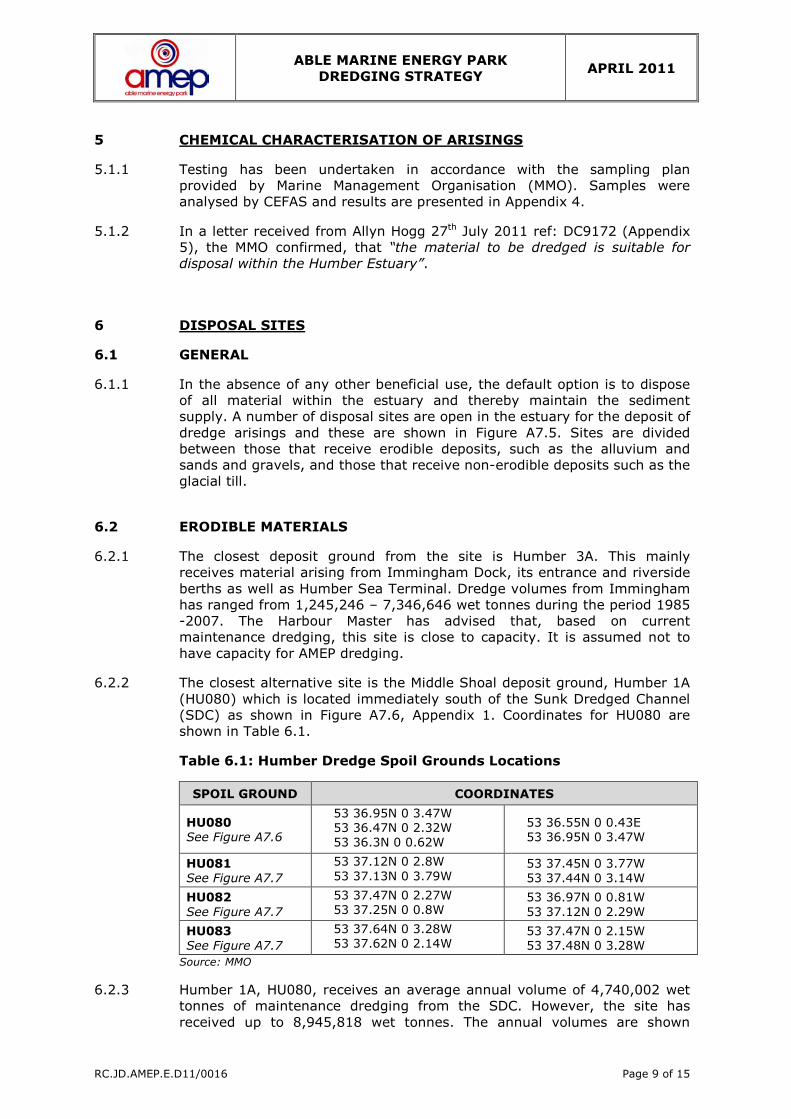
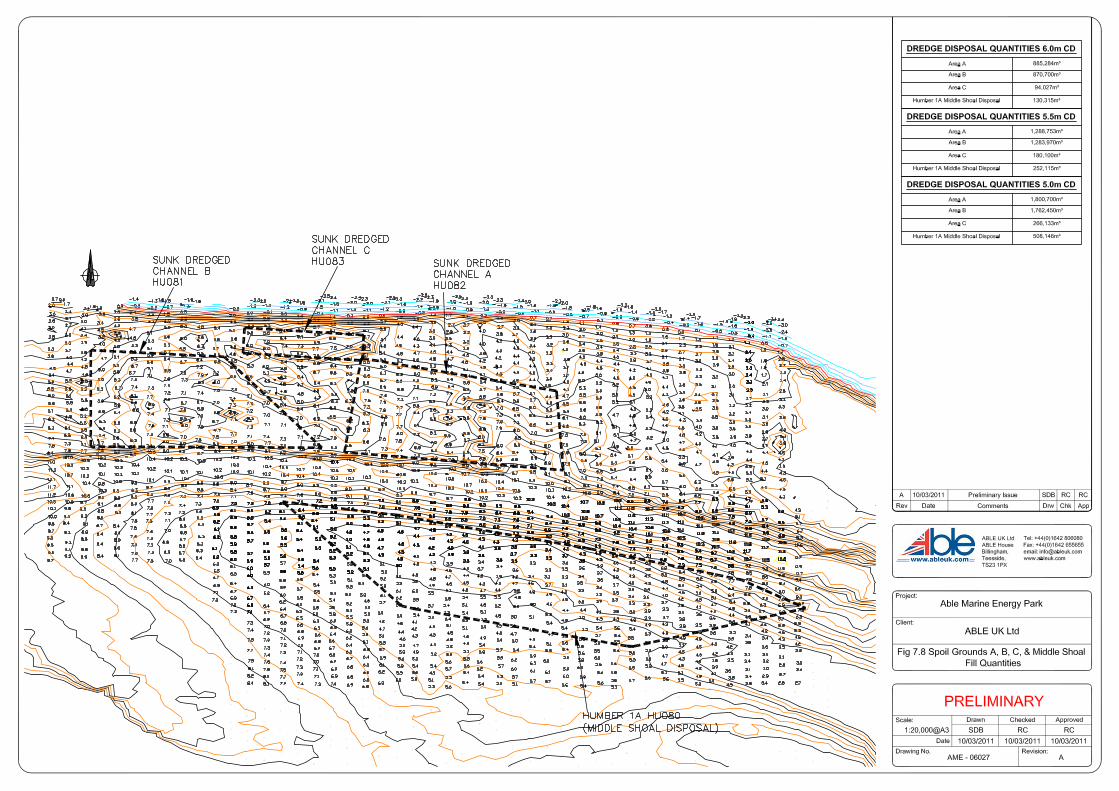
6.2.2 The closest alternative site is the Middle Shoal deposit ground, Humber 1A
(HU080) which is located immediately south of the Sunk Dredged Channel
(SDC) as shown in Figure A7.6, Appendix 1. Coordinates for HU080 are
shown in Table 6.1.
Table 6.1: Humber Dredge Spoil Grounds Locations
SPOIL GROUND COORDINATES
HU080 See Figure A7.6
53 36.95N 0 3.47W
53 36.47N 0 2.32W
53 36.3N 0 0.62W
53 36.55N 0 0.43E
53 36.95N 0 3.47W
HU081 See Figure A7.7
53 37.12N 0 2.8W
53 37.13N 0 3.79W 53 37.45N 0 3.77W
53 37.44N 0 3.14W
HU082
See Figure A7.7
53 37.47N 0 2.27W
53 37.25N 0 0.8W 53 36.97N 0 0.81W
53 37.12N 0 2.29W
HU083 See Figure A7.7
53 37.64N 0 3.28W
53 37.62N 0 2.14W 53 37.47N 0 2.15W
53 37.48N 0 3.28W
Source: MMO
6.2.3 Humber 1A, HU080, receives an average annual volume of 4,740,002 wet
tonnes of maintenance dredging from the SDC. However, the site has
received up to 8,945,818 wet tonnes. The annual volumes are shown

ABLE MARINE ENERGY PARK
DREDGING STRATEGY APRIL 2011
RC.JD.AMEP.E.D11/0016 Page 10 of 15
graphically in the Humber Maintenance Dredging Baseline Document (ABP
HES, 2008); the data is reproduced in Chart 6.1.
Chart 6.1: Sunk Dredged Channel Annual Volumes 1985-2007
Source: Figure 33 Humber Maintenance Dredging Baseline Document (August 2008)
6.2.4 It is proposed that all of the material removed by TSHD is deposited at this
site since the character of that material will be similar to that normally
deposited at the site.
6.2.5 The Marine Management Organisation stated in their letter dated 27th July
2011(Appendix 5), that they were “content for the silty erodible material to
be placed at Humber 1A (HU080)” and that there is “sufficient capacity for
the project’s dredged arisings”
6.3 NON-ERODIBLE MATERIALS
6.3.1 The only available sites for non-erodible materials are the ‘windows’ sites to
the north of SDC: HU081, HU082 and HU083 (coordinates given in Table
6.1) as shown in Figure A7.7, Appendix 1. Based, again, upon the 2009
bathymetric survey, there is potential for these three sites to receive up to
3,500,000m3 of material, refer to Figure A7.8. It is therefore proposed and
confirmed acceptable by MMO, that all non-erodible material is deposited
within these areas.
6.4 DREDGING PLANT AND PROGRAMME
6.4.1 The strategy has been developed with Westminster Dredging plc, a suitably
qualified and experienced dredging contractor with an extensive fleet of
specialised vessels. A preliminary Method Statement is reproduced in
Appendix 2.
6.5 MAINTENANCE DREDGING
6.5.1 Maintenance dredge volumes within the Humber Estuary vary considerably
from year to year; the totals from 1985 – 2007 are illustrated below as
abstracted from the Humber Maintenance Dredging Baseline Document.
6.5.2 All of the maintenance dredge material is re-deposited within the estuary.
ABLE MARINE ENERGY PARK
DREDGING STRATEGY APRIL 2011
RC.JD.AMEP.E.D11/0016 Page 11 of 15
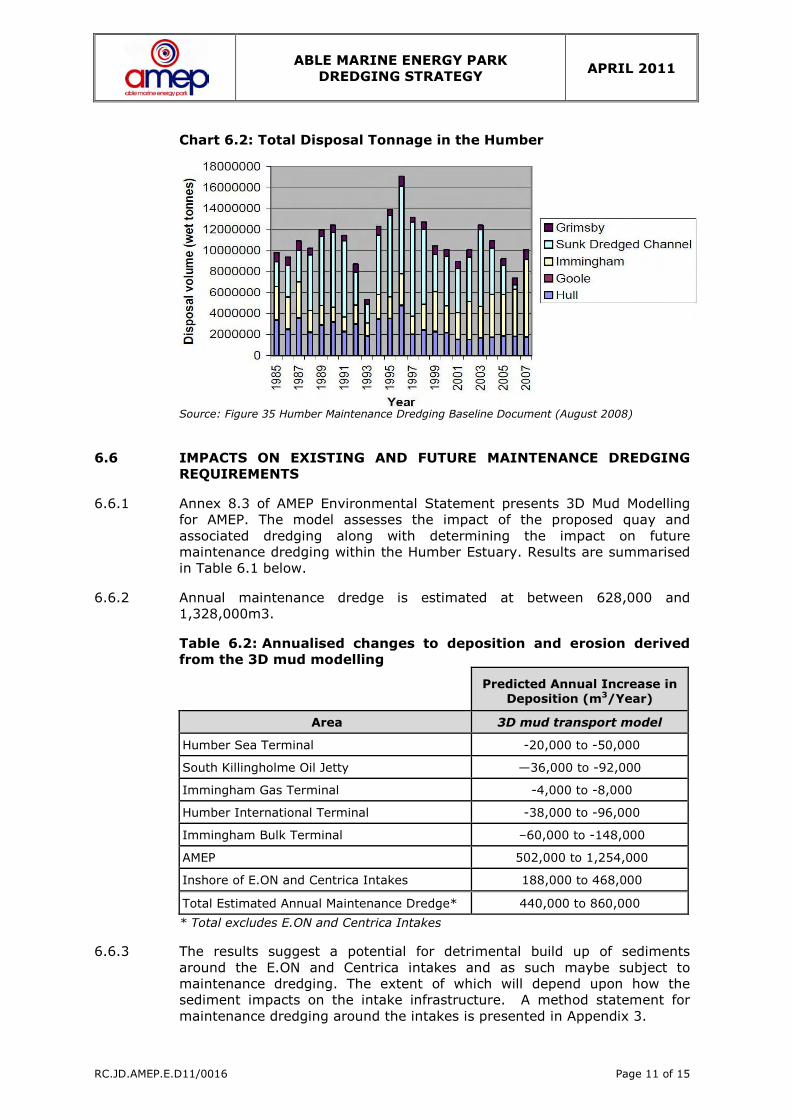
Chart 6.2: Total Disposal Tonnage in the Humber
Source: Figure 35 Humber Maintenance Dredging Baseline Document (August 2008)
6.6 IMPACTS ON EXISTING AND FUTURE MAINTENANCE DREDGING
REQUIREMENTS
6.6.1 Annex 8.3 of AMEP Environmental Statement presents 3D Mud Modelling
for AMEP. The model assesses the impact of the proposed quay and
associated dredging along with determining the impact on future
maintenance dredging within the Humber Estuary. Results are summarised
in Table 6.1 below.
6.6.2 Annual maintenance dredge is estimated at between 628,000 and
1,328,000m3.
Table 6.2: Annualised changes to deposition and erosion derived
from the 3D mud modelling
Predicted Annual Increase in
Deposition (m3/Year)
Area 3D mud transport model
Humber Sea Terminal -20,000 to -50,000
South Killingholme Oil Jetty —36,000 to -92,000
Immingham Gas Terminal -4,000 to -8,000
Humber International Terminal -38,000 to -96,000
Immingham Bulk Terminal –60,000 to -148,000
AMEP 502,000 to 1,254,000
Inshore of E.ON and Centrica Intakes 188,000 to 468,000
Total Estimated Annual Maintenance Dredge* 440,000 to 860,000
* Total excludes E.ON and Centrica Intakes
6.6.3 The results suggest a potential for detrimental build up of sediments
around the E.ON and Centrica intakes and as such maybe subject to
maintenance dredging. The extent of which will depend upon how the
sediment impacts on the intake infrastructure. A method statement for
maintenance dredging around the intakes is presented in Appendix 3.
ABLE MARINE ENERGY PARK
DREDGING STRATEGY APRIL 2011
RC.JD.AMEP.E.D11/0016 Page 12 of 15
7 IN-COMBINATION PROJECTS
7.1 GENERAL
7.1.1 This section briefly reviews other projects that include dredging works that
are either consented or proposed. The dredging strategies for each of these
projects have been abstracted from relevant planning documents and are
summarised in Sections 7.2-7.7.
7.2 QUAY 2005
7.2.1 On 13th October 2000 ABP applied to the Secretary of State for the
Environment, Transport and the Regions for a Harbour Revision Order
(HRO) under section 14 of the Harbours Act 1964 to authorise:
• the reclamation of an area of 7.5 hectares from the River Humber;
• the temporary diversion of the existing riverside footpath (Footpath Number 22) along the river wall on the north bank of the Humber; and
• dredging in the approaches to and adjoining the new quay.
7.2.2 The Environmental Statement records that all of the dredge arisings,
amounting to 200,000m3, will be placed within the quay works as fill.
Accordingly, none will be disposed of within the estuary. It further records
that the project will not give rise to any significant maintenance dredging.
7.2.3 The Environmental Statement is silent on the impacts of the dredging
works on suspended sediment concentrations in the Humber Estuary.
Accordingly it is concluded that the effects were deemed insignificant.
7.3 IMMINGHAM OIL TERMINAL (IOT) APPROACH CHANNEL
DEEPENING
7.3.1 This scheme includes for an estimated 3,905,000 m3 to be dredged mostly
from within the Humber Estuary. A total area of 427ha of seabed is
affected, 312ha of which are located within the boundaries of the Humber
Estuary Marine Site (EMS).
7.3.2 The application was supported by an Environmental Statement prepared by
ABP Mer. The dredging strategy for the works was detailed in
‘Supplementary Note 2: Dredging and Disposal Strategy’, dated July 2009.
That document shows that over 90 per cent of the dredged material will be
removed by TSHD and will be disposed of within erodible deposit sites.
Approximately 375,000m3, of arisings will be non-erodible clays;
220,000m3 will be disposed of within SDC Sites HU081 - HU083.
7.4 GRIMSBY RO-RO
7.4.1 A Harbour Revision Order for the construction of a new Ro-Ro terminal at
Grimsby came into force on 7th April 2011. The ES for the project records
that 210,000 m3 of material will be dredged for the new berths, the turning
area and the approach channel. Of this 165,000 m3 of arisings will be
erodible and disposed of within the Burcom Sands Deposit Ground; the
remaining 45,000m3 of arisings comprise glacial clays that will be deposited
in the SDC window sites.
ABLE MARINE ENERGY PARK
DREDGING STRATEGY APRIL 2011
RC.JD.AMEP.E.D11/0016 Page 13 of 15
7.5 HULL RIVERSIDE BULK TERMINAL
7.5.1 ABP has applied for a Harbour Revision Order for a new bulk terminal near
the eastern boundary of the Port of Hull, between Queen Elizabeth Dock
and the Salt End Chemical Works. The application has not been determined
to date. The proposals include the construction of a new jetty and extensive
dredging works on the approach to the new terminal.
7.5.2 The dredging works total 1,100,000m3 of material in-situ, of which
562,000m3 is erodible and will be dispersed to the water column. The
remaining 548,000m3 is non-erodible glacial clay and gravels. The alluvium
is to be deposited at Hull Middle (HU020) and two new sites subject to a
FEPA licence for them. The glacial till and gravel is to be disposed of in the
SDC window sites.
7.6 GREEN PORT HULL
7.6.1 Green Port hull is a proposed development which is an alternative to Quay
2005. ABP intend to submit a series of applications to cover the cover the
works but are relying on the ABP (Hull) HRO 2006 as the principal consent
for the works.
7.7 SUMMARY
7.7.1 Some of the dredge arisings from the projects listed above will be disposed
of within the same areas as those proposed by AMEP. Table 8.1 details the
estimated dredge quantities for each project for those disposal sites that
are common to the AMEP Proposal.
Table 7.1: Summary of Disposal Quantities and Sites for Main
Humber Projects.
PROJECT SDC WINDOW SITES (HU081, HU082, HU083)
MIDDLE SHOAL (HU080)
AMEP 954,350m3 981,150m3
HRBT 548,000m3 0m3
Quay 2005 0m3 0m3
Grimsby Ro-Ro 45,000m3 0m3
IOT 375,000m3 1,597,000m3
TOTAL 1,888,000m3 2,287,000m3
8 REFERENCES
• ABP MER, Associated British Ports: Hull Riverside Bulk Terminal
Environmental Statement D122173; February 2010
• ABP MER, Grimsby RO-RO Berth Environmental Statement, R1506,
September 2009
• ABP MER, Immingham Oil Terminal Approach Channel Dredging
Environmental Statement, R1416, January 2009
• ERM, ABP Quay 2005 Environmental Statement, Reference 6820,
September 2000.
ABLE MARINE ENERGY PARK
DREDGING STRATEGY APRIL 2011
RC.JD.AMEP.E.D11/0016 Page 14 of 15
• Humber Estuary Services, ABP, Humber Maintenance Dredging Baseline
Document, TJ/Gy; June 2005 Version 3
• Marine Management Organisation, Record of Appropriate Assessment
(Under Regulation 61 the Conservation of Habitats and Species
Regulations 2010 (The “Habitats Regulations”) (SI No. 2010/490)
2009.
ABLE MARINE ENERGY PARK
DREDGING STRATEGY APRIL 2011
APPENDIX 1
FIGURES
FIGURE NO TITLE DRAWING NO
A7.1 Bathymetry AME – 06037 C
A7.2 Dredge Volumes AME – 06063 A
A7.3 Vibrocore Locations & Results AME – 09157 B
A7.4 Additional Sampling Locations AME – 09161 B
A7.5 Outer Spoil Grounds – Status AME – 06035 A
A7.6 Outer Spoil Grounds – Names AME – 06034 A
A7.7 Outer Spoil Grounds – Sites AME – 06036 A
A7.8 Spoil Ground A, B, C & Middle Shoal Fill Quantities AME – 06027 A

ABLE MARINE ENERGY PARK
DREDGING STRATEGY APRIL 2011
APPENDIX 2
DREDGE METHODOLOGY
Royal Boskalis Westminster nv: Preliminary Work Method Statement
Royal Boskalis Westminster nv
International Dredging & Marine Contractors
- WMS Able Marine Energy Park Issue 30.11.2011/06 Page 1 of 17
Preliminary Work Method Statement
Able Marine Energy Park
CLIENT NAME : - PROJECT LOCATION : Immingham, United Kingdom PROJECT NUMBER : -
Revision Status
Rev Issue Date Reason for Issue Prepared Checked Approved
0.0 2011.01.26 Preliminary Work Method Statement PAME
1.0 2011.01.26 Preliminary Work Method Statement PAME AJO
2.0 Not issued
3.0 2011.02.23 Amended for Richard Cram WSHI
4.0 2011.07.13 Minor amendments fro J Dawes WSHI
5.0 2011.10.24 Amended for realigned Quay WSHI
6.0 2011.11.30 Amended for submission WSHI
List of Changes to previous version
Par. Change
Royal Boskalis Westminster nv
International Dredging & Marine Contractors
- WMS Able Marine Energy Park Issue 30.11.2011/06 Page 2 of 17
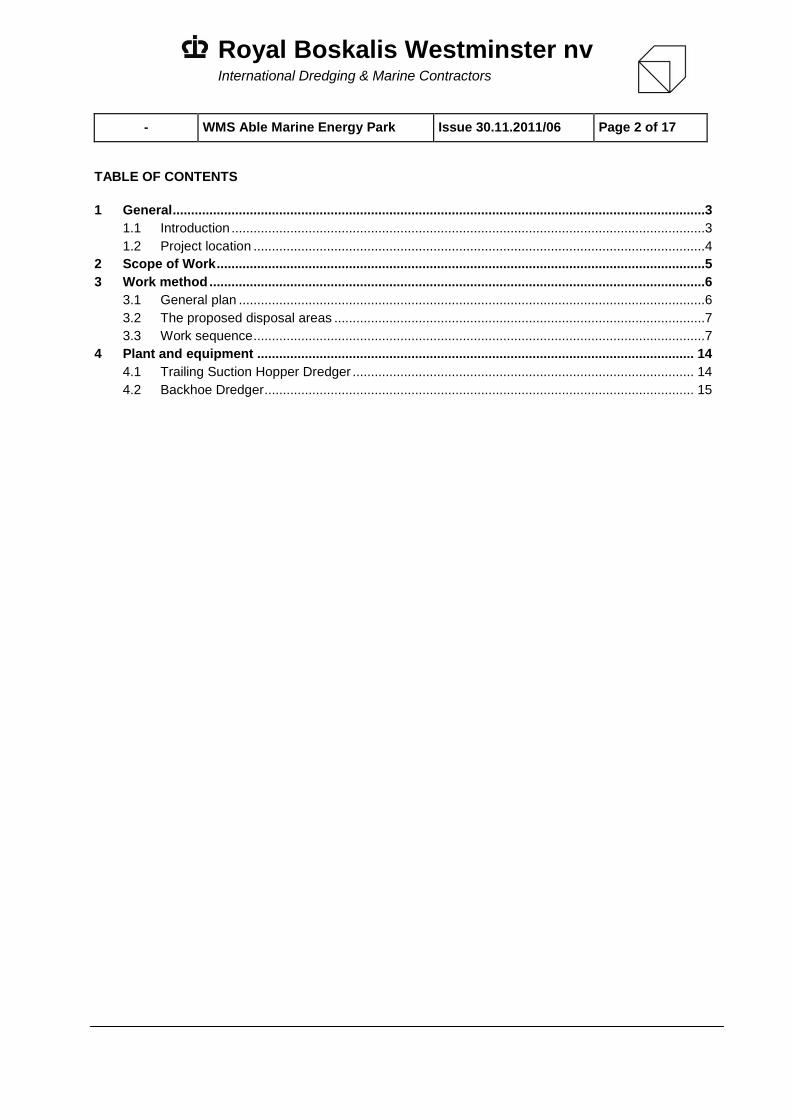
TABLE OF CONTENTS
1 General .................................................................................................................................................3 1.1 Introduction .................................................................................................................................3 1.2 Project location ...........................................................................................................................4
2 Scope of Work .....................................................................................................................................5 3 Work method .......................................................................................................................................6
3.1 General plan ...............................................................................................................................6 3.2 The proposed disposal areas .....................................................................................................7 3.3 Work sequence ...........................................................................................................................7
4 Plant and equipment ....................................................................................................................... 14 4.1 Trailing Suction Hopper Dredger ............................................................................................. 14 4.2 Backhoe Dredger ..................................................................................................................... 15
Royal Boskalis Westminster nv
International Dredging & Marine Contractors
- WMS Able Marine Energy Park Issue 30.11.2011/06 Page 3 of 17
1 GENERAL 1.1 Introduction Royal Boskalis Westminster N.V. is a leading global services provider operating in the dredging, maritime infrastructure and maritime services sectors. We provide creative and innovative all-round solutions to infrastructural challenges in the maritime, coastal and delta regions of the world. Our operations are broadly spread across all continents, giving the company a stable foundation, the flexibility to capture a wide range of projects and excellent prospects for balanced growth. Boskalis’ market segments are Dredging and Earthmoving, Maritime Infrastructure and Maritime & Terminal Services. Our main product segment is dredging and earthmoving, which includes the following activities:
Construction and maintenance of ports and waterways;
Land reclamation;
Coastal defence and riverbank protection;
Offshore services for the oil and gas industry;
Dry infrastructure and soil improvement;
Underwater rock fragmentation;
Mining;
Gravel and sand trading;
Environmental activities. Boskalis has, including its share in partnerships, around 14,000 employees and operates in 65 countries across six continents. Boskalis has a versatile fleet of over 1,100 units, including trailing suction hopper dredgers, self-propelled seagoing heavy-duty cutter suction dredgers, backhoe dredgers, grab dredgers, fall-pipe vessels and side stone dumping vessels. The vessels meet the strict requirements of the international ISM and ISPS codes. The company's commitment to safety, health, environment and quality is reflected in the acquired ISO 9001, ISO 14001 and OHSAS 18001 certification.
Safety program NINA (No Injuries No Accidents)
Our safety program NINA – No Injuries, No Accidents – sets clear standards and explains what we expect from our people with regard to their safety behaviour. At the heart of the NINA safety program are five core Values and five Rules. The Values make people aware of their own responsibility regarding safety and encourage them to take action if operations are unsafe and approach others if they are at risk. The Rules provide guidance regarding the management of health and safety risks. NINA is supported by an extensive training and workshop program so that all our employees understand the NINA principles and how to lead by example. NINA is embedded in our organizational systems and managed by leading indicators. Our Safety Vision
Our vision statement clearly expresses what we stand for with regard to safety:
“Our people are our most valuable assets, making safety a core value. Our goal is: No Injuries No Accidents. This is embedded in our company’s culture and supported through Values and Rules. All employees, including our sub-contractors, are expected to take these values and rules to heart.” The vision statement is supported by five Values and five Rules that have been specifically developed to further detail where we stand on safety and to provide guidance to all employees, including those of subcontractors, with regard to both expected behaviour and risk management. For more information, visit: http://www.boskalis-nina.com
Royal Boskalis Westminster nv
International Dredging & Marine Contractors
- WMS Able Marine Energy Park Issue 30.11.2011/06 Page 4 of 17
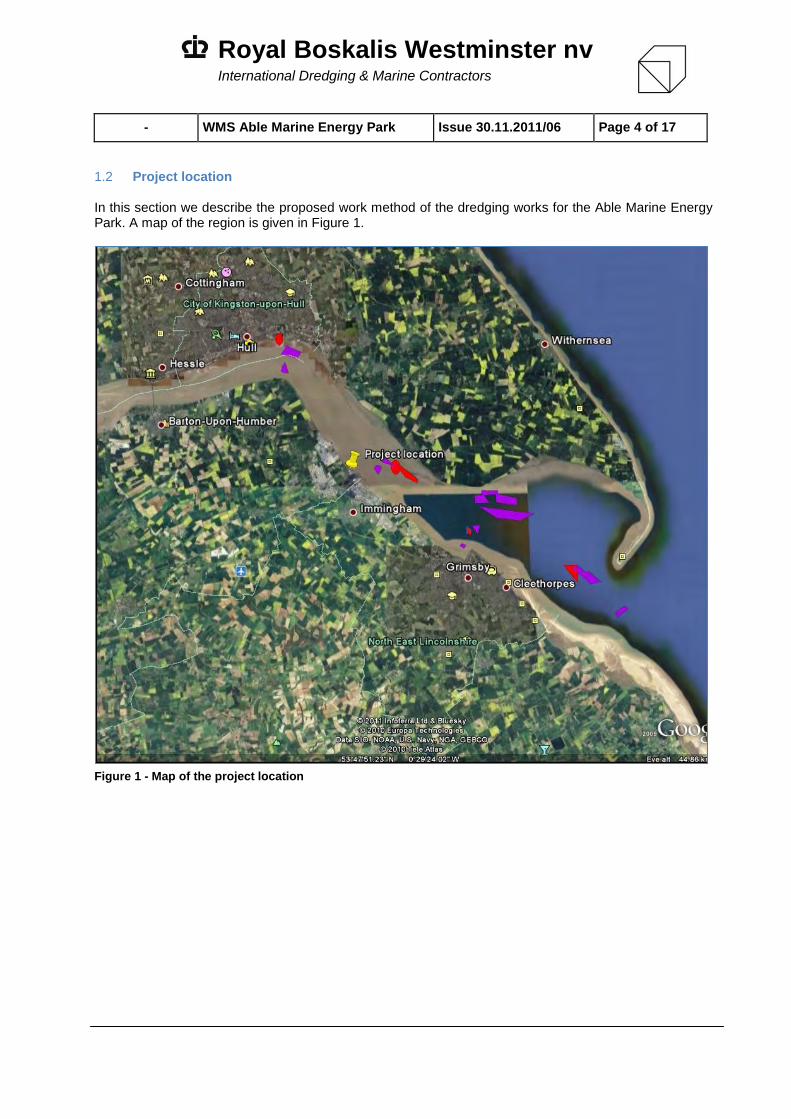
1.2 Project location In this section we describe the proposed work method of the dredging works for the Able Marine Energy Park. A map of the region is given in Figure 1.
Figure 1 - Map of the project location
Royal Boskalis Westminster nv
International Dredging & Marine Contractors
- WMS Able Marine Energy Park Issue 30.11.2011/06 Page 5 of 17
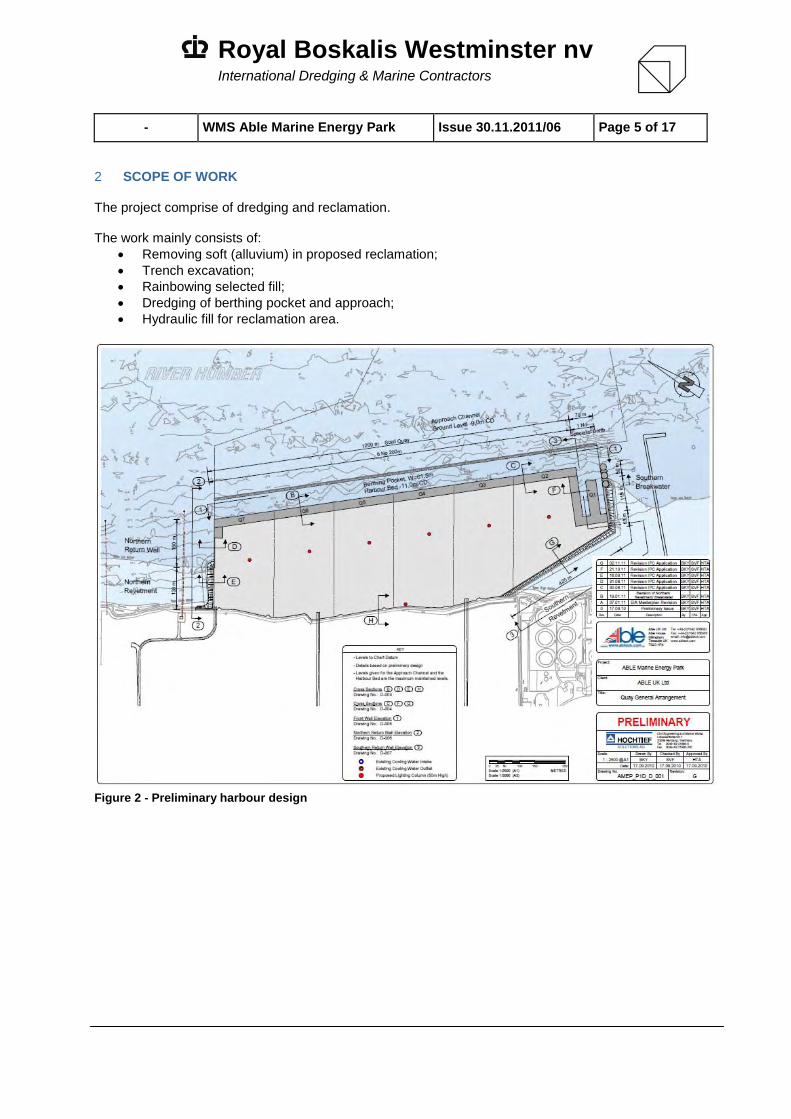
2 SCOPE OF WORK The project comprise of dredging and reclamation. The work mainly consists of:
Removing soft (alluvium) in proposed reclamation;
Trench excavation;
Rainbowing selected fill;
Dredging of berthing pocket and approach;
Hydraulic fill for reclamation area.
Figure 2 - Preliminary harbour design
Royal Boskalis Westminster nv
International Dredging & Marine Contractors
- WMS Able Marine Energy Park Issue 30.11.2011/06 Page 6 of 17
3 WORK METHOD Based on the local conditions, soil information, the properties of our dredging equipment and knowledge gained on other dredging projects, Boskalis has developed the following work method.
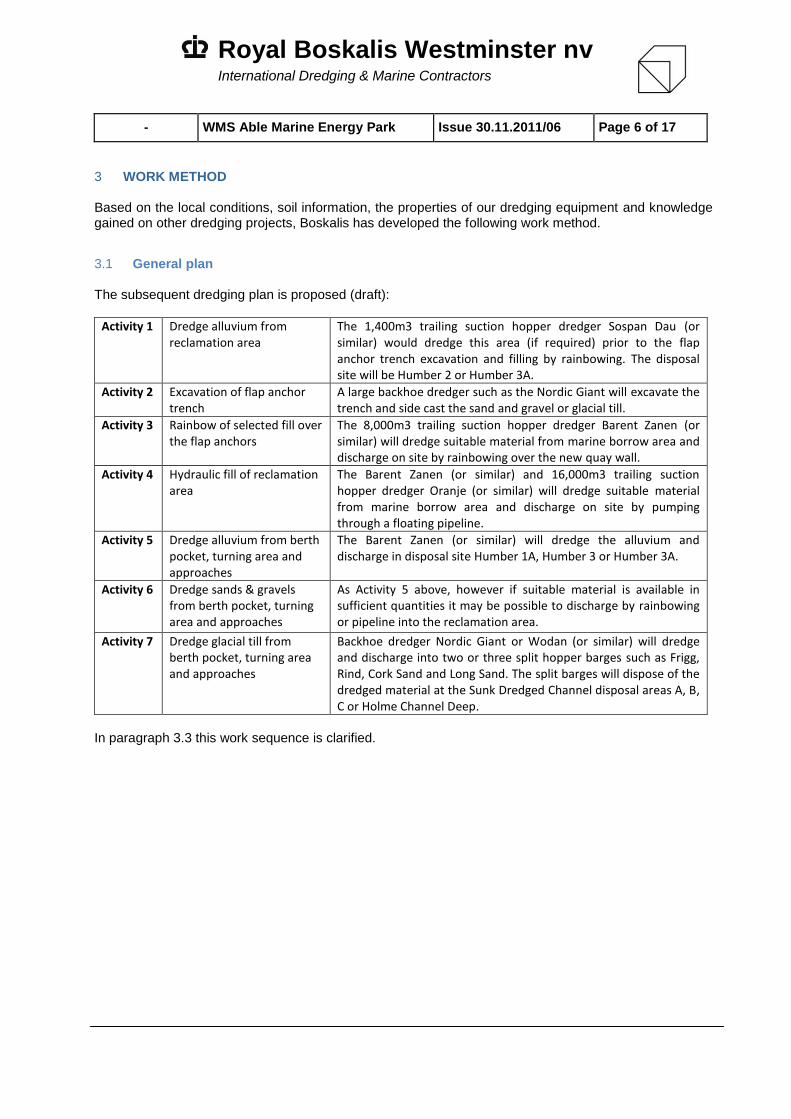
3.1 General plan The subsequent dredging plan is proposed (draft):
Activity 1 Dredge alluvium from reclamation area
The 1,400m3 trailing suction hopper dredger Sospan Dau (or similar) would dredge this area (if required) prior to the flap anchor trench excavation and filling by rainbowing. The disposal site will be Humber 2 or Humber 3A.
Activity 2 Excavation of flap anchor trench
A large backhoe dredger such as the Nordic Giant will excavate the trench and side cast the sand and gravel or glacial till.
Activity 3 Rainbow of selected fill over the flap anchors
The 8,000m3 trailing suction hopper dredger Barent Zanen (or similar) will dredge suitable material from marine borrow area and discharge on site by rainbowing over the new quay wall.
Activity 4 Hydraulic fill of reclamation area
The Barent Zanen (or similar) and 16,000m3 trailing suction hopper dredger Oranje (or similar) will dredge suitable material from marine borrow area and discharge on site by pumping through a floating pipeline.
Activity 5 Dredge alluvium from berth pocket, turning area and approaches
The Barent Zanen (or similar) will dredge the alluvium and discharge in disposal site Humber 1A, Humber 3 or Humber 3A.
Activity 6 Dredge sands & gravels from berth pocket, turning area and approaches
As Activity 5 above, however if suitable material is available in sufficient quantities it may be possible to discharge by rainbowing or pipeline into the reclamation area.
Activity 7 Dredge glacial till from berth pocket, turning area and approaches
Backhoe dredger Nordic Giant or Wodan (or similar) will dredge and discharge into two or three split hopper barges such as Frigg, Rind, Cork Sand and Long Sand. The split barges will dispose of the dredged material at the Sunk Dredged Channel disposal areas A, B, C or Holme Channel Deep.
In paragraph 3.3 this work sequence is clarified.
Royal Boskalis Westminster nv
International Dredging & Marine Contractors
- WMS Able Marine Energy Park Issue 30.11.2011/06 Page 7 of 17
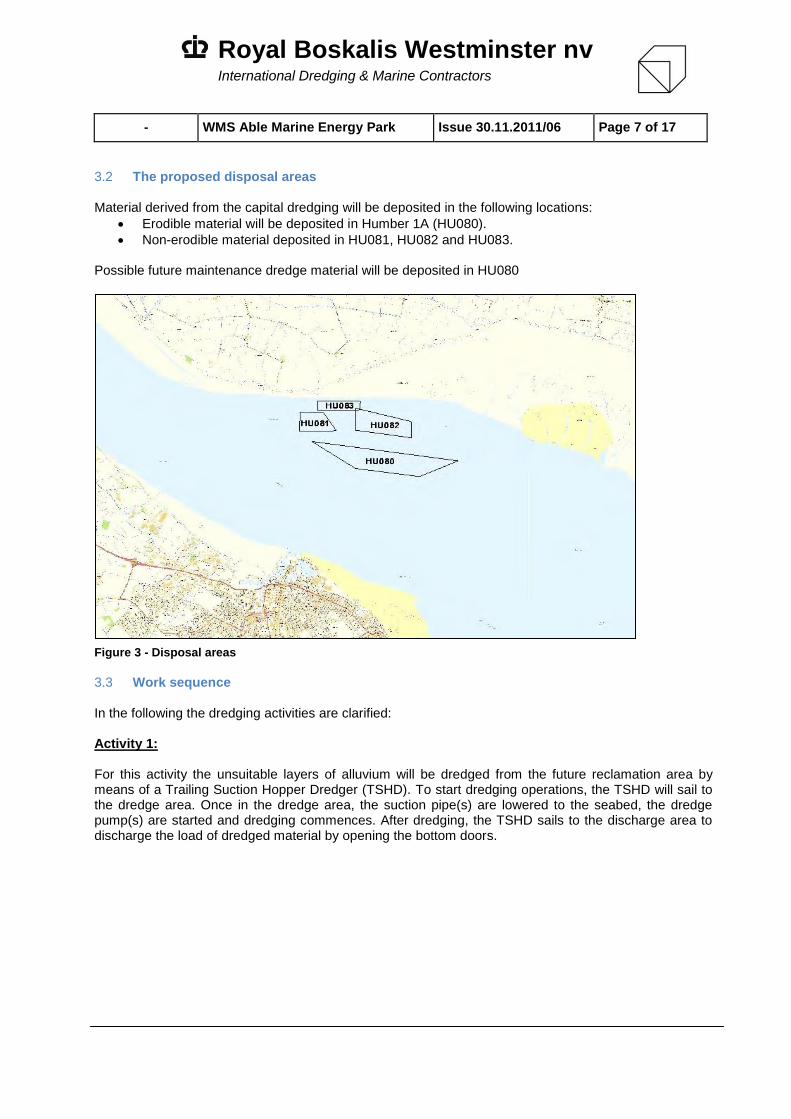
3.2 The proposed disposal areas Material derived from the capital dredging will be deposited in the following locations:
Erodible material will be deposited in Humber 1A (HU080).
Non-erodible material deposited in HU081, HU082 and HU083. Possible future maintenance dredge material will be deposited in HU080
Figure 3 - Disposal areas
3.3 Work sequence In the following the dredging activities are clarified: Activity 1: For this activity the unsuitable layers of alluvium will be dredged from the future reclamation area by means of a Trailing Suction Hopper Dredger (TSHD). To start dredging operations, the TSHD will sail to the dredge area. Once in the dredge area, the suction pipe(s) are lowered to the seabed, the dredge pump(s) are started and dredging commences. After dredging, the TSHD sails to the discharge area to discharge the load of dredged material by opening the bottom doors.
Royal Boskalis Westminster nv
International Dredging & Marine Contractors
- WMS Able Marine Energy Park Issue 30.11.2011/06 Page 8 of 17
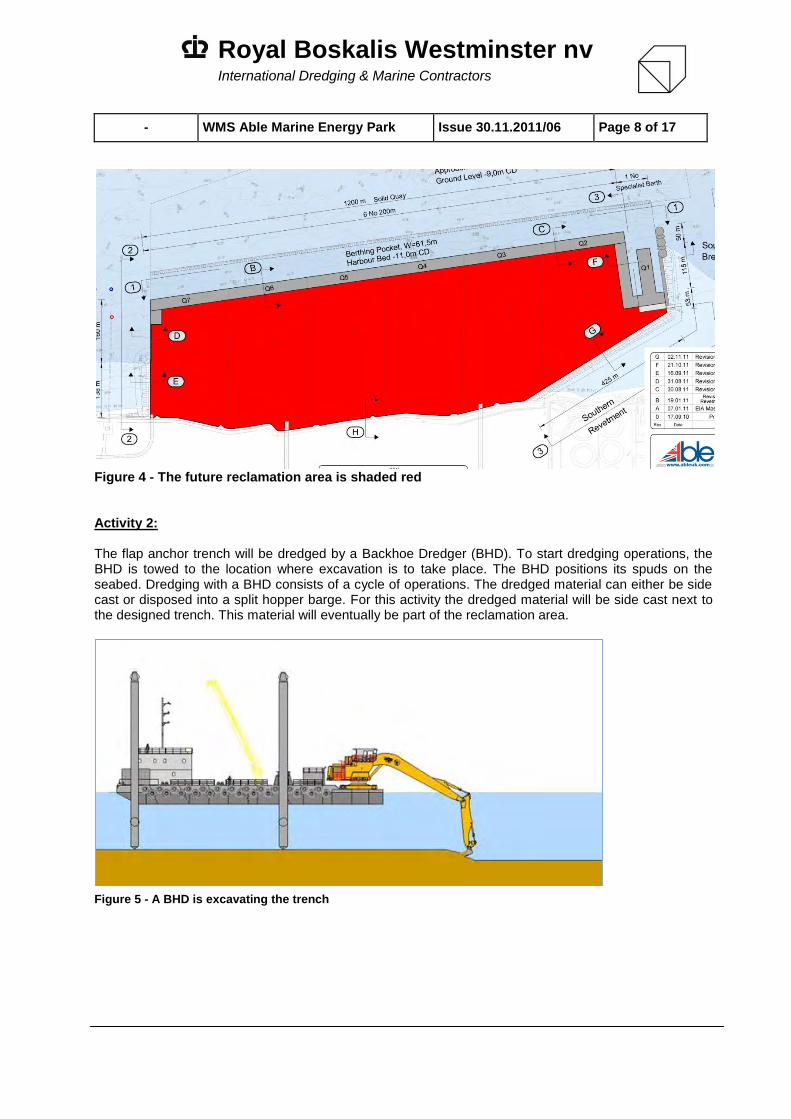
Figure 4 - The future reclamation area is shaded red Activity 2: The flap anchor trench will be dredged by a Backhoe Dredger (BHD). To start dredging operations, the BHD is towed to the location where excavation is to take place. The BHD positions its spuds on the seabed. Dredging with a BHD consists of a cycle of operations. The dredged material can either be side cast or disposed into a split hopper barge. For this activity the dredged material will be side cast next to the designed trench. This material will eventually be part of the reclamation area.
Figure 5 - A BHD is excavating the trench
Royal Boskalis Westminster nv
International Dredging & Marine Contractors
- WMS Able Marine Energy Park Issue 30.11.2011/06 Page 9 of 17
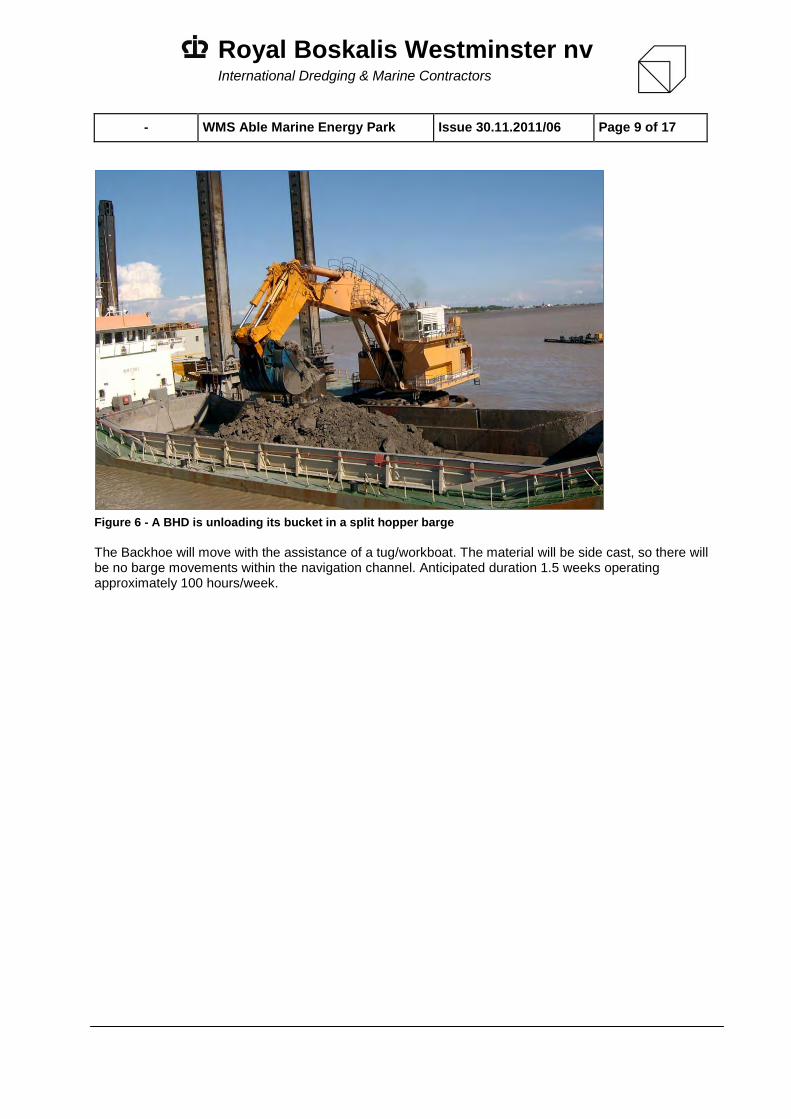
Figure 6 - A BHD is unloading its bucket in a split hopper barge
The Backhoe will move with the assistance of a tug/workboat. The material will be side cast, so there will be no barge movements within the navigation channel. Anticipated duration 1.5 weeks operating approximately 100 hours/week.
Royal Boskalis Westminster nv
International Dredging & Marine Contractors
- WMS Able Marine Energy Park Issue 30.11.2011/06 Page 10 of 17
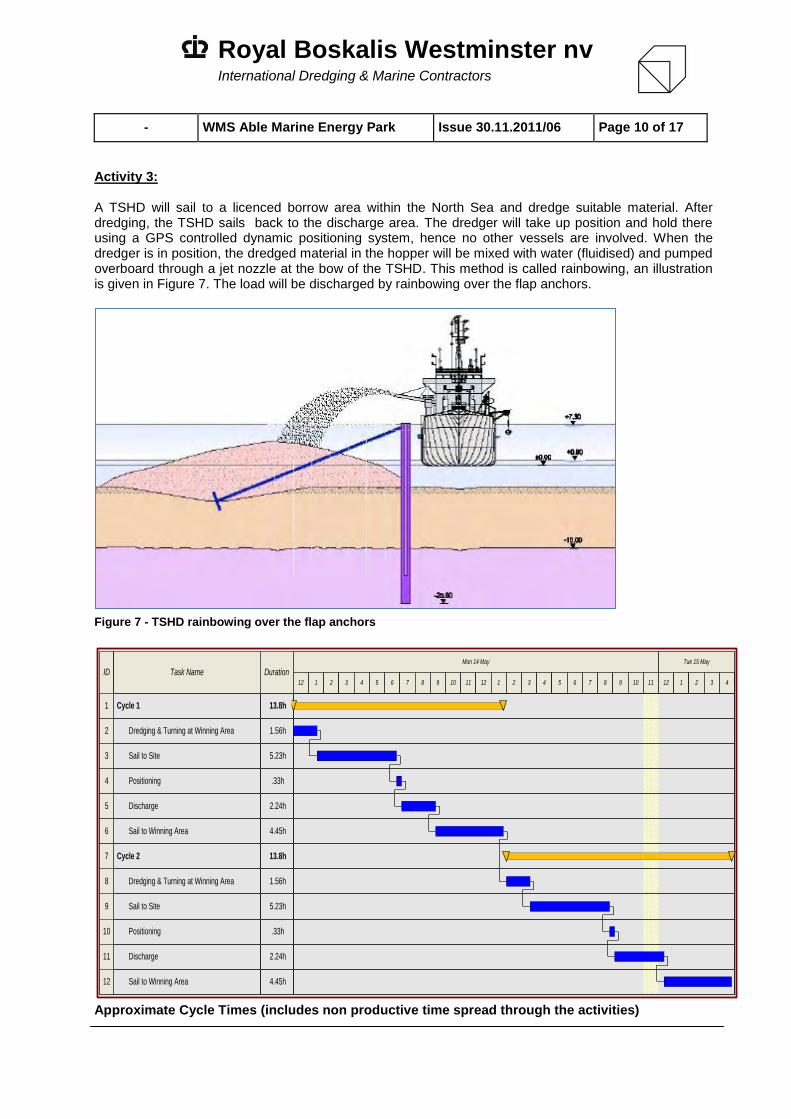
Activity 3: A TSHD will sail to a licenced borrow area within the North Sea and dredge suitable material. After dredging, the TSHD sails back to the discharge area. The dredger will take up position and hold there using a GPS controlled dynamic positioning system, hence no other vessels are involved. When the dredger is in position, the dredged material in the hopper will be mixed with water (fluidised) and pumped overboard through a jet nozzle at the bow of the TSHD. This method is called rainbowing, an illustration is given in Figure 7. The load will be discharged by rainbowing over the flap anchors.
Figure 7 - TSHD rainbowing over the flap anchors
ID Task Name Duration
Mon 14 May Tue 15 May
12 1 2 3 4 5 6 7 8 9 10 11 12 1 2 3 4 5 6 7 8 9 10 11 12
2 1.56hDredging & Turning at Winning Area
3 5.23hSail to Site
4 .33hPositioning
5 2.24hDischarge
6 4.45hSail to Winning Area
9 5.23hSail to Site
10 .33hPositioning
11 2.24hDischarge
12 4.45hSail to Winning Area
1 2 3 4
1 13.8hCycle 1
8 1.56hDredging & Turning at Winning Area
7 13.8hCycle 2
Approximate Cycle Times (includes non productive time spread through the activities)
Royal Boskalis Westminster nv
International Dredging & Marine Contractors
- WMS Able Marine Energy Park Issue 30.11.2011/06 Page 11 of 17
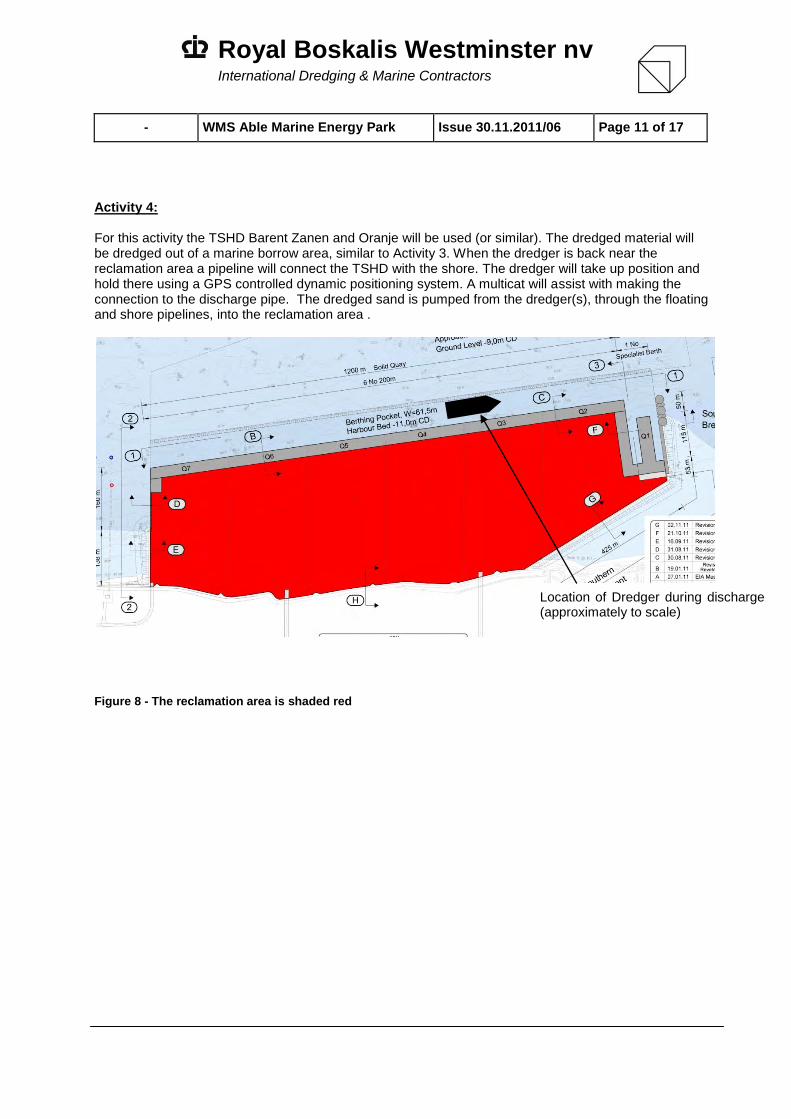
Activity 4: For this activity the TSHD Barent Zanen and Oranje will be used (or similar). The dredged material will be dredged out of a marine borrow area, similar to Activity 3. When the dredger is back near the reclamation area a pipeline will connect the TSHD with the shore. The dredger will take up position and hold there using a GPS controlled dynamic positioning system. A multicat will assist with making the connection to the discharge pipe. The dredged sand is pumped from the dredger(s), through the floating and shore pipelines, into the reclamation area .
Figure 8 - The reclamation area is shaded red
Location of Dredger during discharge (approximately to scale)
Royal Boskalis Westminster nv
International Dredging & Marine Contractors
- WMS Able Marine Energy Park Issue 30.11.2011/06 Page 12 of 17
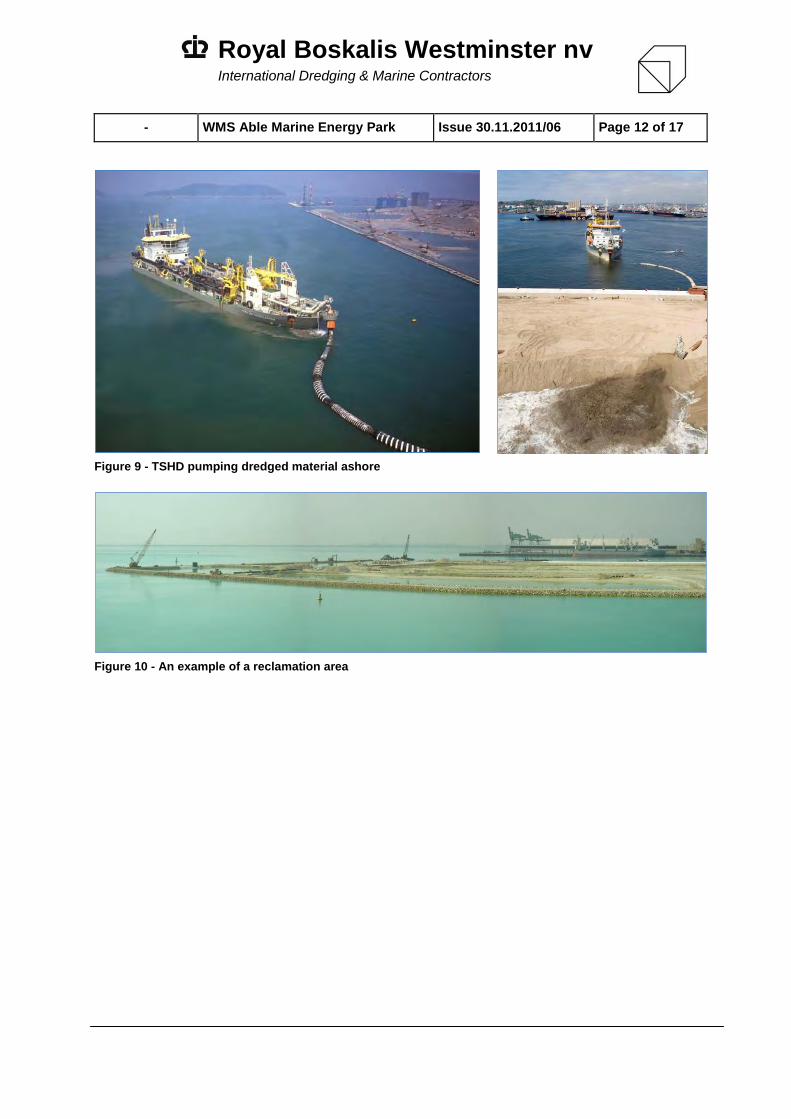
Figure 9 - TSHD pumping dredged material ashore
Figure 10 - An example of a reclamation area
Royal Boskalis Westminster nv
International Dredging & Marine Contractors
- WMS Able Marine Energy Park Issue 30.11.2011/06 Page 13 of 17
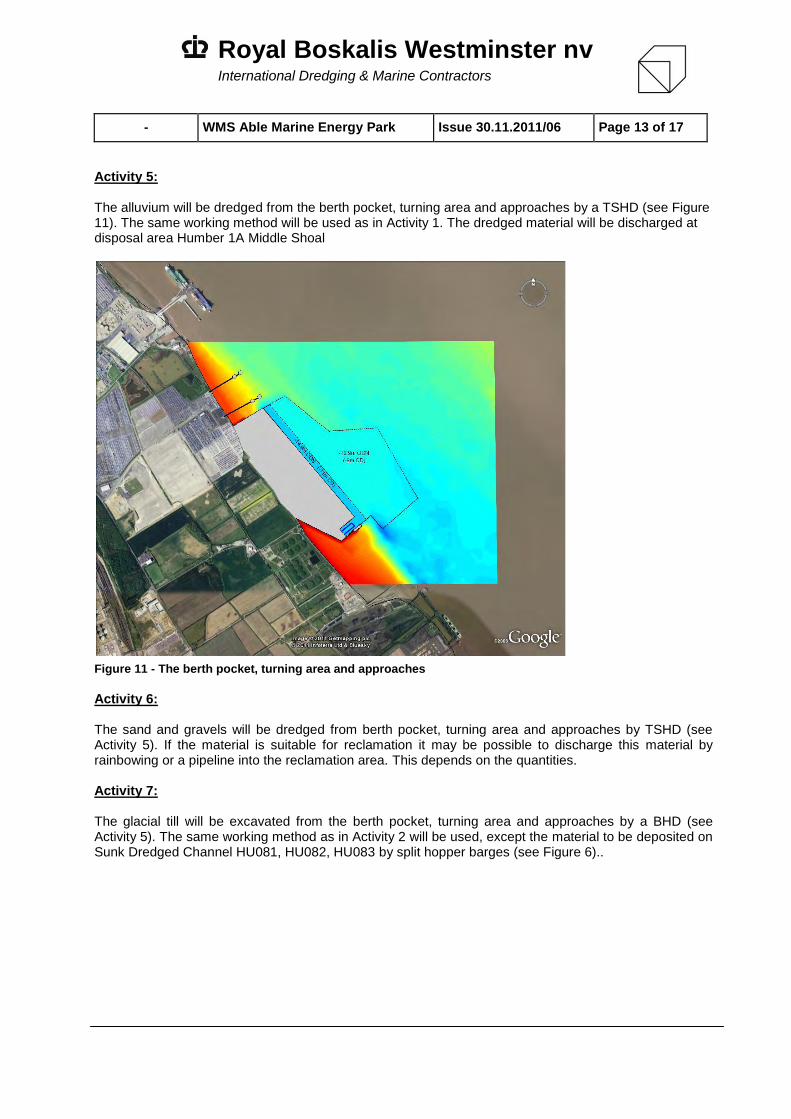
Activity 5: The alluvium will be dredged from the berth pocket, turning area and approaches by a TSHD (see Figure 11). The same working method will be used as in Activity 1. The dredged material will be discharged at disposal area Humber 1A Middle Shoal
Figure 11 - The berth pocket, turning area and approaches
Activity 6: The sand and gravels will be dredged from berth pocket, turning area and approaches by TSHD (see Activity 5). If the material is suitable for reclamation it may be possible to discharge this material by rainbowing or a pipeline into the reclamation area. This depends on the quantities. Activity 7: The glacial till will be excavated from the berth pocket, turning area and approaches by a BHD (see Activity 5). The same working method as in Activity 2 will be used, except the material to be deposited on Sunk Dredged Channel HU081, HU082, HU083 by split hopper barges (see Figure 6)..
Royal Boskalis Westminster nv
International Dredging & Marine Contractors
- WMS Able Marine Energy Park Issue 30.11.2011/06 Page 14 of 17
ID Task Name Duration
Mon 7 Jan
12 1 2 3 4 5 6 7 8
2 1.93hBarge 1 Load
3 4.5hBarge 1 Sail to Disposal Area, Discharge &
Return
5 4.5hBarge 2 Sail to Disposal Area, Discharge &
Return
8 1.93hBarge 1 Load
9 4.5hBarge 1 Sail to Disposal Area, Discharge &
Return
10 1.93hBarge 2 Load
11 4.5hBarge 2 Sail to Disposal Area, Discharge &
Return
12 1.93hBarge 3 Load
1 1d 2.97hNordic Giant
7 4.5hBarge 3 Sail to Disposal Area, Discharge &
Return
6 1.93hBarge 3 Load
4 1.93hBarge 2 Load
9 10 11 12 1 2 3 4 5 6 7 8 9 10 11
13 4.5hBarge 3 Sail to Disposal Area, Discharge &
Return
14
15
16
1.93hBarge 1 Load
4.5hBarge 1 Sail to Disposal Area, Discharge &
Return
17
18
19
20
21
1.93hBarge 2 Load
4.5hBarge 2 Sail to Disposal Area, Discharge &
Return
1.93hBarge 3 Load
4.5hBarge 3 Sail to Disposal Area, Discharge &
Return
12
1.93hBarge 1 Load
4.5hBarge 1 Sail to Disposal Area, Discharge &
Return
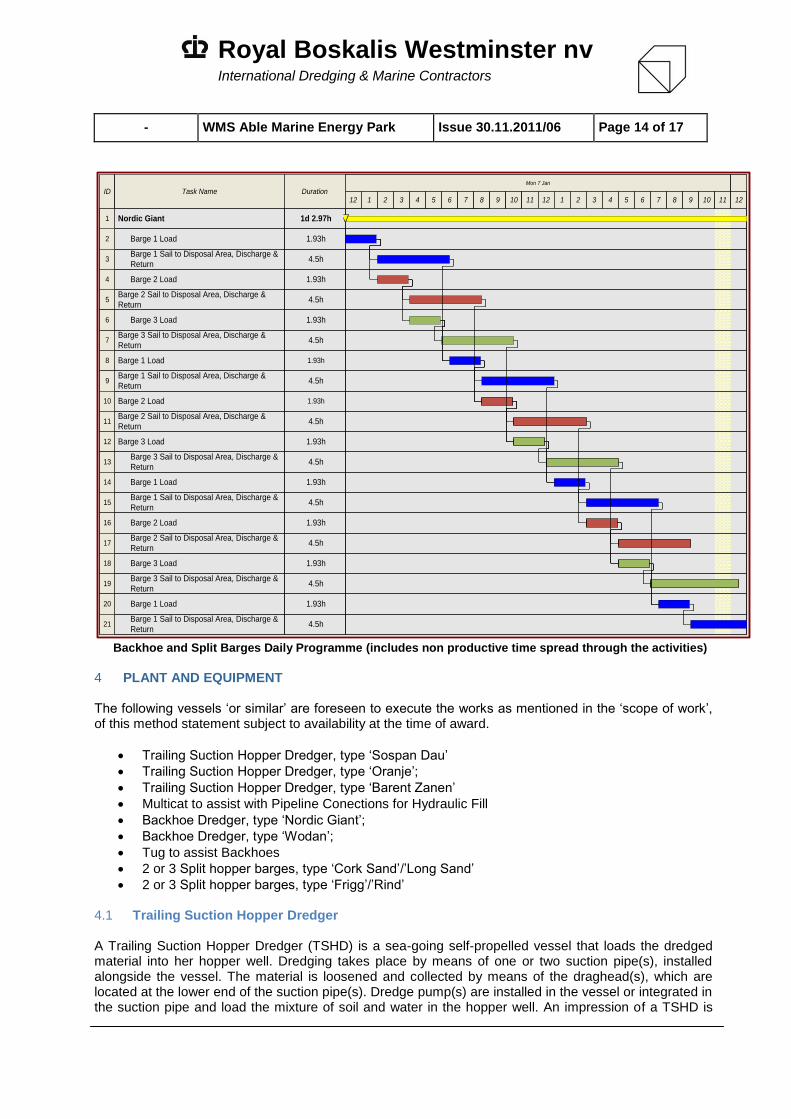
Backhoe and Split Barges Daily Programme (includes non productive time spread through the activities)
4 PLANT AND EQUIPMENT The following vessels ‘or similar’ are foreseen to execute the works as mentioned in the ‘scope of work’, of this method statement subject to availability at the time of award.
Trailing Suction Hopper Dredger, type ‘Sospan Dau’
Trailing Suction Hopper Dredger, type ‘Oranje’;
Trailing Suction Hopper Dredger, type ‘Barent Zanen’
Multicat to assist with Pipeline Conections for Hydraulic Fill
Backhoe Dredger, type ‘Nordic Giant’;
Backhoe Dredger, type ‘Wodan’;
Tug to assist Backhoes
2 or 3 Split hopper barges, type ‘Cork Sand’/’Long Sand’
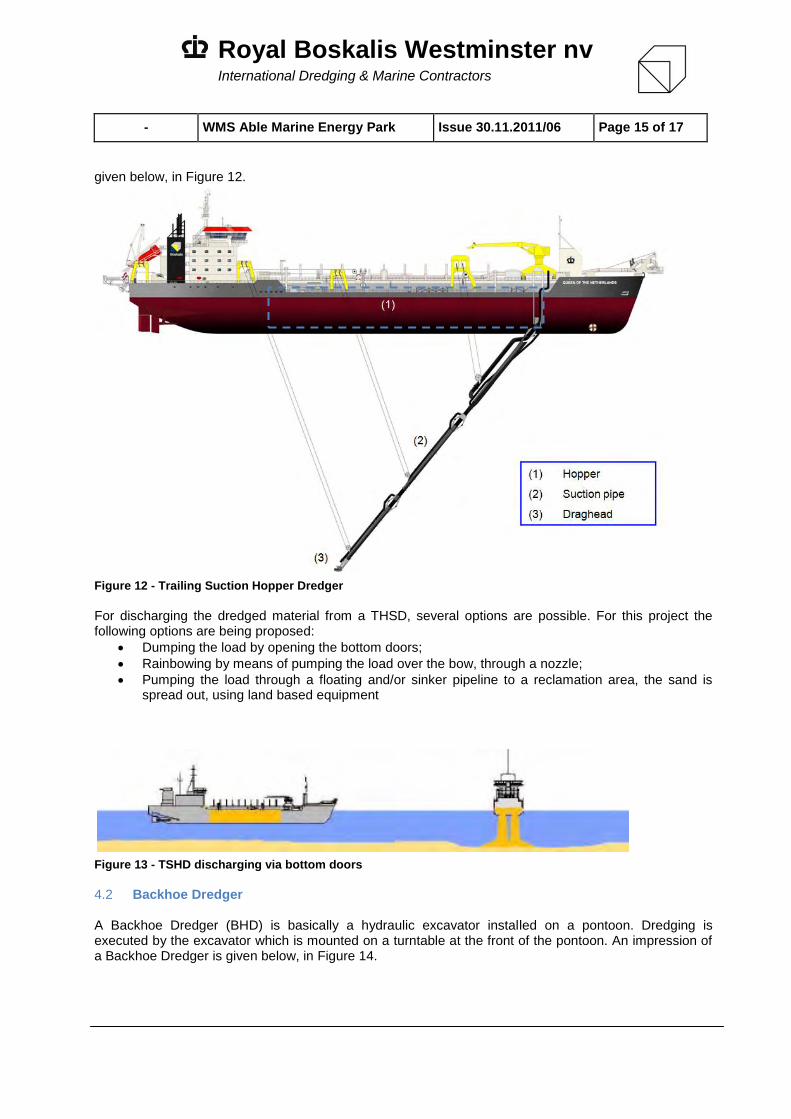
2 or 3 Split hopper barges, type ‘Frigg’/’Rind’ 4.1 Trailing Suction Hopper Dredger A Trailing Suction Hopper Dredger (TSHD) is a sea-going self-propelled vessel that loads the dredged material into her hopper well. Dredging takes place by means of one or two suction pipe(s), installed alongside the vessel. The material is loosened and collected by means of the draghead(s), which are located at the lower end of the suction pipe(s). Dredge pump(s) are installed in the vessel or integrated in the suction pipe and load the mixture of soil and water in the hopper well. An impression of a TSHD is
Royal Boskalis Westminster nv
International Dredging & Marine Contractors
- WMS Able Marine Energy Park Issue 30.11.2011/06 Page 15 of 17
given below, in Figure 12.
Figure 12 - Trailing Suction Hopper Dredger
For discharging the dredged material from a THSD, several options are possible. For this project the following options are being proposed:
Dumping the load by opening the bottom doors;
Rainbowing by means of pumping the load over the bow, through a nozzle;
Pumping the load through a floating and/or sinker pipeline to a reclamation area, the sand is spread out, using land based equipment
Figure 13 - TSHD discharging via bottom doors
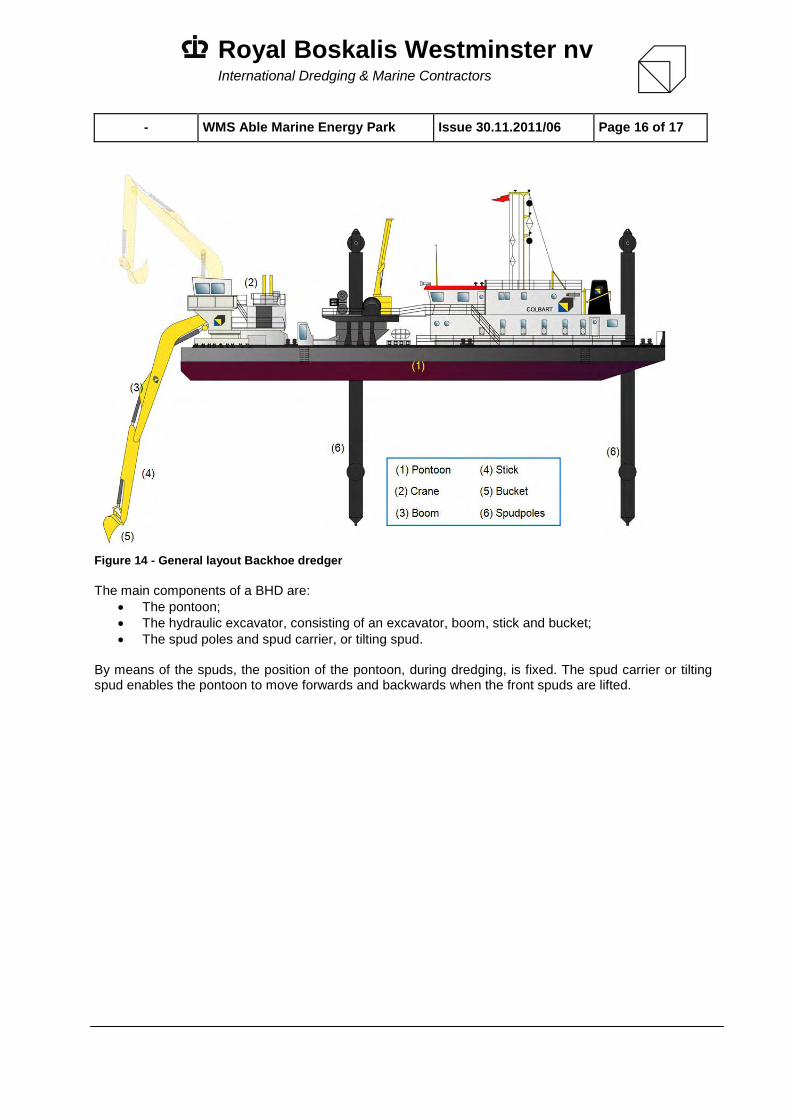
4.2 Backhoe Dredger A Backhoe Dredger (BHD) is basically a hydraulic excavator installed on a pontoon. Dredging is executed by the excavator which is mounted on a turntable at the front of the pontoon. An impression of a Backhoe Dredger is given below, in Figure 14.
Royal Boskalis Westminster nv
International Dredging & Marine Contractors
- WMS Able Marine Energy Park Issue 30.11.2011/06 Page 16 of 17
Figure 14 - General layout Backhoe dredger
The main components of a BHD are:
The pontoon;
The hydraulic excavator, consisting of an excavator, boom, stick and bucket;
The spud poles and spud carrier, or tilting spud. By means of the spuds, the position of the pontoon, during dredging, is fixed. The spud carrier or tilting spud enables the pontoon to move forwards and backwards when the front spuds are lifted.
Royal Boskalis Westminster nv
International Dredging & Marine Contractors
- WMS Able Marine Energy Park Issue 30.11.2011/06 Page 17 of 17
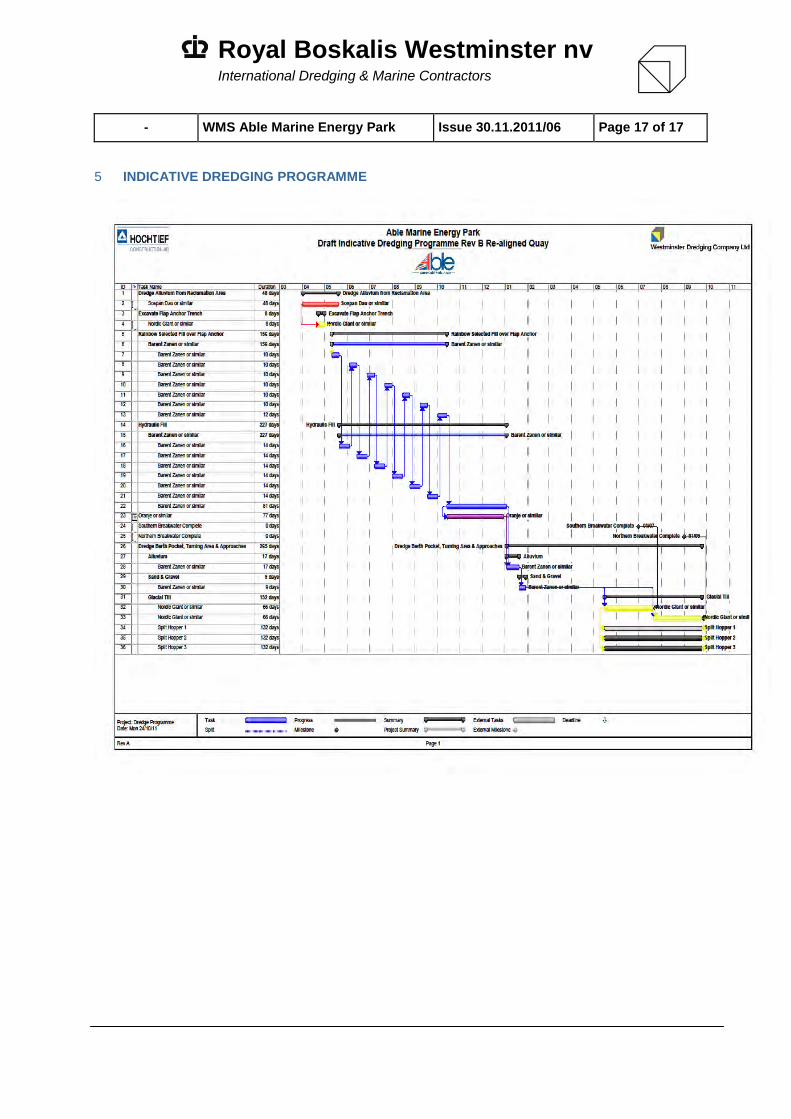
5 INDICATIVE DREDGING PROGRAMME
ABLE MARINE ENERGY PARK
DREDGING STRATEGY APRIL 2011
APPENDIX 3
DREDGE METHODOLOGY – SWEEPING AND PLOUGHING
(OUTFALL MAINTENANCE DREDGING)
Royal Boskalis Westminster nv
ABLE Marine Energy Park
Ploughing adjacent to Eon and Centrica Outfalls
Royal Boskalis WestminsteInternational Dredging & Marine Contractors
Work Method Statement
Sweeping and Ploughing
Revision Status
Rev Issue Date Reason for Issue
0.0 For Information
0.5
0.6
List of Changes to previous version
TABLE OF CONTENTS
1� Ploughing ................................
1.1� Introduction to Ploughing
1.2� Working method ................................
1.3� Plough control ................................
1.4� Effectiveness and Production
adjacent to Eon and Centrica Outfalls Issue 2011.11.16
Royal Boskalis Westminster nvInternational Dredging & Marine Contractors
Work Method Statement
Sweeping and Ploughing
Reason for Issue Prepared
For Information WSHI
Changes to previous version
................................................................................................................................
loughing ................................................................................................
................................................................................................
................................................................................................
and Production ................................................................................................
Page 1 of 4
Checked Approved
-
............................................2�
............................................2�
.........................................................3�
.............................................................4�
.....................................4�
ABLE Marine Energy Park
Ploughing adjacent to Eon and Centrica Outfalls
Royal Boskalis WestminsteInternational Dredging & Marine Contractors
1 PLOUGHING AT ABLE MARINE ENERG
The HR Wallingford mud modelling
around the outfalls from the Eon and Centrica power
this silt could be removed by ploughing.
1.1 Introduction to Ploughing
A cost effective method of maintaining a
bar. A plough can be used for levelling
either be self-propelled or pushed
Several applications of a plough
• Leveling of an uneven seabed, for example
• Work in combination with a Trailing Suction Hopper
behind by the drag head
• Achieving tighter seabed tolerances, for example
another structure, such as a caiss
• Moving of material from areas which are difficult t
areas, for example from
• Sweeping of debris, large boulders or stones, prior to rem
A plough spread may be installed on a barge or on the aft
spread consists of one or more winches, A
devices to measure and control the horizontal and v
For the works at ABLE Marine Energy Park we would p
such as the Norma (specification sheet attached)
adjacent to Eon and Centrica Outfalls Issue 2011.11.16
Royal Boskalis Westminster nvInternational Dredging & Marine Contractors
AT ABLE MARINE ENERGY PARK
mud modelling report suggests that there may be a detrimental
around the outfalls from the Eon and Centrica power plants. This method statement briefly describes ho
this silt could be removed by ploughing.
loughing
maintaining a required depth can be achieved by using a plough
A plough can be used for levelling materials such as clay, silt, sand and gravel
pushed/pulled by a tug.
Several applications of a plough vessel can be:
Leveling of an uneven seabed, for example underwater sand waves
Work in combination with a Trailing Suction Hopper Dredger (TSHD) for
seabed tolerances, for example when a dredged seabed is being used for
another structure, such as a caisson, tunnel element or revetment
Moving of material from areas which are difficult to reach by dredgers to more easily reachable
the corners of basins or busy waterways
g of debris, large boulders or stones, prior to removal with more specialized equipment.
may be installed on a barge or on the aft-deck of a self propelled vessel.
spread consists of one or more winches, A-frame(s), a plough or levelling beam, pulling wires
devices to measure and control the horizontal and vertical positioning of the levelling beam.
For the works at ABLE Marine Energy Park we would propose utilising one of our self
(specification sheet attached) or F48.
Page 2 of 4
detrimental build up of silts
plants. This method statement briefly describes how
using a plough or levelling
sand and gravel. A plough vessel can
for leveling the ridges left
abed is being used for
o reach by dredgers to more easily reachable
with more specialized equipment.
deck of a self propelled vessel. A standard
frame(s), a plough or levelling beam, pulling wires and
itioning of the levelling beam.
ropose utilising one of our self-propelled vessels
ABLE Marine Energy Park
Ploughing adjacent to Eon and Centrica Outfalls
Royal Boskalis WestminsteInternational Dredging & Marine Contractors
1.2 Working method
The levelling beam is suspended on one or more wire
winches which vertically control the plough. In
connected to the bow of the vessel to absorb the ho
Generally, the most effective way t
layers of 100 to 200mm in each pass
adjacent to Eon and Centrica Outfalls Issue 2011.11.16
Royal Boskalis Westminster nvInternational Dredging & Marine Contractors
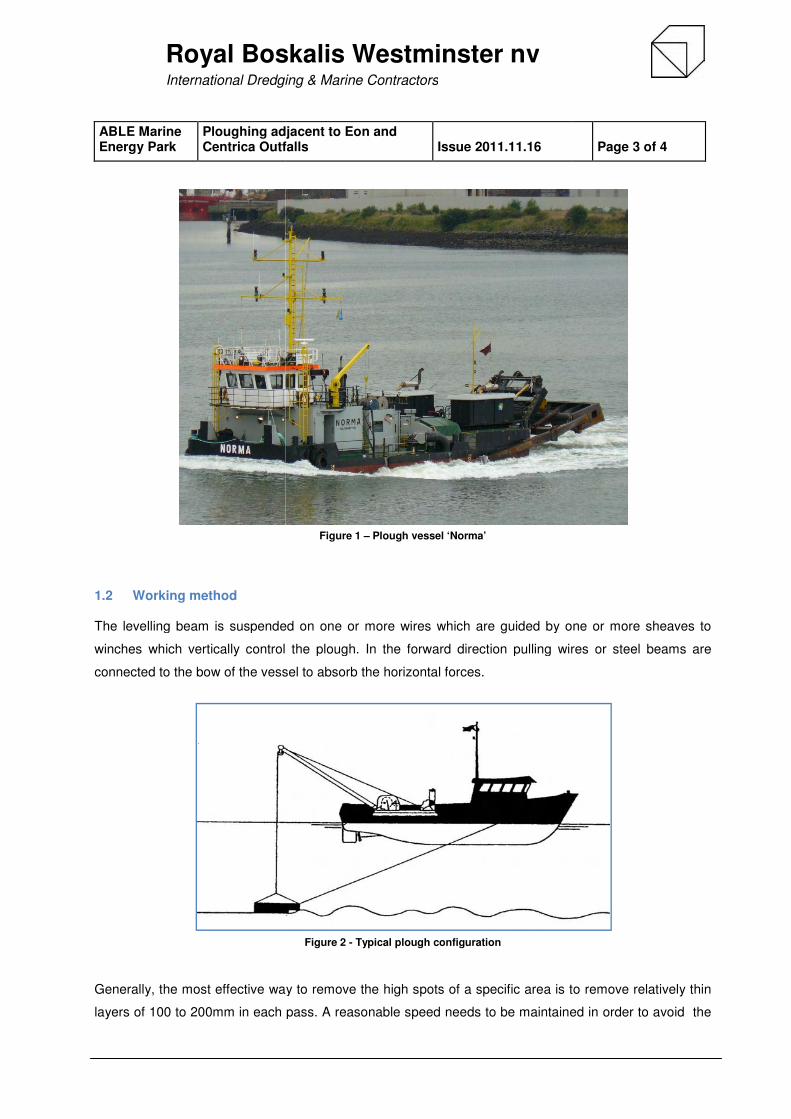
Figure 1 – Plough vessel ‘Norma’
The levelling beam is suspended on one or more wires which are guided by one or more sheave
control the plough. In the forward direction pulling wires or steel beams are
connected to the bow of the vessel to absorb the horizontal forces.
Figure 2 - Typical plough configuration
, the most effective way to remove the high spots of a specific area is to
each pass. A reasonable speed needs to be maintained in order to
Page 3 of 4
by one or more sheaves to
forward direction pulling wires or steel beams are
area is to remove relatively thin
ed in order to avoid the
ABLE Marine Energy Park
Ploughing adjacent to Eon and Centrica Outfalls
Royal Boskalis WestminsteInternational Dredging & Marine Contractors
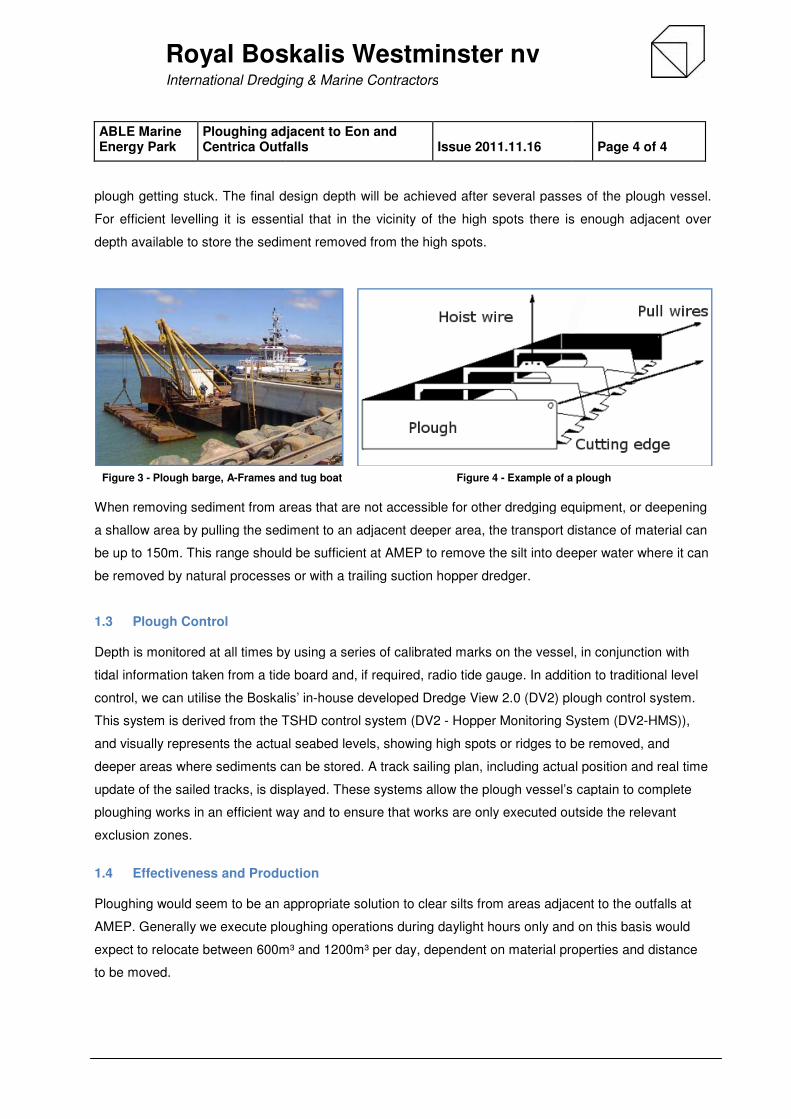
plough getting stuck. The final design depth will be achieved after several p
For efficient levelling it is essential
depth available to store the sediment removed from the high spots.
Figure 3 - Plough barge, A-Frames and tug boat
When removing sediment from areas that are not accessibl
a shallow area by pulling the sediment to an adjace
be up to 150m. This range should be
be removed by natural processes
1.3 Plough Control
Depth is monitored at all times by using a series o
tidal information taken from a tide board and, if r
control, we can utilise the Boskalis’ in
This system is derived from the TSHD
and visually represents the actual
deeper areas where sediments can be stored.
update of the sailed tracks, is displayed
ploughing works in an efficient way
exclusion zones.
1.4 Effectiveness and Production
Ploughing would seem to be an appropriate solution to clear silts from area
AMEP. Generally we execute ploughing operations during da
expect to relocate between 600m
to be moved.
adjacent to Eon and Centrica Outfalls Issue 2011.11.16
Royal Boskalis Westminster nvInternational Dredging & Marine Contractors
final design depth will be achieved after several passes of the plough
essential that in the vicinity of the high spots there is enough
to store the sediment removed from the high spots.
and tug boat Figure 4 - Example of a
removing sediment from areas that are not accessible for other dredging equipment
a shallow area by pulling the sediment to an adjacent deeper area, the transport distance
should be sufficient at AMEP to remove the silt into deeper water where it can
be removed by natural processes or with a trailing suction hopper dredger.
Depth is monitored at all times by using a series of calibrated marks on the vessel, in conjunction wi
tidal information taken from a tide board and, if required, radio tide gauge. In additio
Boskalis’ in-house developed Dredge View 2.0 (DV2) plough control system.
This system is derived from the TSHD control system (DV2 - Hopper Monitoring System (DV2
actual seabed levels, showing high spots or ridges to be removed
sediments can be stored. A track sailing plan, including actual position and real time
displayed. These systems allow the plough vessel’s capt
ploughing works in an efficient way and to ensure that works are only executed outside
and Production
be an appropriate solution to clear silts from areas adjacent to the
Generally we execute ploughing operations during daylight hours only and on this basis would
expect to relocate between 600m³ and 1200m³ per day, dependent on material propert
Page 4 of 4
asses of the plough vessel.
of the high spots there is enough adjacent over
a plough
e for other dredging equipment, or deepening
distance of material can
into deeper water where it can
f calibrated marks on the vessel, in conjunction with
equired, radio tide gauge. In addition to traditional level
(DV2) plough control system.
Hopper Monitoring System (DV2-HMS)),
high spots or ridges to be removed, and
including actual position and real time
vessel’s captain to complete
and to ensure that works are only executed outside the relevant
s adjacent to the outfalls at
ylight hours only and on this basis would
³ and 1200m³ per day, dependent on material properties and distance

ABLE MARINE ENERGY PARK
DREDGING STRATEGY APRIL 2011
APPENDIX 4
CEFAS RESULTS FOR ADDITIONAL TESTING
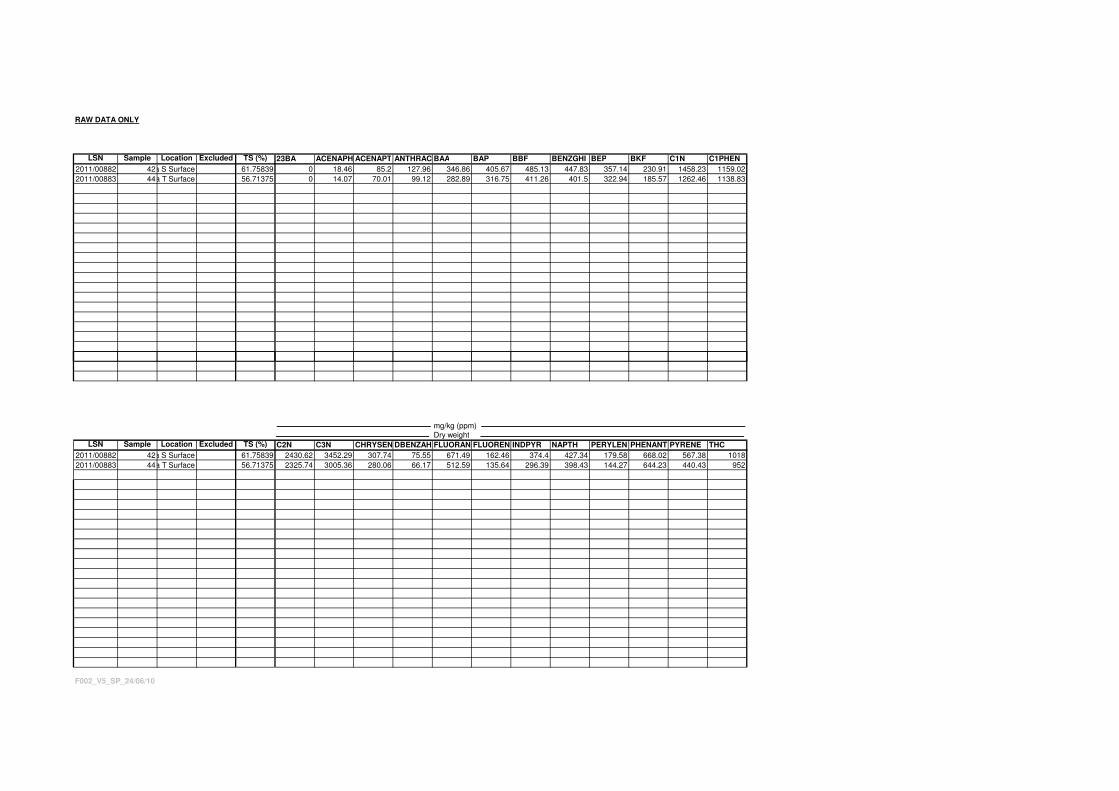
RAW DATA ONLY
LSN Sample Location Excluded TS (%) 23BA ACENAPH ACENAPT ANTHRAC BAA BAP BBF BENZGHI BEP BKF C1N C1PHEN
2011/00882 42Reclamation Area S Surface 61.75839 0 18.46 85.2 127.96 346.86 405.67 485.13 447.83 357.14 230.91 1458.23 1159.02
2011/00883 44Reclamation Area T Surface 56.71375 0 14.07 70.01 99.12 282.89 316.75 411.26 401.5 322.94 185.57 1262.46 1138.83
mg/kg (ppm)
Dry weight
LSN Sample Location Excluded TS (%) C2N C3N CHRYSEN DBENZAH FLUORAN FLUOREN INDPYR NAPTH PERYLEN PHENANT PYRENE THC
2011/00882 42Reclamation Area S Surface 61.75839 2430.62 3452.29 307.74 75.55 671.49 162.46 374.4 427.34 179.58 668.02 567.38 1018
2011/00883 44Reclamation Area T Surface 56.71375 2325.74 3005.36 280.06 66.17 512.59 135.64 296.39 398.43 144.27 644.23 440.43 952
F002_V5_SP_24/06/10
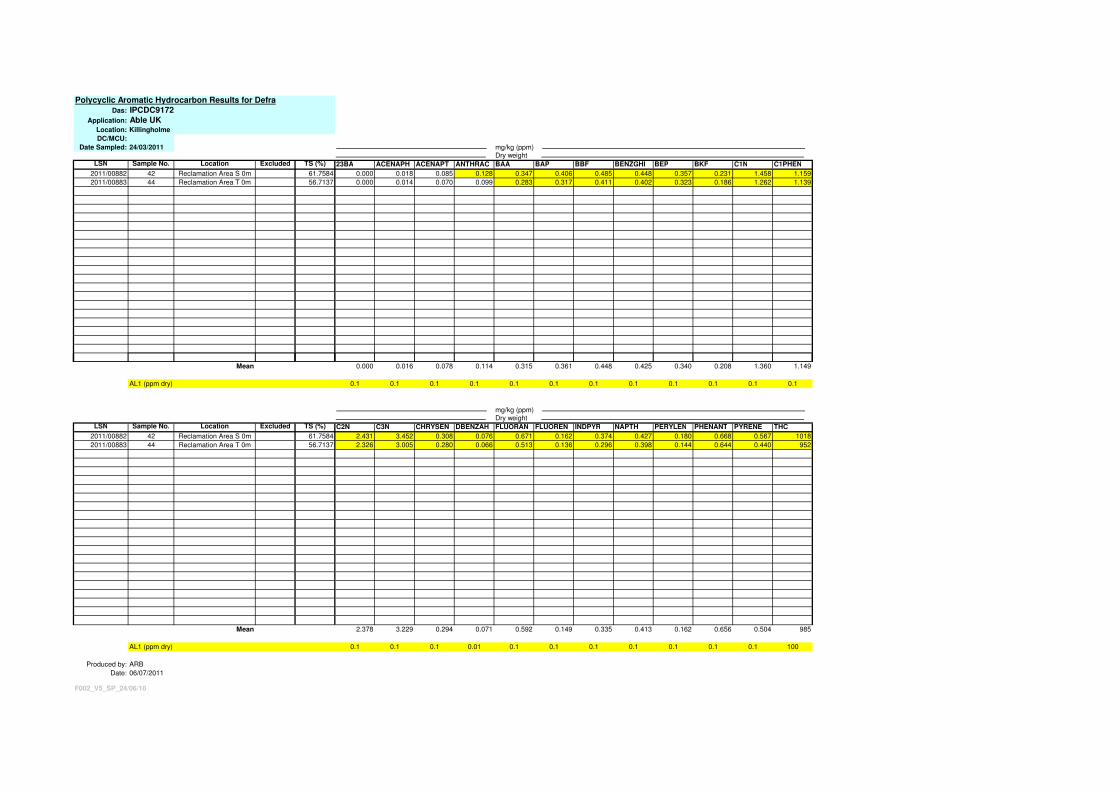
Polycyclic Aromatic Hydrocarbon Results for DefraDas: IPCDC9172
Application: Able UKLocation: Killingholme
DC/MCU:
Date Sampled: 24/03/2011 mg/kg (ppm)Dry weight
LSN Sample No. Location Excluded TS (%) 23BA ACENAPH ACENAPT ANTHRAC BAA BAP BBF BENZGHI BEP BKF C1N C1PHEN
2011/00882 42 Reclamation Area S 0m 61.7584 0.000 0.018 0.085 0.128 0.347 0.406 0.485 0.448 0.357 0.231 1.458 1.159
2011/00883 44 Reclamation Area T 0m 56.7137 0.000 0.014 0.070 0.099 0.283 0.317 0.411 0.402 0.323 0.186 1.262 1.139
Mean 0.000 0.016 0.078 0.114 0.315 0.361 0.448 0.425 0.340 0.208 1.360 1.149
AL1 (ppm dry) 0.1 0.1 0.1 0.1 0.1 0.1 0.1 0.1 0.1 0.1 0.1 0.1
mg/kg (ppm)Dry weight
LSN Sample No. Location Excluded TS (%) C2N C3N CHRYSEN DBENZAH FLUORAN FLUOREN INDPYR NAPTH PERYLEN PHENANT PYRENE THC
2011/00882 42 Reclamation Area S 0m 61.7584 2.431 3.452 0.308 0.076 0.671 0.162 0.374 0.427 0.180 0.668 0.567 1018
2011/00883 44 Reclamation Area T 0m 56.7137 2.326 3.005 0.280 0.066 0.513 0.136 0.296 0.398 0.144 0.644 0.440 952
Mean 2.378 3.229 0.294 0.071 0.592 0.149 0.335 0.413 0.162 0.656 0.504 985
AL1 (ppm dry) 0.1 0.1 0.1 0.01 0.1 0.1 0.1 0.1 0.1 0.1 0.1 100
Produced by: ARB
Date: 06/07/2011
F002_V5_SP_24/06/10

Polycyclic Aromatic Hydrocarbon Results for DefraDas: IPCDC9172
Application: Able UK
Location: KillingholmeDC/MCU: 0
Date Sampled: 24/03/2011 ug/kg (ppb)Wet weight
LSN Sample No. Location Excluded 23BA ACENAPH ACENAPT ANTHRAC BAA BAP BBF BENZGHI BEP BKF C1N C1PHEN
2011/00882 42 Reclamation Area S 0m 0 11.4 52.6 79 214 251 300 277 221 143 901 716
2011/00883 44 Reclamation Area T 0m 0 7.98 39.7 56.2 160 180 233 228 183 105 716 646
Mean wet weight for PR details ppb (THC ppm) 0 9.69 46.2 67.6 187 216 267 253 202 124 809 681
ug/kg (ppb) mg/kg (ppm)Wet weight
LSN Sample No. Location Excluded C2N C3N CHRYSEN DBENZAH FLUORAN FLUOREN INDPYR NAPTH PERYLEN PHENANT PYRENE THC
2011/00882 42 Reclamation Area S 0m 1500 2130 190 46.7 415 100 231 264 111 413 350 629
2011/00883 44 Reclamation Area T 0m 1320 1700 159 37.5 291 76.9 168 226 81.8 365 250 540
Mean wet weight for PR details ppb (THC ppm) 1410 1920 175 42.1 353 88.5 200 245 96.4 389 300 585
Produced by: ARB
Date: 06/07/2011
F002_V5_SP_24/06/10
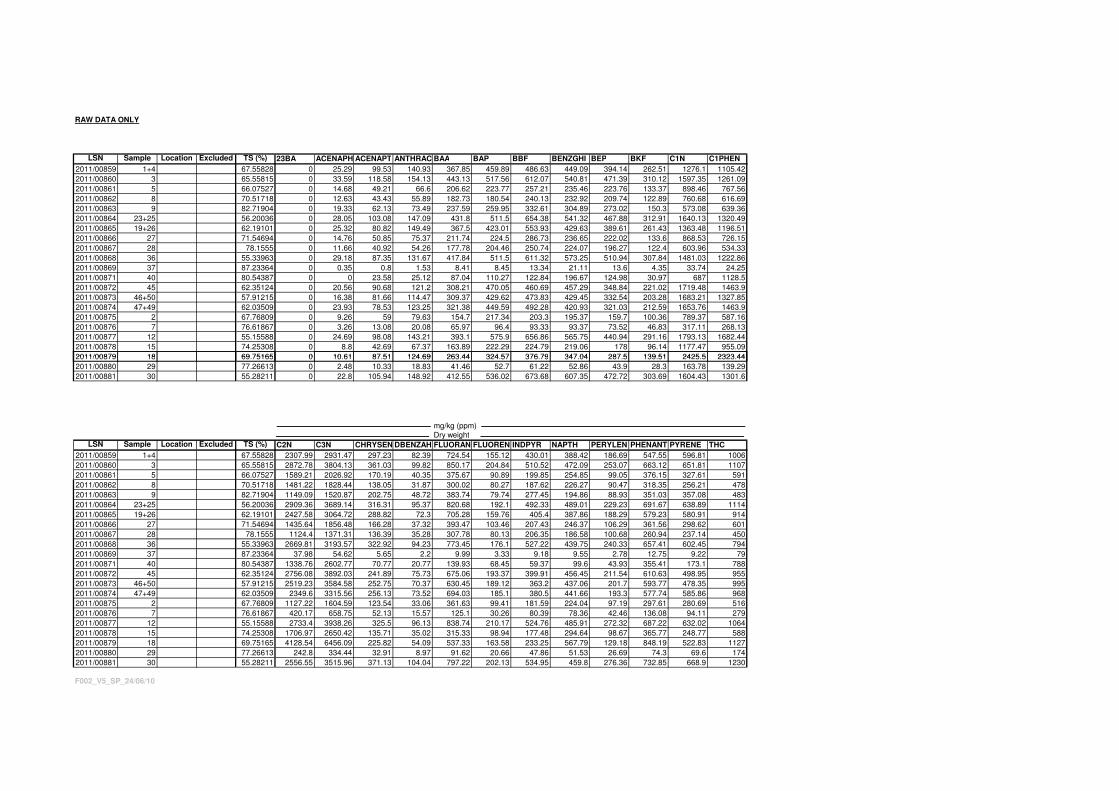
RAW DATA ONLY
LSN Sample Location Excluded TS (%) 23BA ACENAPH ACENAPT ANTHRAC BAA BAP BBF BENZGHI BEP BKF C1N C1PHEN
2011/00859 1+4 67.55828 0 25.29 99.53 140.93 367.85 459.89 486.63 449.09 394.14 262.51 1276.1 1105.42
2011/00860 3 65.55815 0 33.59 118.58 154.13 443.13 517.56 612.07 540.81 471.39 310.12 1597.35 1261.09
2011/00861 5 66.07527 0 14.68 49.21 66.6 206.62 223.77 257.21 235.46 223.76 133.37 898.46 767.56
2011/00862 8 70.51718 0 12.63 43.43 55.89 182.73 180.54 240.13 232.92 209.74 122.89 760.68 616.69
2011/00863 9 82.71904 0 19.33 62.13 73.49 237.59 259.95 332.61 304.89 273.02 150.3 573.08 639.36
2011/00864 23+25 56.20036 0 28.05 103.08 147.09 431.8 511.5 654.38 541.32 467.88 312.91 1640.13 1320.49
2011/00865 19+26 62.19101 0 25.32 80.82 149.49 367.5 423.01 553.93 429.63 389.61 261.43 1363.48 1196.51
2011/00866 27 71.54694 0 14.76 50.85 75.37 211.74 224.5 286.73 236.65 222.02 133.6 868.53 726.15
2011/00867 28 78.1555 0 11.66 40.92 54.26 177.78 204.46 250.74 224.07 196.27 122.4 603.96 534.33
2011/00868 36 55.33963 0 29.18 87.35 131.67 417.84 511.5 611.32 573.25 510.94 307.84 1481.03 1222.86
2011/00869 37 87.23364 0 0.35 0.8 1.53 8.41 8.45 13.34 21.11 13.6 4.35 33.74 24.25
2011/00871 40 80.54387 0 0 23.58 25.12 87.04 110.27 122.84 196.67 124.98 30.97 687 1128.5
2011/00872 45 62.35124 0 20.56 90.68 121.2 308.21 470.05 460.69 457.29 348.84 221.02 1719.48 1463.9
2011/00873 46+50 57.91215 0 16.38 81.66 114.47 309.37 429.62 473.83 429.45 332.54 203.28 1683.21 1327.85
2011/00874 47+49 62.03509 0 23.93 78.53 123.25 321.38 449.59 492.28 420.93 321.03 212.59 1653.76 1463.9
2011/00875 2 67.76809 0 9.26 59 79.63 154.7 217.34 203.3 195.37 159.7 100.36 789.37 587.16
2011/00876 7 76.61867 0 3.26 13.08 20.08 65.97 96.4 93.33 93.37 73.52 46.83 317.11 268.13
2011/00877 12 55.15588 0 24.69 98.08 143.21 393.1 575.9 656.86 565.75 440.94 291.16 1793.13 1682.44
2011/00878 15 74.25308 0 8.8 42.69 67.37 163.89 222.29 224.79 219.06 178 96.14 1177.47 955.09
2011/00879 18 69.75165 0 10.61 87.51 124.69 263.44 324.57 376.79 347.04 287.5 139.51 2425.5 2323.442011/00879 18 69.75165 0 10.61 87.51 124.69 263.44 324.57 376.79 347.04 287.5 139.51 2425.5 2323.44
2011/00880 29 77.26613 0 2.48 10.33 18.83 41.46 52.7 61.22 52.86 43.9 28.3 163.78 139.29
2011/00881 30 55.28211 0 22.8 105.94 148.92 412.55 536.02 673.68 607.35 472.72 303.69 1604.43 1301.6
mg/kg (ppm)
Dry weight
LSN Sample Location Excluded TS (%) C2N C3N CHRYSEN DBENZAH FLUORAN FLUOREN INDPYR NAPTH PERYLEN PHENANT PYRENE THC
2011/00859 1+4 67.55828 2307.99 2931.47 297.23 82.39 724.54 155.12 430.01 388.42 186.69 547.55 596.81 1006
2011/00860 3 65.55815 2872.78 3804.13 361.03 99.82 850.17 204.84 510.52 472.09 253.07 663.12 651.81 1107
2011/00861 5 66.07527 1589.21 2026.92 170.19 40.35 375.67 90.89 199.85 254.85 99.05 376.15 327.61 591
2011/00862 8 70.51718 1481.22 1828.44 138.05 31.87 300.02 80.27 187.62 226.27 90.47 318.35 256.21 478
2011/00863 9 82.71904 1149.09 1520.87 202.75 48.72 383.74 79.74 277.45 194.86 88.93 351.03 357.08 483
2011/00864 23+25 56.20036 2909.36 3689.14 316.31 95.37 820.68 192.1 492.33 489.01 229.23 691.67 638.89 1114
2011/00865 19+26 62.19101 2427.58 3064.72 288.82 72.3 705.28 159.76 405.4 387.86 188.29 579.23 580.91 914
2011/00866 27 71.54694 1435.64 1856.48 166.28 37.32 393.47 103.46 207.43 246.37 106.29 361.56 298.62 601
2011/00867 28 78.1555 1124.4 1371.31 136.39 35.28 307.78 80.13 206.35 186.58 100.68 260.94 237.14 450
2011/00868 36 55.33963 2669.81 3193.57 322.92 94.23 773.45 176.1 527.22 439.75 240.33 657.41 602.45 794
2011/00869 37 87.23364 37.98 54.62 5.65 2.2 9.99 3.33 9.18 9.55 2.78 12.75 9.22 79
2011/00871 40 80.54387 1338.76 2602.77 70.77 20.77 139.93 68.45 59.37 99.6 43.93 355.41 173.1 788
2011/00872 45 62.35124 2756.08 3892.03 241.89 75.73 675.06 193.37 399.91 456.45 211.54 610.63 498.95 955
2011/00873 46+50 57.91215 2519.23 3584.58 252.75 70.37 630.45 189.12 363.2 437.06 201.7 593.77 478.35 995
2011/00874 47+49 62.03509 2349.6 3315.56 256.13 73.52 694.03 185.1 380.5 441.66 193.3 577.74 585.86 968
2011/00875 2 67.76809 1127.22 1604.59 123.54 33.06 361.63 99.41 181.59 224.04 97.19 297.61 280.69 516
2011/00876 7 76.61867 420.17 658.75 52.13 15.57 125.1 30.26 80.39 78.36 42.46 136.08 94.11 279
2011/00877 12 55.15588 2733.4 3938.26 325.5 96.13 838.74 210.17 524.76 485.91 272.32 687.22 632.02 1064
2011/00878 15 74.25308 1706.97 2650.42 135.71 35.02 315.33 98.94 177.48 294.64 98.67 365.77 248.77 588
2011/00879 18 69.75165 4128.54 6456.09 225.82 54.09 537.33 163.58 233.25 567.79 129.18 848.19 522.83 1127
2011/00880 29 77.26613 242.8 334.44 32.91 8.97 91.62 20.66 47.86 51.53 26.69 74.3 69.6 174
2011/00881 30 55.28211 2556.55 3515.96 371.13 104.04 797.22 202.13 534.95 459.8 276.36 732.85 668.9 1230
F002_V5_SP_24/06/10
Polycyclic Aromatic Hydrocarbon Results for DefraDas: IPCDC9172
Application: Able UKLocation: Killingholme
DC/MCU:
Date Sampled: 24/03/2011 mg/kg (ppm)Dry weight
LSN Sample No. Location Excluded TS (%) 23BA ACENAPH ACENAPT ANTHRAC BAA BAP BBF BENZGHI BEP BKF C1N C1PHEN
2011/00859 1+4 Turning Area A+C surface 67.5583 0.000 0.025 0.100 0.141 0.368 0.460 0.487 0.449 0.394 0.263 1.276 1.105
2011/00860 3 Turning Area B 1.0m 65.5582 0.000 0.034 0.119 0.154 0.443 0.518 0.612 0.541 0.471 0.310 1.597 1.261
2011/00861 5 Approach Channel D 0m 66.0753 0.000 0.015 0.049 0.067 0.207 0.224 0.257 0.235 0.224 0.133 0.898 0.768
2011/00862 8 Approach Channel E 1.0m 70.5172 0.000 0.013 0.043 0.056 0.183 0.181 0.240 0.233 0.210 0.123 0.761 0.617
2011/00863 9 Berthing Pocket F 0m 82.7190 0.000 0.019 0.062 0.073 0.238 0.260 0.333 0.305 0.273 0.150 0.573 0.639
2011/00864 23+25 Berthing Pocket K+L 0m 56.2004 0.000 0.028 0.103 0.147 0.432 0.512 0.654 0.541 0.468 0.313 1.640 1.320
2011/00865 19+26 Approach Channel I+L 1.0m 62.1910 0.000 0.025 0.081 0.149 0.368 0.423 0.554 0.430 0.390 0.261 1.363 1.197
2011/00866 27 Approach Channel M 0m 71.5469 0.000 0.015 0.051 0.075 0.212 0.225 0.287 0.237 0.222 0.134 0.869 0.726
2011/00867 28 Approach Channel M 1.0m 78.1555 0.000 0.012 0.041 0.054 0.178 0.204 0.251 0.224 0.196 0.122 0.604 0.534
2011/00868 36 Berthing Pocket Q 0m 55.3396 0.000 0.029 0.087 0.132 0.418 0.512 0.611 0.573 0.511 0.308 1.481 1.223
2011/00869 37 Berthing Pocket Q 1.0m 87.2336 0.000 0.000 0.001 0.002 0.008 0.008 0.013 0.021 0.014 0.004 0.034 0.024
2011/00871 40 Reclamation Area R 0m 80.5439 0.000 0.000 0.024 0.025 0.087 0.110 0.123 0.197 0.125 0.031 0.687 1.129
2011/00872 45 Reclamation Area T 1.0m 62.3512 0.000 0.021 0.091 0.121 0.308 0.470 0.461 0.457 0.349 0.221 1.719 1.464
2011/00873 46+48+50 Reclamation Area U+V+W 0m 57.9122 0.000 0.016 0.082 0.114 0.309 0.430 0.474 0.429 0.333 0.203 1.683 1.328
2011/00874 47+49 Reclamation Area U+V 1m 62.0351 0.000 0.024 0.079 0.123 0.321 0.450 0.492 0.421 0.321 0.213 1.654 1.464
2011/00875 2 Turning Area B 0m 67.7681 0.000 0.009 0.059 0.080 0.155 0.217 0.203 0.195 0.160 0.100 0.789 0.587
2011/00876 7 Approach Channel E 0m 76.6187 0.000 0.003 0.013 0.020 0.066 0.096 0.093 0.093 0.074 0.047 0.317 0.268
2011/00877 12 Berthing Pocket G 0m 55.1559 0.000 0.025 0.098 0.143 0.393 0.576 0.657 0.566 0.441 0.291 1.793 1.682
2011/00878 15 Anchorage Trench H 0m 74.2531 0.000 0.009 0.043 0.067 0.164 0.222 0.225 0.219 0.178 0.096 1.177 0.955
2011/00879 18 Aproach Channel I 0m 69.7516 0.000 0.011 0.088 0.125 0.263 0.325 0.377 0.347 0.288 0.140 2.426 2.323
2011/00880 29 Approach Channel N 0m 77.2661 0.000 0.002 0.010 0.019 0.041 0.053 0.061 0.053 0.044 0.028 0.164 0.139
2011/00881 30 Approach Channel N 1.0m 55.2821 0.000 0.023 0.106 0.149 0.413 0.536 0.674 0.607 0.473 0.304 1.604 1.3022011/00881 30 Approach Channel N 1.0m 55.2821 0.000 0.023 0.106 0.149 0.413 0.536 0.674 0.607 0.473 0.304 1.604 1.302
Mean 0.000 0.016 0.065 0.093 0.253 0.319 0.370 0.335 0.280 0.173 1.141 1.003
AL1 (ppm dry) 0.1 0.1 0.1 0.1 0.1 0.1 0.1 0.1 0.1 0.1 0.1 0.1
mg/kg (ppm)Dry weight
LSN Sample No. Location Excluded TS (%) C2N C3N CHRYSEN DBENZAH FLUORAN FLUOREN INDPYR NAPTH PERYLEN PHENANT PYRENE THC
2011/00859 1+4 Turning Area A+C surface 67.5583 2.308 2.931 0.297 0.082 0.725 0.155 0.430 0.388 0.187 0.548 0.597 1006
2011/00860 3 Turning Area B 1.0m 65.5582 2.873 3.804 0.361 0.100 0.850 0.205 0.511 0.472 0.253 0.663 0.652 1107
2011/00861 5 Approach Channel D 0m 66.0753 1.589 2.027 0.170 0.040 0.376 0.091 0.200 0.255 0.099 0.376 0.328 591
2011/00862 8 Approach Channel E 1.0m 70.5172 1.481 1.828 0.138 0.032 0.300 0.080 0.188 0.226 0.090 0.318 0.256 478
2011/00863 9 Berthing Pocket F 0m 82.7190 1.149 1.521 0.203 0.049 0.384 0.080 0.277 0.195 0.089 0.351 0.357 483
2011/00864 23+25 Berthing Pocket K+L 0m 56.2004 2.909 3.689 0.316 0.095 0.821 0.192 0.492 0.489 0.229 0.692 0.639 1114
2011/00865 19+26 Approach Channel I+L 1.0m 62.1910 2.428 3.065 0.289 0.072 0.705 0.160 0.405 0.388 0.188 0.579 0.581 914
2011/00866 27 Approach Channel M 0m 71.5469 1.436 1.856 0.166 0.037 0.393 0.103 0.207 0.246 0.106 0.362 0.299 601
2011/00867 28 Approach Channel M 1.0m 78.1555 1.124 1.371 0.136 0.035 0.308 0.080 0.206 0.187 0.101 0.261 0.237 450
2011/00868 36 Berthing Pocket Q 0m 55.3396 2.670 3.194 0.323 0.094 0.773 0.176 0.527 0.440 0.240 0.657 0.602 794
2011/00869 37 Berthing Pocket Q 1.0m 87.2336 0.038 0.055 0.006 0.002 0.010 0.003 0.009 0.010 0.003 0.013 0.009 79
2011/00871 40 Reclamation Area R 0m 80.5439 1.339 2.603 0.071 0.021 0.140 0.068 0.059 0.100 0.044 0.355 0.173 788
2011/00872 45 Reclamation Area T 1.0m 62.3512 2.756 3.892 0.242 0.076 0.675 0.193 0.400 0.456 0.212 0.611 0.499 955
2011/00873 46+48+50 Reclamation Area U+V+W 0m 57.9122 2.519 3.585 0.253 0.070 0.630 0.189 0.363 0.437 0.202 0.594 0.478 995
2011/00874 47+49 Reclamation Area U+V 1m 62.0351 2.350 3.316 0.256 0.074 0.694 0.185 0.381 0.442 0.193 0.578 0.586 968
2011/00875 2 Turning Area B 0m 67.7681 1.127 1.605 0.124 0.033 0.362 0.099 0.182 0.224 0.097 0.298 0.281 516
2011/00876 7 Approach Channel E 0m 76.6187 0.420 0.659 0.052 0.016 0.125 0.030 0.080 0.078 0.042 0.136 0.094 279
2011/00877 12 Berthing Pocket G 0m 55.1559 2.733 3.938 0.326 0.096 0.839 0.210 0.525 0.486 0.272 0.687 0.632 1064
2011/00878 15 Anchorage Trench H 0m 74.2531 1.707 2.650 0.136 0.035 0.315 0.099 0.177 0.295 0.099 0.366 0.249 588
2011/00879 18 Aproach Channel I 0m 69.7516 4.129 6.456 0.226 0.054 0.537 0.164 0.233 0.568 0.129 0.848 0.523 1127
2011/00880 29 Approach Channel N 0m 77.2661 0.243 0.334 0.033 0.009 0.092 0.021 0.048 0.052 0.027 0.074 0.070 174
2011/00881 30 Approach Channel N 1.0m 55.2821 2.557 3.516 0.371 0.104 0.797 0.202 0.535 0.460 0.276 0.733 0.669 1230
Mean 1.904 2.632 0.204 0.056 0.493 0.127 0.293 0.313 0.145 0.459 0.400 741
AL1 (ppm dry) 0.1 0.1 0.1 0.01 0.1 0.1 0.1 0.1 0.1 0.1 0.1 100
Produced by: ARB
Date: 06/07/2011
F002_V5_SP_24/06/10
Polycyclic Aromatic Hydrocarbon Results for DefraDas: IPCDC9172
Application: Able UK
Location: KillingholmeDC/MCU: 0
Date Sampled: 24/03/2011 ug/kg (ppb)Wet weight
LSN Sample No. Location Excluded 23BA ACENAPH ACENAPT ANTHRAC BAA BAP BBF BENZGHI BEP BKF C1N C1PHEN
2011/00859 1+4 Turning Area A+C surface 0 17.1 67.2 95.2 249 311 329 303 266 177 862 747
2011/00860 3 Turning Area B 1.0m 0 22 77.7 101 291 339 401 355 309 203 1050 827
2011/00861 5 Approach Channel D 0m 0 9.7 32.5 44 137 148 170 156 148 88.1 594 507
2011/00862 8 Approach Channel E 1.0m 0 8.91 30.6 39.4 129 127 169 164 148 86.7 536 435
2011/00863 9 Berthing Pocket F 0m 0 16 51.4 60.8 197 215 275 252 226 124 474 529
2011/00864 23+25 Berthing Pocket K+L 0m 0 15.8 57.9 82.7 243 287 368 304 263 176 922 742
2011/00865 19+26 Approach Channel I+L 1.0m 0 15.7 50.3 93 229 263 344 267 242 163 848 744
2011/00866 27 Approach Channel M 0m 0 10.6 36.4 53.9 151 161 205 169 159 95.6 621 520
2011/00867 28 Approach Channel M 1.0m 0 9.11 32 42.4 139 160 196 175 153 95.7 472 418
2011/00868 36 Berthing Pocket Q 0m 0 16.1 48.3 72.9 231 283 338 317 283 170 820 677
2011/00869 37 Berthing Pocket Q 1.0m 0 0.305 0.698 1.33 7.34 7.37 11.6 18.4 11.9 3.79 29.4 21.2
2011/00871 40 Reclamation Area R 0m 0 0 19 20.2 70.1 88.8 98.9 158 101 24.9 553 909
2011/00872 45 Reclamation Area T 1.0m 0 12.8 56.5 75.6 192 293 287 285 218 138 1070 913
2011/00873 46+48+50 Reclamation Area U+V+W 0m 0 9.49 47.3 66.3 179 249 274 249 193 118 975 769
2011/00874 47+49 Reclamation Area U+V 1m 0 14.8 48.7 76.5 199 279 305 261 199 132 1030 908
2011/00875 2 Turning Area B 0m 0 6.28 40 54 105 147 138 132 108 68 535 398
2011/00876 7 Approach Channel E 0m 0 2.5 10 15.4 50.5 73.9 71.5 71.5 56.3 35.9 243 205
2011/00877 12 Berthing Pocket G 0m 0 13.6 54.1 79 217 318 362 312 243 161 989 928
2011/00878 15 Anchorage Trench H 0m 0 6.53 31.7 50 122 165 167 163 132 71.4 874 709
2011/00879 18 Aproach Channel I 0m 0 7.4 61 87 184 226 263 242 201 97.3 1690 1620
2011/00880 29 Approach Channel N 0m 0 1.92 7.98 14.5 32 40.7 47.3 40.8 33.9 21.9 127 1082011/00881 30 Approach Channel N 1.0m 0 12.6 58.6 82.3 228 296 372 336 261 168 887 7202011/00881 30 Approach Channel N 1.0m 0 12.6 58.6 82.3 228 296 372 336 261 168 887 720
Mean wet weight for PR details ppb (THC ppm) 0 10.4 41.8 59.4 163 204 236 215 180 110 736 652
ug/kg (ppb) mg/kg (ppm)Wet weight
LSN Sample No. Location Excluded C2N C3N CHRYSEN DBENZAH FLUORAN FLUOREN INDPYR NAPTH PERYLEN PHENANT PYRENE THC
2011/00859 1+4 Turning Area A+C surface 1560 1980 201 55.7 489 105 291 262 126 370 403 680
2011/00860 3 Turning Area B 1.0m 1880 2490 237 65.4 557 134 335 309 166 435 427 726
2011/00861 5 Approach Channel D 0m 1050 1340 112 26.7 248 60.1 132 168 65.4 249 216 391
2011/00862 8 Approach Channel E 1.0m 1040 1290 97.3 22.5 212 56.6 132 160 63.8 224 181 337
2011/00863 9 Berthing Pocket F 0m 951 1260 168 40.3 317 66 230 161 73.6 290 295 400
2011/00864 23+25 Berthing Pocket K+L 0m 1640 2070 178 53.6 461 108 277 275 129 389 359 626
2011/00865 19+26 Approach Channel I+L 1.0m 1510 1910 180 45 439 99.4 252 241 117 360 361 568
2011/00866 27 Approach Channel M 0m 1030 1330 119 26.7 282 74 148 176 76 259 214 430
2011/00867 28 Approach Channel M 1.0m 879 1070 107 27.6 241 62.6 161 146 78.7 204 185 352
2011/00868 36 Berthing Pocket Q 0m 1480 1770 179 52.1 428 97.5 292 243 133 364 333 439
2011/00869 37 Berthing Pocket Q 1.0m 33.1 47.6 4.93 1.92 8.71 2.9 8.01 8.33 2.43 11.1 8.04 68.9
2011/00871 40 Reclamation Area R 0m 1080 2100 57 16.7 113 55.1 47.8 80.2 35.4 286 139 635
2011/00872 45 Reclamation Area T 1.0m 1720 2430 151 47.2 421 121 249 285 132 381 311 595
2011/00873 46+48+50 Reclamation Area U+V+W 0m 1460 2080 146 40.8 365 110 210 253 117 344 277 576
2011/00874 47+49 Reclamation Area U+V 1m 1460 2060 159 45.6 431 115 236 274 120 358 363 600
2011/00875 2 Turning Area B 0m 764 1090 83.7 22.4 245 67.4 123 152 65.9 202 190 350
2011/00876 7 Approach Channel E 0m 322 505 39.9 11.9 95.8 23.2 61.6 60 32.5 104 72.1 214
2011/00877 12 Berthing Pocket G 0m 1510 2170 180 53 463 116 289 268 150 379 349 587
2011/00878 15 Anchorage Trench H 0m 1270 1970 101 26 234 73.5 132 219 73.3 272 185 437
2011/00879 18 Aproach Channel I 0m 2880 4500 158 37.7 375 114 163 396 90.1 592 365 786
2011/00880 29 Approach Channel N 0m 188 258 25.4 6.93 70.8 16 37 39.8 20.6 57.4 53.8 1342011/00881 30 Approach Channel N 1.0m 1410 1940 205 57.5 441 112 296 254 153 405 370 680
Mean wet weight for PR details ppb (THC ppm) 1230 1710 131 35.6 315 81.3 186 201 91.9 297 257 482
Produced by: ARB
Date: 06/07/2011
F002_V5_SP_24/06/10
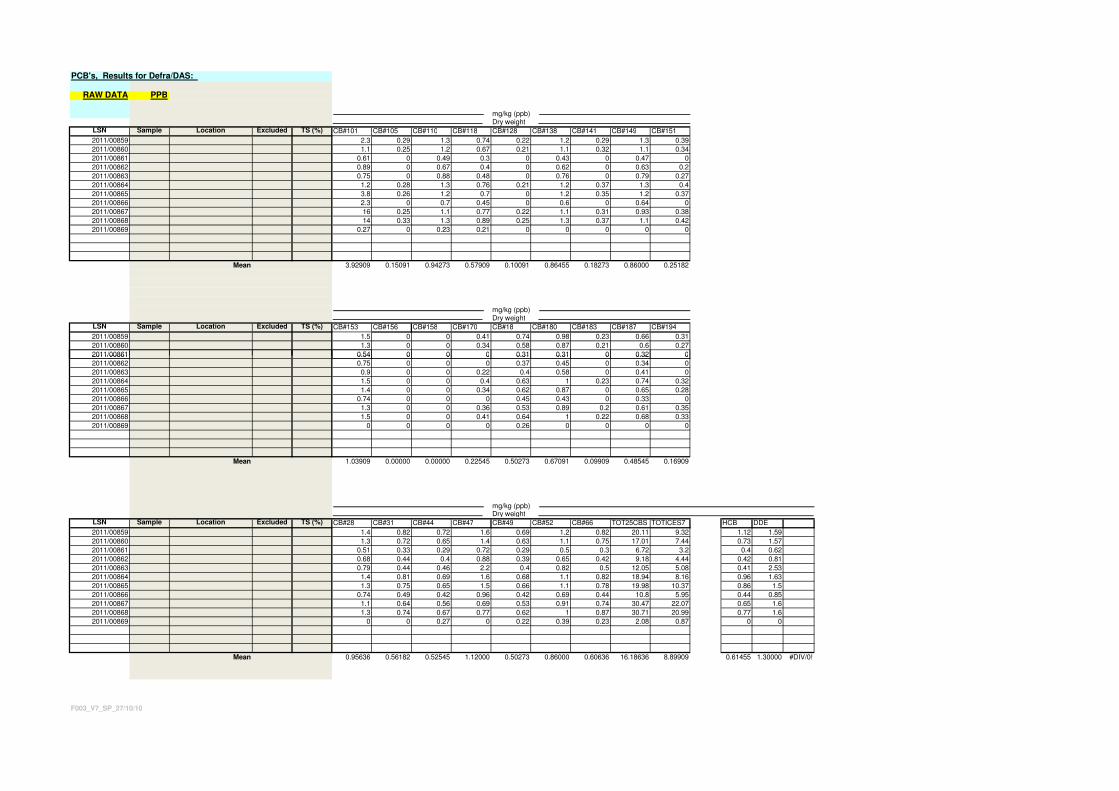
PCB's, Results for Defra/DAS:
RAW DATA PPB
mg/kg (ppb)Dry weight
LSN Sample Location Excluded TS (%) CB#101 CB#105 CB#110 CB#118 CB#128 CB#138 CB#141 CB#149 CB#151
2011/00859 2.3 0.29 1.3 0.74 0.22 1.2 0.29 1.3 0.39
2011/00860 1.1 0.25 1.2 0.67 0.21 1.1 0.32 1.1 0.34
2011/00861 0.61 0 0.49 0.3 0 0.43 0 0.47 0
2011/00862 0.89 0 0.67 0.4 0 0.62 0 0.63 0.2
2011/00863 0.75 0 0.88 0.48 0 0.76 0 0.79 0.27
2011/00864 1.2 0.28 1.3 0.76 0.21 1.2 0.37 1.3 0.4
2011/00865 3.8 0.26 1.2 0.7 0 1.2 0.35 1.2 0.37
2011/00866 2.3 0 0.7 0.45 0 0.6 0 0.64 0
2011/00867 16 0.25 1.1 0.77 0.22 1.1 0.31 0.93 0.38
2011/00868 14 0.33 1.3 0.89 0.25 1.3 0.37 1.1 0.42
2011/00869 0.27 0 0.23 0.21 0 0 0 0 0
Mean 3.92909 0.15091 0.94273 0.57909 0.10091 0.86455 0.18273 0.86000 0.25182
mg/kg (ppb)Dry weight
LSN Sample Location Excluded TS (%) CB#153 CB#156 CB#158 CB#170 CB#18 CB#180 CB#183 CB#187 CB#194
2011/00859 1.5 0 0 0.41 0.74 0.98 0.23 0.66 0.31
2011/00860 1.3 0 0 0.34 0.58 0.87 0.21 0.6 0.27
2011/00861 0.54 0 0 0 0.31 0.31 0 0.32 02011/00861 0.54 0 0 0 0.31 0.31 0 0.32 0
2011/00862 0.75 0 0 0 0.37 0.45 0 0.34 0
2011/00863 0.9 0 0 0.22 0.4 0.58 0 0.41 0
2011/00864 1.5 0 0 0.4 0.63 1 0.23 0.74 0.32
2011/00865 1.4 0 0 0.34 0.62 0.87 0 0.65 0.28
2011/00866 0.74 0 0 0 0.45 0.43 0 0.33 0
2011/00867 1.3 0 0 0.36 0.53 0.89 0.2 0.61 0.35
2011/00868 1.5 0 0 0.41 0.64 1 0.22 0.68 0.33
2011/00869 0 0 0 0 0.26 0 0 0 0
Mean 1.03909 0.00000 0.00000 0.22545 0.50273 0.67091 0.09909 0.48545 0.16909
mg/kg (ppb)Dry weight
LSN Sample Location Excluded TS (%) CB#28 CB#31 CB#44 CB#47 CB#49 CB#52 CB#66 TOT25CBS TOTICES7 HCB DDE
2011/00859 1.4 0.82 0.72 1.6 0.69 1.2 0.82 20.11 9.32 1.12 1.59
2011/00860 1.3 0.72 0.65 1.4 0.63 1.1 0.75 17.01 7.44 0.73 1.57
2011/00861 0.51 0.33 0.29 0.72 0.29 0.5 0.3 6.72 3.2 0.4 0.62
2011/00862 0.68 0.44 0.4 0.88 0.39 0.65 0.42 9.18 4.44 0.42 0.81
2011/00863 0.79 0.44 0.46 2.2 0.4 0.82 0.5 12.05 5.08 0.41 2.53
2011/00864 1.4 0.81 0.69 1.6 0.68 1.1 0.82 18.94 8.16 0.96 1.63
2011/00865 1.3 0.75 0.65 1.5 0.66 1.1 0.78 19.98 10.37 0.86 1.5
2011/00866 0.74 0.49 0.42 0.96 0.42 0.69 0.44 10.8 5.95 0.44 0.85
2011/00867 1.1 0.64 0.56 0.69 0.53 0.91 0.74 30.47 22.07 0.65 1.6
2011/00868 1.3 0.74 0.67 0.77 0.62 1 0.87 30.71 20.99 0.77 1.6
2011/00869 0 0 0.27 0 0.22 0.39 0.23 2.08 0.87 0 0
Mean 0.95636 0.56182 0.52545 1.12000 0.50273 0.86000 0.60636 16.18636 8.89909 0.61455 1.30000 #DIV/0!
F003_V7_SP_27/10/10
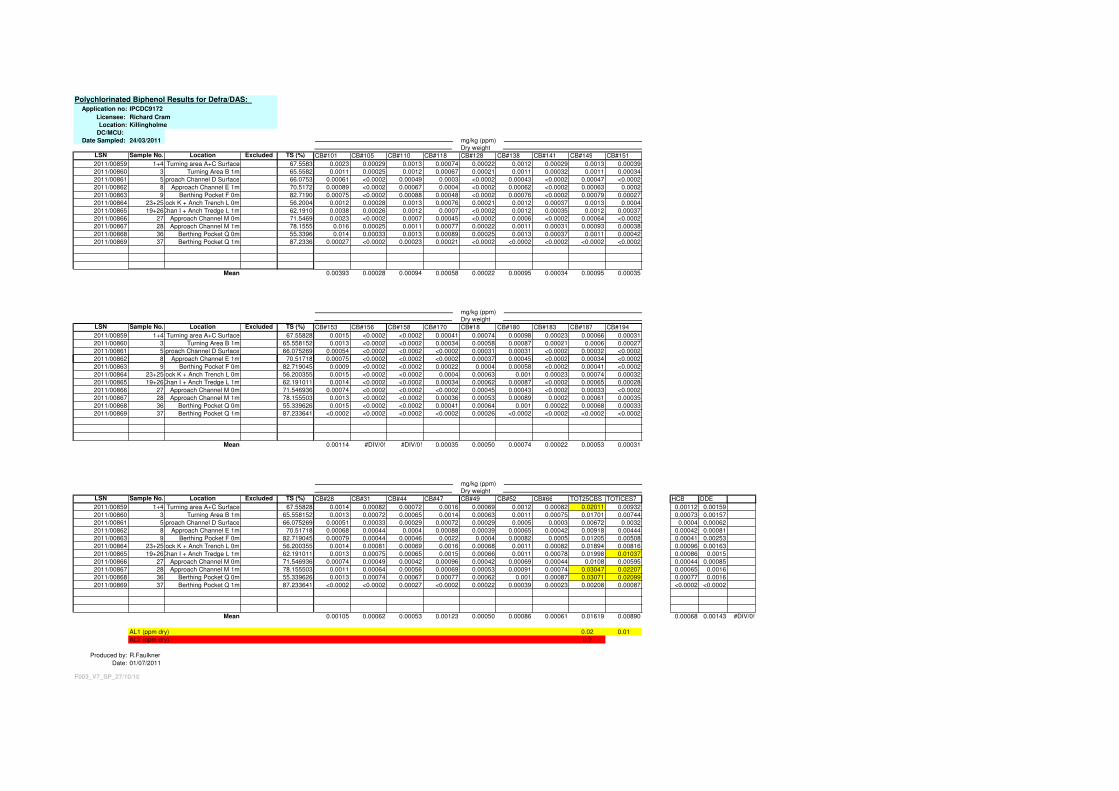
Polychlorinated Biphenol Results for Defra/DAS: Application no: IPCDC9172
Licensee: Richard Cram
Location: Killingholme
DC/MCU:
Date Sampled: 24/03/2011 mg/kg (ppm)Dry weight
LSN Sample No. Location Excluded TS (%) CB#101 CB#105 CB#110 CB#118 CB#128 CB#138 CB#141 CB#149 CB#151
2011/00859 1+4 Turning area A+C Surface 67.5583 0.0023 0.00029 0.0013 0.00074 0.00022 0.0012 0.00029 0.0013 0.00039
2011/00860 3 Turning Area B 1m 65.5582 0.0011 0.00025 0.0012 0.00067 0.00021 0.0011 0.00032 0.0011 0.00034
2011/00861 5Approach Channel D Surface 66.0753 0.00061 <0.0002 0.00049 0.0003 <0.0002 0.00043 <0.0002 0.00047 <0.0002
2011/00862 8 Approach Channel E 1m 70.5172 0.00089 <0.0002 0.00067 0.0004 <0.0002 0.00062 <0.0002 0.00063 0.0002
2011/00863 9 Berthing Pocket F 0m 82.7190 0.00075 <0.0002 0.00088 0.00048 <0.0002 0.00076 <0.0002 0.00079 0.00027
2011/00864 23+25Berth Pock K + Anch Trench L 0m 56.2004 0.0012 0.00028 0.0013 0.00076 0.00021 0.0012 0.00037 0.0013 0.0004
2011/00865 19+26Approach Chan I + Anch Tredge L 1m 62.1910 0.0038 0.00026 0.0012 0.0007 <0.0002 0.0012 0.00035 0.0012 0.00037
2011/00866 27 Approach Channel M 0m 71.5469 0.0023 <0.0002 0.0007 0.00045 <0.0002 0.0006 <0.0002 0.00064 <0.0002
2011/00867 28 Approach Channel M 1m 78.1555 0.016 0.00025 0.0011 0.00077 0.00022 0.0011 0.00031 0.00093 0.00038
2011/00868 36 Berthing Pocket Q 0m 55.3396 0.014 0.00033 0.0013 0.00089 0.00025 0.0013 0.00037 0.0011 0.00042
2011/00869 37 Berthing Pocket Q 1m 87.2336 0.00027 <0.0002 0.00023 0.00021 <0.0002 <0.0002 <0.0002 <0.0002 <0.0002
Mean 0.00393 0.00028 0.00094 0.00058 0.00022 0.00095 0.00034 0.00095 0.00035
mg/kg (ppm)Dry weight
LSN Sample No. Location Excluded TS (%) CB#153 CB#156 CB#158 CB#170 CB#18 CB#180 CB#183 CB#187 CB#194
2011/00859 1+4 Turning area A+C Surface 67.55828 0.0015 <0.0002 <0.0002 0.00041 0.00074 0.00098 0.00023 0.00066 0.00031
2011/00860 3 Turning Area B 1m 65.558152 0.0013 <0.0002 <0.0002 0.00034 0.00058 0.00087 0.00021 0.0006 0.00027
2011/00861 5Approach Channel D Surface 66.075269 0.00054 <0.0002 <0.0002 <0.0002 0.00031 0.00031 <0.0002 0.00032 <0.0002
2011/00862 8 Approach Channel E 1m 70.51718 0.00075 <0.0002 <0.0002 <0.0002 0.00037 0.00045 <0.0002 0.00034 <0.00022011/00862 8 Approach Channel E 1m 70.51718 0.00075 <0.0002 <0.0002 <0.0002 0.00037 0.00045 <0.0002 0.00034 <0.0002
2011/00863 9 Berthing Pocket F 0m 82.719045 0.0009 <0.0002 <0.0002 0.00022 0.0004 0.00058 <0.0002 0.00041 <0.0002
2011/00864 23+25Berth Pock K + Anch Trench L 0m 56.200355 0.0015 <0.0002 <0.0002 0.0004 0.00063 0.001 0.00023 0.00074 0.00032
2011/00865 19+26Approach Chan I + Anch Tredge L 1m 62.191011 0.0014 <0.0002 <0.0002 0.00034 0.00062 0.00087 <0.0002 0.00065 0.00028
2011/00866 27 Approach Channel M 0m 71.546936 0.00074 <0.0002 <0.0002 <0.0002 0.00045 0.00043 <0.0002 0.00033 <0.0002
2011/00867 28 Approach Channel M 1m 78.155503 0.0013 <0.0002 <0.0002 0.00036 0.00053 0.00089 0.0002 0.00061 0.00035
2011/00868 36 Berthing Pocket Q 0m 55.339626 0.0015 <0.0002 <0.0002 0.00041 0.00064 0.001 0.00022 0.00068 0.00033
2011/00869 37 Berthing Pocket Q 1m 87.233641 <0.0002 <0.0002 <0.0002 <0.0002 0.00026 <0.0002 <0.0002 <0.0002 <0.0002
Mean 0.00114 #DIV/0! #DIV/0! 0.00035 0.00050 0.00074 0.00022 0.00053 0.00031
mg/kg (ppm)Dry weight
LSN Sample No. Location Excluded TS (%) CB#28 CB#31 CB#44 CB#47 CB#49 CB#52 CB#66 TOT25CBS TOTICES7 HCB DDE
2011/00859 1+4 Turning area A+C Surface 67.55828 0.0014 0.00082 0.00072 0.0016 0.00069 0.0012 0.00082 0.02011 0.00932 0.00112 0.00159
2011/00860 3 Turning Area B 1m 65.558152 0.0013 0.00072 0.00065 0.0014 0.00063 0.0011 0.00075 0.01701 0.00744 0.00073 0.00157
2011/00861 5Approach Channel D Surface 66.075269 0.00051 0.00033 0.00029 0.00072 0.00029 0.0005 0.0003 0.00672 0.0032 0.0004 0.00062
2011/00862 8 Approach Channel E 1m 70.51718 0.00068 0.00044 0.0004 0.00088 0.00039 0.00065 0.00042 0.00918 0.00444 0.00042 0.00081
2011/00863 9 Berthing Pocket F 0m 82.719045 0.00079 0.00044 0.00046 0.0022 0.0004 0.00082 0.0005 0.01205 0.00508 0.00041 0.00253
2011/00864 23+25Berth Pock K + Anch Trench L 0m 56.200355 0.0014 0.00081 0.00069 0.0016 0.00068 0.0011 0.00082 0.01894 0.00816 0.00096 0.00163
2011/00865 19+26Approach Chan I + Anch Tredge L 1m 62.191011 0.0013 0.00075 0.00065 0.0015 0.00066 0.0011 0.00078 0.01998 0.01037 0.00086 0.0015
2011/00866 27 Approach Channel M 0m 71.546936 0.00074 0.00049 0.00042 0.00096 0.00042 0.00069 0.00044 0.0108 0.00595 0.00044 0.00085
2011/00867 28 Approach Channel M 1m 78.155503 0.0011 0.00064 0.00056 0.00069 0.00053 0.00091 0.00074 0.03047 0.02207 0.00065 0.0016
2011/00868 36 Berthing Pocket Q 0m 55.339626 0.0013 0.00074 0.00067 0.00077 0.00062 0.001 0.00087 0.03071 0.02099 0.00077 0.0016
2011/00869 37 Berthing Pocket Q 1m 87.233641 <0.0002 <0.0002 0.00027 <0.0002 0.00022 0.00039 0.00023 0.00208 0.00087 <0.0002 <0.0002
Mean 0.00105 0.00062 0.00053 0.00123 0.00050 0.00086 0.00061 0.01619 0.00890 0.00068 0.00143 #DIV/0!
AL1 (ppm dry) 0.02 0.01
AL2 (ppm dry) 0.2
Produced by: R.Faulkner
Date: 01/07/2011
F003_V7_SP_27/10/10
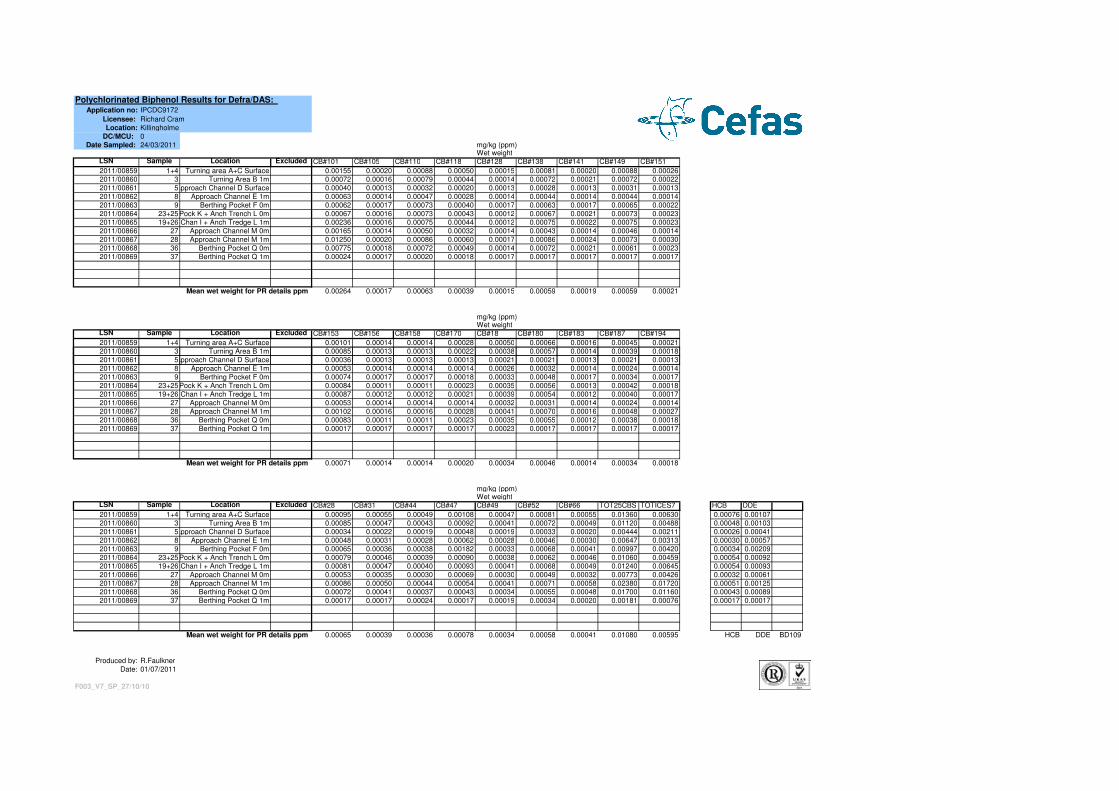
Polychlorinated Biphenol Results for Defra/DAS: Application no: IPCDC9172
Licensee: Richard Cram
Location: Killingholme
DC/MCU: 0
Date Sampled: 24/03/2011 mg/kg (ppm)Wet weight
LSN Sample Location Excluded CB#101 CB#105 CB#110 CB#118 CB#128 CB#138 CB#141 CB#149 CB#151
2011/00859 1+4 Turning area A+C Surface 0.00155 0.00020 0.00088 0.00050 0.00015 0.00081 0.00020 0.00088 0.00026
2011/00860 3 Turning Area B 1m 0.00072 0.00016 0.00079 0.00044 0.00014 0.00072 0.00021 0.00072 0.00022
2011/00861 5Approach Channel D Surface 0.00040 0.00013 0.00032 0.00020 0.00013 0.00028 0.00013 0.00031 0.00013
2011/00862 8 Approach Channel E 1m 0.00063 0.00014 0.00047 0.00028 0.00014 0.00044 0.00014 0.00044 0.00014
2011/00863 9 Berthing Pocket F 0m 0.00062 0.00017 0.00073 0.00040 0.00017 0.00063 0.00017 0.00065 0.00022
2011/00864 23+25Berth Pock K + Anch Trench L 0m 0.00067 0.00016 0.00073 0.00043 0.00012 0.00067 0.00021 0.00073 0.00023
2011/00865 19+26Approach Chan I + Anch Tredge L 1m 0.00236 0.00016 0.00075 0.00044 0.00012 0.00075 0.00022 0.00075 0.00023
2011/00866 27 Approach Channel M 0m 0.00165 0.00014 0.00050 0.00032 0.00014 0.00043 0.00014 0.00046 0.00014
2011/00867 28 Approach Channel M 1m 0.01250 0.00020 0.00086 0.00060 0.00017 0.00086 0.00024 0.00073 0.00030
2011/00868 36 Berthing Pocket Q 0m 0.00775 0.00018 0.00072 0.00049 0.00014 0.00072 0.00021 0.00061 0.00023
2011/00869 37 Berthing Pocket Q 1m 0.00024 0.00017 0.00020 0.00018 0.00017 0.00017 0.00017 0.00017 0.00017
Mean wet weight for PR details ppm 0.00264 0.00017 0.00063 0.00039 0.00015 0.00059 0.00019 0.00059 0.00021
mg/kg (ppm)Wet weight
LSN Sample Location Excluded CB#153 CB#156 CB#158 CB#170 CB#18 CB#180 CB#183 CB#187 CB#194
2011/00859 1+4 Turning area A+C Surface 0.00101 0.00014 0.00014 0.00028 0.00050 0.00066 0.00016 0.00045 0.00021
2011/00860 3 Turning Area B 1m 0.00085 0.00013 0.00013 0.00022 0.00038 0.00057 0.00014 0.00039 0.00018
2011/00861 5Approach Channel D Surface 0.00036 0.00013 0.00013 0.00013 0.00021 0.00021 0.00013 0.00021 0.00013
2011/00862 8 Approach Channel E 1m 0.00053 0.00014 0.00014 0.00014 0.00026 0.00032 0.00014 0.00024 0.00014
2011/00863 9 Berthing Pocket F 0m 0.00074 0.00017 0.00017 0.00018 0.00033 0.00048 0.00017 0.00034 0.00017
2011/00864 23+25Berth Pock K + Anch Trench L 0m 0.00084 0.00011 0.00011 0.00023 0.00035 0.00056 0.00013 0.00042 0.00018
2011/00865 19+26Approach Chan I + Anch Tredge L 1m 0.00087 0.00012 0.00012 0.00021 0.00039 0.00054 0.00012 0.00040 0.00017
2011/00866 27 Approach Channel M 0m 0.00053 0.00014 0.00014 0.00014 0.00032 0.00031 0.00014 0.00024 0.00014
2011/00867 28 Approach Channel M 1m 0.00102 0.00016 0.00016 0.00028 0.00041 0.00070 0.00016 0.00048 0.00027
2011/00868 36 Berthing Pocket Q 0m 0.00083 0.00011 0.00011 0.00023 0.00035 0.00055 0.00012 0.00038 0.00018
2011/00869 37 Berthing Pocket Q 1m 0.00017 0.00017 0.00017 0.00017 0.00023 0.00017 0.00017 0.00017 0.00017
Mean wet weight for PR details ppm 0.00071 0.00014 0.00014 0.00020 0.00034 0.00046 0.00014 0.00034 0.00018
mg/kg (ppm)Wet weight
LSN Sample Location Excluded CB#28 CB#31 CB#44 CB#47 CB#49 CB#52 CB#66 TOT25CBS TOTICES7 HCB DDE
2011/00859 1+4 Turning area A+C Surface 0.00095 0.00055 0.00049 0.00108 0.00047 0.00081 0.00055 0.01360 0.00630 0.00076 0.00107
2011/00860 3 Turning Area B 1m 0.00085 0.00047 0.00043 0.00092 0.00041 0.00072 0.00049 0.01120 0.00488 0.00048 0.00103
2011/00861 5Approach Channel D Surface 0.00034 0.00022 0.00019 0.00048 0.00019 0.00033 0.00020 0.00444 0.00211 0.00026 0.00041
2011/00862 8 Approach Channel E 1m 0.00048 0.00031 0.00028 0.00062 0.00028 0.00046 0.00030 0.00647 0.00313 0.00030 0.00057
2011/00863 9 Berthing Pocket F 0m 0.00065 0.00036 0.00038 0.00182 0.00033 0.00068 0.00041 0.00997 0.00420 0.00034 0.00209
2011/00864 23+25Berth Pock K + Anch Trench L 0m 0.00079 0.00046 0.00039 0.00090 0.00038 0.00062 0.00046 0.01060 0.00459 0.00054 0.00092
2011/00865 19+26Approach Chan I + Anch Tredge L 1m 0.00081 0.00047 0.00040 0.00093 0.00041 0.00068 0.00049 0.01240 0.00645 0.00054 0.00093
2011/00866 27 Approach Channel M 0m 0.00053 0.00035 0.00030 0.00069 0.00030 0.00049 0.00032 0.00773 0.00426 0.00032 0.00061
2011/00867 28 Approach Channel M 1m 0.00086 0.00050 0.00044 0.00054 0.00041 0.00071 0.00058 0.02380 0.01720 0.00051 0.00125
2011/00868 36 Berthing Pocket Q 0m 0.00072 0.00041 0.00037 0.00043 0.00034 0.00055 0.00048 0.01700 0.01160 0.00043 0.00089
2011/00869 37 Berthing Pocket Q 1m 0.00017 0.00017 0.00024 0.00017 0.00019 0.00034 0.00020 0.00181 0.00076 0.00017 0.00017
Mean wet weight for PR details ppm 0.00065 0.00039 0.00036 0.00078 0.00034 0.00058 0.00041 0.01080 0.00595 HCB DDE BD109
Produced by: R.Faulkner
Date: 01/07/2011
F003_V7_SP_27/10/10

ABLE MARINE ENERGY PARK
DREDGING STRATEGY APRIL 2011
APPENDIX 5
MARINE MANAGEMENT ORGANISATION CORRESPONDENCE
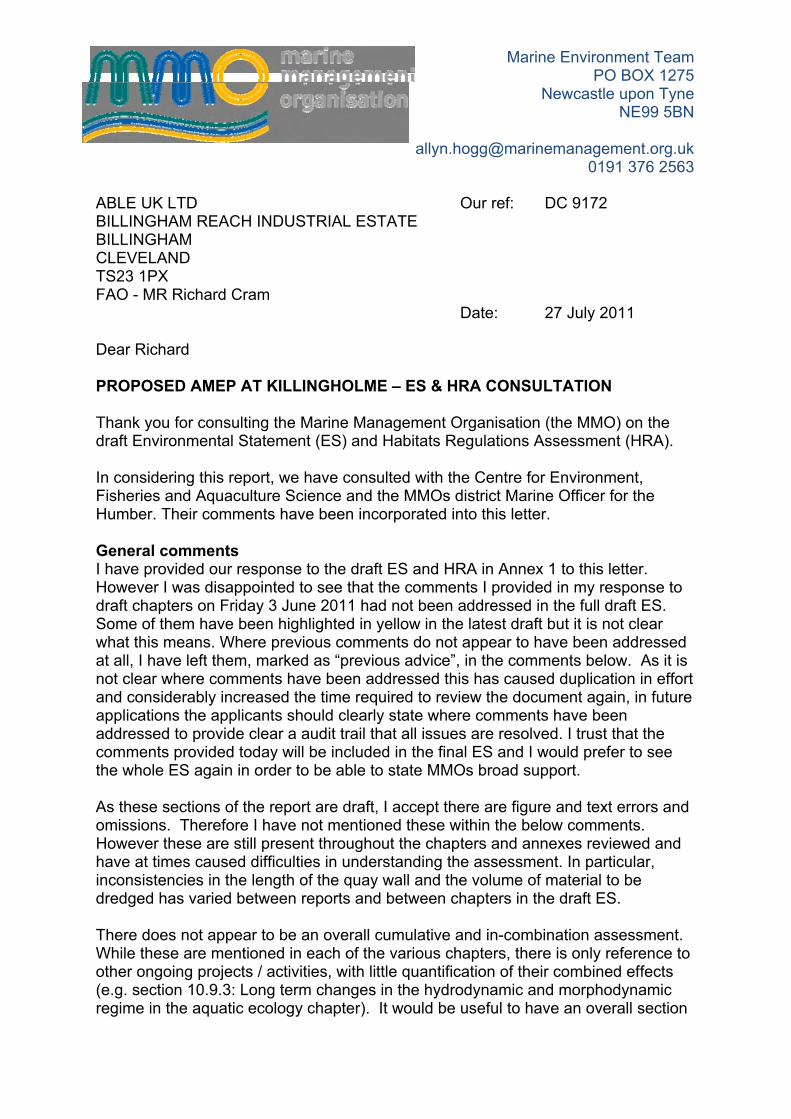
Marine Environment Team PO BOX 1275
Newcastle upon Tyne NE99 5BN
[email protected] 0191 376 2563
ABLE UK LTD BILLINGHAM REACH INDUSTRIAL ESTATE BILLINGHAMCLEVELANDTS23 1PX FAO - MR Richard Cram
Our ref:
Date:
DC 9172
27 July 2011
Dear Richard
PROPOSED AMEP AT KILLINGHOLME – ES & HRA CONSULTATION
Thank you for consulting the Marine Management Organisation (the MMO) on the draft Environmental Statement (ES) and Habitats Regulations Assessment (HRA).
In considering this report, we have consulted with the Centre for Environment, Fisheries and Aquaculture Science and the MMOs district Marine Officer for the Humber. Their comments have been incorporated into this letter.
General comments I have provided our response to the draft ES and HRA in Annex 1 to this letter. However I was disappointed to see that the comments I provided in my response to draft chapters on Friday 3 June 2011 had not been addressed in the full draft ES. Some of them have been highlighted in yellow in the latest draft but it is not clear what this means. Where previous comments do not appear to have been addressed at all, I have left them, marked as “previous advice”, in the comments below. As it is not clear where comments have been addressed this has caused duplication in effort and considerably increased the time required to review the document again, in future applications the applicants should clearly state where comments have been addressed to provide clear a audit trail that all issues are resolved. I trust that the comments provided today will be included in the final ES and I would prefer to see the whole ES again in order to be able to state MMOs broad support.
As these sections of the report are draft, I accept there are figure and text errors and omissions. Therefore I have not mentioned these within the below comments.However these are still present throughout the chapters and annexes reviewed and have at times caused difficulties in understanding the assessment. In particular, inconsistencies in the length of the quay wall and the volume of material to be dredged has varied between reports and between chapters in the draft ES.
There does not appear to be an overall cumulative and in-combination assessment. While these are mentioned in each of the various chapters, there is only reference to other ongoing projects / activities, with little quantification of their combined effects (e.g. section 10.9.3: Long term changes in the hydrodynamic and morphodynamic regime in the aquatic ecology chapter). It would be useful to have an overall section
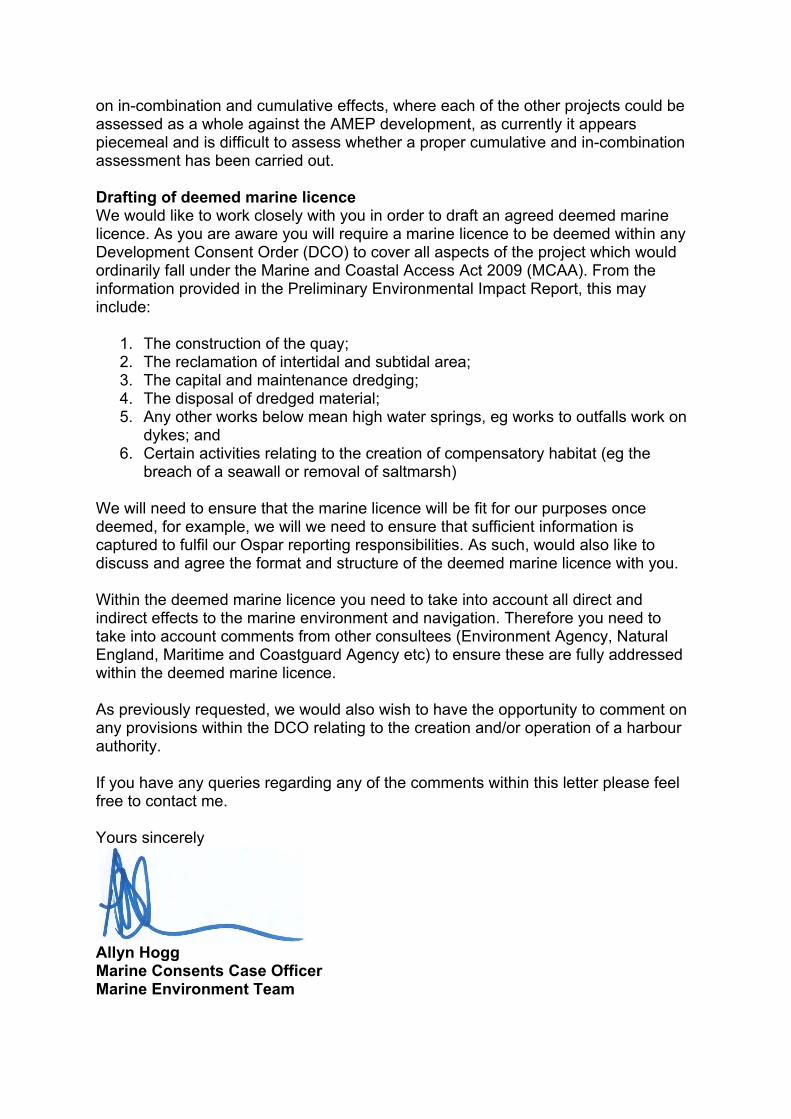
on in-combination and cumulative effects, where each of the other projects could be assessed as a whole against the AMEP development, as currently it appears piecemeal and is difficult to assess whether a proper cumulative and in-combination assessment has been carried out.
Drafting of deemed marine licenceWe would like to work closely with you in order to draft an agreed deemed marine licence. As you are aware you will require a marine licence to be deemed within any Development Consent Order (DCO) to cover all aspects of the project which would ordinarily fall under the Marine and Coastal Access Act 2009 (MCAA). From the information provided in the Preliminary Environmental Impact Report, this may include:
1. The construction of the quay; 2. The reclamation of intertidal and subtidal area;3. The capital and maintenance dredging; 4. The disposal of dredged material; 5. Any other works below mean high water springs, eg works to outfalls work on
dykes; and 6. Certain activities relating to the creation of compensatory habitat (eg the
breach of a seawall or removal of saltmarsh)
We will need to ensure that the marine licence will be fit for our purposes once deemed, for example, we will we need to ensure that sufficient information is captured to fulfil our Ospar reporting responsibilities. As such, would also like to discuss and agree the format and structure of the deemed marine licence with you.
Within the deemed marine licence you need to take into account all direct and indirect effects to the marine environment and navigation. Therefore you need to take into account comments from other consultees (Environment Agency, Natural England, Maritime and Coastguard Agency etc) to ensure these are fully addressed within the deemed marine licence.
As previously requested, we would also wish to have the opportunity to comment on any provisions within the DCO relating to the creation and/or operation of a harbour authority.
If you have any queries regarding any of the comments within this letter please feel free to contact me.
Yours sincerely
Allyn Hogg Marine Consents Case OfficerMarine Environment Team
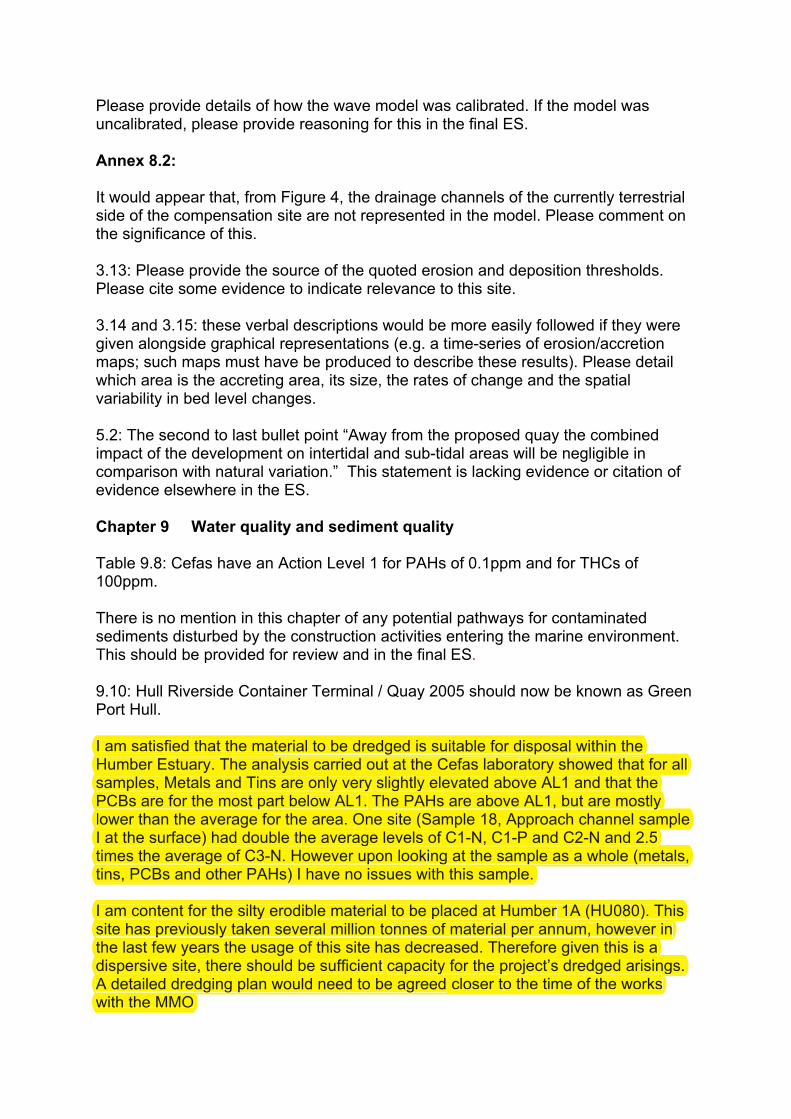
Please provide details of how the wave model was calibrated. If the model was uncalibrated, please provide reasoning for this in the final ES.
Annex 8.2:
It would appear that, from Figure 4, the drainage channels of the currently terrestrialside of the compensation site are not represented in the model. Please comment on the significance of this.
3.13: Please provide the source of the quoted erosion and deposition thresholds. Please cite some evidence to indicate relevance to this site.
3.14 and 3.15: these verbal descriptions would be more easily followed if they were given alongside graphical representations (e.g. a time-series of erosion/accretion maps; such maps must have be produced to describe these results). Please detail which area is the accreting area, its size, the rates of change and the spatial variability in bed level changes.
5.2: The second to last bullet point “Away from the proposed quay the combined impact of the development on intertidal and sub-tidal areas will be negligible in comparison with natural variation.” This statement is lacking evidence or citation of evidence elsewhere in the ES.
Chapter 9 Water quality and sediment quality
Table 9.8: Cefas have an Action Level 1 for PAHs of 0.1ppm and for THCs of 100ppm.
There is no mention in this chapter of any potential pathways for contaminated sediments disturbed by the construction activities entering the marine environment. This should be provided for review and in the final ES.
9.10: Hull Riverside Container Terminal / Quay 2005 should now be known as Green Port Hull.
I am satisfied that the material to be dredged is suitable for disposal within the Humber Estuary. The analysis carried out at the Cefas laboratory showed that for all samples, Metals and Tins are only very slightly elevated above AL1 and that the PCBs are for the most part below AL1. The PAHs are above AL1, but are mostly lower than the average for the area. One site (Sample 18, Approach channel sample I at the surface) had double the average levels of C1-N, C1-P and C2-N and 2.5 times the average of C3-N. However upon looking at the sample as a whole (metals, tins, PCBs and other PAHs) I have no issues with this sample.
I am content for the silty erodible material to be placed at Humber 1A (HU080). This site has previously taken several million tonnes of material per annum, however in the last few years the usage of this site has decreased. Therefore given this is a dispersive site, there should be sufficient capacity for the project’s dredged arisings. A detailed dredging plan would need to be agreed closer to the time of the works with the MMO
Humber Estuary. The analysis carried out at the Cefas laboratory showed that for all Humber Estuary. The analysis atory showed that for all samples, Metals and Tins are only very slightly elevated above AL1 and that the samples, Metals and Tins are only very slightly elevated above AL1 and that the PCBs are for the most part below AL1. The PAHs are above AL1, but are mostly PCBs are for the most part below AL1. The PAHs are above AL1, but are mostly lower than the average for the area. One site (Sample 18, Approach channel sample lower than the average for the area. One site (Sample 18, Approach channel sample I at the surface) had double the average levels of C1-N, C1-P and C2-N and 2.5 I at the surface) had double the average levels of C1-N, C1-P and C2-N and 2.5 times the average of C3-N. However upon looking at the sample as a whole (metals, times the average of C3-N. However upon looking at the sample as a whole (metals, tins, PCBs and other PAHs) I have no issues with this sample.
I am content for the silty erodible material to be placed at Humber 1A (HU080). This to be placed at HumberI am content for the silty erodible material to be placed at Humber 1A (HU080). This to be placed at Humbersite has previously taken several million tonnes of material per annum, however in site has previously taken several million tonnes of material per annum, however in the last few years the usage of this site has decreased. Therefore given this is a the last few years the usage of this site has decreased. Therefore given this is a dispersive site, there should be sufficient capacity for the project’s dredged arisings. dispersive site, there should be sufficient capacity for the project’s dredged arisings. A detailed dredging plan would need to be agreed closer to the time of the works A detailed dredging plan would need to be agreed with the MMO
I am satisfied that the material to be dredged is suitable for disposal within the terial to be dredged is suitable for disposal within the
Marine Environment Team PO BOX 1275
Newcastle upon Tyne NE99 5BN
0191 376 2532
By email only 23rd November 2011
Dear Richard, RE: Able Marine Energy Park Dredging Strategy I am writing in reply to your email dated 25th October 2011 requesting comments on the Dredging Strategy report in relation to your proposed application to Infrastructure Planning Commission (IPC) for development consent. 5 Chemical characterisations of arisings The chemical analysis provided does not include any metals and tins results, although I note that these analyses were carried out by Cefas and comments were included in previous advice. There are also three sets of data with differing units included for PAHs and PCBs. Only the dry weight PPM results that are comparable to the Cefas Action Levels need to be included. 6 Disposal sites The document states that 981,150 m3 of material will be disposed of to HU080, Humber 1A and goes on to compare this figure to previous tonnages received at the site. However, the table referenced states tonnages to the Sunk Dredge Channel and not specifically to HU080. I am content that silty erodible material is deposited at HU080. The remainder of the material (954,350m3) is glacial in origin and is proposed to be split across three sites; HU081, HU082 and HU083, however this quantity is not compared to the amounts the sites have received in previous years. Looking at the data for disposal sites HU081, HU082 and HU083, only 463,028 tonnes of material has been deposited to HU081 (all in 1995). However these sites have been used for beneficial use under construction licences, which unfortunately means that no returns are required to be provided and therefore there is no record of how much material has previously been disposed of at these sites. Approximately 1.9M m3 of material from all proposals, including the licensed Immingham Oil Terminal (375,000 m3), are proposed to be deposited at these three sites. Looking at the areas of the disposal sites and the bathymetry data included in the dredging protocol, the sites have the capacity to take this quantity of material. Therefore I am content that stiff glacial material can be deposited at sites HU081, HU082 and HU083. If you intend to refer to this document in the deemed marine licences, the document should also provide the full coordinates of all of the dredge and disposal sites to be used. 6.6 Future maintenance dredging requirements. This section does not provide sufficient detail on the future maintenance dredging requirements to be able to inform a draft marine licence. As is consistent with maintenance

dredging licences issued under the Marine and Coastal Access Act 2009, this document and the associated deemed marine licence needs to identify the quantity of material to be dredged by year, the location of the dredging and of the disposal (including coordinates). Maintenance dredging licences are not usually permitted for a period longer than three years. This is so that the activity can be reviewed at regular periods in view of other projects operating within the Humber and to ensure that the activity remains compliant with both the Ospar and London conventions, which includes a requirement for the analysis of samples every three years. Without this additional information on this, and in view of the last draft deemed marine licence that I provided comments on 11 November 2011, I do not consider that we have had sufficient information to be able to support a deemed marine licence for disposal of dredged arisings from maintenance dredging. 7 In-combination projects The document does include future work planned in the area however, as per previous advice Green Port Hull is not a replacement for Hull Riverside Bulk Terminal, this is a different project. Green Port Hull is Quay 2005. Appendix 2 – Preliminary Work Method Statement This includes the proposed used of some disposal sites (Humber 2, Humber 3A and Holme Channel deep) not mentioned in the main document. Disposal can only take place at those sites which have been previously agreed. We previously recommended (date) that a schedule for dredging be included and that the material is disposed of throughout the year rather than all in a single period. The only schedule provided is a daily schedule and there is no indication as to whether the material will be deposited throughout the year. This methods statement needs to be updated to detail how the material will be disposed of throughout the year and amended such that the discrepancies between the disposal sites to be detailed in the Method Statement match those in the Dredging Strategy. The revised Dredging Strategy and Method Statement must be agreed in writing with the MMO prior to the disposal operations commencing. Deemed marine licences As I have requested previously (most recently 11 November 2011), I strongly encourage you to undertake meaningful consultation on the contents of, and conditions to be included in, the deemed marine licences. As drafted they would not be considered fit for purpose from the MMOs perspective. The deemed marine licences for capital and maintenance dredging should either contain much of the information in this document including the names and coordinates of the dredge and disposal sites to be used, the depth that the dredged areas will initially be dredged to and then maintained at, and a methods statement indicating how the dredging will be undertaken, as well as an annual works schedule. If you intend to refer to the Dredging Strategy and/or the Preliminary Work Method Statement we would wish to see the comments raised in this response, and other relevant comments raised in previous consultations (including that on 11 November 2011), addressed and the documents(s) consulted upon and agreed in writing prior to the dredging commencing. I would encourage you to arrange a meeting to discuss appropriate contents and conditions for all of the deemed marine licences, including the capital dredging/disposal licence and maintenance dredge/disposal licence, and that other relevant organisations are consulted

upon it, for example the Environment Agency, Natural England and the local harbour authority. If you have any queries please feel free to contact me. Yours sincerely,
Anna Gerring