Embed Size (px)
Citation preview
79 423 ONTMINE COIUSTORIS ENG~ I6N M ON TOE SOOTING Vi1CHATEEISTICS(U) NWYOL POSTUHOIMTE SCHOOL MONTEREYCfi J S BENNETT ET RL. DEC 66 NPSS-06-004
mhhmhhmmhhmlmhhmmhmhhhhusIomhohhohoEEEIMEMOhI-EE

1.2 LA - 2.• -
Ar f PYRELU iO TEST CHART ,
I,' APIw -~I~jj
w g .ap _ .g .. ."P 4 .P ..D rB g g_

NPS67-8-0o04 FILE COPYNAVAL POSTGRADUATE SCHOOL
Monterey, CaliforniaN
DTIC0 LECTEK
APR 21 t7E.DA
GAS TURBINE COMBUSTOR AND
ENGINE AUGMENTOR TUBE SOOTING
CHARACTERISTICS
J. S. BENNETT, C. H. JWAY, D. J. URICH
AND A. VA
D. W. NETZER
DECEMBER, 1986
Approved for public release; distribution unlimited. I.Prepared for: Naval Air Propulsion Center
Trenton, New Jersey 08628-0176
• ,, •,,"• ,% r r ,,r,,q, %%, " " "., ' ." ," ."., ,, ,"-. ". ." "."..' .,"* ,,"." v . ." . . . " ."." ."-"" ','

DISCLAIMER NOTICE
THIS DOCUMENT IS BEST QUALITYPRACTICABLE. THE COPY FURNISHEDTO DTIC CONTAINED A SIGNIFICANTNUMBER OF PAGES WHICH DO NOTREPRODUCE LEGIBLY.

REPORT DOCUMENTATION PAGE.a oEC C" - - 0 RESTR.C7 VE MARKNGS
UNCLASSIFIED
2a EC , - -" -- - 3 DiSTR B TON AvA:'ARIL TY 0; REPORt
-'o~ CE. - . . .. '', . ,,- -:3 _
1-- - -:' '. ,* S; 5 MONITORING ORGANIZATION REPORT NLM8ER(S)
NPS67-86-004
6a . ... 60 CE S MBOL 7a NAME OF MONITORING ORGANIZATION
Naval Postgraduate School (if applicable)
' - ,S C y Stare jra Z0 1Coae,' 70 ADDRESS (City, State, and ZIP Code)
Monterey, CA 93943
3a %AVE C.: :", ,% '.C' . G
So OFF'CE SYMBOL 9 PROCUREMENT INSTRUMENT IDENT1FICATiON NUMBERo0CA. Z-1- 01 (if applicable) N6237686WR 00013
Naval Air Propulsion Center
3c ADDRESS(Cty, State, dna ZIP Coce) 10 SOURCE OF FUNDING NUMBERS
PROGRAM PROJECT TASK WORK uNITTrenton, NJ ELEMENT NO 1 NO NO ACCESSION NO
r '.E (include Security Classiticirion)
Gas Turbine Combustor and Engine Augmentor Tube Sooting Characteristics
12 PERSONA A-OP(S,
J.S. Bennett, C.H. Jwav, D.J. Urich and D.W. Netzer'3a T,'ZE 3o RE-C' Jo \1E COvEPED 14 DATE OF REPORT (Year, Month, Day) 15 PAGE COUNT
FinalI : oj. OCt 85 'o-Sr_ 8 Dec 1986 85'6 %0-~A" p A-0%
COSA CODES '8 SjBJECT TERMS (Continue on reverse if necessary and identify by block number)
: ED C.OuP S-3.G O_P
9 ABS-RACT 'Continue on re~erse if necessary and identify by block number)
An experimental investigation was conducted to investigate the effects of smoke-suppressantfuel additives, fuel composition and combustor operating environment on the soot character-istics within the combustor and across an engine exhaust augmentor tube. A T63 combustorwas used with fuel additive pumps and an exhaust augmentor tube. Soot mean diameters andconcentrations were measured at two locations within the combustor and at the exhaust of theaugmentor tube using three-wavelength light transmission and multiple-angle forrd scatter-ing measurements and collection probes. Fuel and air flow rates were varied and combustorinlet air temperature was varied using a hydrogen-fueled vitiated air heater.
Combustor flow conditions were found to significantly change soot characteristics as well asthe effects of smoke-suppressant fuel additives. Bj varied between 0.10 and 0.30 micronswithin the combustor. DI 1 increased significantly across the engine augmentor tube, to
32sizes as large as 0.43 microns.
2, - ' :, A._ A" S-RAC 21 ABSTRACT SECURITY CLASSIFICATIONS- . .: : Y C ,SERS
-, 4E - 22b TELEPHONE (Indude Area Code) 2c OFr CE SYMBOL
DD FORM 1473, * ? o- -ay oe .sec unt i exhaustea SECRiTY CLASSFCAT ON , " 5 OAG
A.I .:".er ealtions are OOSOIte 9 U.S. GOVernmfli n Qgi' ofce 1964-Ol -24.
-4 . %

TABLE OF CONTTS
I. IrTRODUCTION AND OVERVIEW . .I.... . 1
II. EXPERI,'7AL APPARATUS .............. ...................... 5
A. General Description ...................................... 5
B. Combustor .......... .......................... 6
C. Air and Fuel Supplies ......... .................... 6
D. Hydroqen-Fueled Vitiated Air Heater ..................... 6
E. Combustor Therrnocouples .................. 7
F. Additive Meterinq Pumps ..................... 7
G. Controls and Data Recordina ................ 7
H. Combustor Particle Size Diagnostics . ......... 8 . . I 1 8
I. Aurmrentor Tube and Instrumentation . ............ 10
|III. PArUCLE SIZING trHODS .................... 13
A. Light Transmission Technique . . . ............. 13
B. Forward Light Scattering Technique .............. 15
C. Combination Techniques . .................. 17
IV. RESULTS AND DISCUSSION. . . . . . . . . . . ........... 18
A. Initial Tests at Nominal Combustor Flowrate .......... 18
B. Combustor Results at Low Mass Flows . . . . .. 19 I.. .. 1
C. Auqmentor Tube Measurements . . .............. 24 "
V. SUWW OF RESULTS AND PRESENT EFFOR ............. 28
A. Summary of Results ................................ 28
B. Present Efforts ............. ........... 30
iii

TABLEc; . *.. . . . . . . . . . . . . 31
FIGUPES ........... . 41
LIST OF RFFFENCES ....................... . .72
INITIAl DISTRI Rf TTIOjr LisT . . ' 3
iv
LIST nF TALFS
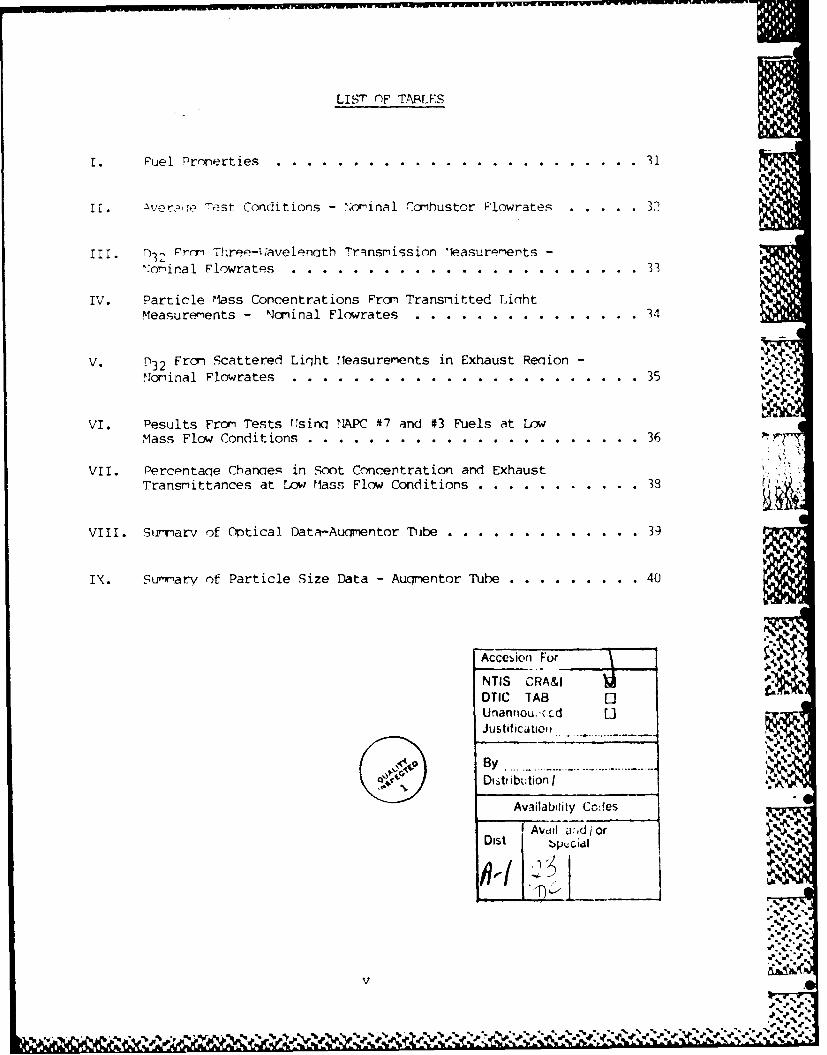
F uel Pronerties . . . . . . . . . . . . . . . . . . . . . . . 31
e. r,, ,it -est Conditions - ";orinal rombustor Flowrates .. . 32
III. n32 Frnm Three-';avelonqth Transmission leasureorents -
.ominal Flowrates . . . . . . . . . . . . . .. . . . . . . . . 33
IV. Particle Iass Concentrations Pron Transmitted LiohtMeasurements - Nominal Flowrates ..... ............... ... 34
V. Frcri Scattered Liqht Measurements in Exhaust Reoion - %
Noninal Flowrates ..... .... ...................... ... 35 y-
VI. Pesults From Tests TUsinc NAPC 47 and #3 Fuels at LowMass Flow Conditions ...... .... ...................... 36
VII. Percpntaqe Chances in Soot Concentration and ExhaustTransmittances at Low flass Flow Conditions .. .. .. ..... 38
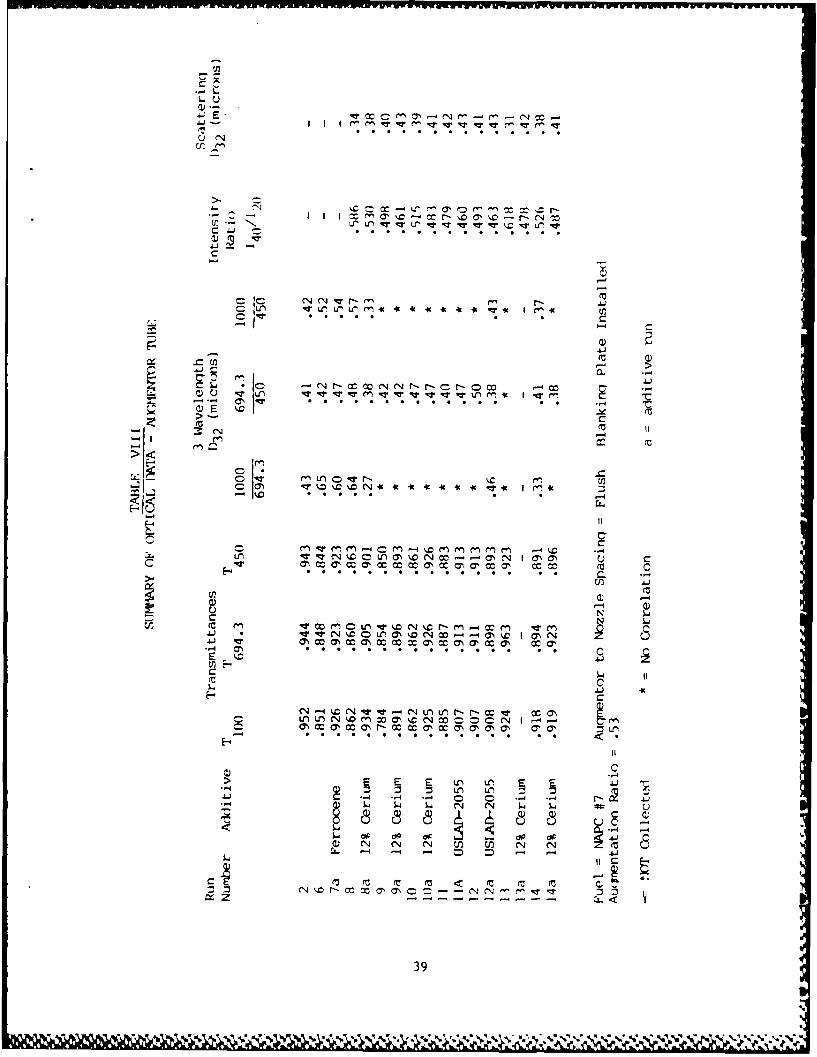
VIII. Sirnarv of Otical Data-Auqmentor Tibe ..... ............ .39
IX. SummarV of Particle Size Data - Aucp-entor Tube ........... .. 40
Accesion For
DTIC TAB E,
Unantiou. (-.d
Justificato . .
By .... ..-Distr ibution I
Availabtfity Codes
: Av d i adior
.-..,-. .,:
v

LIST OF FIGP'mES
1. Sche-natic of T-63 Cnmbustor ('omnents . .1
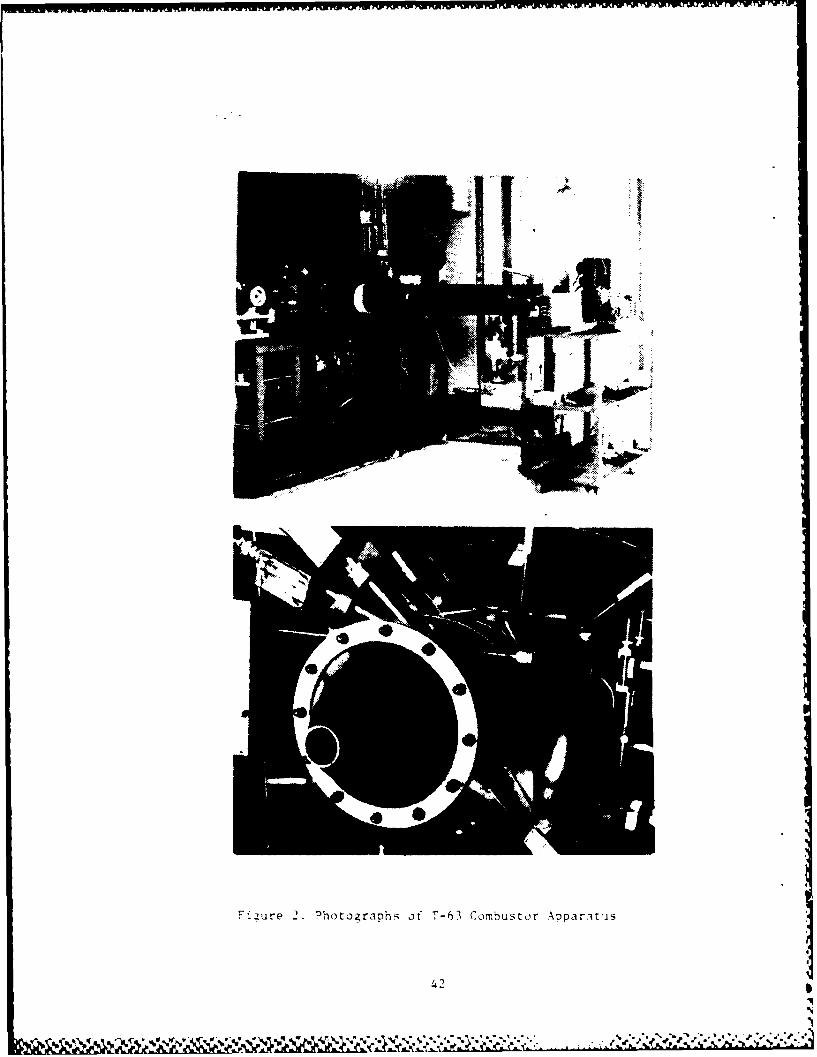
2. Phctxiranhs of T-63 Co-hustor Anparatus .... ............. .. 42
3. qche-atic nt Air and Fuel qiinnlv Svsters ...... ............. 43
4. Cohb'istor Therrocourle Placement (Side View) .... ........... .44
5. Conbustor Theriocounle Placement (End View) ..... ......... .45
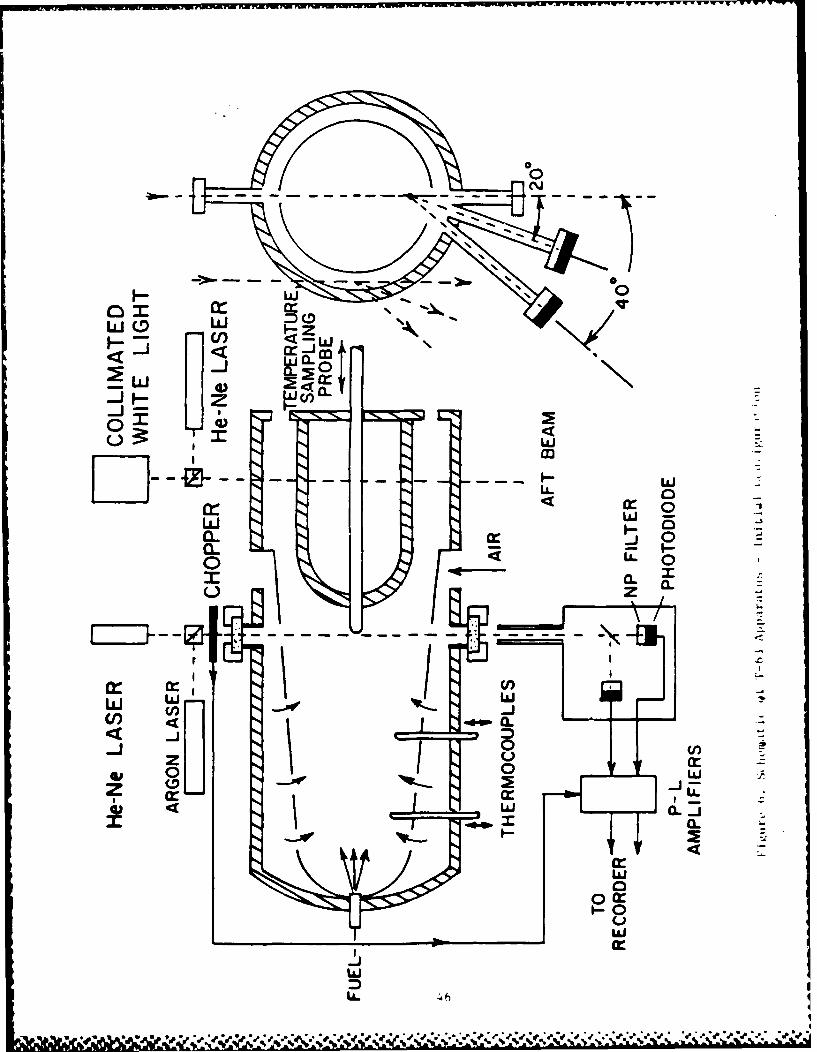
6. Scheriatic of T-63 Apparatus - Initial Confiquration ......... .46
7. Schematic of Ccrhustor Optical Measurement Paths (Top View) . . . 47
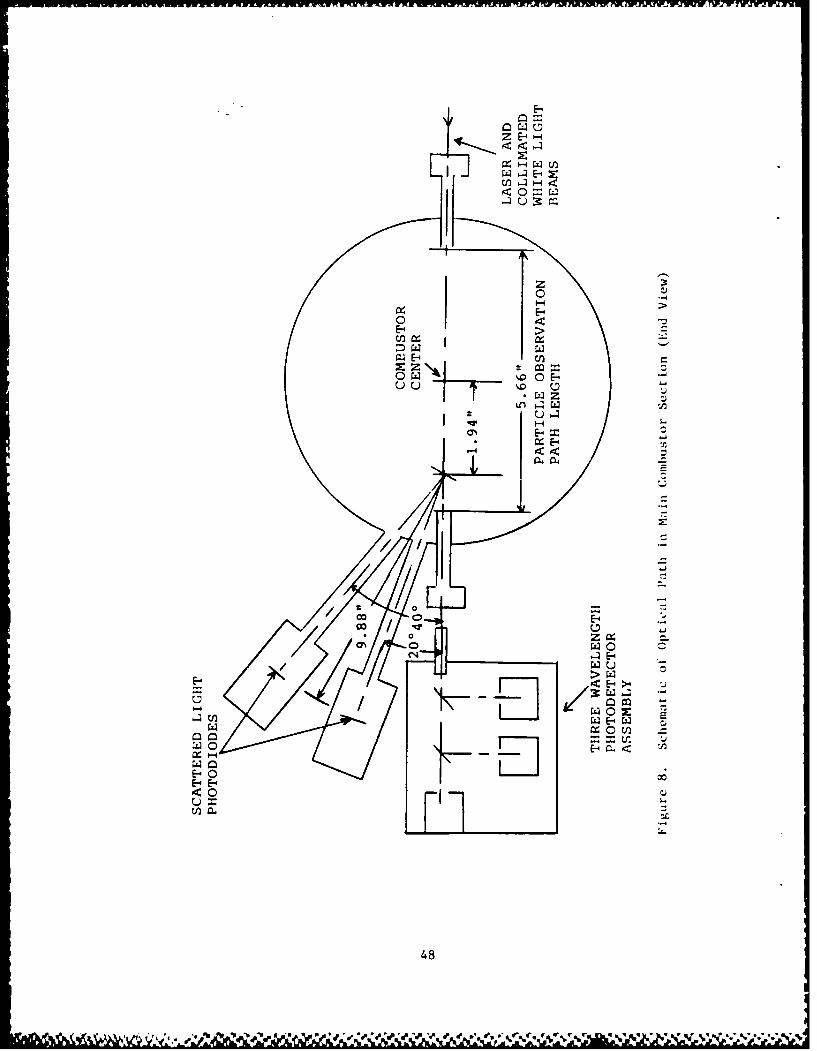
8. qcheynatic of Optical Path in main Conbustor Section (End View) . . 48
9. Schematic of Optical Path in Exhaust Section (End View) .. ..... 49
10. Sptun of the Optical Svstem to Measure Liqht Transmissionand Scatterinn Intensities ....... .................... .50
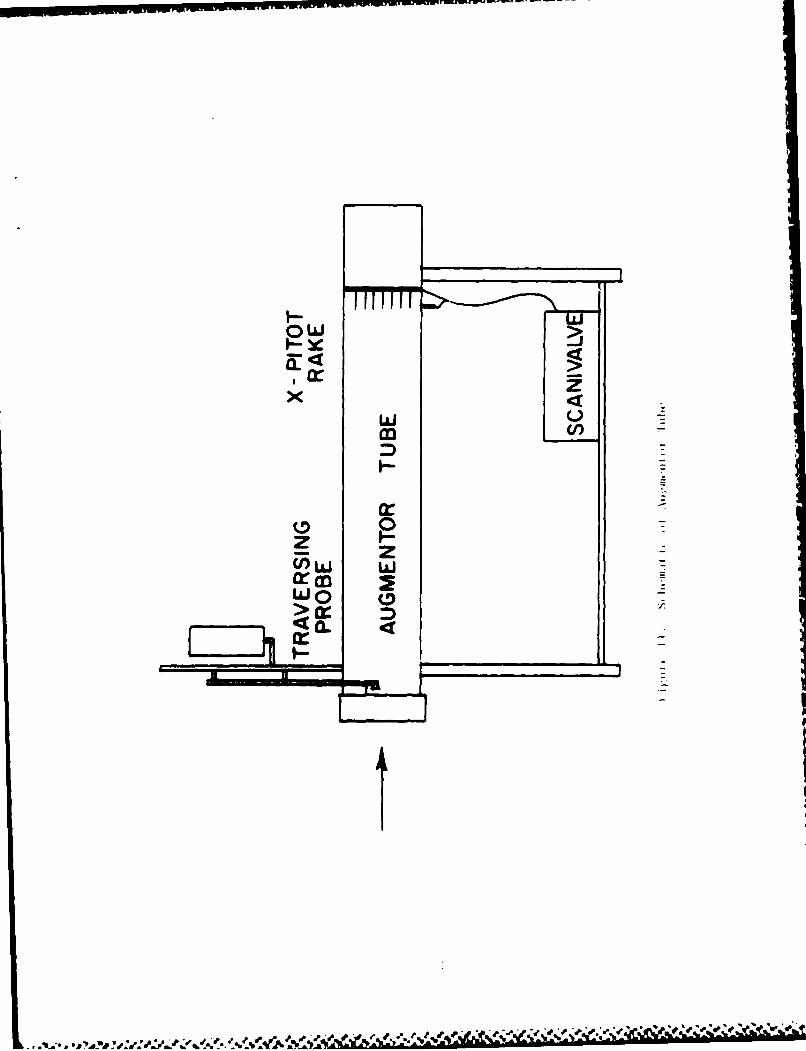
11. Scheratic of Auqnentor Tube ........ .................. .51
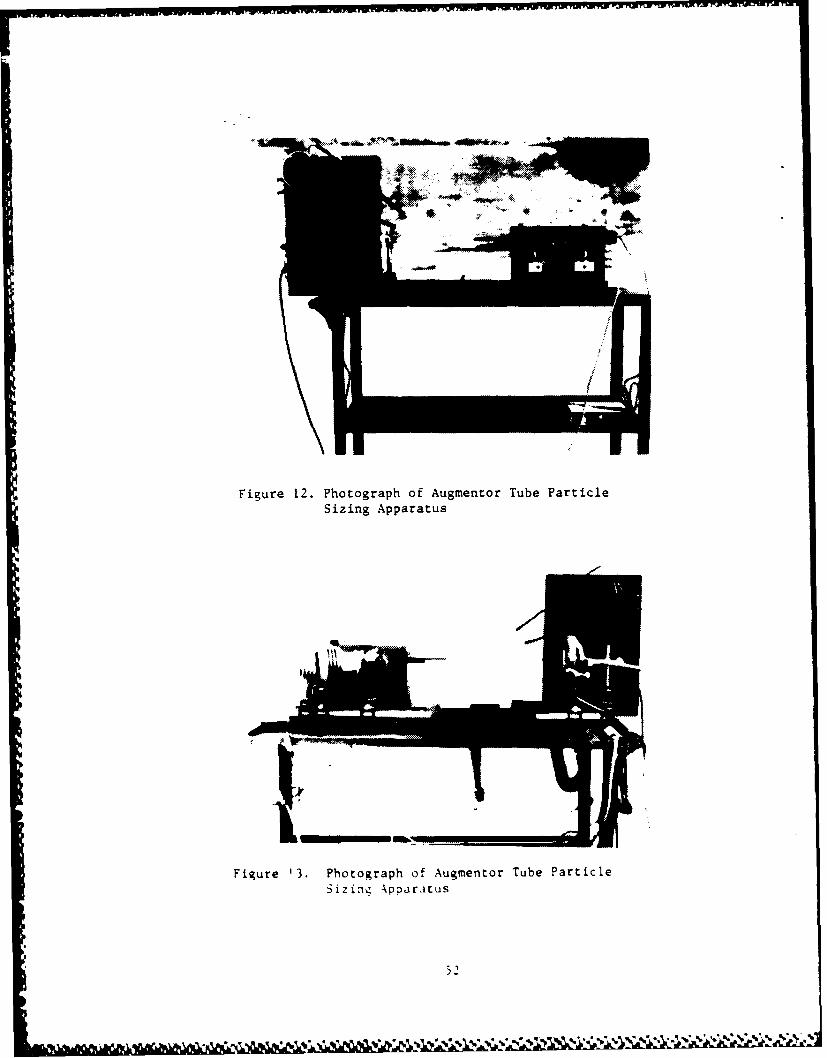
12. Photmoraph of Auqmentor Tube Particle Sizina Anparatus ....... .. 52
13. Photoqranh of Aunmentor T7ube Particle Sizinn Apparatus ........ .52
14. Auq'mentor Tube Flow Environment ....... ................. .53
15. Traversinn ,iel Probe ......... ...................... .54
16. Stationarv Pitot Rake ......... ...................... .55
17. Extinction Coefficient vs. Particle Size (D3 2 ) ... .......... .. 56
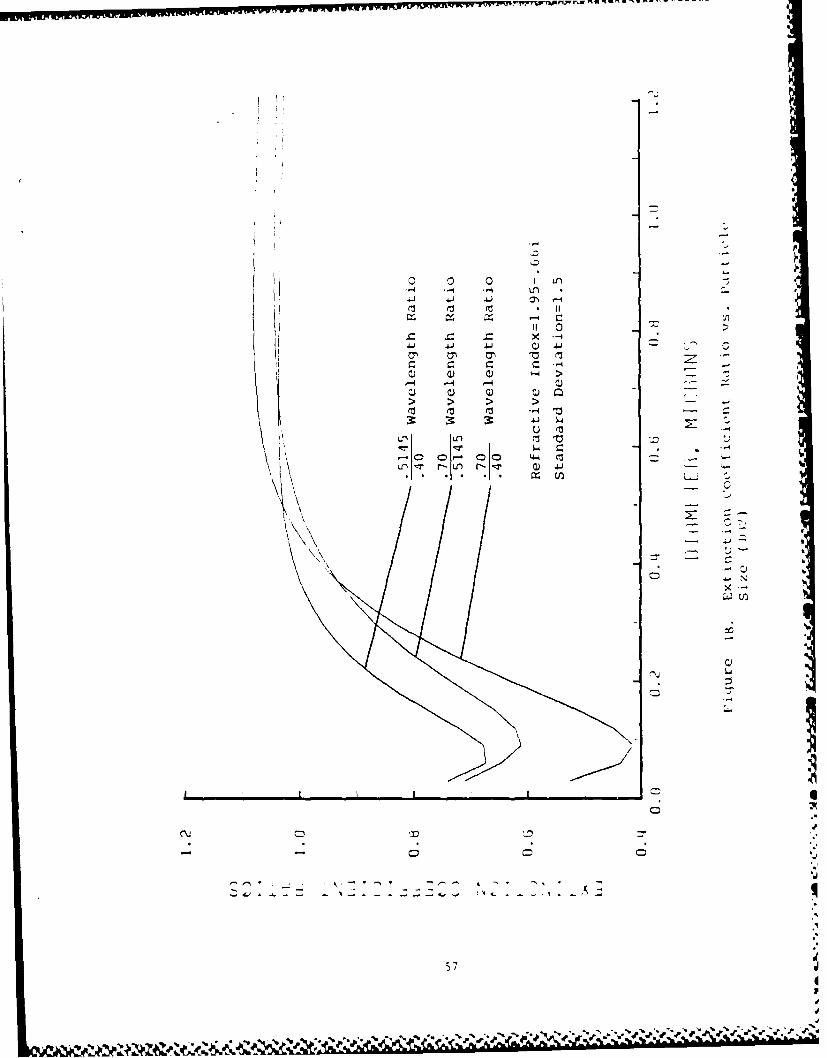
18. Extinction Coefficient Ratio vs. Particle Size (P3 2 ) ........ .. 57
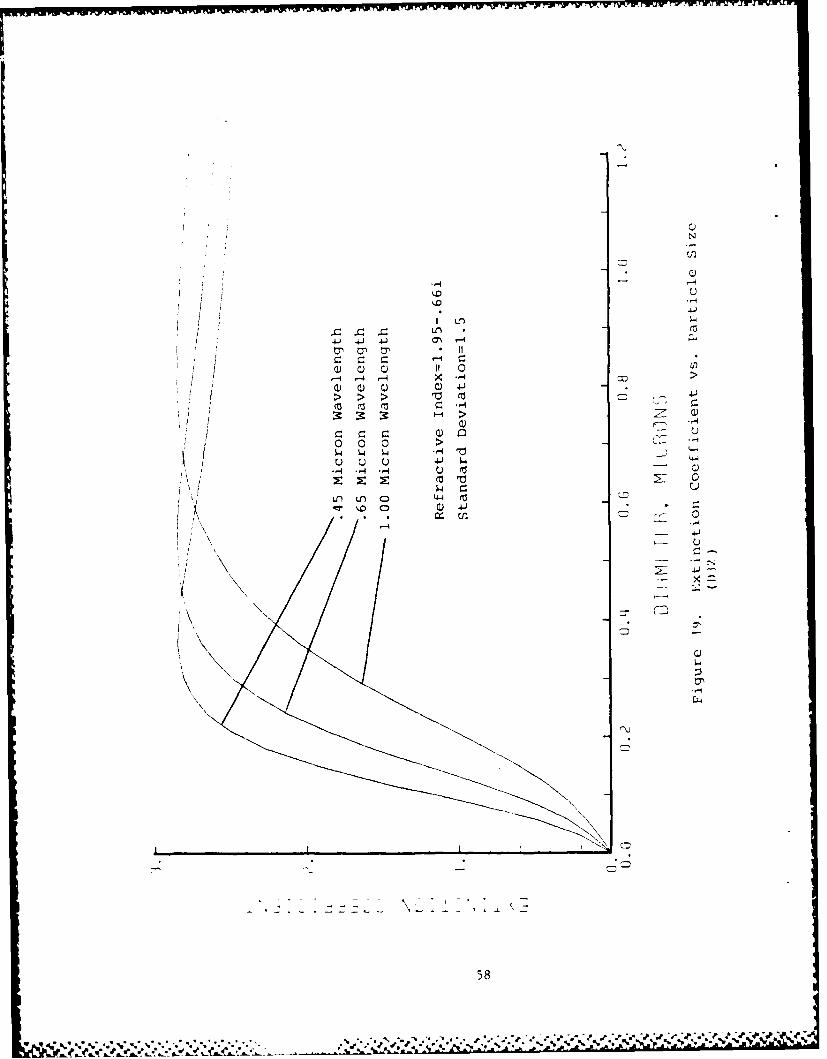
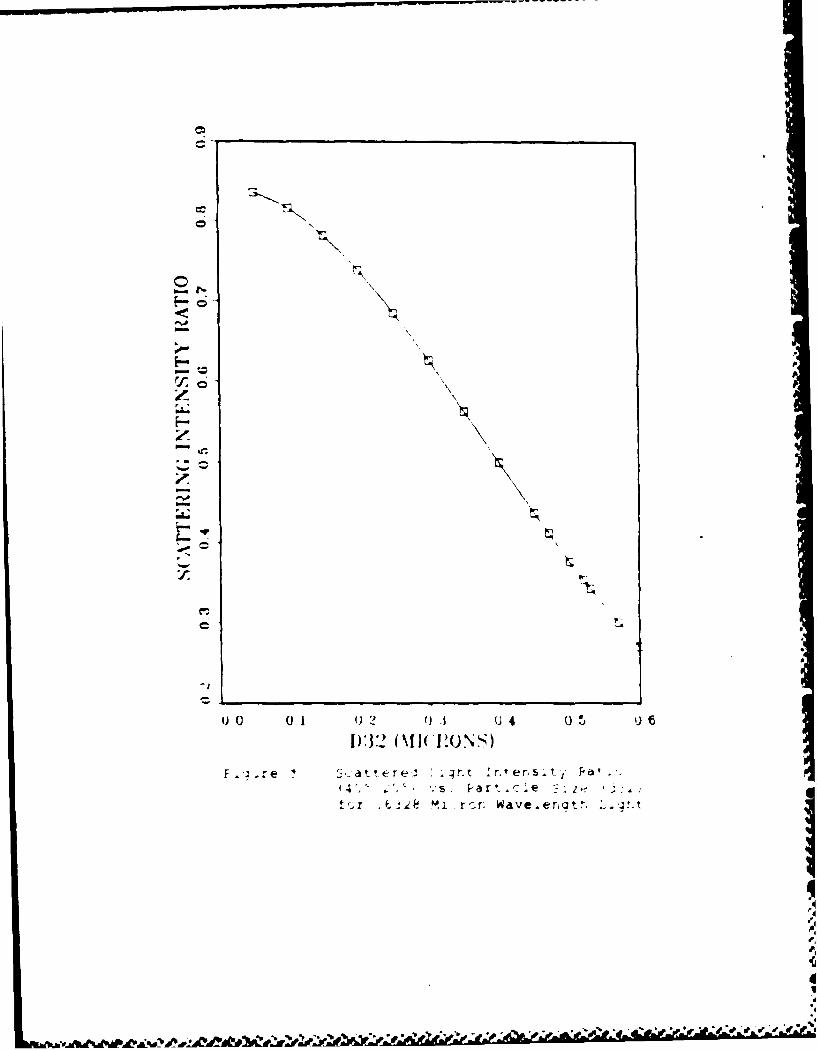
19. Extinction Coefficient vs. Particle Size (D3 2 ) for .6328 Micron;avelenqth Lipht ........... ......................... 5R
20. Extinction Coefficient Patio vs. D32 .............. 59
21. Scattered Liqht Intensity Ratio (400/200) vs. D32 ........... .60
22. Combination Particle Sizinq Method ...... ................ .. 61
23. D32 vs. Fuel-Air Ratio in Exhaust Reoion .... ............. .62
24. D32 vs. Exhaust Te-perature in Fxhaust Peqion .......... 6
25. ryx,,mst T7mneriture vq. Fuel- ir Ratio ..... .............. 4
vi

26. Trans-ittance vs. Exhaust Temperature in Exhaust Renion .. ..... 65
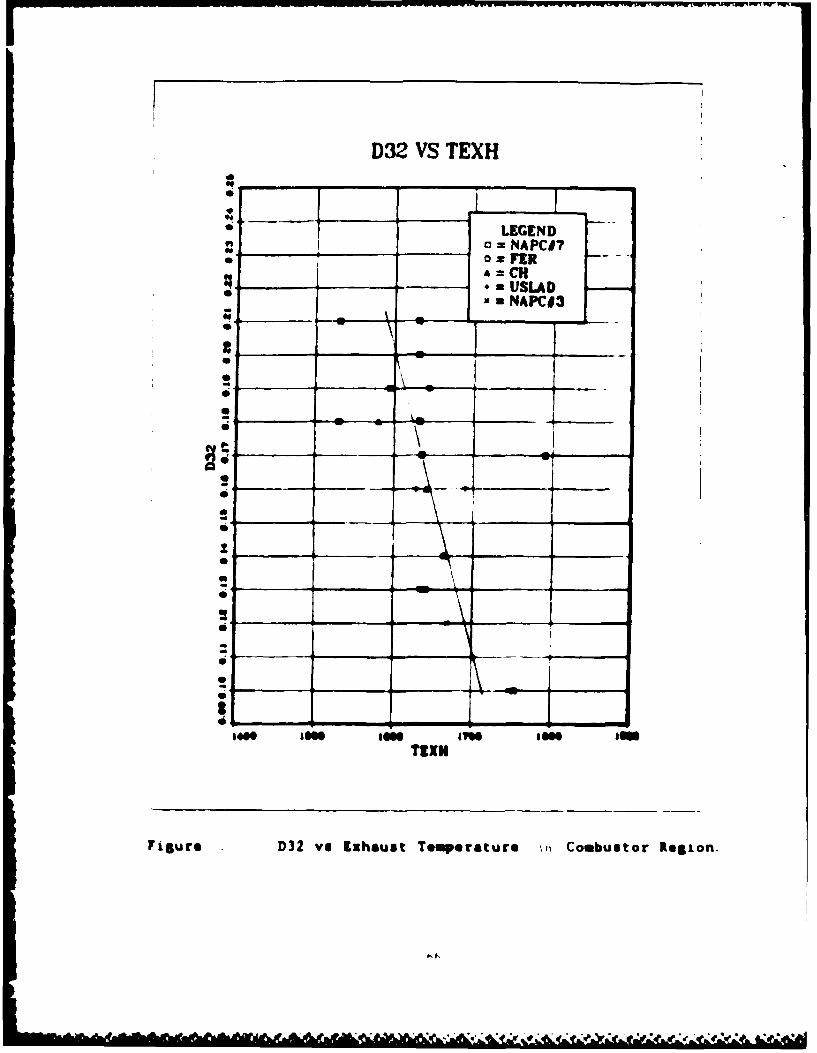
27. D3 2 vs. Exhaust Tenperattire in Combustor Reqion ..... ......... 66
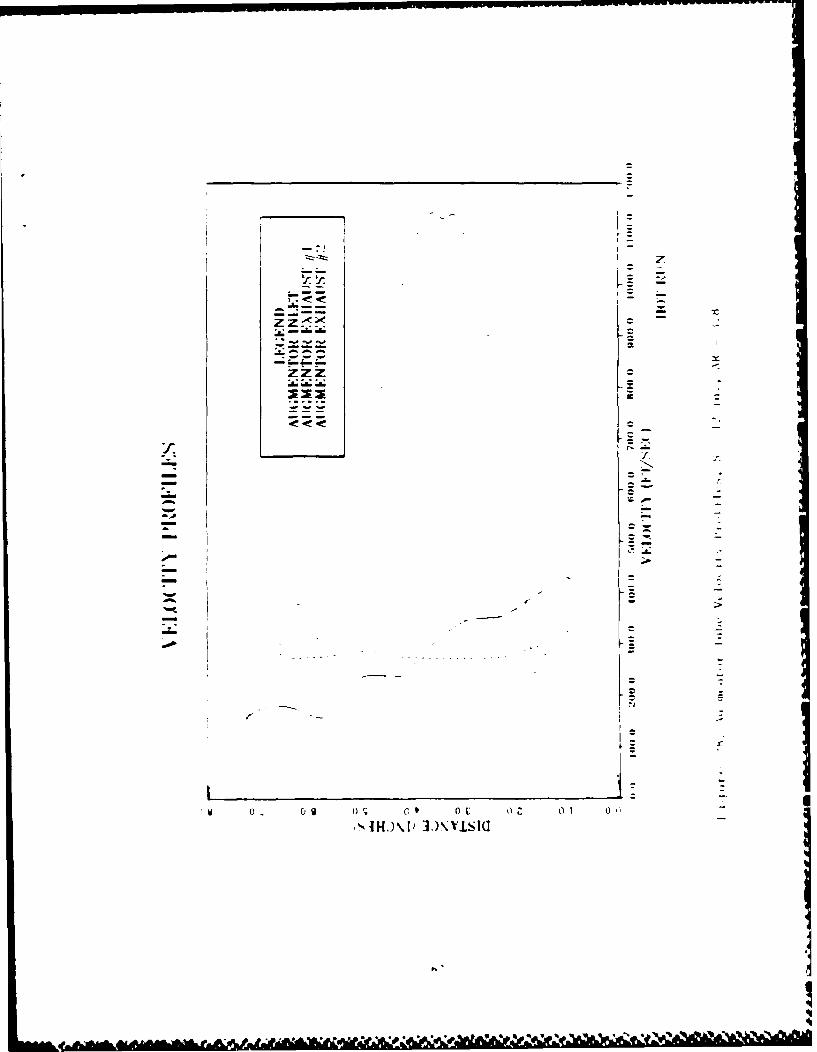
28. aucrontor 7ube Velocity Profiles, s = 12 in., AP 3.3 ......... 67
29. -)urn~'ptor Tube Velocity Profiles, s = 3 in., A2 = 5.2 ... ..... 68
30. )32 vs. Fuel-Air Ratio at 2uqentor Tube Exhaust ........... ... 69
31. Scannina Electron Microscope Photonraph, Impact Sample ..... .. .
32. Scanninq Electron Microscope Photoqraph, Filtered Sample . . . . . 71
% %
%W...:,
-4'
%
vii
.1
a.' , .d

'Ot4D.CL7JRE
a Constant in unner limit distribution function, 1.13
-\ Cross-sectional area ot narticle
-V NurTment-r t .Te aurirentation ratio, m numpe!/- ombustor
CH Cerium Pex-ceri
d,D Particle diameter
nm ;Iaximrf particle diameter
D32 Volume-to-surface mean diameter
F Puel-to-air ratio, Fraunhofer tunction
Fer Ferrocene
Oe 32.2 lbn-ft/lbf-sec2
I Intensity
Jl Resel function of order 1
L Path length containinq particles
M Index of refraction of narticles
m lass flowrate
M Mlach nin'iber
N Nirtber concentration of particles
PPs Static nressure
Pt Stagnation pressure
0 Dimensionless extinction coefficient
0) Averaqe dimensionless extinction coefficient for pelydispersion
R Gas constant
S Exhaust nozzle - aucmentor spacing
T Temnerature, transmittance
Tt Stwination temperature
V 'l1ocit
viii

Particle size p)ararmeter, ni)/x p.
R !atio of specific heats
5 Constant in upper limlit distribution function, 1.26 L
0 Scatterinq anole
x t[ave1,:n(,th
D/rD,
p Density of particle
a Standard deviation of particle size distribution
. %5J
ix.
%5
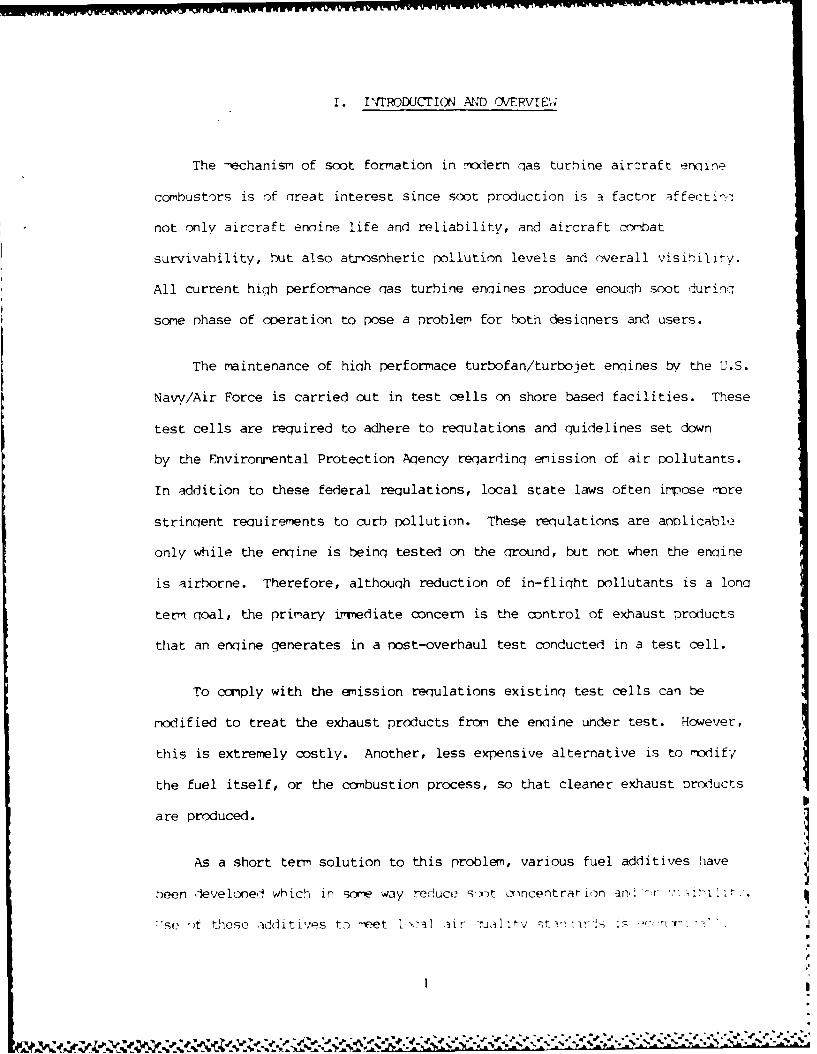
I. I'TrRODUCTION AD OVERVIE;
The mechanism of soot formation in modern qas turbine aircraft enqine
combustors is of areat interest since soot production is a factor affectin-
not only aircraft ennine life and reliability, and aircraft corbat
survivability, but also atrospheric p)ollution levels and overall visibility.
All current high performance nas turbine engines produce enough soot during
some phase of coeration to pose a problem for both desianers and users.
The maintenance of hiah performace turbofan/turbojet engines by the U.S.
Navy/Air Force is carried out in test cells on shore based facilities. These
test cells are required to adhere to regulations and guidelines set down
by the Environmental Protection Agency reqardinq emission of air pollutants.
In addition to these federal regulations, local state laws often impose -ore
stringent requirements to curb pollution. These regulations are anolicabIe
only while the engine is beinq tested on the ground, but not when the engine
is airborne. Therefore, althouqh reduction of in-flight Dollutants is a lona
term qoal, the primary irmediate concern is the control of exhaust products
that an engine generates in a post-overhaul test conducted in a test cell.
To comply with the emission regulations existinq test cells can be
modified to treat the exhaust products from the engine under test. However,
this is extremely costly. Another, less expensive alternative is to modify
the fuel itself, or the combustion process, so that cleaner exhaust Oroducts
are produced.
As a short term solution to this problem, various fuel additives have
been develoned which in sore way reduce soot cuncentration an., "i :;:r.
'se ')t these Idd it iJs t) -et ,7l *i r 7uaI i v t --: n
, =+,+ .+ -- + , . m -+ .' , Is .. :': .. t,'. $ .p.+ - :_- " ? - i- - . : + ". .. -

TW .. ;*Vr-:' -w-*V -IWIw 'WVIWV W~WWW PkX YYU2'U-1.T P... IR .
feasihle wnen r.nninr e-riines for short neriods in test cells. However,
.esin -f i siot-free enine 'u!, ne a ,better long ter- solution. The
cm r. Processes which occur turina combustion in these engines need further
'<'ti~t r<- hel- lefine the role 'f additives and fuel composition in
Few new test ells are ein(, constricted. Therefore, the existing test
cells are heinq recuired to reet tighter constraints in Wth noise and
pollutant emissions while engine types and size are chanqinq. Methods for the
initial desinn and subseq uent modifications, as well as the desian of
pollution/noise abatement equiprent, would be facilitated if accurate
prediction capabilities for inlet air and exhaust flowfields were readily
available. Current test cells use auamentor tubes (ejectors) to prevent
enoine exhaust qas recirculation and reduce the temperature as well as to
suppress noise.
Terperature, pressure and velocity distributions in aucmentor tubes, if
known, could be used to help determine materials required in construction,
di-ensions required for strennth and adequacy of flow, and the effects of
pollution/noise control devices inserted or injected into the flow.
The overall objective of the present effort at the Naval Postqraduate
School has been to experimentally investir7ate the workinq mechanisms of smoke
suppressant fuel additives and the effects of the additives, and fuel
cor'nosition on (1) ccmbustor and auqmentor tube exhaust opacity, (2) particle
size and concentration and temperature distribution within the combustor, and
(3) particle size and concentration chancles across a test cell au7mentor tube.
The experir-ental apparatus is zurrentlv based on a T63 combustor with

- WIMMUfIMWI
fuel additive pumps and an aft pressure enclosure. The cobustor employs zq
exhaust nozzle which exhausts into an augmentor tube. Soot mean diameters and
concentrations are measured in the combustor, in the aft pressure enclosure
and at the exit of the auamentor tube using three-wavelength liqht
transmission easurements and multiple-anqle forward liqht scattering
measurements. Collection probes are also used. Variable combustor inlet air
temperature is provided with a hydroqen-fueled vitiated air heater.
The three-wavelenqth liqht transmission measurement technique can be used
to very low transmittance values and yields the mean (D32) particle size and
concentration. It does not yield particle size distribution data. Rather, it
requires an assumed distribution together with knowledge of the index of
refraction. The practical range of measurement for visible light is
approximately 0.05 to 0.40 microns. The light scatterinq technique is
qenerally able to determine particle size for particles larqer than 0.05
microns. The two techniques can be used toaether to obtain D32, the
"apparent" particle index of refraction, and the particle concentration.
In general, D32 has been measured in the ranqe of 0.15 to 0.25 microns.
A value of D32 of 0.15 microns would yield an arithmetric mean diameter of
approximately 0.07 microns. Collected exhaust products also show many
particles in this size range, but is is not known whether or not these "larqe"
soot particles are the result of the collection process.
An initial test series was conducted (Ref. 1) with the combustor
operatinq at desiqn air and fuel flowrates and desiqn pressure with the
following major results:
(1) Additives increased soot size without effectin -ass oncentration.
3p

(2) *dditives were less etfective with lower z-omhustor air inlet
temperature.
(3) Fxhaust D3 2 was independent of fuel composition and fuel-Air ratio.,
(4) A sot -ean index rf refraction of 1.95 - 0.66i resulted in the test
data correlation for the liqht transrission reasure-ents.
The nri-arv test series conducted in the present investination was -arie v
at the same nressures and fuel-air ratios as the initial study, but with
reduced flowrates. Thus, the fuel atomizer was oneratinq at less than desicn
pressure dron (noorer atomization and fuel distribution) and the air rixina
rates (orimarv zone fuel-air ratio) were modified.
Earlier experimentation on auqmentor tubes conducted in a 'laval Air
Rework Facility, Alameda, California test cell by tlallon, Hickev and Netzer
(Pef. 2) showed the viability of corinuter simulation of the test cell flow
field as well as the types of difficulties that can occur in aco7uirina data
for rodel validation in actual encine testinn. The latter resulted from the
severe temperature and pressure conditions to which the full scale testina
subiected the instrumentation.
It is important to understand the processes that occur within the
aurx-entor tube if effective controls of test cell exhaust stack emissions are
to he implemented. A major auestion that needs to he answered is, what
effects do enqine cperatinq conditions (exhaust temnerature, soot
characteristics, 1ach number, etc.) and au r'entor desian have on the chances
in soot size and soot and naseous emission concentrations across the aurrentor
tube?
The auqoentor tube used in the nrpvent investiration was instrumented
4
Lz.
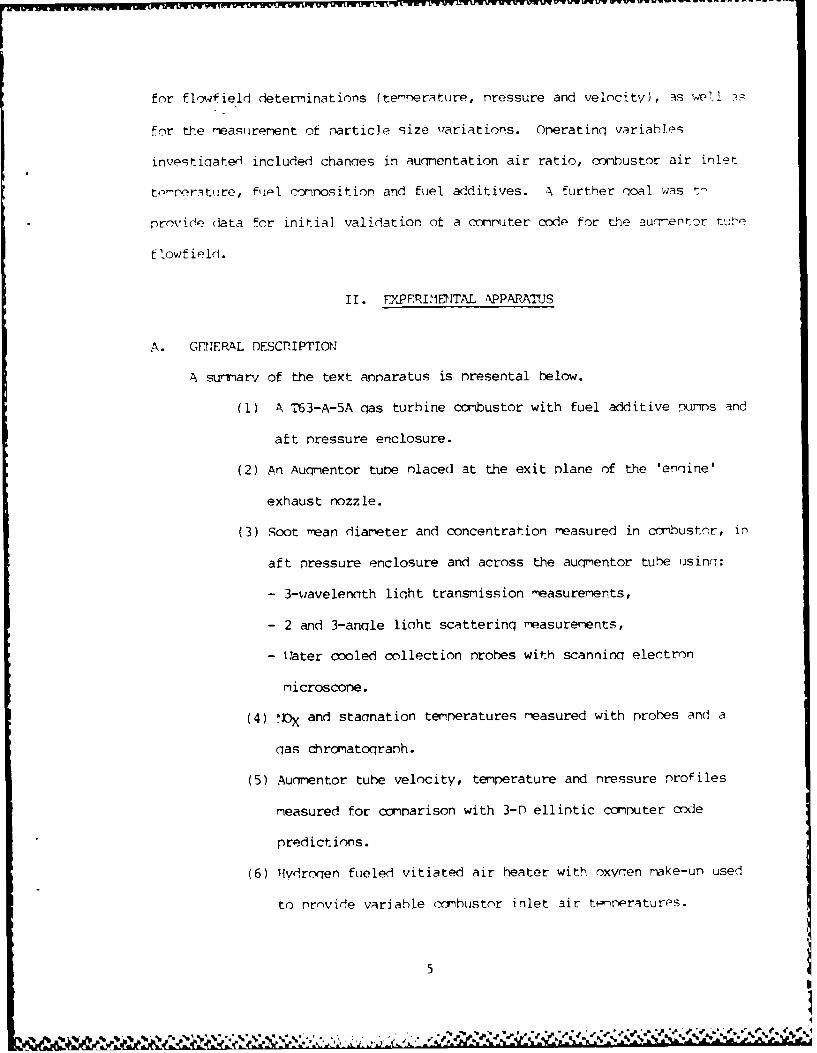
for flowfield determinations (tenerature, nressure and velocitv), -s well
for the measuirement of narticle size variations. Operatinq variables
inveqticiated included chanaes in aupmentation air ratio, corbustor air inlet
ter-rtuire, fll crinositior and fuel additives. A, further poal was t-
provide ( ata for initial validation ot a connuter code for the aucrnentor tune
flowf ield.
II. EXPERPIEITAL APPARATUS
A. GENERAL DESCPIPTION
A surnanv of the text apparatus is nresental below.
(1) A T63-A-5A qas turbine conbustor with fuel additive oumns and
att pressure enclosure.
(2) An Auqmentor tube nlaced at the exit plane of the 'enqine'
exhaust nozzle.
(3) Soot -ean diarveter and concentration measured in combustr, in
aft pressure enclosure and across the auqcentor tube usinn:
- 3-wavelenoth liqht transmission measurements,
- 2 and 3-anale linht scatterinq measurements,
- Qater cooled collection probes with scannina electron
microscone.
(4) OX and stacnation temperatures measured with probes and a
nas chromatogranh.
(5) Aurr-entor tube velocity, temperature and nressure profiles
measured for connarison with 3-P elliptic computer code
predictions.
(6) fiVrlroqen fueled vitiated air heater with oxycien make-un used
to nrovide variable ccmhustnr inlet air te-p-raturps.
5
60M 0

B. COMBUSTOR
An Allison T-63-A-5A combustor can was used. Included were
the iqnitor, combustor housing, liner and turbine nozzle block. A stainless
steel chamber was attached behind the nozzle block with a converainq exhaust
nozzle sized to provide the proner chamber pressure. Figure 1 is a schematic
of the combustor and figure 2 presents photographs of the carbustor on the
test stand.
C. AIR AND FUEL SUPPLIES
Compressed air for the ccrmbustor was supplied from a 3000 psi storaqe
tank system. Air flowed through several valves and pipinq to enter the
combustor through two ducts which originally received air from the enqine's
compressor. Remote control for air flowrate was achieved using a dome loaded
pressure regulator and sonic choke. A solenoid operated valve controlled
on/off operation. Air pressure and temperature were monitored at the sonic
choke, allowing calculation of air flowrate.
A 20 gallon tank supplied pressurized fuel through a turbine flowmeter,
a throttle valve and an electric solenoid shutoff valve. Nitroqen, remotely
controlled by a dome loaded regulator, was used to set the desired fuel tank
pressure. Fiqure 3 is a schematic of the air and fuel supply systems.
D. HYDROGEN-FUELED VITIATED AIR HEATER
A vitiated air heater was installed downstream of the inlet air sonic
choke. Make-up oxygen was added to the heated inlet air prior to entering
the combustor to account for the oxygen burned with the hvdroqen. Ignitor and
heater gas controls were located in the control room. A thermocounle was used
6
6Wel

to measure the heater outlet (combustor inlet) air temperature.
E. CMtMBUSTOR THERMOCOUPLES
Five ther'nocouple stations were located radially in the combustor (Fiqs.
4,5). Chromel-alumel thermocouple outputs were recorded by the data
acquisition system.
F. ADDITIVE METERING PUMPS
Two Eldex Model E precision meterini pumps controlled the fuel additive
flowrates and were remotely operated by a switch in the control room.
Additive volume used was determined by measuring the aniount of liquid in the
reservoirs before and after pump operation. Mixinq of additive and fuel was
done by a swirl-type mixer.
G. CONTROLS AND DATA RECORDING
All data were recorded by a Hewlett-Packard data acquisition system.
Pressures, temperatures and fuel flowrates along with transmittance and
scattering diode voltages were recorded for each phase of a run. Real time
exhaust temperature was displayed on a strip chart recorder for determination
of attainment of steady-state operation.
Each run consisted of four phases: pre-iqnition data, hot run data with
and without additives, and post-fire data. For each phase, desired
parameters were monitored and recorded and certain test sequences were
controlled by the data acquisition system. Upon completion of each test, a
hard copy of the desired parameters was produced.
7 1
. . . .. . . . . . • w r q " %

H. CO!IBUSTOR PARTICLE SIZE DIAGNOSTICS
A schematic of the combustor instrumentation is shown in figure 6.
Details and dimensions of the liaht scattering and light transmission
apparatus are nresented in figures 7, 8, 9, and 10. Several variations to
those presented in the figures were employed. Later tests were conducted with
the white light source used in the combustor section reolaced with a He-Ne and
an Arnon-ion laser.
In this investiqation, a combination of liqht transmission and forward
light scattering techniques was utilized to measure the particle size D32 and
the mass concentration (Cm). The D32 determined from liqht scatterina
measurements served as a check on the value determined from the liaht
transmission measurements to increase confidence in the data.
In the exhaust region of the combustor, white-liqht from a tungsten
source traveled through the test section to the detector assembly, where the
beam was split into three parts, each passinq throuqh a narrow-pass
interference filter to a photodetector. The transmission measurements from
these three wavelengths produced three values of mean extinction coefficient
ratios. From plots of mean extinction coefficient ratio versus D32 for
different indices of refraction for the soot particles, it was possible to
determine D32 and the index of refraction of the particles. At the sa-e time,
scattered liqht from a He-Ne laser was measured at 200 and 400 in the exhaust
region. With the intensity ratio (multiplied by the sin 40*/sin 200 to
compensate for the difference in scatterina volume at the two angles) as input
to a plot of intensity ratio versus D3 2, a second measurement of )32 was
obtained. This value was independent of the refraction index of the narticI-
and was also independent of the liqht transmission measurements.
8

In the combustion region, two laser sources were used for the liqht
transmission measurement. This yielded one mean extinction coefficient
ratio. With the index of refraction determined from the three-wavelennth
measurement in the exhaust reqion and this single ratio, the plot ot mean
extinction coefficient ratio versus D32 gave the value of D32 in the
combustion reaion. It was assumed that the index of refraction of the
particles remained unchanged as it nassed from the combustion region to the
exhaust region. Scattered light measurements were to be taken at 200 and 400
for the He-Ne laser source to yield a second value or D32 as a check against
that obtained by the two-laser transmission measurements. However, these
scatterinq measurements could not be successfully taken because of the
presence of excessive combustion light and the low output power of the He-Ne
laser. Finally, from the value of D32 obtained from the two-laser
measurement, the mass concentration was computed.
In initial tests using a white-light source in the combustor optical
path, phase-lock amplifiers were unsuccessful in separating the siQnals from
the source and from the combustion generated light. Therefore, tests were
conducted using a source "light-on" and then "liqht-off" technique to obtain
the transmittance values at three wavelengths. This method was partially
successful, but was limited in accuracy due to the maqnitude of the combustion
generated liqht. The Drojector liaht source was then replaced by 2 lasers, an
araon laser operating at .488 -icrons and a He-Ne laser operating at .6328
microns. These sources, being significantly more intense, were able to be
detected through the smoke cloud despite the combustion liaht. The light
chopper, operating at 90 Hz, was placed in the laser path before enterirg the
Cr,)t)h Ctr. The . .ri '1iode * tr',u~r t (" ' - i,- r! h ~r ' r ^
9
synchronized with the chopper. The phase lock amplifier produced an outnut
which was Proportional to the chopped light siqnal. In addition, laser line
filters were installed in the photodiode detectors to help filter out
co-bustion liqht. Before actual data were taken, several trial tests to
evaluate the effectiveness of this setup were carried out and the results
showed that the combination of liqht chopper, phase lock amplifier and laser
line filters did eliminate the influence of combustion light on the
transmittance readings.
As the problem of combustion liqht interfering with the transmittance
measurement did not exist in the exhaust region, a projector-type light
source was used here. The transmitted light entered the photodiode detector
box and was split into three paths by beam splitters. These three beams were
collected individually by three photodiodes which had filters of .450, .650
and 1.014 microns respectively. For light scattering measurements in the
exhaust region, a He-Ne laser beam at .6328 microns was used and the phodiode
detectors were positioned at 200 and 400 to ollect the scattered liqht.
1. AUGMENR TUBE AND INSTRUMENTATION
The augmentor tube, shown in figures 11 and 12, was instrumented at
stations 1.3 inches inside the bell mouth and 14.0 inches inside the exhaust
end. Allowances for adjustment in the axial positioning o: the tube and the
use of different inlet geometries enabled different augmentation ratios to he
obtained.
The optical measurement apparatus (Fig. 13), which included a
three-wavelength light transmission device and a two-anale, forward scattering
light intensity device, were cart-mounted and Positioned imediatelv aft of
10

_nw Sww 7W~I P rw 7 l7WU7 r9@92 - .r'-.-
the aur-entor tube. Each of these cptical devices provided a measurement of
the mean soot oarticle diameter (D3 2 ).
The aucpentor tube (Fip. 14), through viscous mixinq of the primary jet
exhaust from the T-63 with the ambient air, entrains a mass flow such that at
the aurqmentor exhaust, the mass flow is greater than that of the primary jet.
If a sufficient lenath of tube is provided, the velocity (and temperature)
profile at the auamentor exhaust will appear relatively flat and considerably
reduced in peak maonitude. It is by this means that the exhausts of qas
turbine enqines are conditioned before entering a test cell exhaust stack.
For determination of the mass flow through the auqmentor tube, pressures
and temperatures at various tube positions had to be made. Two methods were
used.
The first was an electric motor driven traversinq probe (Fip. 15),
which yielded staqnation pressure, stacnation temperature and static pressure.
The probe, which consisted of a United Sensor Kr-18-C/A-12-C Kiel probe
enclosed within a 0.375 inch stainless steel tube, and a static pressure probe
extension, was installed 1.3 inches inside the bellmouth of the augmentor
tube.
The second method of data peneration was a stationary staonation Pressure
(X-shaped) rake attached 14.0 inches inside the exhaust end of the aucmentor
tube (Fia. 16).
In the bynass-air reaion of the aucqentor tube inlet flow, and in the
aucrmentor tube exhaust flow, the qas was assumed to be ideal and
incompressihie since the air flow in these reqions had verv low vel )citv
11 dI
* % .s. * ~ , % ~] ,.,.. . ,,v _..- ---.. . ' (,- "d -.. - V- 1 f ' .<: t' -

(M << 1.0 ). Thus, the velocity was determined usinq:
V = [2(P t - Ps)RT/Ps() / 2 ()
Within the central core of the aucmentor inlet flow, the flow was
near-sonic due to underexpansion of the choked T-63 exhaust nozzle. In this
reoion compressibility effects could not he ionored and the velocity was
determined as follows:
V L (2)
Since y varies somewhat with temperature, the measured staqnation
temperature was used to estimate its value for pure air. The lean overall
fuel-air ratio did not warrant any corrections for qas composition charqe.
The local Mach numbers were determined using:
M = ([2/( Y-l)] [pt/Ps)(y-I)/y -11}1/2 (3)
Similarly, the static temperature was determined by:
T = Tt/{l - [(y-I)/2]rl 2 } (4)
Calculation of y was done by usino a polynomial fit developed by
Andrews and Biblarz (Ref. 31.
12
- -'3%~.V% '~%w%..

III. PAT7(7iLATF SIZI'-G 'i7,P(4F)
A. LIGHT TTW S'!ISSIOV TFCHTQ( F'
!,. T. C~sh~4ar [Ref. 4] has successfillv irnlieoi tris i ec:'il
measure the particle size and mass concentration of a clour! of oke. The
transmissior of liqht through a cloud of unifor particles is iiven
Bounuer's Law (Ref. 4]:
T = exp (-OAnL) = exf[-(30.,,L/2pd)] (3)
A more useful relationship was developed by Dobbins (Ref. 5] for a
polvdisperse system of particles:
P
T = exn[-(3OCrL/2pD 3 2 )] (1)
Using Mie scattering theory, 0 can be calculated as a function of
particle size, wavelenqth of light, complex refractive index of the narticle
relative to the medium and the standard deviation of the narticle size
distrihution. A loq-normal distribution for the s-oke particles was assu-ned.
A ccyrnuter proram (provided by K.L. Cashdollar of the Pittsburgh MIining
and Safety Research Center, Bureau of Plines) produced nlots of Ok and
0, ratios (which are both functions of wavelength) versus values of D3 2.
Takinm the natural lcqarithm of eouation 6 and writinq it for a specific
wave length:
in T= O [-3CTL/2 0D3 2 ] (7)
13

Since the three-wavelenoth !tctor measures the transmission t-'r .111 rr..
wavelenaths over an identical oath throuqh the smoke cloud, the ratir- -r e
locarithms of the transmissions at any twvo wavelencths is e Tual t- the rat£i
ot t.hf calculpted extinction coefficients for the same wavelenr-ths:
[in T.xl/l1 T. 2 = rQi/1 2 ]
With this ratio as the input oarar-eter to the O5 ratio versus D3 2 "i t,
the value of P32 can be determined. As the three wavelennth -,easurements
yield three ratios, three values of -32 will be obtained. If the refractive
index (i) and the size distribution width (a) are correctly chosen, all three
values of D32 obtained from the X versus D32 plots will be consistent.
If the three values of D32 are not consistent, either the sire of the
distribution width or the refractive index, or both, must he varier. "ost o f
the rarticulates from the combustion can reasonably e assumed to be carbon.
From nrevious studies [Ref. 41, some refractive indices for carbon are
available. In this investiglation a complex refractive index of
i = 1.95 - iO.66 was mst often successful in correlatinG the data. The
refractive index of the surrounding medium was unity for air and the standar-
deviation of the particle distribution, a , was taken as 1.5. Other values
that have been used with less success are m = 1.80 - .60i, 1.90 - .35i,
1.95 - 66i, 1.60 - .60i, and a = 2.0 . Once OX r)32 , an4 Tx are know-,
the mass concentration can be calculated from the followina rearranemen " f,
eouation 7:
-[2pD 3 2 1nTX1/3-0xL
14
l&p
-... S.

Fiqures 17 to 20 show typical plots produced by the Cashdollar orm, lra7 for
aiven values of refraction index (m) and three values of wavelenoth.
The t-hree-wavelencth light transmission -easurement method has the
advant,:es t at (1) it can be used to very low transmittance values and still
yield accurate mean particle size and concentration, (2) it reoTuires only
inexo)ensive apparatus, and (3) data reduction is sir'ple. However, (1) it
jenerally only yields mean particle size with no information on the size
distribution, (2) it is generally limited to particle sizes between
approximately 0.05 and 0.4 microns, (3) it recTuires knowledge of the index of
refraction, and (4) it assut-es that the particle index of refraction is
indenendent of wavelonrth.
B. FORtARD LIGHT SCATTERING TECHNIQUE
An alternative or supplement to the light transmission techniauie for
finding D32 is to measure scattered light. For large particlesTD
cx (7) ) 5 it has been shown that using only Fraunhofer diffraction can
result in accurate particle size determination. In fact, Hodkinson [Ref. 6]
has shown that by using the ratio of intensities at two forward angles,
particles can be sized down to values of a - 1.0 (D - 0.2 microns for
X = .6328 microns ) using only Fraunhofer diffraction. Boron & Waldie
[Ref. 7] have shown that accuracy rapidly decays for D 0.5 microns if only
two angles are employed. Powell, et. al., [Ref. 9) have successfully used the ;
techninme for D32 - 0.4 microns. Making reasurerxents with r'ore than one
pair of forward scattering angles can reveal the accuracy of -easurement [Ref.
6]. Polydispersions are also less prone to measurement errors for ->3 2. Of
course, if the -re crmplx 'ip fujnctions are ised, then there i ,jch '
15
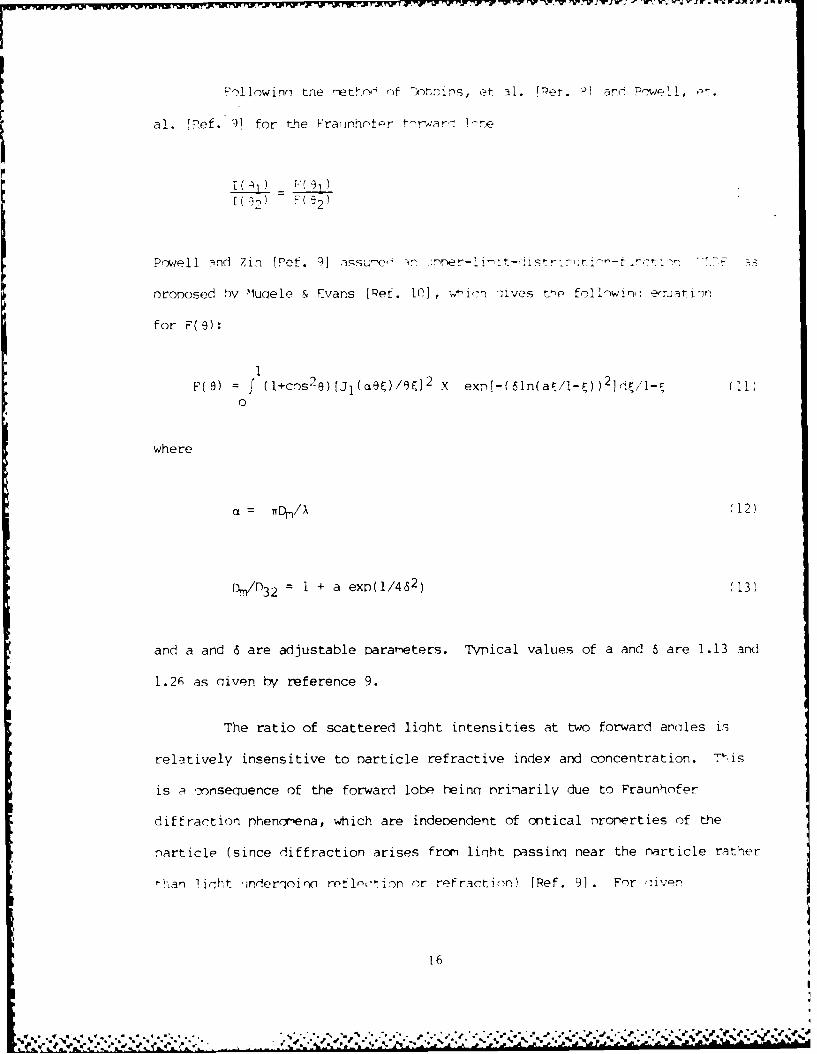
1'o11owinn tne -ethrl of ?ctrirs, -t a1. [Per. -2I ano w( I,~
al. liPef. )I for the Frainrhofpr t-rwar- 1-re
nornosed hv 11uqele & Evans [ Ref . 10~] , ;.icl- -;ives tefoll-owin- %?crJqt-ior"
for F(9):
EC e) r (l+cns2 8) [jl(aq )/qE12 X exnf-(6ln(a 1- ) )2jrj1 (10
where
Fj/3 + a exn(1/462) (13)
and a and 6 are adjustable parameters. Typical values of a and 5 are 1.13 and
1.26 as cudven by reference 9.
The ratio of scattered liht intensities at two forward ancles i!;
relatively insensitive to narticle refractive index and concentration. This
is a -Yonseauence of the forward lobe heina nrinmarily due to Praunhofer
diffraction phenciiena, which are independent of cp~tical properties of the
narticle (since diffraction arises from' liriht passini near the narticle rather
t h-an I irht inderin o rot loct i o rr ref ract ion) (Ref . 91 . For (,ivel
16

values of a , anle e , a and 6 , ecuation 11 is reacdilv evaluated '.
nu-erical inteqration, nroducinc a nlot of intensity ratio verstus '32
this investiQation, intensity r-easurerents at 200 and 400 were taken. In
orler to have the recorded intensities referenced to t.rn sarne sctrerin,-
volu *, the intensities -'ust 5e rnitinlied yv sin 9 . The ratio of the
intensity at 400 nultinlied '-v sin 400 to the intensity at 20 ' -ultinlie W
sin 200 is then used for entrv to the plot, vieldinq a value of )32 • Ciqure
21 shows a typical plot of the intensity ratio versus D32 fo)r a wavelen-th F
.6323 -icrons.
Currently, plots similar to Fi(ure 21 are beinq developed for 400/200,
400/100, and 200/100 based umn both Fraunhofer diffraction and the mre
comneDete Plie functions [Ref. 1i].
C. OrtFSBI"ATION TECT I UFS
Usinn "oth forward scatterinn reasurements (at two or more anoles)
and trans-ittance measurements at three waveleniths sirultaneously can
increase the accuracies of rveasure-ent for narticle size and concentration.
one such technicTue is shown in Firqure 22. Liciht scatterinq measurements are
used to yield D32, independent ot index ot refraction (for D ) 0.3 -icrons)
and concentration. In this case, the licht transmission measurements yield
the standard deviation of the assuimed distrihution and the "eftective"
narticle index of refraction. The extinction-coefficient and '-easurpd,
trans-ittance at one wavelenIth then yield the narticle concentration.
The tern "effective" particle index ot refraction is used in contrast
to the value f-r the otire substance. Te fortPr is 'at the mticl! technir-
A" s f-i:ndl n Poe_ inn ~'of. Ah Ssoot
17
..............
be quite porous and have an "effective" index of refraction si'inificar'-,lE-
than that for a solid carbon particle.
Unfortunatelv, soot sizes produced bv qas turbine encines have r-3n, ed
from 0.01 to 1.0 microns. Ohen D 4 0.3 microns, 0)32 hecynes 3 functicon -)t
both the scattered intensity ratio and the particle index of refrictio. ('ie
scattering vs. Fraunhofer diffraction). In this case another iteration sto
is reguired to determine D32 ,m , and a .
IV. RESULTS AND DISCUSSION
A. INITIAL TESTS AT NOMINAL ODR3US7OR FLOWRATE
The initial tests in the current investigation were conducted at the
same test conditions as in a previous investiqation [Ref. 11. The particle
sizing diagnostics were improved and data acauisition and experiment c)ntrol
were transferred from manual operation to the computer system.
A test using NAPC fuel #1 (Table I) and the 12% Cerium Hex-Cem additive
was conducted. Durin the run, data with an additive concentration of
20ml/allon of fuel was taken first, followed by data without any additive.
All hot-run data were taken after the cambustor exhaust temperature had
reached a steady state value (slightly above 1200 degrees F. for these tests).
Table II summarizes the average test conditions.
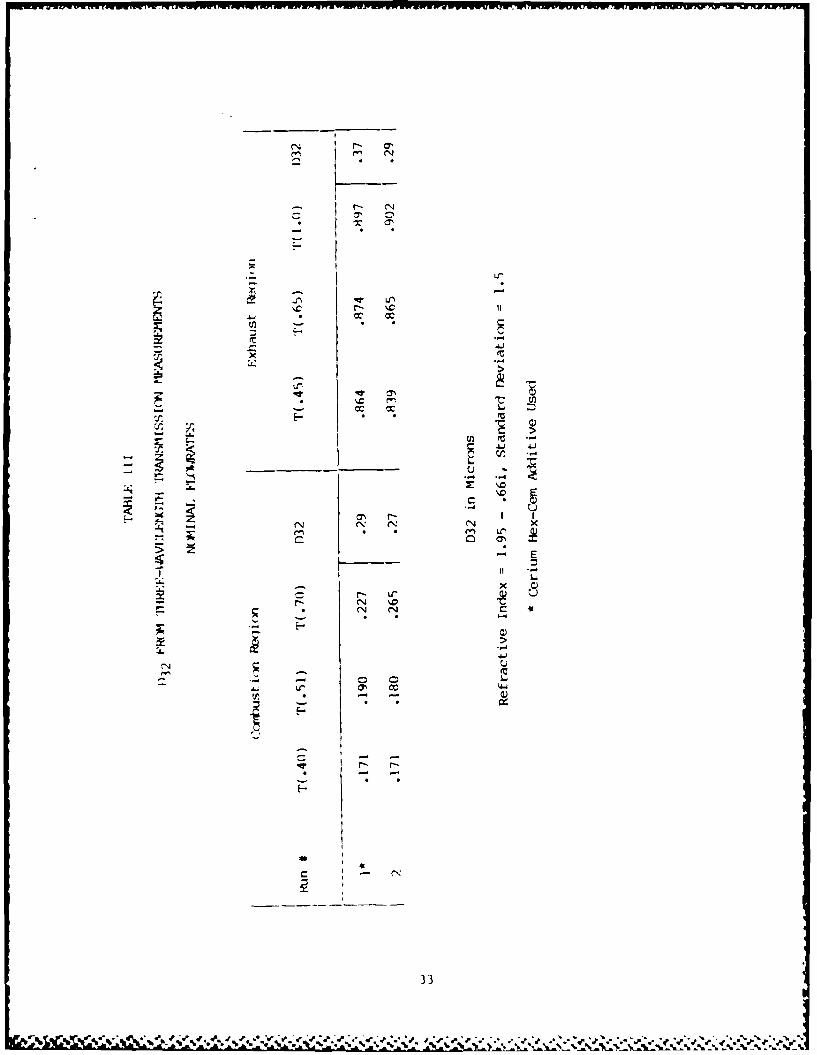
Results of the light transmission measureent technique to determine
average particle size are surimarized in Table III. The liaht transnission
data were correlated best with the Mie curves usina a refractive index of 1.95
-. 66i and a standard deviation of 1.5.
18
Lioht transmission particle size data was improved over previous results
with the T-63 co-mbustor [Ref. 1]. In qeneral, correlation to within a ranae
of ± .04 microns or less was obtained. Measurements in the corbustion reqion
were- taken across a larme recirculation zone. Thus, the measured particle
size represented an averaqe of all the particle sizes in this zone and the
surroundinq annulus.
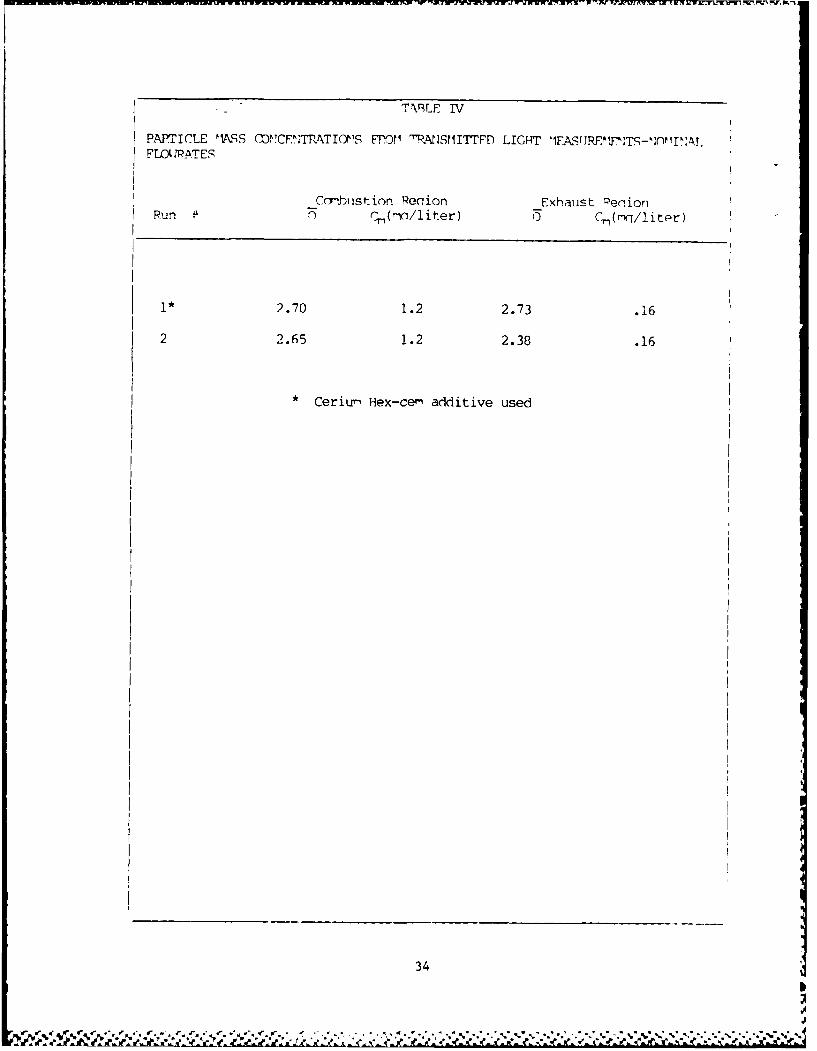
In the exhaust reqion, the limited data indicated a significant increase
in particle size when the additive was used. However, particle mass
concentration (Table IV) did not change, indicatinq that use of the additive
changed the particle size but not the total mass. This result was in
aqreement with the data presented in reference 1.
Results from the liqht scattering photodiodes in the exhaust stream
are summarized in Table V. This technique also indicated that an increase in
particle size occurred when the fuel additive was used, hut there was a
discrepancy between the particle sizes obtained from the transmitted and
scattered light measurements. The scattered liqht measurements resulted in
smaller particle diameters. This may have resulted from (1) uncertainties in
the scattered data (due to the low signal strengths recorded) and/or (2) the
uncertainty in ln-ratios when transmittance values are very high.
B. COMBUSTOR RESULTS AT LOW MASS FLO;S
The investigations reported in Reference 1 and above were conducted
usinn four exhaust tubes at the aft-end of the corbustor pressure vessel.
This was done to facilitate the use of samplinq probes which traversed the
combustor centerline and were inserted from the rear of the apparatus.
Subsernuently, the tubes were revoved and a converninn nozzle was 7del. This
19
_",."-" V .~&e~.. ~v vv*.'< . - ~ ,S *j* ~ d~d
5 ~~ %

was done to provide realistic input into the auqmentor tube, which was t-) he
positioned downstream of the "engine".
The current investigation was conducted at the same fuel-air ratios
and combustion nressures as in the earlier investinations (Ref. 1 and &bove),
but with lower air and fuel flowrates. These conditions resulted in lower
fuel flowrate throuqh the atomizer and lower air flowrate through the
combustor can mixing and dilution holes. Thus, it was expected that the
results would -more nearly correspond to oerating conditions (idle, etc.) in
which the fuel atomization was not optimum and in which the primary zone
fuel-air ratio would be altered.
In this investioation, NAPC 07 fuel was tested at fuel-air ratios
between .014 and .016. In addition, the effects of three smoke suppressant
fuel additives (Ferrocene, 12% Cerium Hex-Cem and USLAD 2055) were tested
using the NAPC 47 fuel. Two tests were also carried out using NAPC 43 fuel.
The properties of MAPC *3 and #7 fuels are shown in Table I. Fuel *7 was
higher in aromatic content and lower in hydrogen than fuel #3. Fuel additive
and fuel-air ratio effects on mean soot diameter, soot concentration, and
opacity are discussed below.
Attempts to use the phase-lock a-lifiers/light choppers with the low
intensity white-light source were not successful in the combustor. The
combustor generated light was very intense across the visible spectrum,
resulting in an inability to separate the transmitted light and combustor
light signals. For this reason, two lasers were employed with wavelengths of
.488 and .6328 microns. These provided sufficient intensity for the
phase-lock amplifiers to successfully remove the random freqfuency combustion
ligiht. However, only two wavelengths were used. This lid not oer-it
20
. .
determination of the index ot refraction for the narticles (as mossile .. :r
three wavelenaths are used). It was therefore assumed t-hat the index ot
refraction was unchanqed fro the value determined in the aft oressure vessel,
where the white liaht could 5e successfully used since there was -n
sinniticant radiation of visible liqht.
Runs 4, 5, 7, R, and 10 yielded p3 2 values with a larqe
uncertainty, even thouqh the transmittance values were steady (Tahle VI).
Run I') did not provide a D3 2 value for the conbustion reqion.
This was because the extinction coefficient ratio obtained from the
experirlent resulted in a value off of the curve of the extinction coefficient
ratio versus D32 plot.
Runs :ll and #12 qave qood exhaust transmittance readings, but the
computed extinction coefficient ratios did not result in prooer values for
entry into the plots to obtain a D32 value. In the earlier experiments at
nominal fuel and air flowrates, the uncertainty in D32 was enerally as low
as the best data obtained currently. There are at least two p ossible causes
for this "lack-of-correlation" of the narticle size data. If the narticle
size distrihution was bi--Kodal, then the assumed mono-modal, lo-normal
distribution would result in unrealistic 'lie predictions. Powell and Zinn
[Pef. 121 have also reported that soot particle rvorositv can result in a
sicnificantlv reduced "effective" particle index of refraction.
Thus, a shift in atmization and mixina conditions apnears to have
siqnificantlv chanqed the soot narticle characteristics.
21
r e ,r

- -- INLW- M M.W 6,Wi WUNUW UP prm F a IUJ
fuel-air ratio. It also is ohscrved (althouca the dati is li-it--. 4 r-
test) that in increased cobustor air inlet- termnerature resulted I
decreased f)32 at the sar-we fuel-air ratio. Howev-r, as seen in fiv,:re 2.1,
- 32 mnrrl.ateq with exhaust termerature, indepen*den- -f .i- ir] -
te-erature. as expected, increased inlet air toerture increased thjy
exhazust tenperature (at a civen fuel-air ratio) (see ti-. 25) nd t-,e
latter appears to have the dominant efftect on r%32"A
rising ".APC a3 fuel (lower aromatics and higher hvdroqen content) in
place of UIAPC 47 resulted in larmer P32 at the same fuel-air ratio.
NPAC "3 also produced a lower exhaust tenperature for the sane fuel-air
ratio. Thus, larmer r)32 was expected. However, even at the same exhaust
temrneratilre a larmer r32 was observed. This result indicates that 'gnall
changes in fuel composition can have effects on the nean soot size.
Transmittance (without additives) is nlotted acainst exhaust te-feratir-
in figure 26 for the three wavelenqths which v&-re utilized. At any niven
wavelenqth, transmittance increased onlv sliahtlv with exhaust teipnerature.
This resulted (Table VII) in onlv small (less than 5%) chances in soot -ass
concentration with significant (approximatelv 30%) chances in F)32 It
apnears for this rarticujlar comhustor and test conditions that fuel-air ratio
effects soot size, but not total nass.
Figure 23 and Tahle VII also indicate that the lisp of '-nke-sunnressant
fuel additives:
(1) had insiqnificant effects on exhaust temnerature (heat content)
(2) increased trans-ittance with sot -pan Iia-)eter re(-aininc
apnroxi-atelv onstant, and
22

(3) rpduced exhaust soot concentration (and exhaust -1acity).
Co"parison of fiqures 24 and 27 shows that in the (.xrbustor, rua.-ticle
size channed more ranidly with fuel-air ratio (or exhaust temperature). Nt
low fuel-lir ratios (or exhaust temperature) the rarticle size in the
comhustor and in the exhaust Iuct were nearly identical. ks the fuel-air
ratio was increased, the combustor particle diameter decreased more rardily
than in the exhaust duct. Thus, there was a crowth in mean particle diameter
from the combustor to the exhaust duct at hiaher fuel-air ratios.
The above results, which were obtained at reduced fuel and air
flowrates, were considerably different than the results reported in reference
I for nominal combustor flowrates. The major differences were as follows:
(1) Three-wavelencrth technique data often did not result in
consistent values of D32 , indicatinq a possible bi-modal size
distribution and/or a very low "effective" index of refraction,
as is apparently characteristic for porous soot aiclomerates.
(2) Hipher aroratic/lower hydroqen fuels resulted in slinhtly
smaller D32 at the same exhaust temperature and hinher
exhaust temperature at the sare fuel-air ratio.
(3) Additives had no effect on D32 but reduced soot
concentration.
(4) D32 decreased with increasinq fuel-air ratio.
The data indicate that com-ustor test conditions (atomization and
primary zone fuel-air ratio) can siqnificantly alter exhaust soot structure
and/or size distribution.
T addition, tie F- lowin , r sults ,t3 t e:
23

(1) D3 2 increased in the axial direction at hinher tLel-ir
ratios, hut not at lower fuel-air ratios.
(2) D3 2 in the exhaust duct depended primarily upon, and decreased.
with increasing values of, exhaust temperature.
(3) Smoke suppressant fuel additives were more effective in reducinq
opacity with hinher air inlet temperatures (-10% more reduction
in Cm for 270oF increase in temperature). It is not clear at
this point how the increased air inlet temperature improves
additive effectiveness. Increased air inlet temperature can
increase both kinetic and vaporization rates and may increase
the residence time at temperature.
C. AUGrr1MR JBE tEASUREENS
Measurements were also made to determine the mean soot size at the exit
of the aucwentor tube. In addition, aucwmentation air flowrate was determined
by knowino the co-bustor flowrate and measurinq the total flowrate in the
augmentor tube. The later was accoimplished usinq a pitot rake near the
aft-end of the augnentor tube.
Based on earlier results with a subscale test cell [Ref. 131, the F 3 2 at
the aucmentor exhaust was expected to be less than 0.3 microns. This promoted
the use of the three-wavelength transmission technique. Particle diareters at
the exhaust of the augpmentor tube were measured to be in the range of 0.31 to
0.42 microns, which is larae for accurate measurements using the
three-wavelenoth technigue. This manifested itself as a large soread in the
values of 032 obtained from the three transmittance ratios, a direct result of
all the extinction coefficient ratios approaching unity when particles exceed
0.4 riicrons (see Fin. IR). A small variation in the extinction cefi(i,-t
24

ratio resL1ts in a laroTe chance in ')32*
\tter-nts at calihration usino 'ational Rureau of -stardard ().9 -'icro'
,Oolv-,stvrere hpads also resulted in a wide spread, centered on q iro'
T'c~s-ttr'~sin the ranrce of '15 provided the smallest snread4 i'. ro
ca!;.Trition Attem-pts.
The transmittances in the exhaust stream were hiq7h, anproximatel,
95 k, which nrmpted the utilization of a double nass of linht throuril t -e
A ur-ntor exhaust strear', as well as the installation of a hlockina nlate --t
the inlet of the auqmnentor tube to reduce the dilution of thle soot. The
blockinc, Plate resulted in An aunmentation ratio ot 0.53 and transm'ittances of
Arnroxir'atel-v 89%.
As a cross-check for particle size, a two-anle (200 and 401) forward
scatterinn device was installed. This device provided relatively consistent
particle size data. This data was in qIood arireerient with the data obtained
usinn the three-wavelenath device, when the latter did not exhibit its
characteristic snread. As a result, the lirqht scatterino me-aSUrerment device
apneared to provide the better data.
The traversinj Kiel probe was orinlinally desirined for use in flows
with less than sonic velocity. Initial utilization, however, showed r-ni-ns
of supersonic flow in the expansion of the underexnanded exhaust jet o f the
sonically choked T-63 nozzle. This invalidated the assumption that t'he static
Pressure would be relatively constant across the aurrnentor inlet.
M1odifications to the Probe were then made, which included a static m-)rt
extension and strenntheninn of the orobe support. Pirthe-rp, -
runs, --efforts .-r(, -vade t,- ensu,,re that the '!ach number was is !-w %s~-
25
N.. % V%d

to reduce measurement errors.
The velocity nrofiles shown in fiqures 28 and 29 were obtained for
future validatioan of thie computer aoe for aucmentor tube flowfield
Table VII nresents the transmittances for the three-wavelennths,
narticle diameter from each extinction ratio, the scattered liqht intensity
ratio and the correspondinq oarticle diameter. These runs were all conducted
with the T-63 exhaust nozzle flush with the aucrentor tube blockinq plate.
The fuel used was NAPC #7. Additives used were 12% Cerium Hex-Cer, Ferrocene
Solution and USIAD-2055. Table IX is provided for comparison of fuel-air
ratio, terierature and auamentation effects on particle size.
In these initial tests there were insufficient temperature measurements
taken throunhout a qiven run to accurately determine the effects of auqrentor
exhaust te-erature on narticle size. However, the aumentor exhaust
te-npratlire followed the enqine exhaust temperature (fixed auqmentation air
dilution) which was recorded continuously throuohout the run.
t;ith one exception (Pun 8, 8a), the particle size appeared to
increase with fuel-air ratio (Fiq. 30), orosite to the cambustor behavior.
This was evident in Runs 9, 10, 11, 12, and 16. Runs 8 and 8a exhibited a
soot "blow-out" which resulted in a wide ranoe in measured transmittances.
Althouqh the accuracy of the particle size measurements may result in
nuestionable conclusions, there did seem to appear to be a siall, but
consistent, increase in auomentor exhaust particle size with increasina
tererature. This was in contrast to a sliqht decrease in T)32 -t the
-buntr -xti with increasing: tevfnrature.
26
All additives exhibited the sane annroximate effect at the aurr n-r k
tube exhaust; a verv small (.02 micron), .Nit consistent, increase i n 32
The soot mass concentration should not channe annreciablv across the ft
au.r-'entor tr- b since temperatures were -,uite low. r owever, soot ierosits on
the tube walls can ereove sine soot from the flow. There was no consistent
trend in the calculated chanae in Cm when the additivps were used.
Only one hot corbustor air inlet run was made (Puins 13, 13a),
resultinq in the expected increase in ennine exhaust temperature at the same
fuel-air ratio (coripare to Puns 8, 8a). In this case P32 decreased
at the aucentor tube exhaust. However, the ennine exhaust temperature did
not annear to effect aIloneration within the auqrentor tube since increased
combustor fuel-air ratio and increased coanustor air-inlet temrerature had
opposite effects on D32 at the auc~ientor exit.
Fromr Runs Pa, 9, 9a, 10, 10a, and 13, it is evident that the mean .
particle diameter nearly doubled from the T-63 exhaust to the aucqentor tube
exhaust. This could be caused bv several effects; anqloneration of -articles
or the walls sheddinq of previously impacted soot (all test rins had sooted
walls in the aurpmentor tube).
Fiqure 31 shows a a tynical impact collected test sample. A lare
variation in sizes is exhibited with the larest bein approximately 1.5
microns and the smallest in the submicron ranqe. The Hitachi 265s scanninq
electron microscope provides xood resolution; however, the carbon make-up of
the particles did not lend itself to nood viewinq without heinn flashed with
qold. The specimen nresented in finure 31 were not coated and developed a
radiance or ihnstlike annearance.
27

In Fiqure 32 the snecimens ,ere iold tlasheri filter -aner K.2 -icr-,
nore) on which the soot was collected throuch a lA-inch sarnlino tthpe.
Zoain, a su~'startial variation in narticle size from suhr-icron to larcer t-ar
'32 is '- inated ,, tie larcer rprticles in a distrihution. Thus,
th.e cticallv measured 032 of anrroxi-atelv .34-.42 -icrons a,)nears to -o
cuite realistic. Powever, it is not known how much aonloreration occurred Ic
the nrnbe.
Auqricwntation air had two effects on particle size in the auamentor tune.
The first was that the narticles apreared to approximately double in size
across the aurnentor, due to amjlomeration or wall sheddirn of nreviouslv
imnacted soot. The second effect w;as an increase in the transmittance throuch
cross dilution with secondary air. Each of these effects could be exoloited
for nrovidina a reduced stack opacity in the test cell environment.
V. SUM?ARY nF PESULTS AND PRESEt7T F)ITS
A. SUM? APY OF PESULTS
1. ,t hoth nominal and reduced cambustor mass flowrates, a narticle
index of refraction of 1.95-.66i most consistently resulted in
the best data correlation. D3 2 values varied hetween 1.10 and
0.30 microns within the combustor.
2. Combustor flow conditions (atonization and/or primary zone
tuel-air ratio) sioniticantly chanced the soot characteristics.
This was evident by the chanqes that occurred when roinal
flojrates were reduce 1 .
28

";orinal Flowrates Reduced Flowrates
(a) GIy-)d correlation for D32 (a) Often pxor correlationisino three-wavelenqth T)3 2 usina three-wavelenath-ethods. methods.
:-Ke-sunressant idditives (b) Smoke-su:,r"-sant 3ditiv-'eincreased D32 without did not cha; le 732' OUtiinificantlvi effectinq mass reduced -ass concpntration.
,concent rat ion
(c) Exhaust r32 was independent (c) Exhaust r32 decreased withof tuel-air ratio and fuel increased exhaust te-ner -icorrspsition. ture (fuel-air ratio).
Fuel with lower iro-atizs'hinher hydrogen contentyielded larer D32.
3. The cause of the poor correlation of D32 at low flow conditions
is not known. Results fro- other investiqators surnoest that
hi-modal size distributions ray be present and that soot porosity
can sirnificantly reduce the "effective" index of refraction of
the particles.
4. At low flowrates, chaninq fuel-air ratio effects D32 but not
the total mass of soot.
5. At all flow conditions, increased combustor air inlet temperature
increased the effectiveness of smoke-suppressant additives in
reducing opacity. Increased vaporization and kinetic rates and
possible increased residence time at temperature could all help
explain this result. Further effort is recruired to separate the
source.
6. At low combustor flowrates, soot aqalomeration (qrowth) occurred
in the axial direction at the hiqher fuel-air ratios, hut not at
lower fuel-air ratios.
7. [>32 approximatelv doubled across the aurr-entor td'e t . ys
hetween ).31 and J).43 -icrons withiout any I'ns t 'nt - ,:
29
%S

mass concentration. Collected exhaust products revealed
narticles frro" less than 0.f5 microns up to approximately 1.5
microns. Agglomeration in the collection nrobe and/or in the
aurT-entor tube and wall ccllisions/sheddirn can all result in
these larme observed particles.
R. Engine exhaust temperature did not appear to affect aqqlomeration
within the augmentor tube. Agglomeration appears to be a
function of the soot characteristics leaving the
engine/cortustor.
The possibilitv of (1) soot agglomeration in probes and (2) shifting
size distributions and particle index of refraction with test conditions,
fuel composition and additives indicate that various optical and intrusive
measurement techniques are needed in future investigations in order to help
determine the "actual" soot size distribution and index of refraction.
B. PRESEPT EFFORTS
1. Completing evaluation of ten fuels and four s"oke suppressant
additives at two fuel-air ratios and two air inlet temperatures.
2. Varying aucrentor tube diameter to vary augmentation ratio.
3. Using polished stainless steel aucmentor tubes to help separate
effects of agglomeration from those due to wall collisions/sheddinq.
4. Using combination of 3-X light transmission and 3-9 light
scattering techniques to more accurately determine 732 and the
"effective" particle index of refraction.
5. rsing electron microscope to deter-"ine whether additives effect
-articulate composition (and, theref'-re, index -,f refricti,-,'.
30

TABLE I
FJEL PROPERTIES
NAPC 1 NAPC t3 NAPC 7
API Gravity @ 15' 38.9 41.3 35.6
Distillation (ASTM) IBP 'C 163 171 193
Cornos it ion
Aromatics (VOL %), Max 28.5 22.8 26.4
Olefin (VOL %), Max 1.79 0.75 0.86
Hydroqen Content (Wt %), Min 13.36 13.66 12.83
Aniline - Gravity Prod., Min 5360 5811 4254
Freeze Point, °C -30 -34 -31
Viscosity 0 37.8*C, (cSt) 1.78 1.62 1.77
31

TABLE I I
AVERAGE TEST CYQJDITI(S N OINAL CY1BUS7Y)R FULWRATES
Run Nu-'er ........ 2
Additive .......... ',one
Fuel Number ......... 1
Charber Pressure (nsia).. 88.7 5q1.5
Air flow (lbrn/sec) 2.20 2.21
Fuel-air ratio ...... 017 .017
Additive/fuel ratio 20 0(7l/qal)
Therocounle terperatures (dec. R)
i .................... 2165 2144
#2 .................... 2825 2R46
3 ........ o............ 1830 1P57
*4 .................... 2263 2269
T exhaust ............ 1673 1665
*12% Cerium Hex-Cwn
32
N N
CN 1 0
(N
r- .
4'4d
x
v U-'
zC rll'
LA
L '
CN 'C
- CN
a' 33
2'12 - E
T-NRLE IV
IPARTIICLE C0AS XJCFNTpATIONS, PPfl pr lSII1FD LIGHT 'lFASrRqFNT(TS-mMnpM:AFLOUPATES
Cmhi ist-ion Pen ion Exhaust Pea ionRun i (i/itr (m1tr
1*2.70 1.2 2.73 .16
2 2.65 1.2 2.38 .16
*Cerium' Hex-ce' additive used
34

a) c (N r-
W .- 4 0C; E
>~CN
U)ca)
C
.,-f- C 7 -
C) >
CncI~4-1 CN
C)N
fn CN
m CD CD c41E 0
4-
-U -4
*4'
-P -

TABLE VI
RESULTS F! M TEXTS UING NAPC 47 AND 43-* FUELS
AT L C MASS FLOW CONDITIONS
Run Exhaust Ccmbustion Reqion Exhaust Reqion
no. Ter f Transmittance Transmittance' 3 2 D3 2
(OR) T(0.48) T(0.63)(micron) T(1.0) T(0.65) T(0.45)(micron)
1 1790 .0163 .250 .140 .17 .888 .782 .675 .170
2 1630 .0156 .247 .176 .20 .380 .727 .616 .180-.210
3 1754 .0154 j.260 .136 .10 .868 .760 .671 .180-.190
4 1530 .0141 .268 .200 .21 .830 .740 .650 .180-.260
5 1530 .0140 .270 .179 .18 .847 .763 .673 .lRO-.230
6 1630 .0150 .204 .144 .21 .845 .750 .662 .190-.215
6a 1643 .0148 .218 .145 .19 .858 .761 .671 .185-.205
7 1635 .0154 .264 .144 .13 .847 .725 .664 .170-.220
7a 1642 .0153 .274 .151 .13 .874 .761 .709 .170-.225
8 1594 .0145 .255 .176 .19 .847 .765 .670 .130-.250
8a 1580 .0143 .281 .188 .18 .880 .810 .730 .180-.230
6a,7a - Ferrocene
Pa - 12% Cerium Hex-Cem
36
1 "

TABLE VI (con' t)
PFS4'1rT'S kOF rlTq -V, *'1 -NCt :I 't3 ** FI-71Ts
AT ri-V IAS9 ' m.TICY"S
un Exhaust Corbustinn Recqion Exhaust Pen cn
no. TeDip f Transmittance TransiittanceF'3 2 2
R) T(0.48) T(0.63) (micron) T(1.0) T(0.65) T(0.45) (ricrn)
9 1635 .0154 .265 .172 .17 .852 .759 .667 .180-.200
9a 1641 .0152 .297 .187 .16 .879 .805 .728 .190-.200
10 1632 .0150 .325 .162 * .851 .762 .670 .17,-.22f)
10a 1640 .0149 .337 .168 * .886 .R09 .730 .1P0-.20n
11 1664 .0156 .090 .189 .14 .845 .788 .660 *
lha 1690 .0156 .140 .240 .16 .a76 .R31 .71r)
12 IE32 .0156 .140 .230 .18 .850 .79n .670 *
12a 1628 .n5A .165 .245 .16 .870 .830 .720 *
13 1764 .0142 .560 .350 * .878 .774 .698 .150-.18t)
13a 1760 .0141 .523 .359 * .918 .838 .7q *
14** 1669 .0171 .270 .190 .12 .853 .765 .694 .200-.240
15,, 1749 .0183 .240 .190 .10 .842 .735 .66R .211-.220
9a,10a - 12% Cerium Htx-Cem
lla,12a - t;LAr 2055
13a - 12% Cerium Fiex-Cem p
13, 13a - Inlet air terirerature = 270OF
37P]
,. + ,r ' + , , :+.r +- ,¢-.: ',[ ,+ +, '2 +"+"'+', ' , ]. <.+ [. ,.. ," . .- * ,,. +,,:,. , i.-: -it, . ,:+" :,d .+ +'" +" ' +, , :' " :" " % +" .,"-.

TMLF VI I
?FRCEITrAGE M-V7GFS P-1 SqXT MJ]CErTRATI(Yi -VNr EYR{AVSTTR;Ir4C
AT " : -ASS FLOL." Cn ,'nITImO'Y,
Dun "as mount of % Peduction % Reduction in
Concentration Additive Used in Cm Fxhaust Trqns-ittFnce
(-n/litre) (ml/qIal) T(1.0) T(.65) T(.45)
6 .354
6a .347 22.8 1.9 1.5 1.41 1.36
7 .368
7a .309 30.0 16.0 3.2 4.9 f.7
3 .360
8a .270 58.0 25.0 3.9 5.9 8.q
9 .356
9a .279 58.0 21.6 3.2 6.0 9.1
in .35
10a .28 58.0 20.0 4.1 6.2 P.9
11
Ila .. 3.6 5.5 8.3
12
12a - - - 2.3 5.1 7.4
13* .361
13a* .241 58.0 34.5 4.5 8.2 13.2
* Inlet air tem'erature = 270OF
38
""" % " ,',"... ,. /', ".," , ,', ,,'.. ', ,.'"". ."""'...'"".-'- ,,'" .'' ,, ',.,." . . "'. -"."%
L.I U
E q rr r e
u~. N ,
RT .. .. . c
414
CU2
~~'t-) Ln (m -W J -r-C -)
Wr CC
o-. . .. . . . ~ 2- -crL -I
-4 II
r-4
41 qT -w CNcC CaCDN 0- O c (%m......0..m.0.....=.m......a..m.* 7S * * *
. ~ ~ ~ ~ ~ a .
E
C S..C1
I-.
>E E E Un L
--4 0 c-u 0 ; a 0I a ;C a
OPI d p 0 - OP OPS ( N (N ~ N (N
xa. z - - - - -
39
.kw. *'64

it 4c
CN4CL:-
c -
Lr Ln)
-4J.- SJg g E~'
CE) dp d OC ' -CN CN N C14 *K* 41r N
ON 00u V00
4J4d
4) =j
Q).
dP mN% -c (N ON (- (N (Nff n
-Z - 4 - -
24

U7~
I-:,
'S
a0
u~I
US-, - U.
*E
1..
0
U-4
0I
K'Up
41
* a -' -' -~ *'~~4II ~ ~
4t
P igure 2. Photographs of T-63 Combustor Aoparit'is
42

J l, ~ l ~ mW W n nJ, w, r~l~qr rii S 'S l fSfl-
z w
WI-
~Ij
-J-
0
wwI--
-J LLJ Z
w
-A L-

CLC
o 0
C-0U
* 0o
CIA.
-1j
zz
LL Z
% v %
-- - - - - -

T:EMOC UPLE
tt3
THERMOCOUPLES 40.- THERMOCOUP ES i2&4
COMBUSTOR CENTER
INNER CAN
DISTANCE OF THERMOCOUPLES FROM COMBUSTOR CENTER
#1 2.23"1#2 1.73"# 3 2.28"#4 2.01"
t5 NOT USED
Figur2 5. Comiu~trrr jeP~it .d c.
45
-<J
w CC
-- -- a.-Hzo
0 0Ti
a--0-
00
Cf))
0 0 L
wJ CL -1 :
m a.
w-Ja
0 ULa.. 0 uI
A * *. *~*.**

C44
ICI
.2n
C E-
-474
0 -i
Z. E-4
/<
//
2"2
W 4 E-~
0 4
E-4'
E8
9 ,9, 9 ,,%. *..*'. 2: .'

Z E-4-4
W 4 E-4
0
Uu -
z
00
E-4
E-4~L
~ Lw<°u ucj~ -_____ ____
049

D He-*.eFilter Laser
Photo- T CombustoDiode Section
Beam ArgonSplitter Laser
Conbiner
K E xhaus tSection
WhiteCombustor Light Scurze
JI He-Ne Laser
Figure 10. Setup of the Optical System to Measure Light Transmission
and Scattering Intensities
50
w U~ -
I-
o 0z I-z
W w
crIw 0
-~~~~~~~~~ cr..-S ~ **,~Z2. .. *~,* ........ '- ~ - -'
'rww
Figure 12. Photograph of Augmentor Tube ParticleSizing Apparatus
Figure 13. Photograph of Augmentor Tube ParticleSiziu Apparaitus
-% % % -

Dw 0
LJ.JCC
ilk
ZL1L
z
53
S.L

Figure 15. Traversing Kiel Probe
54
i
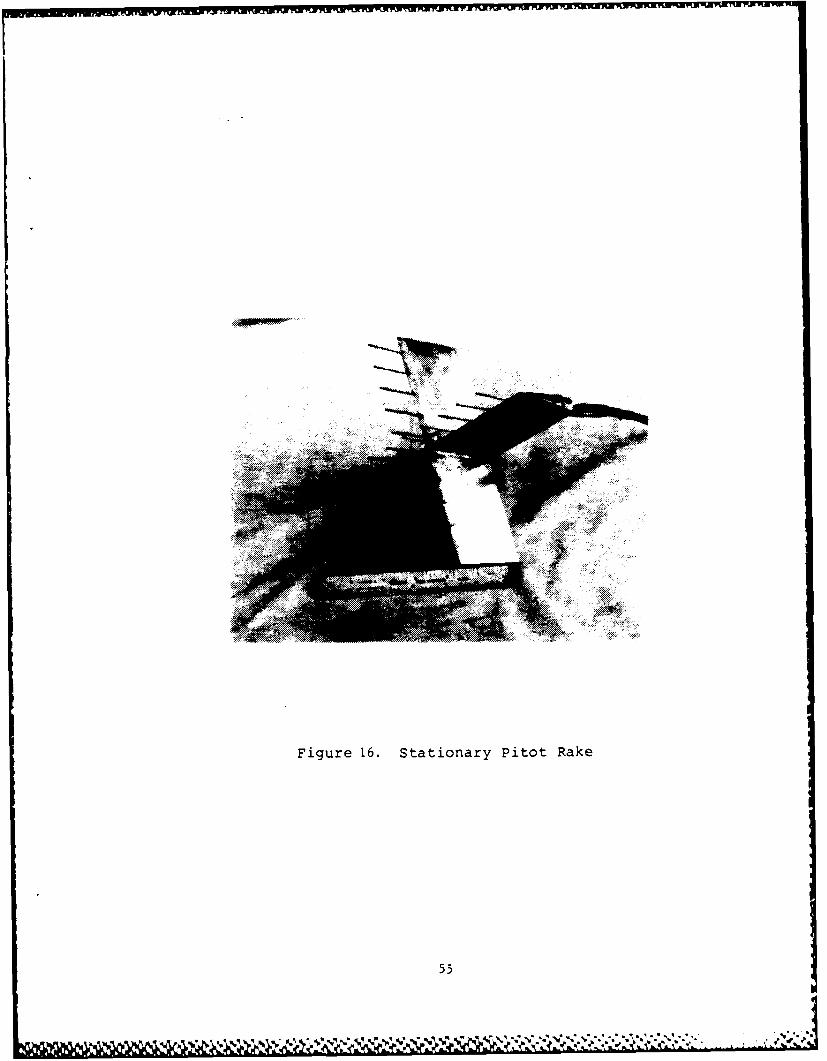
Figure 16. Stationary Pitot Rake
55

CD.
I U) C).j1 .41 41. LA * -4
1101C.) (1 . -4 (pF) r
> > > 0 JC
r> rrrn
u- 0- u -4
41 L
n 4r-v CD
T LA .l 0.
1
O.-40 C)4.
4
I 0
56
CwjrX w - '.frhfrfl--
ri O ~ r .r ~ ft' f- en- .- -
4-1
0 0 0 I L1
U .-4 *-~ *~ al
4-J I~ I. C TI.
C) nC C) 4-
C)j CDC C
un)
X -4V 41
4 4 W -4
'I-4 -4 -4 .-m
Cf) C) 44 M) t-0
Dz C)4-
r4
58

ea m I
I 7:
4.j4
Le P
, I -, I -a4l.*
, , --' - -.-
5-9
* - . p .,-*0> .* ~ 4 / _ * _ d d
4, V ~' e ~ ~~% .~4~#-'
z
.- U 4
C) (I(OS
Mi,. -,rWave enqt L,,.".

CYU
10<.
NW La.
0 55WUJ
41 10Z -El
wI
z4

D32 VS F
____ _ _____LEGEND
o aC= NAPC#70 = FER
* - _____ a = CHI*~ *=HOT
x = NAPC#3C
6'_ _ _ _ _ _ _ _ _ _ _
FiueD2v ulArRto i xas ein

D32 VS TEXH
_______ ______ -LEGEND
o = NAPC#70 = FER
*1 --~~~ =___ aCH __
o = HOT=NAPC03
11 *
Wtl* 911. j _ _

TEXH VS F
S0
Ii~ ~ -U-= N__ _ D_______
SZ N ,Co___a__FIR_
____a CH_
a MMz /AP#
6.01 sel 0.16 0011 *off a o
Figue 9haus Teperaureve Fel-ir Rtio

TRANSMJTrANaE VS TEXH
.......... ... ... ... ....-...
.. -- - -- -... . .. .. ...-.. .. .. .. .. .. .
20
Figuroe., Trasminttance ve Ex1haust
Temperature ,Ex|haust Rtegion.
" '. . '_ . - . ,* .'' q.''-'. .'..'rr.2 '.h
D32 VS TEXH
.4 ________LEGEND
______ ~ ~ ~ c _______ NAPCO?
UISLADx a NAPc#3
so lowa"_lo
S I- -
fiueD2veKhutTeprtr iCmuto ein
I -
FEz
it.
a -
zz~2
- I.... -
zzzC
*1. -
- r
- a
-~ -I. -
[I U- I.
II- I
______________________ - SU OIJ 0! 0
I.0 * * ~ ~ ' *-~ *

K 'N
'----a..';- ~ - -%-
- --
- -- -zzz -
0
-N.
--. 5
-C> -
o-0
-C
00
-N.~'
- - -I,' -
.00.. 09 OV Ot 0Z 01 00
(S3H3\J) 3yCYlsIa
' *~%' %%%. '
-- Ast0O 09
-NS W l . ILv
xh

t . ~ .~'. I - - ' a- a ~ a

p ~ ~ ~ A 4 d. I # J i' * * ** * - * .- *., **

LIS T OF REFERENCES
-aval P-st(-r,3duate school report No. NPS67-35-004, An Investigation oftlie Fftects --f Fuel Comosition on Comibustion Characteristics in a T-63
r_-Tnustor, hy PA:,. IDbeau, et. al., March 1985.
'*:vai Po)st ir~duate School Report 'Jo. NPS67-80-014, Validation of a Two-1-ensv-,nal Prim~itive Variable Comnuter Code for Flow Field in Jet Engine-.est C7ells, by P.C. '1allo)n, P.J. Hickey, D.tJ. Netzer, October 1980.
. aval Postoraduate School P4eport No. NPS67-81-01, Temperature Dependence'; as Or-xxerties in Polynomial Form, by J.R. Andrews, 0. Biblarz, January
4. -ashdollar, K.L., Lee, C.K., and Singer, J.M., "Three-;Iavelength LirihtTrinsr-ission Technio7ue to M1easure Smoke Particle Size and Concentration,"Thonlied )n-tics, Vol~nre 18, Number 11, June 1979.
-. P.A. Dohhins & G.S. Jiz-iag7ian, "Particle Size Measurements Based on Use4t lean Scattering Cross-Sections," J. Ot. Soc. of Am, Vol 56, No. 10, Oct.
A. 7.R. Hodkinson, "Particle Sizing by Means of the Forward Scattering-ve, rnlied Ontics, Vol. 5, No. 5, May 1966, pp. 839-844.
~.)oro)n & B. Waldie, "Particle Sizing by Forward Lobe Scatteredtv-?atil echnicue: Errors Introduced by Applying Diffraction Theory
* ro '~eRegime," N-iplied1 Optics, Vol. 17, No. 10, May 1978, pp. 1644-1648.
~A.~bbosL. C-,rocco & 1. Glassmian, "Measurement of 11ean Particleizpc~ )f -nravs from Diffractively Scattered Light," AIMA J., Vol. I, No. 8,
1j* -46~3, w.. 18R2-1RS6.
-4. ~**P'- 1 et. al., "Ccrtustion Generated Smoke Diagnostics by tMeans of:ai chnioTues," ALAA, 14th Aerospace Sciences Pieeting, January 1976,k~r NuTir 76-67.
* .'A. '"uele & M.D. Evans, "Droplet Size Distribution in Sprays," Ind. &'hei-., June 1951, .r. 1317-1323.
P.,). -kmvrecht &. C.M. Sliencevich, "Scattering of Light by Large'er' a3rticles,"o J. Phys. Chem'., 57, 1953, pp. 90-95.
P.A. W-w11 & B.T. Zinn, "In Situ Measurement of the Com'plex Reflactiveie x Aryrhustion Generated Particulates," Ca'nbustion Diacinostics by
*~tu~i'I ethods, Edited 1)y T.D. MicCay and J.A. Roujx, AIMA Vol. 92, rn.
*.'aval PostrAduate School Report %o. NPS67-82-13, An Investigation ofSFf tect ivpess of 1,-ke Suppressant Fuel Additives for Turbojet
* ~V: 'v T.P. 'Rrxrer, -).W. Netzer, Sentember 1982.
72
INITIAL DISTRIBUTION LIST
NO. OF COPIES
1. rAbrary 2Code, 0142Naval Postnraduate SchoolMonterey, CA 93943
2. Department of AeronauticsCode 67Naval Postqraduate SchoolMonterey, CA 93943
Chairman 1D.W. Netzer 10
3. Research Administration 1Code 012Naval Postqraduate SchoolMonterey, CA 93943
4. Defense Technical Information Center 2Cameron StationAlexandria, VA 22314
5. Chief of Naval Operations 2Navy DepartmentWashinqton, DC 20360(Attn: Code OP451, IP453)
6. Chief of Naval Material 2Navy DepartmentWashinaton, DC 20360(Attn: Codes: 08T241, 044P1)
7. Commander 8Naval Air Systems CommandWashinqton, DC 20360(Codes: AIR-01B, 330D, 3407, 4147A,50184, 5341B, 53645, 536BI)
R. Commandinq Officer 1Naval Air Rework FacilityNaval Air Station North IslandSan Dieqo, CA 92135
' I. Coamrander 2Naval Facilities Enqineerinq Command200 Stoval Streetlpxamlria, VA 22332,u.' : !4, 0328)
73
*A a e- -- --...- .- • .... , .... , -... . ... .. . .%,'.% %

!,'e s Con t IIi r i )r- tI .)
Port Huerseri, -t 43043'Odes: 2%, 251, 252.
ii. '*.S. '*val Acarieryknnanlis, ) 21412
12. Arnold Erninerirvi :vel-xnrent ' enterArnold AWFS, T. 3'342(Code: ")YR)
13. Air Force Aero Pror)ulslon Laboratory ItWriqht-Patter'-n AFB, OH 45433
(Code: SFF)
14. Detachrent 1 2(Civil & Envirorrental EnineerinqDivision Office)HO) ADTC (AFSC)Tyndall AFB, FL 32401
(Code: EV, EVA)
15. Army Aviation Systems Crrrand 1
P.O. Box 209St. Louis, 10 63166(Code: EOP)
16. Eustis Directorate 1USA AMR & DLFt. Eustic, VA 23604(Code: SAVDL-EU-TAP)
17. National Aeronautics and Space Admin. 1Lewis Research Center2100 Brookpark Road
Cleveland, OH 44135
(Attn: Mail Stop 60-6 (R. R.idley))
18. Federal Aviation Administration 1National Aviation Facility Experimental Ctr.
Atlantic City, NJ 08405
19. Naval Air Propulsion Center 3Trenton, NJ 08628-0176
(Code: PE 71:AFK)
20. Naval Ocean Support Center 2271 Catalina BoulevardSan Dieno, CA 92152(Attn: M. Lepor, P. Harris, Code 5121)
74
1
, . . . z . .. ;, ,% '- . '- --- .. , ' . . % . ,- , ," - , .' '' "'.'.• .]e4S
21. %.Aval Air 4eWOrK FaCility'ia%-da, 'CA 94501
'\tt: Q.Evans, Coide 642)
75

U - - U * * - U *# - . -