Embed Size (px)
Citation preview
200619th International Lightning Detection Conference24-25 April • Tucson, Arizona, USA 1st International Lightning Meteorology Conference26-27 April • Tucson, Arizona, USA
A DETECTION EFFICIENCY MODEL FOR THE BRAZILIAN LIGHTNING DETECTION NETWORK (RINDAT)
Kleber P. Naccarato
Osmar Pinto Jr.; Iara R. C. A. Pinto
Instituto Nacional de Pesquisas Espaciais (INPE) São José dos Campos/SP – Brazil
1. INTRODUCTION Like any other measure system, a lightning detection network (LDN) has its own limitations, although a very complex and sophisticated tool. Perhaps the most significant one is its detection efficiency (DE) or the ratio of the number of detected events by the real number of events that had occurred. Therefore, the better the detection network is, it will not be able to detect all lightning discharges without losing at least one. These losses can be highly significant due to sensors faults, communication problems, unfavorable network geometry, and misconfiguration of the central processing (Naccarato. 2005), which leads to distortions for analyses of long periods of data. Furthermore, the type of the sensors plays a very important role. It is well established that the two existing technologies (TOA and MDF) have its advantages and limitations. A high performance network is obtained only when the distribution of the sensors (as well as their types) is relatively homogeneous over all coverage area. Unbalanced networks (with more sensors of one technology rather than another and/or specific areas covered by much more sensors than others) clearly tend to present lower performance in terms of DE. Additionally, cloud-to-ground (CG) flash rate thematic maps have been published in the literature since the LDN starts to work in different countries around the world. However, none of these maps was corrected by variations of the network DE, which is affected by several factors as discussed previously. Extending a previous work (Naccarato et al. 2004), this paper presents a new approach of a detection efficiency model (DEM) that is computationally very fast, allows changing the sensor network configuration and takes into account the two different type of sensors currently in use in Brazil: LPATS and IMPACT. This DEM was based on the development of Schulz (1997) for the Austrian lightning detection efficiency (ALDIS).
2. QUICK REVIEW Several approaches of DEMs were already proposed in the literature. All of them use a set of CG lightning data reported by the network to compute its own relative detection efficiency (RDE). Since the reference CG lightning dataset is collected over areas associated with higher values of DE, the RDE assessed can be roughly approximated to the absolute detection efficiency (ADE). Schulz (1997) in Austria considers the DE of each network sensor in terms of the flash peak current and distance. Using these individual DE probability distributions, the network DE is computed based on the combined probability of each sensor to detect or not a flash, considering its peak current intensity and distance from the sensor. Of course, the propagation effects are intrinsically taken into account, since the particular RDE of each sensor are computed based on CG flash data registered by the own network for different distances. Murphy et al. (2002) uses a very simple approach to estimate the improvement in the NLDN detection efficiency due to the 2002 upgrade. Two sets of CG lightning data were analyzed: one before and other after the upgrade for the same area and period. The cumulative peak current distribution (PCD) was then computed for the two datasets and the early PCD (before the upgrade) was then fitted to the new PCD (after the upgrade), which was considered the reference (100% of DE). The ratio between the reference PCD and the fitted PCD represents the RDE improvement of the network. Rompala et al. (2003) developed a method to estimate the DE contours for the Rondonian lightning detection network in Brazil. They first selected an area in the middle of the network (composed only by 4 IMPACT sensors) that it is assumed to have the best DE. This region is called central quad (QUAD). The PCD for the lightning data in the QUAD is then computed and adjusted to a theoretical probability
distribution function (PDF), which is considered representative at any location over the region. After that, the coverage area of the network is divided in blocks (cells) of a specified size and the PCD is computed for all the CG lightning data detected in each cell of this grid. The reference PCD is then applied to each cell to assess what proportion of the set would be detected within it. Finally, the cell DE is taken as the ratio of the computed values and the total number of events. 3. DEM OVERVIEW The previous DEM (Naccarato et al. 2004) combines the Murphy and Rompala methods to produce a very simple computational method that can effectively assess the RDE of a LDN with relative high accuracy. However, the higher the number of events, the longer the computational time because the DEM computes the PCD for each grid cell based on the number of CG flashes detected within it plus their adjacent cells. Thus, the PCD must be computed based on thousands of CG flashes in each grid cell. This new DEM still needs the CG lightning data detected by the network, but they are used only to compute the RDE for each sensor, which depends on the peak current and the distance from the event (due to the propagation effects). Using these individual sensor RDE distributions, the network DE is computed based on the combined probability of each sensor to detect or not an event, considering its distance from each sensor. This reduces drastically the calculations and leads to a very short computational time. In the previous model, the sensor network configuration cannot be changed without reprocessing all the CG lightning dataset. This prevents from quickly evaluate the changes on the DE due to an addition, removal or relocation of a sensor. The new DEM allows easily changing the sensor network geometry by enabling or disabling specific sensors of the network or including new virtual sensors. Thus, it makes simple and quick to evaluate the impact of different sensors geometries on the overall network DE. Finally, this new approach treats IMPACT and LPATS sensors in different ways, since the IMPACT sensors can report both timing and bearing information while the LPATS sensors can only provide timing data. This feature offers a more precise method for DE calculation that leads to a more accurate
result, particularly for regions closer to the network boundary. 4. DEVELOPMENTS 4.1 The Individual Sensor RDE Distributions The first step to assess the network DE is to compute the RDE probability distribution for each sensor, which depends on the peak current value and the distance from the sensor. Initially, a detailed evaluation of each network sensor status was made from jan/1999 to dez/2004, identifying only the periods where the sensors were operating. This is a basic input information for the DEM, since it defines the network geometry for each time interval (in the case, monthly). Then, all the CG flashes detected by each sensor (also from jan/1999 to dez/2004) are separated and the RDE distributions are computed based on the peak current intensity and the distance. The sensor RDE distribution corresponds to the ratio between the number of CG flashes reported by the particular sensor and the total number of CG flashes detected by the network for each peak current range (from 5kA to 40kA, bins of 5kA) and distance interval (from 0 to 1500km, bins of 10km). Above 40kA and 1500km, all values are integrated in only one distribution. This approach has the advantage of incorporating the propagation effect and the noise effects in the data distributions, which avoids the need of modeling each effect separately. By the other hand, the DEM will be always working with relative detection efficiencies, but according to Schulz (1997), they can be treated as a good estimate for the sensor absolute detection efficiency. 4.2 The Network DE Based on the sensor RDE distributions and the monthly operation status of the sensors, a specific computational algorithm splits the network coverage in cells (which defines the spatial resolution) and computes the probability of the network to detect one particular event within each peak current range. This new algorithm is a very simple routine adapted from Schulz (1997) that optimizes the processing speed and treats LPATS and IMPACT sensors in a different way. It gets the sensors RDE values calculated for each cell, the total number of sensors and the minimum number of reporting sensors, and then recursively computes all
possible sensor combinations that can detect (or not) an event taking into account the minimum required number of sensors. All these probabilities are then combined according to the minimum number of times and azimuths required to produce a solution. The result is the network RDE in each grid cell for each peak current range. It is this last criterion (number of times and angles) that differentiates LPATS sensors, which only
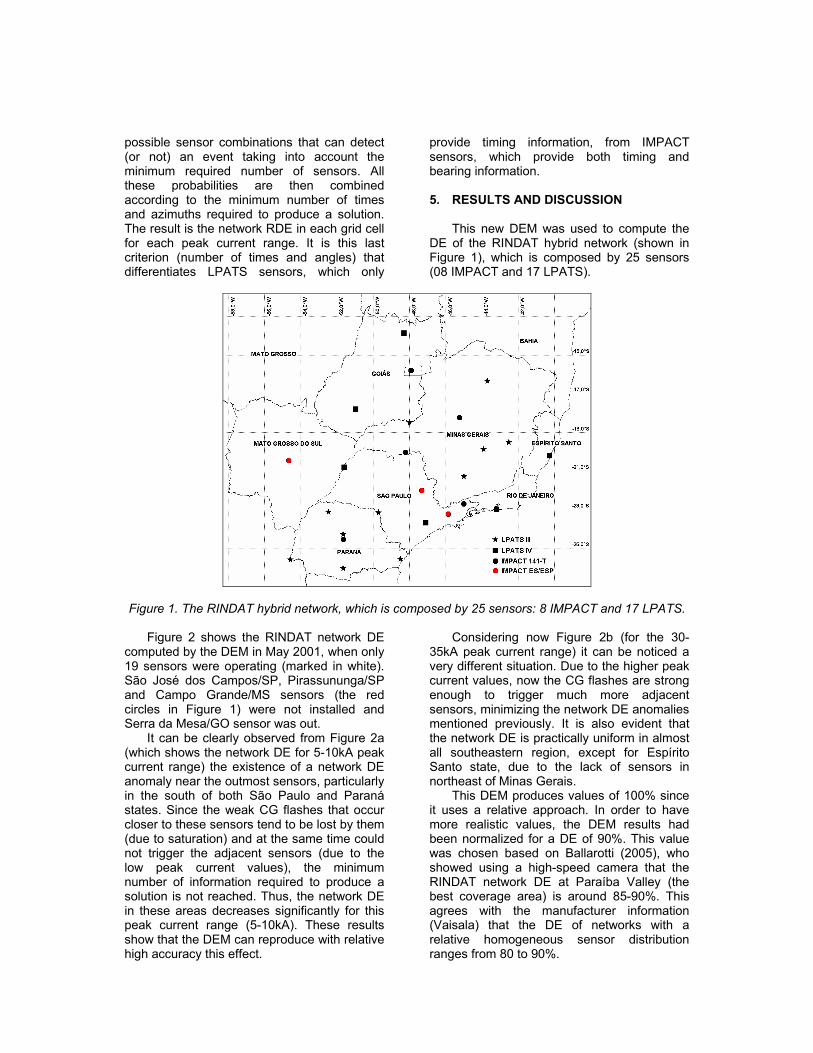
provide timing information, from IMPACT sensors, which provide both timing and bearing information. 5. RESULTS AND DISCUSSION This new DEM was used to compute the DE of the RINDAT hybrid network (shown in Figure 1), which is composed by 25 sensors (08 IMPACT and 17 LPATS).
Figure 1. The RINDAT hybrid network, which is composed by 25 sensors: 8 IMPACT and 17 LPATS. Figure 2 shows the RINDAT network DE computed by the DEM in May 2001, when only 19 sensors were operating (marked in white). São José dos Campos/SP, Pirassununga/SP and Campo Grande/MS sensors (the red circles in Figure 1) were not installed and Serra da Mesa/GO sensor was out. It can be clearly observed from Figure 2a (which shows the network DE for 5-10kA peak current range) the existence of a network DE anomaly near the outmost sensors, particularly in the south of both São Paulo and Paraná states. Since the weak CG flashes that occur closer to these sensors tend to be lost by them (due to saturation) and at the same time could not trigger the adjacent sensors (due to the low peak current values), the minimum number of information required to produce a solution is not reached. Thus, the network DE in these areas decreases significantly for this peak current range (5-10kA). These results show that the DEM can reproduce with relative high accuracy this effect.
Considering now Figure 2b (for the 30-35kA peak current range) it can be noticed a very different situation. Due to the higher peak current values, now the CG flashes are strong enough to trigger much more adjacent sensors, minimizing the network DE anomalies mentioned previously. It is also evident that the network DE is practically uniform in almost all southeastern region, except for Espírito Santo state, due to the lack of sensors in northeast of Minas Gerais. This DEM produces values of 100% since it uses a relative approach. In order to have more realistic values, the DEM results had been normalized for a DE of 90%. This value was chosen based on Ballarotti (2005), who showed using a high-speed camera that the RINDAT network DE at Paraíba Valley (the best coverage area) is around 85-90%. This agrees with the manufacturer information (Vaisala) that the DE of networks with a relative homogeneous sensor distribution ranges from 80 to 90%.
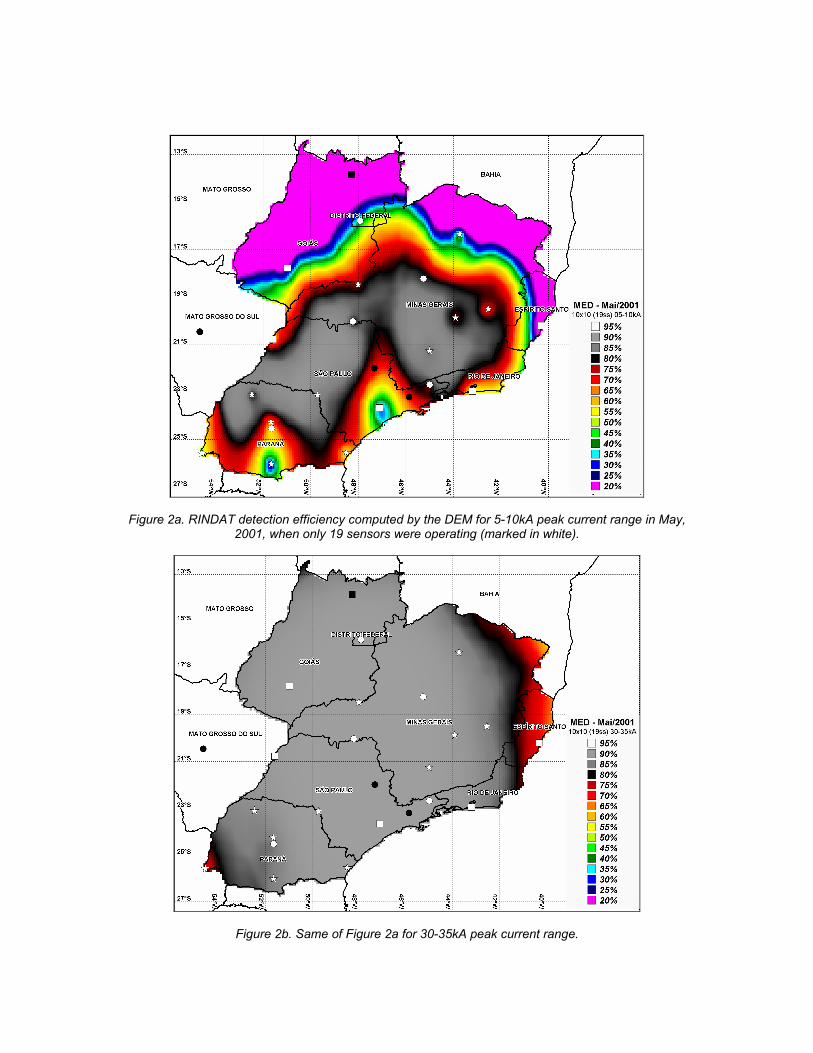
Figure 2a. RINDAT detection efficiency computed by the DEM for 5-10kA peak current range in May, 2001, when only 19 sensors were operating (marked in white).
Figure 2b. Same of Figure 2a for 30-35kA peak current range.
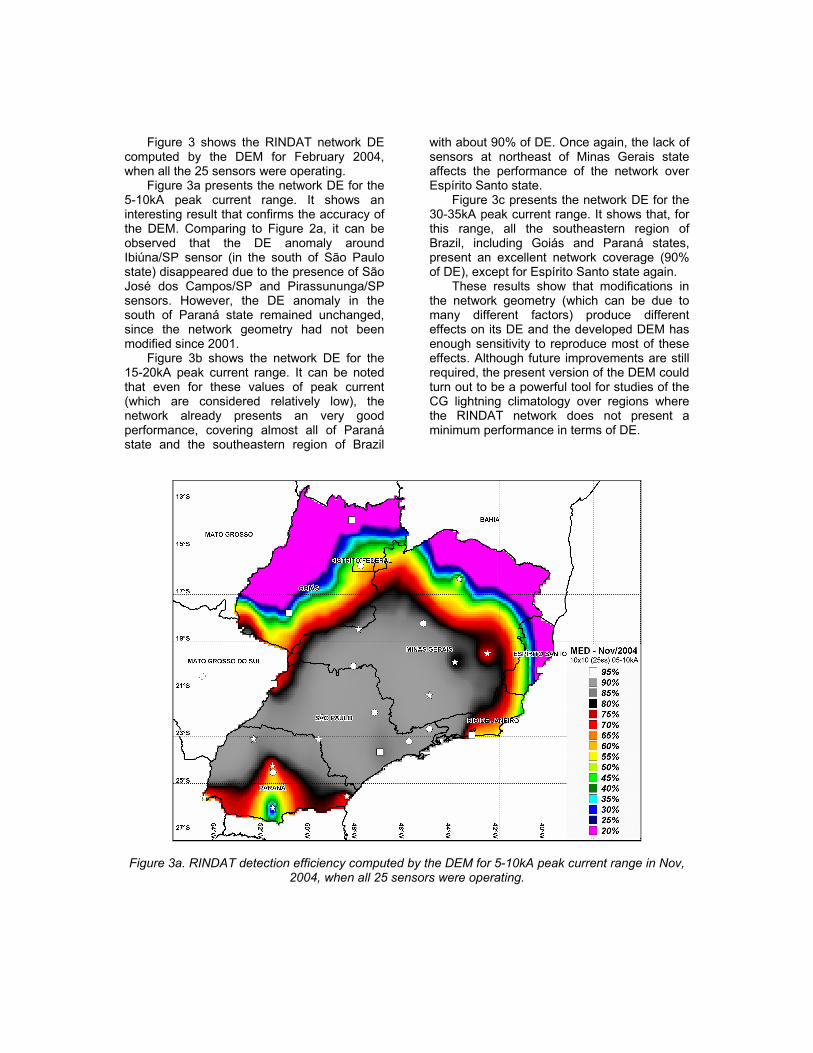
Figure 3 shows the RINDAT network DE computed by the DEM for February 2004, when all the 25 sensors were operating. Figure 3a presents the network DE for the 5-10kA peak current range. It shows an interesting result that confirms the accuracy of the DEM. Comparing to Figure 2a, it can be observed that the DE anomaly around Ibiúna/SP sensor (in the south of São Paulo state) disappeared due to the presence of São José dos Campos/SP and Pirassununga/SP sensors. However, the DE anomaly in the south of Paraná state remained unchanged, since the network geometry had not been modified since 2001. Figure 3b shows the network DE for the 15-20kA peak current range. It can be noted that even for these values of peak current (which are considered relatively low), the network already presents an very good performance, covering almost all of Paraná state and the southeastern region of Brazil
with about 90% of DE. Once again, the lack of sensors at northeast of Minas Gerais state affects the performance of the network over Espírito Santo state. Figure 3c presents the network DE for the 30-35kA peak current range. It shows that, for this range, all the southeastern region of Brazil, including Goiás and Paraná states, present an excellent network coverage (90% of DE), except for Espírito Santo state again. These results show that modifications in the network geometry (which can be due to many different factors) produce different effects on its DE and the developed DEM has enough sensitivity to reproduce most of these effects. Although future improvements are still required, the present version of the DEM could turn out to be a powerful tool for studies of the CG lightning climatology over regions where the RINDAT network does not present a minimum performance in terms of DE.
Figure 3a. RINDAT detection efficiency computed by the DEM for 5-10kA peak current range in Nov,
2004, when all 25 sensors were operating.
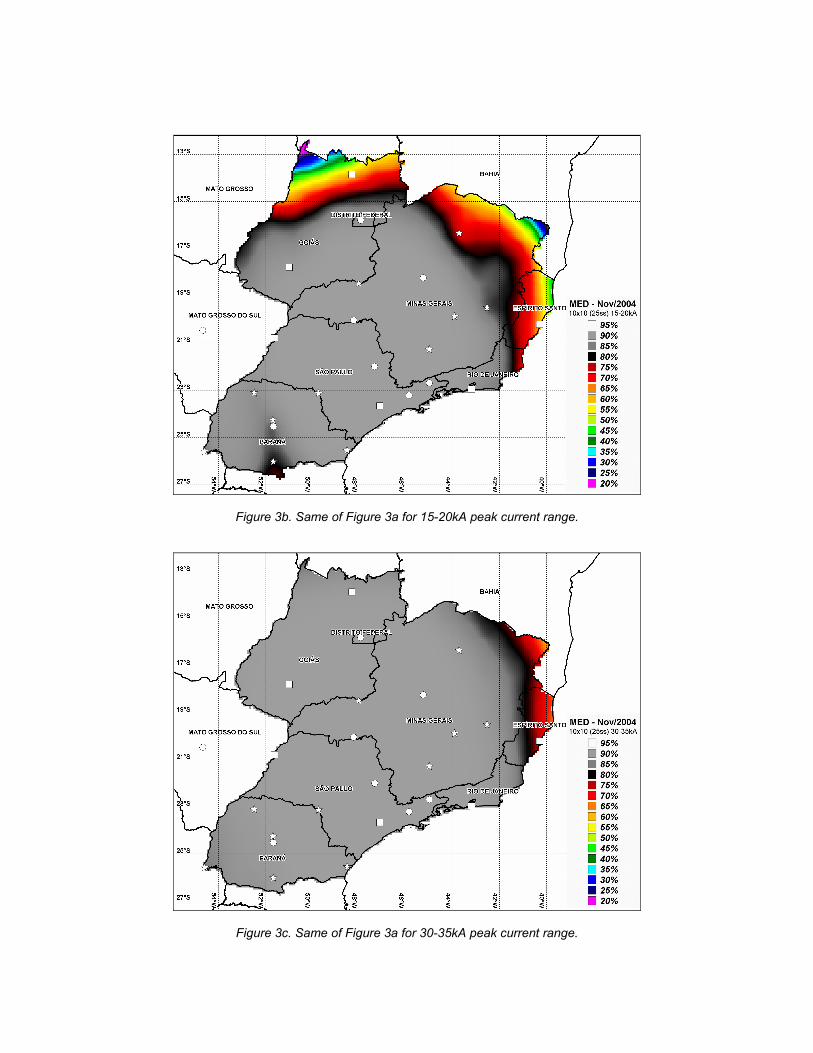
Figure 3b. Same of Figure 3a for 15-20kA peak current range.
Figure 3c. Same of Figure 3a for 30-35kA peak current range.
6. CONCLUSIONS It is possible to say that the presented DEM can reproduce with reasonably good accuracy some aspects of a LDN behavior that are directly affected by variations in the sensor geometry. The main points that should be highlighted are: (1) the network sensitivity for different peak current ranges; (2) the DE anomalies that are presented around the outmost sensors of the network; (3) variations in the network DE caused by the two different type of sensors (LPATS and IMPACT), which play different roles in producing the solutions. Even with some limitations, which require future improvements, the present DEM version can become a powerful tool for studies of the CG lightning climatology over regions where the RINDAT network does not present a minimum DE to provide accurate data. Some suggestions for future works and improvements include: (1) the validation of the DEM based on measurements of the actual RINDAT network ED over different regions of the coverage area using independent techniques as high-speed cameras, optical sensors, VLF sensors, etc; (2) the assessment of sensors RDE distributions as a function of the azimuth (in addition to the peak current range and distance) to include possible distinct behaviors of the IMPACT sensors in different directions; (3) the evaluation of the sensor RDE distributions for different periods (since 1999) in order to include the effect of the sensor degradation and/or upgrade on its overall performance. 7. ACKNOWLEDGEMENTS This work was supported by FAPESP (Grant No. 01/04026-7). Special thanks to all API.T Department staff from Furnas Centrais Elétricas for the reprocessing facilities.
8. REFERENCES Ballarotti, M. G.: 2005 Study of cloud-to-
ground lightning flashes using a high-speed camera (in Portuguese). M. S. Thesis. Instituto Nacional de Pesquisas Espaciais (INPE), 140pp. [In press].
Naccarato, K. P., 2005: Analysis of the cloud-
to-ground lightning flashes characteristics in southeastern Brazil (in Portuguese). Ph.D. Dissertation, Instituto Nacional de Pesquisas Espaciais (INPE), 330pp. [In press].
Naccarato, K. P., O. Pinto Jr., and I. R. C. A.
Pinto, 2004: Application of a detection efficiency model to correct cloud-to-ground flash density maps in Southeastern Brazil. Proc., International Conference on Lightning Detection, Helsinki, Finland, Vaisala Inc., CD-ROM.
Schulz, W., 1997: Performance evaluation of
lightning location systems. Ph.D. Dissertation. Technical University of Vienna, 136p. [Avaliable from Technical University of Vienna, Faculty of Electrical Engineering, Schimmelgasse, 6-8/3/28, A-1030, Wien]
Murphy, M., A. Pifer, K. Cummins, R. Pyle,
and J. Cramer, 2002: The 2002 upgrade of the U.S. NLDN. Proc. International Lightning Detection Conference, Tucson, AZ, Global Atmospherics Inc.
Rompala, J. T., R. J. Blakeslee, and J. C.
Bailey, 2003: Detection efficiency contours for regions serviced by lightning detection networks of limited scope. Proc. 12th International Conference on Atmospheric Electricity, Versailles, France, International Committee of Atmospheric Electricity, v.1, p.101-104.