Embed Size (px)
Citation preview

DR. ROBERTA COOK Dept. of Agricultural and Resource Economics
University of California Davis for
Monsanto/Seminis Woodland Field Day August 13, 2014
A Fresh Look at Produce Production and Marketing: The Dish on Today’s
Global Trends

Agenda • Location of production • Fresh produce basics • International trade
• Selected food industry trends • Consumer demand trends • Commodity examples • Conclusions

Location of production matters! • It’s all about seasonality – which crop, where, when – whether imported or domestic.
• Imports, usually off-season, play important role for many, but not all crops.
• Each commodity has its own story to tell! • California biggest producer of most produce crops; for many crops CA is the only US producer, over 200 crops grown.
• CA has a Mediterranean climate.

Leading US Fresh Market Vegetable States,* 2013: Geographic concentration of production (due to climate) limits local sourcing, yet it is growing in the summer/fall
Source: Vegetables 2013 Summary, USDA/NASS, March 27, 2014
Area Harvested Production Value
State % of Total
State
% of Total
State
% of Total
CA 45 CA 49 CA 52 FL 11 FL 9 FL 12 AZ 7 AZ 7 AZ 9 GA 6 GA 5 GA 4 NY 4 WA 4 NY 3
Other 27 Other 26 Other 19 *Excludes potatoes

Market Shares of Leading USA Fresh Fruit Producing States,* 2009
*Excludes tree nuts. Source: USDA/ERS, Gary Lucier.
Percent State U.S. Total
California 53% Washington – leads in apples, pears, cherries 21% Florida 8% Oregon 2% Michigan 2% Other 10% All U.S. fresh fruit 100%

Fresh Produce Industry Size
• In 2012, California produced approximately:
• $6.7 billion of fresh fruit • $5.8 billion of fresh vegetables • totaling $12.5 billion in farm gate
value.*
*Excludes tree nuts, processing tomatoes and other fruits and vegetables sold in canned, frozen and dried forms. Source: Compiled by Roberta Cook from CDFA California Agricultural Statistics Review 2013-2014.

Seasonality of Naturipe Farms berry production locations trawberries
Califor-n i a Florida
Mexi co
Mexico
Chile Florida
Georgia Califor-nia
Norrh Carolina Indiana
New Jersey Michigan
Oregon Bri~lsh Columbia
Was hington
Uruguay
Ar-gen~ina
aspberrles
Mexi co
Califor-ni a
Mexico Guatemala
Californi a N . Carolina Georgia Oregon
ran berries Quebec Halifax Wisconsin
M ay
J an. M arch April May
_L_ ! I +
_____________ Organic also available
Peak of Season
June
June
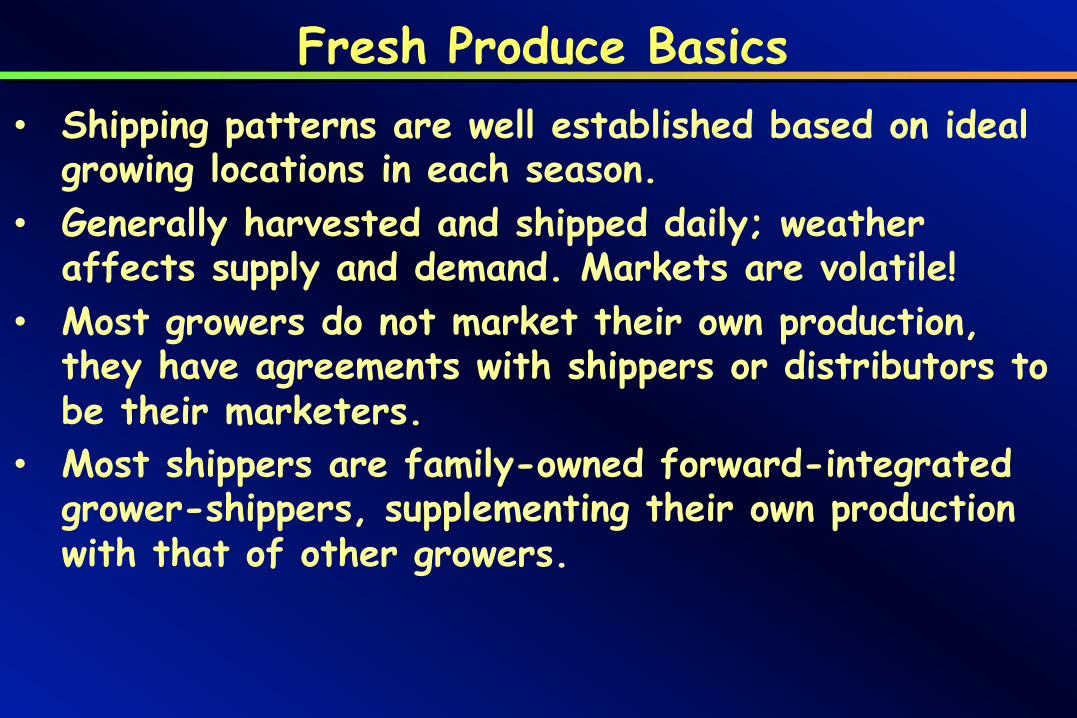
Fresh Produce Basics • Shipping patterns are well established based on ideal
growing locations in each season. • Generally harvested and shipped daily; weather
affects supply and demand. Markets are volatile! • Most growers do not market their own production,
they have agreements with shippers or distributors to be their marketers.
• Most shippers are family-owned forward-integrated grower-shippers, supplementing their own production with that of other growers.

U.S. Fresh Fruit and Vegetable1 Value Chain, Estimated Dollar Sales, Billions, 2010
institutional wholesalers food service
establishments
supermarkets and other retail outlets
consumers
exports
farms shippers Retailer distribution
centers
produce and general-line wholesalers
farm & public markets
imports
$6.1 $26.82
$12.3
$51.157
$122.132 $69.175
$1.800 Sources: Compilations by Kristen Park, Roberta Cook, and Edward McLaughlin based on U.S. Retail Census, ERS/USDA, NASS/USDA, U.S. Department of Commerce, and other data.
1 Excludes nuts and pulses

USA Fresh Produce Industry Size • Produce shippers focus more on retail than foodservice markets since quantity (vs $) sold thru retail channels is much larger than foodservice.
• Biggest contributors to foodservice produce sales are potatoes, lettuce and tomatoes and these are high per capita consumption items. Foodservice shares for most fresh produce are low. Seasonality, perishability, price volatility are obstacles. But this is changing!

Fresh Produce Basics • Buyers seek yr-round supply.
• Imports increasingly handled by U.S. grower-shippers
that import during the off-season. Same requirements
for foreign and domestic growers.
• Major food safety requirements, higher cost structure.
• Shippers emphasizing sustainable farming practices.
• Quality, color, shape, flavor, as differentiators,
growing role of proprietary seeds.

Fresh Produce Basics • Cold chain management critical. • More attention placed on reducing waste. • Shippers have big investments. • Price takers. • Growers and shippers require substantial capitalization to withstand low markets.
• Buyer consolidation induces shipper consolidation. • Larger firms have greater ability to invest in food safety infrastructure, R&D to increase efficiency and sustainability, new varieties, etc.

Role of branding in fresh produce marketing • Commodity vs consumer brand marketing perspective. • Traditionally, few produce items were branded (beyond Chiquita, Del Monte and Dole).
• Development of fresh-cut industry introduced brands. • Difficult to brand produce items with intra- and inter-seasonal variations in quality.
• Most produce still sold on random-weight basis (vs UPC codes) so less data as compared with CPG items and supplier not identified.
• Shippers often didn’t have consistent distribution in specific chains week in week out.

Role of branding in fresh produce marketing • Hard to get ROI on investments in branding. • Under-investment in consumer marketing in produce. • Role of generic marketing/advertising programs. • Growth in social media making it less costly to reach target consumers with marketing messages.
• For larger grower-shippers consumer marketing may make sense.
• Traceability changing things (PTI). • Incentives are becoming more aligned to improve quality and flavor and educate consumers about how to use and prepare fresh produce.


Fresh Produce Basics

Growing Role of Technology • Information technology • Big data • Precision farming • Sensors • Drones • New varieties • Mobile • Consumer insights • Social media aids in targeting consumers • Supply chain-wide data sharing

International Trade in Fresh Produce
• Story of diversification of sources of supply and the types of products imported/consumed.
• Provides more redundancy which large
foodservice users require to put something on the menu. This may increase produce on foodservice menus.
• Exporters are generally large, professional
firms.

Fresh fruit and vegetable imports as a share of U.S. fresh utilization/consumption, 2012
Item %
Vegetables, excl. melons and potatoes Melons Potatoes
25.0 30.5 7.0
Fruit, all Excluding Bananas
49.4 33.7
Source: Economic Research Service, USDA.

0 2,000 4,000 6,000 8,000
10,000 12,000 14,000 16,000
Thou
sand
s
Imports: Fresh Veg
Imports: Other Fresh Fruit
Imports: Bananas/plantains
Exports: Fresh Veg
Exports: Fresh Fruit
US Fresh Produce International Trade: Imports and Exports, by Key Category, $Millions US, 1994-2013
Source: US GATS online queries, BICO-10.

Value Shares of Total U.S. Fresh Fruit Imports, by Product
Source: Imports Contribute to Year-Round Fresh Fruit Availability, FTS-356-01, Dec. 2013, ERS/USDA
59
16 7 3 1 3 5 3
28 16
13 12 11 7 4 2
Bananas Grapes Other tropical*
Berries Avocados Citrus Apples & Pears
Stone fruits**
1990-92 2010-12
* includes pineapples, mangos, papayas, durians ** includes apricots, cherries, peaches, plums

Value Shares of Total U.S. Fresh Fruit Imports, by Region: Mexico Wins!
Source: Imports Contribute to Year-Round Fresh Fruit Availability, FTS-356-01, Dec. 2013, ERS/USDA
56
23 13
3 5
34 26
33
3 5
Equatorial countries*
Southern Hemisphere countries**
Mexico Canada Others
1990-92 2010-12
* Equatorial countries include Costa Rica, Guatemala, Ecuador, Colombia, and Honduras ** Southern Hemisphere countries include Chile, Argentina, Peru, New Zealand, Brazil, South Africa, and Australia

Example: Seasonal Relationship between Imported and Domestic Grapes, 2010-12 Average
Source: Imports Contribute to Year-Round Fresh Fruit Availability, FTS-356-01, Dec. 2013, ERS/USDA
-
1,000
2,000
3,000
4,000
5,000
6,000
7,000
8,000
JAN FEB MAR APR MAY JUN JUL AUG SEP OCT NOV DEC
Import shipments Domestic shipments
in 100,000 pounds
Chile leads imports, then Mexico, Peru emerging

• N. American fresh veg trade mainly intra-
NAFTA! • 77% of US fresh vegetable exports go to Canada, then Mexico, 8%. Extra-NAFTA exports fragmented.
• Veggies often more perishable than many fruits which makes proximity to market important.
• In contrast, fresh fruit trade is diverse both in terms of countries of origin and destination markets.
US Fresh Produce Trade

0
500,000
1,000,000
1,500,000
2,000,000
2,500,000
3,000,000
3,500,000
4,000,000
4,500,000
2006 2007 2008 2009 2010
Other Canada Japan Mexico Hong Kong S. Korea
thou
sand
US
dolla
rs U.S. Exports of Fresh Fruit, Top 5 Countries, 2006-2010 (other is the 2nd largest category, so diverse mkts)
Source: US GATS, online data queries.

• In 2013, fresh produce imports from Mexico totaled
$7.8B (54% of total fresh produce imports), including: • $4.6B fresh veg (67% of total fresh veg imports), and • $3.2B fresh fruit (38% of total fresh fruit imports). • Mexico is a powerhouse fresh fruit and veg exporter and is an integral part of the North American fresh produce supply chain for certain commodities. Most of its exports go to the USA (unlike Chile whose markets are truly global).
US Fresh Produce Trade

• Tomatoes, bell peppers, chile peppers, cucumbers,
eggplant, green beans, asparagus, brussel sprouts, watermelon, limes, avocados, mangoes, table grapes, papaya, blackberries, raspberries (and emerging in blueberries and strawberries), green onions, sugar snap peas, cilantro many tropical and specialty fruit/veg, both Mexican and Asian.
• NOT important in leafy greens, broccoli, cauliflower, celery, onions, potatoes, apples, pears, cherries, kiwi, peaches/nectarines/plums, oranges, tangerines, grapefruit, bananas.
Mexico’s Role in US Fresh Produce Trade

• The relatively strong competitiveness of the US industry is because more than being labor-intensive, fruit/veg are knowledge, technology, capital, and marketing-intensive. LOCATION!
• However, protected culture, which is technology and capital-intensive is emerging elsewhere.
• US growers face an ever more complex regulatory environment. • Labor availability is increasingly problematic, everywhere. Efforts to mechanize will grow.
Relative Competitiveness of US Fresh Fruit and Veg Industry

Some Comments on China
China’s share of world horticultural exports grew from 2.5% in 2001 (after it joined the WTO) to 5.6% in 2011. However, this is led by processed hort products vs fresh. China will not be an important source of fresh produce for the USA, rather it is a growing export market for US producers.
Source: ARE Update Sep/Oct 2013 17(1):9-11

Select Food Industry Trends

Growth of Sales at Traditional Foodstores, 2000–2011, in Current and Constant Dollars (2000 base)
percent
-2.5
-1.5
-0.5
0.5
1.5
2.5
3.5
4.5
5.5
2000 2001 2002 2003 2004 2005 2006 2007 2008 2009 2010 2011
Current $ Inflation adjusted $
Sources: USDA, ERS calculations using data from U.S. Census Bureau, Economic Census of Retail Trade, Merchandise Line Sales, 1997, 2002, 2007; and Bureau of Labor Statistics, Consumer Price Index, 2000-11.

• In 2009, the quantity of food sold in food stores declined.
• “I buy only what I need.” Consumers are increasingly concerned about waste; negative impact on fresh produce demand.
• Plus, consumption rates of fresh produce increase markedly with income level. So, more low income people means a challenging environment for the produce industry.
• Economic growth should stimulate produce demand.
Consumer Behavior

The economic downturn accelerates pace of change in the food marketing system
• More than originating new trends, it intensified pre-existing forces, such as channel blurring.
• Margin pressure at all levels of the food system! • Many produce suppliers facing lower profits. • Need for major investments in info tech systems. • In aftermath, mergers are up again (food
retailers, foodservice, and mergers or joint marketing arrangements between shippers).

US Grocery Market Shares, by Key Channel, 1998 vs. 2013
Source: Willard Bishop, Competitive Edge, August 2014
15%
39%
46% 90%
8%
2% Nontraditional mass – club - drug supercenter - dollar
Traditional conv supermarket, fresh format, ltd assortment, super warehouse, other
Convenience with and without
gas
2013 1998

shopping habits Millennials shop a variety of retailers to meet their in-‐the-‐moment needs
Source: Outlook on the Millennial Consumer 2014, a presentaBon for PMA from the Hartman Group No. of Retailers Shopped for Groceries in
the Past 90 Days
Most Millennials spread their shopping across many channels and retailers • Lack of planning results in more trips • Higher use of all channels than older
cohorts Especially true for specialty channels – 46% of Millennials vs. 32% of Boomers
Millennials Gen X Boomers
9.0 7.1 6.3
Myth BusBng: Millennials don’t just shop at cool and unconvenBonal retailers. While they love these stores, many shop at more mainstream retailers most of the Bme and reserve specialty channels for special occasions.
Emerging marketing channels for fresh produce
• Convenience store potential, drug stores, dollar
stores. • E-commerce. Click ‘n collect, delivery, in-store
pickup, other models emerging. Amazon Fresh foray in Los Angeles.
• Major initiative to increase fresh produce on foodservice menus despite the barriers.
• Growing international trade provides more redundancy in supply which may help large foodservice users to add produce items to the menu.

Fresh Produce Consumption Trends

4.8 8.8 6.7
10.2
22.1 18.2
0.2 2.4 3.8
11.2
17.8 14.2
Weekly $ sales/store
Weekly quantity sold/store Organic Fruit Organic
Veg
Fresh-cut, Organic and Total Fruit and Vegetable Sales in Select US Food Retailers, % Change 2013 vs 2012
All FruitVeg*
Freshcut Fruit Salads
Fresh Cut Veg
*Excludes other produce (such as salad dressings, toppings, etc.), which is 10% of produce dept sales dollars and 5% of quantity.
Source: FreshFacts® on Retail, Trends 2013, Perishables Group and United Fresh Foundation.

Consumer Behavior • Higher income and socially conscious foodies are
driving demand; their preferences lean to organic, convenience (fresh-cut), flavor, local.
• For mainstream consumers, positive attitudes about
wellness benefits of fresh produce not translating into higher purchases. Improved flavor might help.
• Perception that produce costs more and may be
wasted. Better shelf-life might help. • 47.6 million people on food stamps (SNAP) in
FY2012-13 (vs 17.3 in 2000) for cost of $79.8M.

Initiatives to Increase Consumption
• More forces are in play to educate consumers about the benefits of fresh produce (MyPlate, salad bars in schools, PBH, govt and private efforts to increase awareness of fruit/veg health benefits.
• Culinary Institute of America and Harvard School of Public Health Dept of Nutrition Initiative: Menus of Change, The Business of Healthy, Sustainable, Delicious Food Choices. This is designed to introduce more fresh produce on foodservice menus.
• In the meantime, let’s look at how important income is to produce consumption.

Distribution of U.S. Households by Income Level, Share of Total Fresh Produce Expenditures/Income Level & Ave. Fresh Produce Expenditures/Income Level, 2012
Source: Calculations by Roberta Cook from the Food Institute’s Demographics of Consumer Food Spending, 2014.
$478 14%
$254 8%
$409 17%
$339 13%
$ = Average fresh produce expenditures per income group
% = Percent of total fresh produce expenditures contributed by each income group
$819 31% <$15,000
15%
$15,000-$29,999
18%
$30,000-$49,999
20%
$50,000-$69,999
14%
$70,000-$99,999
14%
$100,000+ 19%
Share of Households
$594 18%

Factors affecting demand for fresh produce
• Commodity price, consumer income, prices of
substitutes and complements, population growth rates, ethnicity, culture
• Quality: appearance, flavor, color, shape and size; more breeder emphasis on flavor
• Info on produce selection, ripening, recipes • Convenience in prep, usage and consumption;
packaging role • Shelf-life, postharvest technology • Consistent availability, year-round supply

Per Capita Consumption of Fruits and Vegetables, All Product Forms
• Changes in total consumption mask significant changes in:
• product form • product mix • diversity within product segments

0
50
100
150
200
250
300
350
400
450 19
76
1978
19
80
1982
19
84
1986
19
88
1990
19
92
1994
19
96
1998
20
00
2002
20
04
2006
20
08
2010
20
12
Processed Veg, Excl. Potatoes
Processed Potatoes
Fresh Potatoes
Fresh Veg, Excl Melon and Potato
Fresh includes fresh-cut and bulk.
Processed includes frozen, dried and canned.
Fresh includes fresh-cut and bulk.
Processed includes frozen, dried and canned. 81 36
Source: USDA/ERS, Vegetables and Melons Situation and Outlook Yearbook, May 30, 2014; compiled by Dr. Roberta Cook, UC Davis, fresh and processed sweet potato share of total sweet potatoes is estimated; processed vegetables includes lentils and dry peas, and excludes dry beans.
U.S. Per Capita Vegetable Utilization/Consumption, Excluding Melons, 1976-2013P, (all channels,
foodservice and retail), pounds
Poun
ds p
er c
apita 380
343
145
119

U.S. Per Capita Disappearance of Select Fresh Vegetables, 1985-2013P
(includes fresh-cut and bulk)
Pounds per capita P=Preliminary
Source: USDA/ERS, Vegetables and Pulses Yearbook May 30, 2014.
0
5
10
15
Bell pepper Broccoli Sweet corn Cucumber

Culture has shiXed from a reacBve HEALTH paradigm to a proacBve WELLNESS culture
Past:
REACTIVE HEALTH
“Do as I say!”
CondiBon management • Externally measured •
AuthoritaBve • Compliance • Crisis • Quick fixes • Control • AsceBcism
Source: Outlook on the Millennial Consumer 2014, a presentaBon for PMA from the Hartman Group
BE HEALTHY
listen to your doctor!
listen to your mom!
proper nutriBon! take your
vitamins!
avoid germs!
lose weight! exercise!

ConBnued: Culture has shiXed from a reacBve HEALTH paradigm to a proacBve WELLNESS culture
Now:
PROACTIVE WELLNESS
“Know thyself”
PreventaBve • Internally validated • Self-‐assessed • Common sense • HolisBc • Integrated • Balanced energy • Fun and
enjoyment
Source: Outlook on the Millennial Consumer 2014, a presentaBon for PMA from the Hartman Group

Shoppers seek several claims in tandem, revealing motivation
Source: FMI U.S. Grocery Shopper Trends 2014. Regularly = at least “fairly often”
48 41
37 35
33 33 32 31 30
28 24
22 22 21 20
18 11
Whole grain Low sodium Low sugar High fiber
No preservatives No trans fats
No chemical additives Low calorie No/Low fat
No HFCS Natural
Non-GMO Low cholesterol Heart healthy
Antioxidant-rich Certified organic
Gluten-free
Percent of Shoppers
Good fiber
No neg. ingreds.
Minimal processing
Heart healthy
Positive nutrition

28
26
25
25
21
19
20
15
19
17
13
11
are minimally processed
contain only recognized ingred's
are locally grown/produced
have shortest ingred. list
2013 2010 2007
Percent of Shoppers
Source: The Hartman Group Health and Wellness Reports, 2007-‐2013
When shopping, about ¼ of consumers look for food and beverages that . . .

Frequency of Purchases of Locally Grown Products
79%
11% 10%
Occasionally Always Never
Source: FMI U.S. Grocery Shopper Trends 2014

food choices QuesBon: How important is each factor in deciding what food you eat?
Source: Outlook on the Millennial Consumer 2014, a presentaBon for PMA from the Hartman Group
52
44
41
41
39
36
51
39
37
29
33
32
45
36
29
19
31
26
made with natural ingredients
no GMOs
no allergens
made with organic ingred.
grown locally
manufactured locally
Millennials Gen X Boomers
Percent of

Commodity Example: Lettuce

0 1,000 2,000 3,000 4,000 5,000 6,000 7,000 8,000
1960
19
62
1964
19
66
1968
19
70
1972
19
74
1976
19
78
1980
19
82
1984
19
86
1988
19
90
1992
19
94
1996
19
98
2000
20
02
2004
20
06
2008
20
10
2012
U.S. Iceberg Lettuce Market, 1960-2013: Case of declining demand; International trade not a factor; Production based in
coastal CA and shifts to CA/AZ desert in winter Million pounds
Production Total Consumption/ Utilization
Exports Imports
Sources: USDA/ERS, Vegetables and Pulses Yearbook Data/#89011/May 30, 2014 as of 1990, and USDA/ERS, U.S. Lettuce Statistics, 2011 for prior years.

0
1,000
2,000
3,000
4,000
5,000 19
89
1990
19
91
1992
19
93
1994
19
95
1996
19
97
1998
19
99
2000
20
01
2002
20
03
2004
20
05
2006
20
07
2008
20
09
2010
20
11
2012
20
13
Million pounds
Production Total Consumption/ Utilization
Exports Imports
Sources: USDA/ERS, Vegetables and Pulses Yearbook Data/#89011/May 30, 2014 as of 1990, and USDA/ERS, U.S. Lettuce Statistics, 2011 for prior years.
U.S. Fresh Romaine & Leaf Lettuce Market, 1990-2013Forecast

Head Lettuce
Romaine
Leaf
0 5
10 15 20 25 30 35
1985
19
86
1987
19
88
1989
19
90
1991
19
92
1993
19
94
1995
19
96
1997
19
98
1999
20
00
2001
20
02
2003
20
04
2005
20
06
2007
20
08
2009
20
10
2011
20
12
2013
P
7.7 3.6
Lbs.
Per
Cap
ita
U.S. Per Capita Utilization/Consumption of Lettuce, by Type, 1985-2013P (includes fresh-cut and
bulk, foodservice and retail)
All-23.8
12.5
Source: USDA/ERS, Vegetables and Pulses Yearbook May 30, 2014 and unpublished ERS data for leaf and romaine.

Lettuce innovation: cross between iceberg and romaine

Growth of the Hothouse Tomato Industry in the US, Canada and
Mexico: Game changer

Pounds per capita
P=Preliminary Sources: USDA/ERS, Vegetables and Pulses Yearbook Data May 30, 2014.
0
5
10
15
20
25
US Per Capita Utilization/Consumption of Fresh Tomatoes (1985-2013P)

US Fresh Tomato Retail Market Shares (in Lbs) by Key Type, 2013: Story of Market Transformation
Source: FreshLook Marketing
Roma 27%
TOV 22% Grape
14%
Vine Ripe 12%
GH 9%
[CATEGORY NAME]
[VALUE]*
[CATEGORY NAME] [VALUE]
[CATEGORY NAME] [VALUE]
*Mainly mature green

Y.E.L.O. Youth, Energy, Life, Om…™
Specialty and Greenhouse Tomatoes

0
500
1000
1500
2000
2500
Fresh Field Tomato Production in CA and FL,* 1982-2013: Case of declining retail demand for mature green tomatoes, lower
growth in foodservice demand and loss in competitiveness
million pounds
Florida
California
Source: USDA/NASS. *excludes other states and greenhouse

0
1000
2000
3000
4000
5000
6000
7000 19
90
1991
19
92
1993
19
94
1995
19
96
1997
19
98
1999
20
00
2001
20
02
2003
20
04
2005
20
06
2007
20
08
2009
20
10
2011
20
12
2013
P
U.S. Fresh Tomato Market, 1990-2013: Case of growing import dependence, led by product differentiation and technological innovation (protected culture); Mexico primary import source
million pounds
Consumption
Production
Imports Exports
Sources: USDA/ERS, Vegetables and Pulses Yearbook Data May 30, 2014.

0
500
1,000
1,500
2,000
2,500
3,000
3,500
4,000
2009 2010 2011 2012 2013
Poun
ds (M
illions
)
Cherry Grape Hothouse Roma Round Total
Sources: US Department of Commerce. US Census Bureau, Foreign Trade Statistics and ERS calculations.
Total US Tomato Imports, by Key Tomato Type, All Countries, 2009-2013 (millions of pounds): Product Differentiation

• Margin pressure puts emphasis on streamlining the supply chain, more collaborative relationships between buyers and suppliers. Should reduce waste and benefit consumers.
• Technology will improve yields, water and input efficiency, supply chain efficiency and cost control.
• Local will grow, but CA will remain the dominant US producer of most fresh produce crops due to Mediterranean climate.
• Consumer demand for fresh produce should grow as the economy improves.
• More efforts to stimulate fresh produce consumption – both public and private – may gain traction.
• Innovation will improve flavor, shelf-life and performance.
Conclusions

Supplemental Information

California Drought Impact on Fresh Produce

Source: Labor, Water and California Agriculture in 2014, Goodhue and Martin, ARE Update, Giannini Foundation of Agricultural Economics, University of California
Average Value of Water Used in CA, Based on Value of Crop Sales, 2012
0 500 1,000 1,500 2,000 2,500 3,000 3,500 4,000
Vegetables Fresh Tomatoes Deciduous fruits
Citrus Almonds & Pistachios Processing Tomatoes
Grapes Onions and Garlic
Grain Corn
Safflower Cotton
Dry Beans Alfalfa
Other Field Rice
Pasture
Water value ($/acre foot)

• Growers will divert water to higher value crops, which protects fresh fruit and veg crops from major reductions.
• The drought effect is worst south of the Delta and leafy greens, celery, broccoli, cauliflower are largely not grown there.
• Summer production of fresh market tomatoes, melons, peppers, are important in the central valley, as well as orchards and vineyards.
• South of the Delta most growers have ground water sources which mitigate loss of surface deliveries.
• No major changes expected in 2014.
Water

California Drought Impact on Fresh Produce
• In the central valley (the main area affected), about 1% of fruit/nut and veg acreage may be fallowed, according to a major longstanding UC Davis economic model, the Statewide Agricultural Production (SWAP) model.
• Water quality is declining due to drawdown of ground water and higher salinity.
• Drought hasn’t reduced produce production yet, impact to be felt in 2015 if don’t get big winter snowpack.

California Drought There is plenty of supply to handle more fresh produce on foodservice menus. Prices will continue to depend a lot on daily weather - affects yields, quality, TIMING of production, seasonal overlaps, and demand. Higher energy, water pumping, and labor costs, but grower-shippers are price takers and can’t pass on many costs. Over time, CA will see major changes in crop mix, fresh produce will still be the star!

SWAP Estimated Changes in Irrigated Crop Area: 2014
Source: Prelim. 2014 Drought Economic Impact Estimates in Central Valley Agriculture, CDFA Report May 16, 2014
Sacramento Valley, SD,
and ED
San Joaquin Valley
Tulare Lake Basin
Central Valley Total
Feed Crops -83,481 -39,269 -23,967 -146,718
Vegetables -3,801 -2,638 -3,838 -10,277
Trees & Vines -8,931 -7,514 -24,483 -40,929
Grains -40,785 -20,105 -35,105 -95,995
Other Field Crops -13,523 -55,883 -45,501 -114,907
Region Total -150,521 -125,409 -132,894 -408,825

Misc. Supplemental Information

US Fresh Tomato Imports, All Types, by Key Country, 2009-2013, million pounds
0
500
1,000
1,500
2,000
2,500
3,000
3,500
4,000
Mexico Canada Other Countries Total
Millions
2009 2010 2011 2012 2013
Sources: US Department of Commerce. US Census Bureau, Foreign Trade Statistics and ERS calculations.

Source: ARE Update Sep/Oct 2013 17(1):9-11
Export and Import Trade Annual Growth Rates of China’s Labor-Intensive Agricultural Products,
2001–2011
Aquaculture Livestock Horticulture
Exports 13.3% 7.7% 18.0%
Imports 13.5% 15.8% 21.0%

China’s Trade Balance with the U.S. in Horticulture*
62
91
135
181
188
250
275
273
310
397
389
44
50
50
73
140
137
119
153
216
248
349
18
41
85
107
48
112
157 120 94
149
40
2001 2002 2003 2004 2005 2006 2007 2008 2009 2010 2011
Exports to US Imports from US
million current U.S. dollars
*Processed and fresh fruit/veg, nuts, flowers and ornamentals. Source: ARE Update Sep/Oct 2013 17(1):9-11

0
200
400
600
800
1,000
1,200
1,400
1,600
2004 2006 2012
California Mexico Chile Other*
*Peru emerging
Million
poun
ds Avocado sources of supply in the U.S. market: Availability of Mexican supply displaces Chile and expands total market size
Source: Hass Avocado Board, online data queries.

Fresh Noncitrus, Incl Melon
Fresh Citrus
Process Citrus
Process Noncitrus
0
50
100
150
200
250
300
350 19
76
1977
19
78
1979
19
80
1981
19
82
1983
19
84
1985
19
86
1987
19
88
1989
19
90
1991
19
92
1993
19
94
1995
19
96
1997
19
98
1999
20
00
2001
20
02
2003
20
04
2005
20
06
2007
20
08
2009
20
10
2011
20
12
(frozen, dried and canned)
US Per Capita Total Fruit Disappearance/Consumption, Including Melons, Pounds 1976-2012,
(all channels, foodservice and retail)
Poun
ds p
er c
apita
282 97
53
24 108
282
73 29
102
78
Source: Fruit and Tree Nuts Yearbook, ERS/USDA, 11-19-13.
Fresh includes fresh-cut and commodity.

Obstacles to Fresh Produce in Foodservice • Seasonality • Perishability • Price volatility • Seasonal shoulders especially risky • Labor for prep • Even the largest fresh produce suppliers are
small relative to food manufacturers • Sourcing often not as direct as for retail • Variations in quality, flavor