Embed Size (px)
Citation preview

ORIGINAL ARTICLE
A Geographic Information System (GIS)-based approachto adaptation to regional climate change: a case studyof Okutama-machi, Tokyo, Japan
Yingjiu Bai & Ikuyo Kaneko & Hikaru Kobayashi &Kazuo Kurihara & Izuru Takayabu & Hidetaka Sasaki &Akihiko Murata
Received: 11 October 2012 /Accepted: 30 January 2013 /Published online: 19 February 2013# The Author(s) 2013. This article is published with open access at Springerlink.com
Abstract Recently, local governments have an increasing need to take extensive andeffective local measures to adapt to regional climate change, but have difficultyknowing how and when to adapt to such change. This study aims: 1) to characterizean efficient and cost-effective database management tool (DMT) for developing aGeographic Information System (GIS) based approach to using observed and projecteddata, for decision-making by non-expert government authorities, and 2) to documenthow DMT can be used to provide specialized yet understandable climate changeinformation to assist local decision-makers in clarifying regional priorities within a
Mitig Adapt Strateg Glob Change (2014) 19:589–614DOI 10.1007/s11027-013-9450-6
Y. Bai (*) : I. Kaneko : H. KobayashiGraduate School of Media and Governance, Keio University, 5322 Endo, Fujisawa, Kanagawa 252-8520,Japane-mail: [email protected]
I. Kanekoe-mail: [email protected]
H. Kobayashie-mail: [email protected]
K. Kurihara : I. Takayabu :H. Sasaki : A. MurataMeteorological Research Institute, 1-1 Nagamine, Tsukuba-city, Ibaraki 305-0052, Japan
K. Kuriharae-mail: [email protected]
I. Takayabue-mail: [email protected]
H. Sasakie-mail: [email protected]
A. Muratae-mail: [email protected]

wide array of adaptation options. The DMT combines climate change mapping,statistical GIS, and a vulnerability assessment. Okutama-machi, a 225.63 km2 sparselypopulated mountainous region (2012 population 5,856) northwest of Tokyo, Japan,was chosen for this pilot study. In this paper, the most recent regional climateprojections (5 km resolution) are transcribed into an understandable form for use bynon-expert citizens who use the GIS-based DMT. Results illustrate qualitative agree-ment in projection of summer daily mean temperatures; the mean temperature increaseat Okutama-machi is the greatest of any area in Tokyo. In comparing near future andfuture conditions, August monthly mean temperature will increase more than 0.7–0.9 °C and2.8–2.9 °C, and monthly precipitation by 50 % and 25–41 %, respectively. However, the rootmean square (RMS) errors and bias of percentage change for monthly precipitation in sum-mertime are 26.8 % and 4.3 %, respectively. These data provide an early warning and haveimplications for local climate policy response.
Keywords Climate change projection . Database management system (DMS) . Geographicinformation system (GIS) . Local government decision-making . Okutama-machi . Regionalclimate change
1 Introduction
Observational records clearly indicate mean global temperatures have increased byabout 0.74 °C (0.56 °C–0.92 °C) in a linear fashion from 1906 to 2005. The linearwarming trend over the last 50 years (0.10 °C–0.16 °C, or an average of 0.13 °C, perdecade) is nearly twice that of the last 100 years (IPCC 2007a). These increases areassociated with greater increases in daily minimum temperatures than of maxima,leading to a reduction in the diurnal temperature range. In a future warmer climatewith higher mean temperature, extreme summer temperatures around the world wouldcontinue to increase (Duffy and Tebaldi 2012; Elguindi et al. 2012; Kusaka et al.2012; Easterling et al. 2000). Also, the United Nations Intergovernmental Panel onClimate Change (IPCC) Special Report on Emission Scenarios (SRES) A1B scenariosuggests that by the mid-2090s, global sea levels will reach 0.22–0.44 m above 1990levels, and sea levels are expected to rise at about 4 mm yr−1. Sea level rise duringthe 21st century is projected to have substantial geographical variability. Hydrographicobservations (IPCC 2007b) also suggest substantial spatial variation in rates of sealevel change will occur. Recently, the Earth System Models (EMS) used in the lastIPCC report project a total global sea-level rise of 20–60 cm by 2100. Also, complexregional patterns will lead to a larger rise in some regions and to considerable butpoorly quantified inter-annual and decadal variability of sea level change (Willis andChurch 2012). For a local study, if resources are available, an impact assessmentcould consist of local socio-economic scenarios and downscaled/processed sea-leveldata combined with a surge model and vertical land movement observations. Themagnitudes of the potential impacts associated with high sea-level rise scenarios areof sufficient concern to merit consideration in impact, vulnerability and adaptationstudies (IPCC Data Distribution Centre 2011) because many Asian-megacities are builton deltas, such as metro Manila (Philippines), Jakarta (Indonesia) and Bangkok(Thailand). However, since impact assessments are commonly based on elevation data,the need for sea-level change scenarios as part of impact and adaptation assessmentsshould be considered.
590 Mitig Adapt Strateg Glob Change (2014) 19:589–614

Adaptation to climate change is largely time and scale dependent and this depen-dence is a function of both climate impacts on particular activities and its adaptivepotential (Jones 2000). After the 2003 European heat wave, climatologists, medicalspecialists, and social scientists expedited efforts to revise the European vulnerabilityassessment system and integrated risk governance frameworks for climate changeadaptation (Schröter et al. 2004; Lass et al. 2011). All studies indicate that acapability for climate prediction at regional and local scales is vital to aid inidentifying possible adaptation strategies. In Europe, activities are already underwayto explore the benefits of increased regional climate model (RCM) resolution(a 10 km resolution or less) for simulating observed regional climate processes (WorldClimate Research Programme (WCRP) Coupled Model Intercomparison Project—Phase 5: Special Issue of the Climate Variability and Predictability (CLIVAR)Exchanges Newsletter 2011). This creates new demands on researchers. Developingand applying an advanced observational database and using the output of RCMs underCoupled Model Intercomparison Project—Phase 5 (CMIP5) as efficiently as possibleis both essential and necessary, not only for climate scientists, but also for thegrowing number of stakeholders, policy-makers and the enlightened public. Basedon advice given by Overpeck et al. (2011), “a new paradigm of more open, user-friendly data access is needed to ensure that society can reduce vulnerability toclimate variability and change, while at the same time exploiting opportunities thatwill occur.”
The scientific questions that arose in the IPCC Fourth Assessment Report (AR4) willneed to be addressed through CMIP5 in time for evaluation in the Fifth Assessment Report(AR5) scheduled for publication in late 2013. Currently, the CMIP5 model’s output is freelyavailable to researchers through a gateway linked to modeling and data centers or the mainCMIP5 Data Portals (see Box1) worldwide, where the data are archived. Climate modelingdata is stored in huge and complex digital repositories. The CMIP5 can modulate large-scaleclimate databases on regional to local scales, with a new set of so-called community-ledReference Concentration Pathways (RCPs which process scenarios for IPCC AR5, seeBox2) that provide future estimates of greenhouse gas (GHG) concentrations. Expertknowledge, including data sources or RCPs, is a particularly useful resource for research;however, it is not in an understandable form for non-expert citizens. A basic tool to supportdecision-making by non-expert government employees and politicians seems necessary,which would enable exchanges of high-quality climatic data and information about thescience of climate change in understandable forms available to non-expert citizens whichwould fit with a new resilient approach for local policymakers to meet the regional demands.
Box 1 CMIP5 models output is freely available to researchers
All of the CMIP5 model output can now be accessed through any one of the following
ESGF (Earth System Grid Federation < http://esgf.org/ >) gateways:
Program for Climate Model Diagnosis and Intercomparison (PCMDI): http://pcmdi9.llnl.gov/
British Atmospheric Data Centre (BADC): http://esgf-index1.ceda.ac.uk
Deutsches Klimarechenzentrum; German Climate Computing Centre (DKRZ): http://esgf-data.dkrz.de
National Computational Infrastructure (NCI): http://esg2.nci.org.au
Source: CMIP5 Coupled Model Intercomparison Project: CMIP5 -Data Access- Availability. http://cmip-pcmdi.llnl.gov/cmip5/availability.html.
Mitig Adapt Strateg Glob Change (2014) 19:589–614 591

Box 2 Information on individual RCPs
Four RCPs are produced. Information about the RCPs and the scenario development process
for the IPCC AR5 can be found in the IPCC Expert Meeting Report on New Scenarios and
Moss et al. (2010).
http://www.aimes.ucar.edu/docs/IPCC.meetingreport.final.pdf
http://www.nature.com/nature/journal/v463/n7282/pdf/nature08823.pdf
Source: IPCC Data Distribution Centre (2012c) Scenarios Process for AR5.
http://sedac.ciesin.columbia.edu/ddc/ar5_scenario_process/RCPs.html
RCP8.5: Rising radiative forcing pathway leading to 8.5 W/m2
in 2100.
RCP6: Stabilization without overshoot pathway to 6 W/m2 at
stabilization after 2100.
RCP4.5: Stabilization without overshoot pathway to 4.5 W/m2
at stabilization after 2100.
RCP2.6: Peak in radiative forcing at ~ 3 W/m2 before 2100 and
decline.
Mounting evidence exists related to the need for basic tools to support local scientific-policy dialogue as part of local decision-making processes for adaptation planning at thelocal scale (Hallegatte and Corfee-Morlot 2011). In particular, Jones (2000) recommendedthat the uncertainty which exists within projections of regional climate can be managedwhere it is unquantifiable. Tools are vital in analyzing and managing the uncertainty whichaccompanies climate change assessments. Corfee-Morlot et al. (2011) also indicated, insti-tutional design with inclusion of analytic-deliberative practices, focusing on the potentiallykey tool of characterizing projection uncertainty, facilitates good decision-making. However,the basic tools for local government leaders are particularly lacking. If user-friendly softwarepackages for using these increasing numbers of data sources from observations and RCMsimulations were provided, that would aid in identifying possible adaptation strategies andmanaging uncertainty in climate change projections effectively.
The objective of this paper is to provide a cost-effective, user-friendly database managementtool (DMT) for decision-making by local governments, using observed and projected data. TheClimatic Research Unit (IPCC Data Distribution Centre 2012a) has a free, high-resolutiondataset. This dataset is available in NetCDF and GeoTIFF formats, which are both GIS(geographic information system) compatible. Recently, GIS has been increasingly used at alllevels of government, in both developed and developing countries. We used high-quality dailydata from the Japan Meteorological Agency (JMA), which are available to local governments(Japan Meteorological Agency 2012a). To take into account local priorities and issues, projec-tions were from a 5 km-mesh, non-hydrostatic, cloud system-resolving regional climate modelNon-Hydrostatic Regional Climate Model (NHRCM)-5 km, 5 km resolution), following theSpecial Report on Emissions Scenarios (SRES) A1B scenario. Those were dynamicallydownscaled results from the Meteorological Research Institute (MRI)-AGCM3.2S (IPCC DataDistribution Centre 2012b). The MRI-AGCM3.2S is an Atmospheric General Circulation
592 Mitig Adapt Strateg Glob Change (2014) 19:589–614

Model for AMIP (Atmospheric Model Intercomparison Project) conducted under CoupledModel Intercomparison Project—Phase 5 (CMIP5 2012).
We developed the basic DMT with three GIS modules that can freely and easilyproduce a wide variety of data or maps, plus warning information, available in a GISdomain. In this paper, two major challenges for climate science revolving around datahave been addressed. One is ensuring that the highest resolution projected climatechange data (5 km resolution) become easier and cost-effective so that up-to-dateinformation can be put into widespread use by a GIS-based DMT. Second is makingsure these data and the results that depend on them are useful to and understandableby a broad interdisciplinary audience, especially by the local policy-makers. A similarapproach can be achieved in both developed countries and developing countries usingthe GIS-based DMT. These would improve routine decision-making and clarify re-gional priorities and issues effectively around the world. All GIS mapping output canbe formatted into a Keyhole Markup Language (KML)/Keyhole Markup Language Zip(KMZ) file that can be readily used and displayed by Google Earth or other Earthbrowser programs. These greatly benefit local governments in undeveloped areas anddepopulated regions, for obtaining information via the world wide web (WWW).
To describe the methodological steps in the DMT with GIS modules, Okutama-machi inTokyo, Japan was chosen for a pilot study (“machi” means town in Japanese). It is arelatively unpopulated region to the northwest of the city of Tokyo (area 225.63 km2;population 5,856 as of 1 January 2012), with the highest peak (2,017 m) in the Tokyometropolitan area. This paper describes the basic DMT with four GIS modules andsources of projected daily data in “Data and Methods”. In “Pilot Study of Okutama-machi, Tokyo”, the case study of Okutama-machi is used to explain how to examinevulnerability and investigate adaptation to regional climate change through the DMTby local decision-makers. “Pilot Study of Okutama-machi, Tokyo” presents resultsfrom Okutama-machi and projected data quality.
2 Data and methods
2.1 Free international daily datasets at national levels in a digital format
As mentioned above, free international daily datasets including data applicable at nationallevels in digital form have been improved worldwide (Alexander et al. 2006) and thesedatasets include climate observations and climate models, have worldwide open-access, andare updated by IPCC Data Distribution Centre (http://ww.ipccdata.orgobs/index.html). Also,a number of new results have been published; RCMs can resolve features down to 50 km orless and many regional high-resolution (about 25 km) projections of future climate changehave been developed (Hayhoe et al. 2008; Elguindi and Grundstein 2012; Patricola andCook 2010). The Earth System Grid Federation (ESGF) is a coordinated internationalcollaboration of individuals and institutions that is developing, deploying and maintainingsoftware infrastructure for the management of model output and observational data.Researchers worldwide can now access ESGF data holdings through any of the gatewayshosted by ESGF partners, including laboratories in the U.S. funded by the Department ofEnergy (DOE), the National Science Foundation (NSF), the National Aeronautics and SpaceAdministration (NASA), and the National Oceanic and Atmospheric Administration(NOAA), and at laboratories elsewhere, including the Australian National University(ANU) National Computational Infrastructure (NCI), the British Atmospheric Data Center
Mitig Adapt Strateg Glob Change (2014) 19:589–614 593

(BADC), the Max Planck Institute for Meteorology of the German Climate ComputingCentre (DKRZ). Users can access all data sets freely using web browsers (ESGF gateways<http://esgf.org/> or ESGF data nodes <http://www-pcmdi.llnl.gov/>).
In this study, we used a high-quality daily dataset from the JMA Observations (Surfaceobservations http://www.jma.go.jp/jma/en/Activities/observations.html) and projections(5 km resolution) from the NHRCM-5 km following the SRES-A1B scenario developedby the Meteorological Research Institute (MRI), JMA supported by Innovative Program ofClimate Change Projection for the 21st Century (KAKUSHIN Program). The NHRCM-5 kmis a dynamic downscaling of results from MRI-AGCM3.2S (20 km resolution) under CMIP5(the MRI-AGCM3.2S output can be downloaded from CMIP5 or the IPCC Data DistributionCentre webpage). Also, we re-produced the GIS statistics conducted stepwise for localgovernments by the Ministry of International Affairs and Communications, Japan (StatisticsBureau: Database of the national census) using the basic DMT.
2.2 Methods
This study had two main components: developing a cost-effective, user-friendly DMT for localdecision-making and an empirical pilot study of regional adaptation measures designed forusing the DMT. Figure 1 outlines the procedures adopted here and depicts the DMTwith threeGIS modules. The DMT is a mapping tool for managing an integrated spatial and attributedatabase, with a suite of climate change indices, regional statistics and regional vulnerabilityindices focused on extreme climatic events. An existing DMT was built using three differentGIS modules consisting of spatial map layers with their spatial and attribute databases. Thesethree modules are climate change mapping (climate change information with geographic scaleand location information), regional statistical GIS, and vulnerability assessment by GIS.
Fig. 1 Diagram of procedures adopted in this study
594 Mitig Adapt Strateg Glob Change (2014) 19:589–614

Vulnerability assessment by GIS includes natural, social and economic vulnerabilities, whichare intended to inform decision-makers by analyzing current and potential impacts of globalchange and by recognizing pressures from other stresses. All data is computed and analyzed forregional tasks in the GIS domain, and output is saved as a GIS database. Moreover, the user caneasily transform all output into a KML/KMZ file, which is available for presentation usingfreely available tools (e.g., Google Earth) and an internet connection.
The DMT mapping presents observed (station data) and projected (grid mesh data)data together easily, using GIS (Fig. 1). Mapping the observed and projected data onthe same GIS domain can allow the user to directly link other GIS data, such associetal and biological impacts and climate change. Using DMT for climate-changemapping is a vehicle for readily depicting special distribution changes and trendsacross temporal and geographic scales. The output is available for presentation onGoogle Earth by the DMT, as needed.
2.2.1 Climate change mapping
Data quality and homogeneity is important to decision-making using the basic DMT. Weused a high-quality daily dataset from the JMA, and projections from the NHRCM-5 kmfollowing an SRES-A1B scenario. The MRI-AGCM3.2S supported by KAKUSHIN Proj-ect, is used as initial and lateral boundary conditions (Kitoh et al. 2009; Sasaki et al. 2012;Nakano et al. 2012). MRI-AGCM3.2S output is successful in simulating characteristicfeatures of the seasonal cycle of the East Asian summer monsoon and topography-regulated precipitation data has good agreement with observations (Mizuta et al. 2012).Several recent empirical studies have applied NHRCM-5 km output to date for months fromJune to October. For instance, research has been conducted related to summertime temper-ature extremes and daily precipitation across Japan in the late 21st century using theNHRCM–5 km (Murata et al. 2012; Kanada et al. 2010). These studies indicate that theNHRCM–5 km significantly improves the reproduction of the present climate. In particular,the bias of models with observations for daily mean temperatures in June, July, August,September and October was within 0.5 K (700 samples covering Japan) for the presentclimate (Murata et al. 2012; Nakano et al. 2012). Thus, we used only NHRCM-5 km outputdata for summertime (July to October data).
2.2.2 GIS statistics
Statistics often inform policy development. As Davidian and Louis (2012) stated,statistics is the science of learning from data, and of measuring, controlling, andcommunicating uncertainty; it thereby provides essential navigation for controlling thecourse of scientific and societal advances. GIS statistics of the DMT represents amapping approach designed to present a regional development snapshot of govern-mental statistics information. Mapping observed and projected data on the same GISdomain, using a common database that includes environmental and socioeconomicstatistics, can be an effective and easy method to analyze and solve a particularproblem. Also, multiple potential impacts on multiple sectors can be projected. Thesepotential impacts combine with low adaptive capacity, based on a socioeconomicregional scale generic index.
After the 1990s, GIS statistical analysis was conducted stepwise for local governments inJapan. Datasets from GIS statistics are available for re-editing and visualization on GoogleEarth, as needed.
Mitig Adapt Strateg Glob Change (2014) 19:589–614 595

2.2.3 Vulnerability assessment by GIS
The IPCC Third Assessment Report “Climate Change 2001” (2003) clearly stated vulner-ability to climate change is determined by two sets of factors; one external to the system, andthe other internal. External factors consist of the character, magnitude, and rate of climatechange, and variation to which the system is exposed. Internal factors are the sensitivity andadaptive capacity of the system itself. Unfortunately, empirical and theoretical evidence ofhow potential impacts and adaptive capacity can be combined into vulnerability measures isvery limited. Here, we create environmental and socioeconomic statistics and then combinethem with climate change observations and GIS projections. The resulting maps are useful inillustrating vulnerability in terms of negative potential impacts and limited adaptive capacity.All results are made available to stakeholders in the form of a digital atlas of potentialimpacts, adaptive capacity and dimension of vulnerability.
3 Pilot study of Okutama-machi, Tokyo
The following is an illustrative example of adaptation to regional climate change fordecision-making by a local government, using the DMT. For a pilot study, we chose anunpopulated mountainous region accessible 2 hours northwest of Tokyo by train or car(Okutama-machi; Fig. 2). Lake Okutama (Fig. 3b), an impounded lake which feeds the TamaRiver which can hold 185 million m3 of water, supplies approximately 20 % of Tokyo’swater supply.
Tokyo is a megacity with a population of 13.18 million as of 1 January 2012, and coversan area of 2,187.5 km2 (Ministry of International Affairs and Communications 2012). Thenumber of people aged 65 or older in Tokyo is 2.64 million, or 20.4 % of the totalpopulation, which includes 9.0 % of the total population of the elderly in Japan; nationwide,the number of elderly people reached a record 29.25 million, or 23.01 % of the totalpopulation of 128.06 million, as of 1 October 2010). Similar to megacities in otherdeveloped countries, municipalities with aging populations are expected to suffer greatlyfrom climate change and are vulnerable to global change because only a few people havesufficient information on which to base action. The continuing increase in size of the elderlypopulation is an urgent issue for metropolitan governments. For example, Tokyo willbecome an ageing-megacity with the projected percentage of elderly people exceeding25 % by 2030 (Ministry of International Affairs and Communications 2012). Meanwhile,in Tokyo, the population has continued to increase in the inner city (Table 1). From 2005 to2010, the population grew by 456,042 people, with a growth rate between 12.8 %–24.8 %(Ministry of International Affairs and Communications 2012). The concentration of popu-lation within the inner-city area has been a serious problem in the city.
On the contrary, as population and infrastructure became concentrated in the inner city ofTokyo, two surrounding localities (Okutama-machi and Hinohara Village; Fig. 2) have beendepopulated.
Okutama-machi, in the extreme western part of Tokyo, has seen its population continu-ously decline since 1955, combined with a rising average age (Fig. 3a). As of 1 October2010 only 6,045 people live in Okutama-machi (Ministry of International Affairs andCommunications 2012; Table 1). Figure 2 shows Okutama-machi has poor transportationfacilities creating a wide gap between the services available in this small town and the inner-city area; the lack of good transportation limits employment opportunities as well as limitsaccess to medical and public aid services (Fig. 3b). These factors have contributed to the
596 Mitig Adapt Strateg Glob Change (2014) 19:589–614
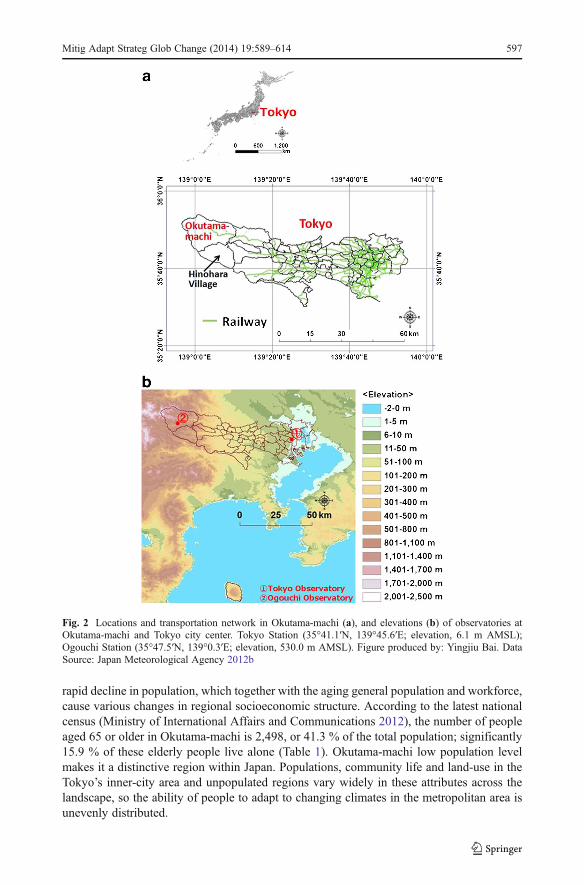
rapid decline in population, which together with the aging general population and workforce,cause various changes in regional socioeconomic structure. According to the latest nationalcensus (Ministry of International Affairs and Communications 2012), the number of peopleaged 65 or older in Okutama-machi is 2,498, or 41.3 % of the total population; significantly15.9 % of these elderly people live alone (Table 1). Okutama-machi low population levelmakes it a distinctive region within Japan. Populations, community life and land-use in theTokyo’s inner-city area and unpopulated regions vary widely in these attributes across thelandscape, so the ability of people to adapt to changing climates in the metropolitan area isunevenly distributed.
Fig. 2 Locations and transportation network in Okutama-machi (a), and elevations (b) of observatories atOkutama-machi and Tokyo city center. Tokyo Station (35°41.1′N, 139°45.6′E; elevation, 6.1 m AMSL);Ogouchi Station (35°47.5′N, 139°0.3′E; elevation, 530.0 m AMSL). Figure produced by: Yingjiu Bai. DataSource: Japan Meteorological Agency 2012b
Mitig Adapt Strateg Glob Change (2014) 19:589–614 597

Recent studies indicate global warming will be more marked at the mega-city scale,because of processes such as the creation of urban heat islands (Lemonsu et al. 2013).Figure 4a shows that annual mean temperature in Tokyo has risen about 3 °C over the pastcentury, based on long-term observational data from the meteorological station in centralTokyo (Fig. 2b, ① (indicates the Tokyo station): 35°41.1′N, 139°45.6′E, elevation 6.1 mabove mean sea level (abbreviated as AMSL)). Okutama-machi has only one automaticobservation station, named Ogouchi, because the area has few residents and is in a moun-tainous location with limited transportation facilities (Fig. 2b, ② (indicates the Ogouchistation): 35°47.5′N, 139°0.3′E, elevation 530.0 m AMSL). Table 2 and Fig. 4 show theclimates of Tokyo and Ogouchi stations are warming based on changes in daily maximum
Fig. 3 Population decrease from 1955 to 2012 and the predicted population during 2015–2035 (a); medicalfacilities location map presented in Google Earth (b red color points) in Okutama-machi. Numbers b indicatethe population. Figure produced by: Yingjiu Bai. Data Source: Ministry of International Affairs and Commu-nications 2012
Table 1 Comparison of population in the Tokyo metropolitan area and Okutama-machi (a sparsely populatedmountainous region)
Area(km2)
Population(person)
Pop. density(per./km2)
Pop. growthrate: 2005–2010
Populationaging (person)/rate
Number ofhouseholds
Number of single-elderly personhousehold (ratio)
Tokyo metropolitan 2,187.50 13,159,388 6,015.7 4.6 % 2,642,231(20.4 %)
6,393,768 622,326 (9.7 %)
Okutama-machi 225.63 6,045 26.8 −10.3 % 2,498 (41.3 %) 2,217 353 (15.9 %)
Ministry of International Affairs and Communications 2012
598 Mitig Adapt Strateg Glob Change (2014) 19:589–614

temperature (Tmax) and minimum temperature (Tmin) records, although the annual meantemperatures and monthly mean temperatures at Ogouchi are more than 4 °C colder thanthose of Tokyo.
Figure 5(a) indicates the number of people hospitalized with heat stroke from 2000 to2011 in Tokyo. In summer 2010, the monthly maximum temperature in August in Tokyoreached 29.6 °C. More than 70 days (or 10 days) had extremely high monthly maximumtemperatures exceeding 30 °C (or 35 °C) during the entire summer (Fig. 5c). This heatresulted in 272 deaths and about 4,700 hospitalizations for patients with heat stroke(Fig. 5b). In summer 2011, about 3,900 people were hospitalized with heat stroke(Fig. 5a), even though the August maximum temperature was 27.5 °C, because the temper-ature difference between monthly maximum temperatures in June and July much higher thannormal by 4.5 °C (Fig. 5b). In addition, after the March 2011 disaster, power generation inthe greater Tokyo area decreased by 20 %, so that government-ordered power-saving effortsin eastern and northeastern Japan also had been requested in 2011.
Even though August maximum temperatures in 2005 and 2007 were higher than2011, fewer people were hospitalized with heat stroke, because the temperature differ-ences between monthly maximum temperatures in June and July were lower by 2.4 °C
Fig. 4 Annual mean temperature increase (a), and observed trends of monthly mean precipitation andtemperature during 1981–2010 (b) in the Tokyo metropolitan area, based on average records from Tokyo(city center) and Ogouchi stations (rural area). Upper straight line in (a) denotes estimated trend of annualmean temperature increase for Tokyo station; slope=0.0247 °C/year, R2=0.80. Tokyo Station (35°41.1′N,139°45.6′E; elevation, 6.1 m AMSL); Ogouchi Station (35°47.5′N, 139°0.3′E; elevation, 530.0 m AMSL.Data Source: Japan Meteorological Agency 2012b
Table 2 Comparison of climatological changes in the Tokyo metropolitan area, based on annual normalclimatological records of Tokyo (city center) and Ogouchi stations (rural area)
Name ofObservatory
Annual normals based on observed data from1981–2000
Annual normals based on observed data from1991–2011
Meantemp. (°C)
Daily max.temp. (°C)
Daily min.temp. (°C)
Mean preci.(mm)
Meantemp. (°C)
Daily max.temp. (°C)
Daily min.temp. (°C)
Mean preci.(mm)
Tokyo 16.3 20.0 13.0 1528.8 16.5 20.2 13.2 1574.0
Ogouchi 11.9 17.1 8.1 1623.5 12.2 17.0 8.5 1616.1
Tokyo Station (35°41.1′N, 139°45.6′E, elevation=6.1 m AMSL); Ogouchi Station (35°47.5′N, 139°0.3′E,elevation=530.0 m AMSL)
Japan Meteorological Agency 2012b
Mitig Adapt Strateg Glob Change (2014) 19:589–614 599

and 1.2 °C, respectively (Fig. 5b). In summer 2004 and 2008, August maximumtemperatures were lower than 27.5 °C (27.2 °C and 26.8 °C), with highest temperaturedifference between monthly maximum temperature in June and July (4.8 °C and 5.7 °C,respectively) (Fig. 5b), there were fewer people hospitalized with heat stroke in 2004and 2008.
3.1 GIS statistics modules
A DMT with GIS modules can serve our purposes, since GIS can manage enormousamounts of data conveniently, cost effectively and quickly. GIS statistics of the DMT furnisha mapping approach which can be used to produce a regional development snapshot basedon governmental statistical information.
Figure 6a shows the lowest population density is 0–10 persons/km2, which covers morethan half the area as of 1 October 2010. The ratio of people aged 65 or older in Okutama-machi exceeds 25 % (compared to the nationwide ratio of 23.01 % as of 1 October 2010).There are two areas in Okutama-machi where this ratio is over 60 % (Fig. 6b).
Fig. 5 Number of people hospitalized with heat stroke from 2000 to 2011 in Tokyo (a). Monthly maximumtemperature in August and temperature difference between maximum temperature in June and July in 2004,2005, 2007, 2008, 2010 and 2011 (800 or more hospitalized with heat stroke) (b) and number of extremely hotdays with maximum temperature exceeding 30 °C and 35 °C during 2000–2012 based on the records fromTokyo (city center) and Ogouchi stations (rural area) (c). Black number in (b): temperature difference betweenmaximum temperature in June and July; white number in (b): August maximum temperature. Data Source (a):Ministry of Health, Labour and Welfare, 2011. Data Source (b and c): Tokyo Fire Department 2012
600 Mitig Adapt Strateg Glob Change (2014) 19:589–614
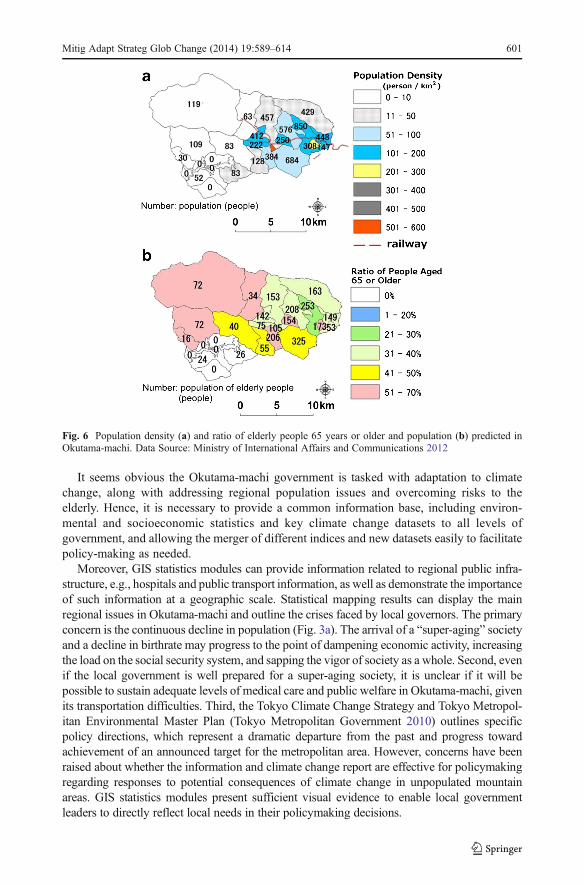
It seems obvious the Okutama-machi government is tasked with adaptation to climatechange, along with addressing regional population issues and overcoming risks to theelderly. Hence, it is necessary to provide a common information base, including environ-mental and socioeconomic statistics and key climate change datasets to all levels ofgovernment, and allowing the merger of different indices and new datasets easily to facilitatepolicy-making as needed.
Moreover, GIS statistics modules can provide information related to regional public infra-structure, e.g., hospitals and public transport information, as well as demonstrate the importanceof such information at a geographic scale. Statistical mapping results can display the mainregional issues in Okutama-machi and outline the crises faced by local governors. The primaryconcern is the continuous decline in population (Fig. 3a). The arrival of a “super-aging” societyand a decline in birthrate may progress to the point of dampening economic activity, increasingthe load on the social security system, and sapping the vigor of society as a whole. Second, evenif the local government is well prepared for a super-aging society, it is unclear if it will bepossible to sustain adequate levels of medical care and public welfare in Okutama-machi, givenits transportation difficulties. Third, the Tokyo Climate Change Strategy and Tokyo Metropol-itan Environmental Master Plan (Tokyo Metropolitan Government 2010) outlines specificpolicy directions, which represent a dramatic departure from the past and progress towardachievement of an announced target for the metropolitan area. However, concerns have beenraised about whether the information and climate change report are effective for policymakingregarding responses to potential consequences of climate change in unpopulated mountainareas. GIS statistics modules present sufficient visual evidence to enable local governmentleaders to directly reflect local needs in their policymaking decisions.
Fig. 6 Population density (a) and ratio of elderly people 65 years or older and population (b) predicted inOkutama-machi. Data Source: Ministry of International Affairs and Communications 2012
Mitig Adapt Strateg Glob Change (2014) 19:589–614 601

3.2 Climate change indices (1979–2003, 2015–2039, and 2075–2099)
A suite of climate change indices derived from daily temperature and precipitation data, includingprojected climate data, were computed and analyzed. To obtain accurate and detailed temperatureand precipitation information on a daily time scale, all observed data were from an array of JMAsurface observation networks. These networks are composed of automatic observation equipmentcollectively known as the Automated Meteorological Data Acquisition System (AMeDAS). Allobservational data are transmitted to JMA’s data base (Japan Meteorological Agency 2012b).
Projected climate data are based on the NHRCM-5 km mesh regional climate model, withthe SRES-A1B scenario. Sasaki et al. (2011), who developed the NHRCM-5 km, estimatedits output in long-term climate projections and analyzed uncertainty based on model expertjudgment. The bias of modeled annual mean temperature is −0.3 °C, and root mean square(RMS) errors are 0.7 °C. However, summer season output is almost the same as AMeDASobservations, except in mountainous areas (Sasaki et al. 2011).
The climate informatics module consists of the spatial distribution of projected climaticindices and their change, using daily, monthly and annual weather data (focus on temperatureand precipitation in summertime) from three study periods (1979–2003, 2015–2039 and 2075–2099). The DMTcreates the downscaled dataset over a simulation area of 120 km×60 km, anddisplays the simulation results on the same GIS domain. Figure 7 illustrates mean temperaturechanges in the months of July to October over Tokyo in the near future (2015–2039) and future(2075–2099) periods. Because the time of NHRCM-5 km output is corrected from CoordinatedUniversal Time (UTC) to Japan time, there is less hourly data from 0000 to 0900 on 1 June, sodata from 1 June are not used in the calculations. Simulation results from the GIS mapping toolindicate that summer temperatures in metropolitan Tokyo will increase by more than 2.5 °C inthe future period, and more than 0.5 °C in the near-future period.
Downscaled NHRCM-5 km output provides changes in July to October monthly meantemperature, along with percent changes in monthly precipitation for those months, duringthe near-future and future periods at Okutama-machi. Figure 8 shows August monthly meantemperature will increase more than 0.7–0.9 °C, and monthly precipitation by 50 % in thenear–future period. For the future period, August monthly mean temperature will increasemore than 2.8–2.9 °C, and monthly precipitation by 25–41 %. The mean temperatureincrease at Okutama-machi is the greatest of any area in Tokyo during both periods.
Sasaki et al. (2011) showed that NHRCM-5 km output in the summer season is nearly thesame as AMeDAS observations, except in mountainous areas. Because Okutama-machi issuch a mountainous zone with a rough landscape, detailed comparisons between NHRCM-5 km output and observations over the last 25 years (1979–2003) are made based on dailymean surface air temperature from Ogouchi station. Figure 9 illustrates the cumulativerelative frequency of NHRCM-5 km daily temperature in July, August, September andOctober during 1979–2003 (775 samples in July, August and October; 750 samples inSeptember). The model ensemble mean (Fig. 9) shows qualitative agreement of daily meantemperature at the same elevation from July to October.
Allan and Soden (2008) found the observed amplification of rainfall extremes to be largerthan that projected by models, and noted that projections of future changes of such extremesin response to anthropogenic global warming may be underestimated. Here, to estimatemonthly NHRCM-5 km output for July to October mean precipitation, we selected
Fig. 7 Monthly mean temperature distribution in July, August, September and October for the present period(a), monthly mean temperature change in those months in near–future period and future period (b) based onsimulation (present period: 1979–2003; near-future period: 2015–2039; future period: 2075–2099)
�
602 Mitig Adapt Strateg Glob Change (2014) 19:589–614

Mitig Adapt Strateg Glob Change (2014) 19:589–614 603

meteorological data from five meteorological stations in mountainous areas (Fig. 10b②,③,④, ⑤ and ⑥: indicate the five meteorological stations in mountainous areas) coveringOkutama-machi. Figure 10a reveals a large difference in performance around the fivestations. The NHRCM-5 km mean precipitation was lower than observations in August,and higher than those in July. One reason for this variation seems that the model canreproduce the rainy season, known as Tsuyu in Japan, which will tend to arrive in Tokyolater in the season in the future than it does now (now, the rainy season in Tokyo begins in June;however, in the future, it will begin in July), because the subtropical high pressure around Japanbecomes more active in the model than the observation. The NHRCM-5 kmmean precipitationwas higher than observations in July and lower than observations in August.
Unfortunately, there is little convincing information regarding this performance. AsSasaki et al. (2011) explained, the NHRCM can reproduce intense precipitation (more than
Fig. 8 Changes in July, August, September and October monthly mean temperature and percentage changesin monthly precipitation for those months at Okutama-machi, during near–future (2015–2039) and future(2075–2099) periods from NHRCM-5 km output. Numbers indicate change in August temperature (a), andratio of change in August precipitation (b)
604 Mitig Adapt Strateg Glob Change (2014) 19:589–614

80 mm hour−1) more accurately than the MRI-AGCM3.2S model. A climate-informaticsanalysis for Okutama-machi indicates agreement for the simulations of September andOctober monthly precipitation (Fig. 10a). This means that the NHRCM-5 km reproducesthe peak of precipitation in these months, because of favorable simulation of typhoonlandfall frequency.
Recent climate model improvements have enhanced the ability to simulate many aspectsof climate variability and extremes. However, systematic errors and limitations in accuratelysimulating regional climate conditions remain (Easterling et al. 2000). Sasaki et al. (2011)gave bias and RMS error of annual mean precipitation difference between NHRCM-5 kmand observations at −11 mm and 379 mm, respectively. Similarly, Kanada et al. (2010)reported bias of 10-year mean regional maximum precipitation in summertime betweenNHRCM-5 km and observations at 9 %, and bias in the number of wet days from June toOctober was 12 %. To estimate NHRCM-5 km errors of simulated precipitation, RMS errorsand bias of monthly precipitation differences were calculated. Observed data are availablefrom five observation stations (Fig. 8b and 2). RMS errors and bias are defined by formulas(1) and (2):
RMS ¼ffiffiffiffiffiffiffiffiffiffiffiffiffiffiffiffiffiffiffiffiffiffiffiffiffiffiffiffiffiffiffiffiffiffiffiffiffiffiffiffiffiffiffiffiffiffi
1
N
X
N
k¼1
Modk � Obskð Þ2v
u
u
t ð1Þ
Fig. 9 Comparisons between observations (blue lines) and NHRCM-5 km output (red lines) of cumulativerelative frequency (y-axis scale) distributions of daily mean temperature during July, August, September andOctober 1979–2003. Observed data records are from Ogouchi Station (35°47.5′N, 139°0.3′E, elevation530.0 m AMSL). Number of samples in July, August and October: 31 daily data×25 years = 775 samples.Number of samples in September: 30 daily data×25 years = 750 samples
Mitig Adapt Strateg Glob Change (2014) 19:589–614 605

bias ¼ 1
N
X
N
k¼1
Modk � Obskð Þ ð2Þ
where Mod is model simulations and Obs is observations; N is the number of data (numberof observation stations×25 years×4 months=500 samples).
Data were analyzed for 25 years, from 1979 through 2003, and 4 months, from Julythrough October. The RMS error of difference in July, August, September and Octobermonthly precipitation between the model simulations and observations is 66.18 mm, and thebias of difference is −0.49 mm. We also computed RMS errors and bias of percentagechange for monthly precipitation of these months, which were 26.8 % and 4.3 %,respectively.
Fig. 10 Percentage difference in July, August, September and October monthly precipitation betweenHNRCM-5 km output and observations during 1979–2003 (a) and observation station location map withelevations (b). Observed data records are from ② Ogouchi Station (35°47.5′N, 139°0.3′E, elevation 530.0 mAMSL),③ Ozawa Station (35°44.1′N, 139°7.4′E, elevation 420.0 m AMSL),④Mitsumine Station (35°55.6′N, 138°55.4′ E, elevation 975.0 m AMSL), ⑤ Urayama Station (35°55.2′N, 139°4.2′E, elevation 400.0 mAMSL) and ⑥ Uenohara Station (35°37.3′N, 139°6.8′ E, elevation 251.0 m AMSL)
606 Mitig Adapt Strateg Glob Change (2014) 19:589–614

3.3 Vulnerability assessment
Vulnerability information is useful to moderate potential damages and take advantageof opportunities to adjust strategy as needed. Hallegatte and Corfee-Morlot (2011)stated understanding of vulnerability at a local scale can help national and subnationalgovernments work closely with city authorities. If this is addressed, enabling nationalpolicy frameworks can help city authorities and other local decision-makers to executelocally-tailored, cost-effective and timely solutions. Here, the DMT is a basic tool forrepresenting regional physical vulnerability to the direct impacts of local climatechange.
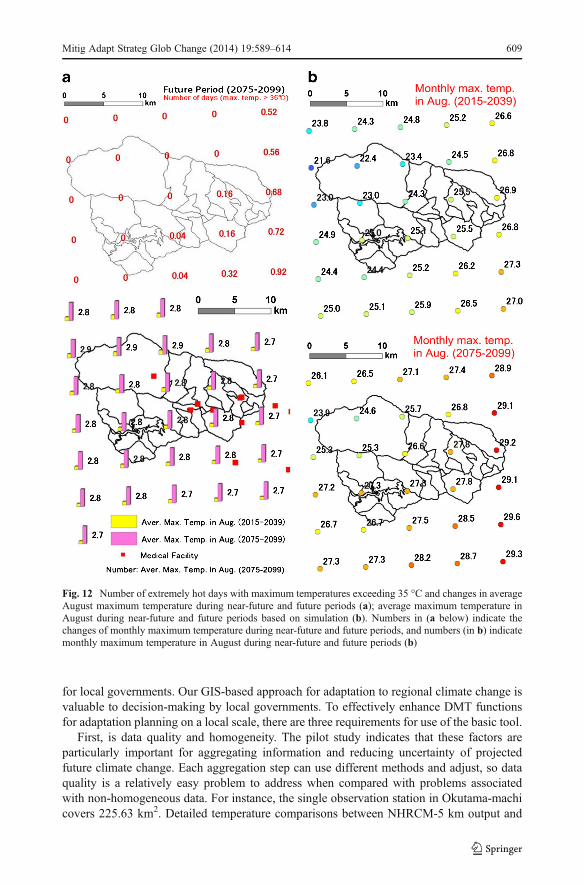
Figures 11 and 12 give examples of vulnerability assessment in Okutama-machi. As seenin Fig. 7, mean temperatures increase in Okutama-machi faster than any area in Tokyoduring both the near-future and future periods. However, Figs. 11 and 12b show that themonthly average maximum temperature in Okutama-machi during the future period (2075–2099) will be less than 30 °C. There is no significant change in the number of extremely hotdays with maximum temperature exceeding 35 °C (0–0.92 day year−1 in that period;Fig. 12a, the above). These results caution that it is necessary to examine links betweennational and local climate policy response. The increase in August average maximumtemperature during the future period is 2.7–2.9 °C. Thus, it appears that one legitimatepolicy decision, as an example of design and delivery of a climate policy solution by localgovernment, is the construction of a medical facility or healthcare center in Tozura for theaged (Fig. 3b). These firsthand analyses clarify high-priority issues and provide critical inputto planning for climate change.
Figure 8b illustrates the drainage network in Okutama-machi and percent changes ofmonthly precipitation from NHRCM-5 km, during the near-future (2015–2039) and futureperiods (2075–2099). In the near future, August monthly precipitation will increase by 50 %(Fig. 8b). First-priority specific adaptation measures should be implemented to limit floodrisks. The RMS error of percentage change for July to October monthly precipitationbetween model simulations and observations is 26.8 %, and the bias of percentagechange is 4.3 %. The vulnerability assessment can be used to guide policymakers. Forexample, in the Nippara and Tozura area (Fig. 3b), aging population ratios exceed50 % and 60 % as of 1 October 2010 (Fig. 6a), respectively. This means that regionsvulnerable to climate change are also under pressure from forces such as changingpopulation demographics. The potential vulnerability links between human lives andclimate change become obvious. Sufficient information is available for policymakingabout responses to potential climate change consequences, and this indicates anexplicit need for initiatives by local governors to design adaptation strategies andbuild adaptive capacities.
Fig. 11 Distribution of August average maximum temperature greater than or equal to 30 °C during 2075–2099
Mitig Adapt Strateg Glob Change (2014) 19:589–614 607

4 Results and discussion
For decades, many international meteorological organizations have promoted advancement of aninternational cooperation framework to facilitate the availability of data, information, productsand services in real- or near-real time, free to the research community. These organizationsinclude the World Meteorological Organization (WMO), Global Climate Observing System(GCOS), Global Surface Network (GSN), European Climate Assessment (ECA) and dailyGlobal Historical Climatology Network (GHCN Daily) (Alexander et al. 2006). In this paper,the ever expanding volumes of data (5 km resolution) are easily and freely available to enablenew scientific research by a GIS-based DMT. These data and the results that depend on them areuseful to and understandable by a broad interdisciplinary audience, especially by the local policy-makers. A similar approach can be achieved in the other areas/countries using observations andregional simulations for which the output can be downloaded freely.
The NHRCM-5 km output (only evaluates for Japan) is the most complete and currentevaluation of projected climate change impacts on Japan. The pilot study leads to thefollowing conclusions:
1) Using a GIS-based tool, the model promotes understanding of the most important con-sequences of climate change on local livelihoods. Figures 7, 8, 11 and 12 present simplemapping of local impact analysis of climate change in Okutama-machi. These resultsconfirm the impacts of climate change are felt locally. Many attributes (Figs. 2, 3, 5 and 6)that determine human vulnerability and adaptive capacity are also local. Figures 3, 5 and 6displays the main issues in the Okutama-machi region and the crisis faced by localgovernment leaders. Knowledge of adaptation is limited within existing literature.
2) The DMT facilitates two-way exchange of local knowledge between researchers anddecision makers. Non-expert governors will benefit from the tool by understanding theprojections graphically; bias and RMS errors of simulation can be clearly determined.For example, as seen in Fig. 7, the mean temperature increase in Okutama-machi is thehighest of any area in Tokyo during both near-future and future periods. However,Figs. 11 and 12b show that the August monthly maximum temperature in Okutama-machi during the future period (2075–2099) will be less than 30 °C based on the climatechange projections. Figures 7 and 8 show the level of uncertainty, as given by the DMT.
3) The pilot study tested several functions of the DMT with GIS. The study outcomeshows that the mapping tool can illustrate likely climate change during near-future(2015–2039) and future (2075–2099) periods, and can address different climate changeadaptations needed on various time scales (Figs. 11 and 12). These outcomes and thebasic tool can facilitate good decision making. Further, hazard-specific adaptive actionswill have potential knock-on effects for generic governance systems. These can becomeequitable (more inclusive decision making) to avoid increased disparity and inequality.
4) The pilot study outcomes also suggest that online systems with services (datasets fromGIS statistics are available for re-editing and visualization on web browsers) are centralto adaptive capacity, because these make real-time information available to multipleusers and encourage national and subnational governments to work closely with localauthorities. This means that building bridging capital (connections between groups insociety) is most important for local governments in unpopulated mountain regions,especially for marginal villages.
Currently, the need for managing climate vulnerabilities and for adaptation is widelyunderstood. Questions about whether, how and when to adapt are often difficult to answer
608 Mitig Adapt Strateg Glob Change (2014) 19:589–614
for local governments. Our GIS-based approach for adaptation to regional climate change isvaluable to decision-making by local governments. To effectively enhance DMT functionsfor adaptation planning on a local scale, there are three requirements for use of the basic tool.
First, is data quality and homogeneity. The pilot study indicates that these factors areparticularly important for aggregating information and reducing uncertainty of projectedfuture climate change. Each aggregation step can use different methods and adjust, so dataquality is a relatively easy problem to address when compared with problems associatedwith non-homogeneous data. For instance, the single observation station in Okutama-machicovers 225.63 km2. Detailed temperature comparisons between NHRCM-5 km output and
Fig. 12 Number of extremely hot days with maximum temperatures exceeding 35 °C and changes in averageAugust maximum temperature during near-future and future periods (a); average maximum temperature inAugust during near-future and future periods based on simulation (b). Numbers in (a below) indicate thechanges of monthly maximum temperature during near-future and future periods, and numbers (in b) indicatemonthly maximum temperature in August during near-future and future periods (b)
Mitig Adapt Strateg Glob Change (2014) 19:589–614 609

observations during the last 25 years (1979–2003) are difficult. If local observational data or astatistical dataset is not available, using the DMT is impossible. At the very least, it is necessaryto facilitate internet access and create a basic dataset for adaptation to regional climate changeand decision-making by a local government, especially in a depopulated community.
The second requirement is to minimize subjectivity and maximize generality. Villa andMcLeod (2002) reported that it is risky and unwise to mix different-scale information intheoretical frameworks for obtaining an approximate vulnerability indicator. An importantstep is the scaling of indicators. Figure 13 illustrates population distributions and moredetailed change of August temperatures, during the near-future and future periods inOkutama-machi. It is useful to calculate the degree of susceptibility and inability to copewith adverse effects of climate change (including climate variability and extremes), such aschanges in groundwater content and spring water in mountain areas. Approximate quanti-fication is necessary to aid consensus-building on adaptation to regional climate changeamong decision makers.
The third requirement is to adjust bias in projections, by developing new knowledge fromscience and practice. One method of increasing adaptive capacity is to consider climateimpacts during regional development planning (IPCC 2007c). Bias can occur in subtle orunknown ways and its effect is not directly measurable, e.g., the bias of difference in July toOctober monthly precipitation between model simulations and observations in this pilotstudy was −0.49 mm. Therefore, evaluating existing bias is necessary when choosingsocioeconomic development pathways.
Output from the NHRCM-5 km, following the SRES-A1B scenario is the highestresolution output available compared to other RCMs under CMIP5. It took about 2 yearsto run by Earths Simulator. After the Great East Japan Earthquake of 2011, power shortagesawakened consumers to the importance of energy efficiency. Moreover, post-disaster powershortfalls have renewed interest in fossil fuels. Coal-fired power plants are now expected toplay a greater role as a basic power source (“Japan To Smooth Path For Coal-Fired Plants,”Nikkei English News, 2012). Japan’s efforts to cut carbon dioxide emissions will becompromised with the new coal-fired power plant policy, and this appears to be headingin a considerably different direction from the pledge under the United Nations FrameworkConvention on Climate Change Kyoto Protocol. The need to consider the globally importantissue of climate change risk thus becomes more acute for the government of Japan. There isonly one selected alternative (scenario) which is connected to Japan’s reality.
Fig. 13 Population distributions and detailed change of August temperatures during near-future and futureperiods in Okutama-machi. Numbers indicate population in each district
610 Mitig Adapt Strateg Glob Change (2014) 19:589–614

The IPCC has commissioned and approved several sets of scenarios for climate researchover the past two decades. However, the output from the NHRCM-5 km in this study onlyfollows the SRES-A1B scenario. Our research group has been making a plan to help all localgovernments in Japan access, understand, and use these output (5 km resolution) to adapt toregional climate change using the DMT we illustrated. Our research group discussed andresponded to this issue. The new reality and the urgency of regional adaptive actionemphasize that scientists and other stakeholders are increasingly faced with questions aboutthe suitability of high resolution data they use for various purposes. It seems a new regionalclimate research paradigm has come into existence: making sure those highest resolutiondata and the results are useful to, understandable by and meet the needs of a wide range ofnon-scientists users. This seems more important than simply providing several sets ofscenarios as has occurred with traditional climate research, because as Jones (2000) recom-mended “both projection and scenario are used to describe possible future states, and twolevels of uncertainty portrayal can be identified in the IPCC Working Group I with regard toestimates of climate change: scenarios and projections.” Moreover, the projected rangeconsists of a quantifiable range of uncertainty that encompasses the scenarios. Pittock andJones (2000) also conclude that a high degree of uncertainty sometimes make scientificadvice appear unhelpful to decision makers.
Open and free availability of model data, observations, and the software used forprocessing is crucial to all aspects of the new paradigm (Overpeck et al. 2011). Thehighest resolution NHRCM-5 km output provides a new approach that will lead toheightened collaboration between impacts, adaptation and vulnerability research, andclimate and integrated assessment modeling. Our research group has been making aplan to help all local governments use GIS-based approaches to adapt to regionalclimate change in Japan using the DMT we illustrated. An all-inclusive adaptedcomparison analysis will improve the analysis of complex issues, such as the costs,benefits and risks of different policy choices and climate and socioeconomic futures.This perspective provides an overview of how the scenario is used in climate changeresearch, and summarizes the new process and a framework for modeling in the nextstages of scenario-based local research.
The DMT is a cost-effective, user-friendly mapping tool. We have been trying toadjust bias in climate projection. New downscaling methods and higher resolutionsimulations are needed. The “K computer” is now available to conduct high-resolution(800 m) simulations of atmospheric circulation, providing detailed projections ofweather phenomena that elucidate localized effects, such as cloudbursts (RIKEN2012). This improves the ability to downscale projections of global climate modelsto the local scale. Currently, out of 3,233 cities, towns, and villages in Japan, 1,208are classified as depopulated areas, and they compose 48 % of the total area of Japan(Ministry of International Affairs and Communications 2012). The DMT can facilitatecloser working relationships between regional governments in these areas and thenational government, which strengthens connections between local groups anddecreases regional vulnerability to climate change.
Acknowledgments The authors would like to thank the Meteorological Research Institute, Japan Meteoro-logical Agency for supporting this research. We also wish to thank Professor Akihiko Kondoh, Center forEnvironmental Remote Sensing, Chiba University, Mr. Ryunosuke Matsushita and Mr. Buhebaoyin (the lattertwo are graduate students in the Kondoh Laboratory of Chiba University) for their valuable comments onDMT development. Three anonymous reviewers greatly improved an earlier draft of this manuscript. Thisstudy is conducted under the Green Society ICT Life Infrastructure Project conducted by Keio University,supported by Strategic Funds for the Promotion of Science and Technology: Social System Reformation
Mitig Adapt Strateg Glob Change (2014) 19:589–614 611

Program for Adaptation to Climate Change sponsored by the Ministry of Education, Culture, Sports, Scienceand Technology, Japan. The meteorological data has been prepared by KAKUSHIN program, supported bythe Ministry of Education, Culture, Sports, Science, and Technology, Japan.
Open Access This article is distributed under the terms of the Creative Commons Attribution License whichpermits any use, distribution, and reproduction in any medium, provided the original author(s) and the sourceare credited.
References
Alexander LV, Zhang X, Peterson TC, Caesar J, Gleason B, Klein Tank AMG, Haylock M, Collins D, TrewinB, Rahimzadeh F, Tagipour A, Ambenje P, Rupa Kumar K, Revadekar J, Griffiths G (2006) Globalobserved changes in daily climate extremes of temperature and precipitation. J Geophys Res 111:D05109.doi:10.1029/2005JD006290
Allan RP, Soden BJ (2008) Atmospheric warming and the amplification of precipitation extremes. Science321:481–1484. doi:10.1126/science.1160787
CMIP5 Coupled Model Intercomparison Project (2012) CMIP5 -Data Access- Availability. http://cmip-pcmdi.llnl.gov/cmip5/availability.html. Cited 1 December 2012
Corfee-Morlot J, Cochran I, Hallegatte S, Teasdale P-J (2011) Multilevel risk governance and urban adapta-tion policy. Clim Chang 104:169–197. doi:10.1007/s10584-010-9980-9
Davidian M, Louis TA (2012) Why statistics? Science 336:12. doi:10.1126/science.1218685Duffy PB, Tebaldi C (2012) Increasing prevalence of extreme summer temperatures in the U.S. Clim Chang
111:487–495. doi:10.1007/s10584-012-0396-6Easterling DR, Meehl GA, Parmesan C, Changnon SA, Karl TR, Mearns LO (2000) Climate extremes:
observations, modeling, and impacts. Science 289:2068–2074. doi:10.1126/science.289.5487.2068Elguindi N. and A. Grundstein (2012) An integrated approach to assessing 21st century climate change over the
contiguous U.S. using the NARCCAP RCM output. Climatic Change (in press). doi: 10.1007/s10584-012-0552-zElguindi N, Rauscher SA, Giorgi F (2012) Historical and future changes in maximum and minimum
temperature records over Europe. Clim Chang. doi:10.1007/s10584-012-0528-zHallegatte S, Corfee-Morlot J (2011) Understanding climate change impacts, vulnerability and adaptation at
city scale: an introduction. Clim Chang 104:112. doi:10.1007/s10584-010-9981-8Hayhoe K, Wake C, Anderson B, Liang X-Z, Maurer E, Zhu J, Bradbury J, DeGaetano A, Stoner AM,
Wuebbles D (2008) Regional climate change projections for the Northeast USA. Mitig Adapt StrategGlob Change 13:425–436. doi:10.1007/s11027-007-9133-2
IPCC Data Distribution Centre (2011) Constructing Sea-Level Scenarios for Impact and Adaptation Assess-ment of Coastal Areas: A Guidance Document: Version 1 (Proof) http://www.ipcc-data.org/docs/_Sea_Level_Scenario_Guidance_Oct2011.pdf
IPCC Data Distribution Centre (2012a) Climate observations. http://www.ipcc-data.org/obs/index.html. Cited26 September 2012
IPCC Data Distribution Centre (2012b) AR4 GCM Data. http://www.ipcc-data.org/gcm/monthly/SRES_AR4/index.html. Cited 1 December 2012
IPCC Data Distribution Centre (2012c) Scenarios Process for AR5. http://sedac.ciesin.columbia.edu/ddc/ar5_scenario_process/RCPs.html. Cited 1 December 2012
IPCC Fourth Assessment Report (2007a) In: Solomon S, Qin D, Manning M, Chen Z, Marquis M, Averyt KB,TignorM,Miller HL (eds) The physical science basis. Contribution of working group I to the threeth assessmentreport of the intergovernmental panel on climate change, 2007. Summary for policymakers: direct observationsof recent climate change. Cambridge University Press, Cambridge, http://www.ipcc.ch/publications_and_data/ar4/wg1/en/spmsspm-direct-observations.html. Cited 26 September 2012
IPCC Fourth Assessment Report (2007b) In: Solomon S, Qin D, Manning M, Chen Z, Marquis M,Averyt KB, Tignor M, Miller HL (eds) The physical science basis. Contribution of working groupI to the threeth assessment report of the intergovernmental panel on climate change, 2007.Chapter 10: Global climate projections: direct observations of recent climate change. CambridgeUniversity Press, Cambridge, http://www.ipcc.ch/publications_and_data/ar4/wg1/en/ch10s10-es-8-sea-level.html. Cited 1 December 2012
IPCC Fourth Assessment Report (2007c) In: Parry ML, Canziani OF, Palutikof JP, van der Linden PJ, HansonCE (eds) Contribution of Working Group II to the threeth assessment report of the intergovernmentalpanel on climate change, 2007. Summary for policymakers: D. Current knowledge about responding to
612 Mitig Adapt Strateg Glob Change (2014) 19:589–614

climate change. Cambridge University Press, Cambridge, http://ipcc.ch/publications_and_data/ar4/wg2/en/spmsspm-d.html. Cited 26 September 2012
IPCC Third Assessment Report “Climate Change 2001” (Complete online versions: it was published to theweb by GRID-Arendal in 2003) Working group II: impacts, adaptation and vulnerability. summary forpolicymakers: 2.4. Many human systems are sensitive to climate change, and some are vulnerable. Box SPM-1. Climate change sensitivity, adaptive capacity, and vulnerability. http://www.grida.no/publications/other/ipcc_tar/. Cited 26 September 2012
Japan Meteorological Agency (2012a) Observations: surface observations. http://www.jma.go.jp/jma/en/Activities/observations.html. Cited 26 September 2012
Japan Meteorological Agency (2012b) Metrological data. http://www.data.jma.go.jp/obd/stats/etrn/select/prefecture00.php?prec_no=&block_no=&year=&month=&day=&view=(in Japanese). Cited 26September 2012
Jones RN (2000) Managing uncertainty in climate change projections – Issues for impact assessment An EditorialComment. Clim Chang 45:403–419, http://stephenschneider.stanford.edu/PDF_Papers/Jones.pdf
Kanada S, Nakano AM, Kato K (2010) Climatological characteristics of daily precipitation over Japan in theKakushin regional climate experiments using a non-hydrostatic 5-km-mesh model: comparison with anouter global 20-km-mesh atmospheric climate model. SOLA 6:117–120. doi:10.2151/sola.2010-030
Kitoh A, Ose T, Kurihara K, Kusunoki S, SugiM, KAKUSHIN Team-3Modeling Group (2009) Projection of changesin future weather extremes using super-high-resolution global and regional atmospheric models in the KAKUSHINprogram: results of preliminary experiments. Hydrological Research Letters 3:49–53. doi:10.2151/jmsj.2012-B04
Kusaka H, Hara M, Tkane Y (2012) Urban climate projection by the WRF model at 3-km horizontal gridincrement: dynamical downscaling and predicting heat stress in the 2070’s August for Tokyo, Osaka, andNagoya Metropolises. J Meteorol Soc Jpn 90B:47–63. doi:10.2151/jmsj.2012-B04
Lass W, Haas A, Hinkel J, Jaeger C (2011) Avoiding the avoidable: towards a European heat waves riskgovernance. Int J Disaster Risk Sci 2(1):1–14. doi:10.1007/s13753-011-0001-z
Lemonsu A, Kounkou-Arnaud R, Desplat J, Salagnac J-L, Masson V (2013) Evolution of the Parisian urbanclimate under a global changing climate. Clim Chang 116:679–692. doi:10.1007/s10584-012-0521-6
Ministry of Health, Labour and Welfare (2011) Minister’s Secretariat: Report of Statistics and Information Depart-ment. http://www.mhlw.go.jp/toukei/saikin/hw/jinkou/suii10/dl/s08.pdf. (in Japanese) Cited 25 September 2012
Ministry of International Affairs and Communications (2012) Statistics Bureau: Database of the nationalcensus. http://www.stat.go.jp/data/kokusei/2010/index.htm. (in Japanese) Cited 25 September 2012
Mizuta R, Yoshimura H, Murakami H, Matsueda M, Eudo H, Ose T, Kamiguchi K, Hosaka M, Sugi M,Yukimoto S, Kusunoki S, Kitoh A (2012) Climate simulations using MRI-AGCM 3.2 with 20-km grid. JMeteorol Soc Jpn 90A:233–258. doi:10.2151/jmsj.2012-A12
Murata A, Nakano M, Kanada S, Kurihara K, Sasaki H (2012) Summertime temperature extremes over Japanin the late 21st century projected by a high-resolution regional climate model. J Meteorol Soc Jpn90A:101–122. doi:10.2151/jmsj.2012-A05
Nakano M, Kato T, Hayashi S, Kanda S, Yamada Y, Kurihara K (2012) Notes and correspondence:development of a 5-km-mesh cloud-system-resolving regional climate model at the MeteorologicalResearch Institute. J Meteorol Soc Jpn 90A:339–350. doi:10.2151/jmsj.2012-A19
Nikkei EnglishNews (2012) Japan to smooth path for coal-fired plants. September 25, 2012. http://e.nikkei.com/e/fr/freetop.aspx. Cited 25 September 2012
Overpeck JT, Meehl GA, Bony S, Easterling DR (2011) Climate data challenges in the 21st century. Science331:700–702. doi:10.1126/science.1197869
Patricola CM, Cook KH (2010) Northern African climate at the end of the twenty-first century: an integratedapplication of regional and global climate models. Clim Dyn 35:193–212. doi:10.1007/s00382-009-0623-7
Pittock AB, Jones RN (2000) Adaptation to what and why? Environ Monit Assess 61(1):9–35. doi:10.1023/A:1006393415542
RIKEN. 2012. RIKEN and Fujitsu Complete Operational Testing of the K computer. http://www.riken.go.jp/engn/r-world/info/info/2012/120702/image/120702.pdf. Cited 25 September 2012
Sasaki H, Murata A, Hanafusa M, Ohizumi M, Kurihara K (2011) Reproducibility of present climate in a non-hydrostatic regional climate model nested within an atmosphere general circulation model. SOLA 7:173–176. doi:10.2151/sola.2011-044
Sasaki H, Murata A, Hanafusa M, Ohizumi M, Kurihara K (2012) Projection of future climate change in anon-hydrostatic regional climate model nested within an atmospheric general circulation model. SOLA8:53–56. doi:10.2151/sola.2012-014
Schröter D, Metzger MJ, Cramer W, Leemans R (2004) Vulnerability assessment. analyzing the human-environment system in the face of global environmental change. Environ Sci Sect Bull 2(2):11–17.doi:10.1016/S1462-9011(00)00102-7, http://www.cid.harvard.edu/events/papers/schroeter_proofs_ESS04.pdf
Mitig Adapt Strateg Glob Change (2014) 19:589–614 613

Tokyo Fire Department (2012) http://www.tfd.metro.tokyo.jp/hp-kouhouka/pdf/240517.pdf (in Japanese)cited 1 December 2012
Tokyo Metropolitan Government (2010) Tokyo climate change strategy: progress report and future vision (March31, 2010). Environment of Tokyo: climate change. http://www.kankyo.metro.tokyo.jp/en/attachement/Tokyo_climate_change_strategy_progress_report_03312010.pdf. Cited 25 September 2012
Villa F, McLEOD H (2002) Environmental vulnerability indicators for environmental planning and decision-making: guidelines and applications. Environ Manag 29(3):335–348. doi:10.1007/s00267-001-0030-2
WCRP Coupled Model Intercomparison Project—Phase 5: Special Issue of the CLIVAR Exchanges News-letter (2011) http://www.clivar.org/sites/default/files/imported/publications/exchanges/Exchanges_56.pdf. Cited 1 December 2012
Willis JK, Church JA (2012) Regional sea-level projection. Science 336:550–551. doi:10.1126/science.1220366
614 Mitig Adapt Strateg Glob Change (2014) 19:589–614