Embed Size (px)
Citation preview

A koktelparti effektus
Hogy lehet ebben a helyzetben a hallgato egyaltalan kepes megerteni a beszedet?
Mik a koktelparti effektus faktorai es dimenzioi?
Lehetseges-e a kutatonak a realis helyzetet leegyszerusitenie es leszukitenie ahhoz, hogy igy parametrikus kiserleteket vegezzen el? Lehetseges-e az ilyen kiserletek eredmenyeit visszavezetni a teljes, leegyszerusitetlen realis helyzethez?

Segitseg jon Albert Bregmantol (“Auditory Scene Analysis”, 1990)
“Stream segregation” – hangzo folyamatok elkulonitese
Ket fele elkkulonites:
1 automatikus, primitiv (periferikusan eredo, alulrol-felfele halado)
2 sema-altal meg hatarozott (magas szinten eredo, felulrol-lefele halado)
Csoportositasi elv (=grouping principle)
hangokat vagy hangok komponenseit akkor tekintjuk egy forrasbol eredonek, ha csoportosithatjuk oket kozos jellegzetesseg(ek) alapjan, pl. ugyanazon alaphang felhangjai, vagy ugyanolyan idoburkolat, vagy ugyanolyan beesesi szog, stb.

The “cocktail-party effect:”
• (trying to) follow one particular talker’s speech in a crowd
3
2
1
0.5
4
kHz
3
2
1
0.5
4
kHz

Auditory Segregation:• Definitions• The psychophysical space of auditory
segregation dimensions• Part I: -- The problem of dimensionality
-- 1D data: discrimination in informational masking
--Prediction of 2D segregation from 1D informational masking estimates
• Part II: -- Correlation between pairs of segregation dimensions computed
from obtained and predicted 2D data

THE "COCKTAIL PARTY EFFECT":
One speech source (=the "target") is segregated from other simultaneous speech sources
FACT: Simultaneous speech sources differ along multiple
dimensions Differences along dimensions have to be
resolved Values on all dimensions have to be correctly
associated with a given source

DEFINITION OF SEGREGATION: Two simultaneous sounds that differ along two dimensions are segregated when (1) the differences along both dimensions can be resolved and (2) the correct values of each dimension are associated with either sound
Thus, if Speaker “A” utters “X” and Speaker “B” utters “Y” , saying that “AX”“BY”
indicates segregation, but “AY”“BX” does not

f0 lo
F hi
f0 lo
F low
(Interval 1) (Interval 2)
Stimulus:
Response:
f0 hi
F low
f0hi
F hi
“High f0 pitch’s formant went
from low to high”Correct
f0 lo : low pitch; f0 hi: high pitch
F
: high formant ;Fhi
Right :low formant
Dimensions: pitch and (unique) formant peak frequency

THREE CARDINAL DIMENSIONS OF THE AUDITORY SCENE: “WHAT” “WHEN” “WHERE”

THREE CARDINAL DIMENSIONS OF THE AUDITORY SCENE:
“WHAT” “WHEN”
“WHERE”
0OAzimuth
0O Elevation
Frequency (Hz)
400 500 600
Am
plit
ude
700
RandomMasker(P = PMSK)
or
150 ms 150 ms
Signal (P = PSIG)
300 ms
mS
mM
(Subject’s own HRTFs)
F (spectral region)
f0 (pitch)

Normalized temporal structure difference units
Normalized spectral difference units
Normalizedspatial difference
units
1
3
3
32
1
2
1
2
Segregation thresholds
Segregation
(d'=3)
Fusion
(d'=1)
ExperimentalAudiology
ResearchVAMartinez CA
(t)
()
(f)

THREE CARDINAL DIMENSIONS OF THE AUDITORY SCENE: “WHAT” “WHEN” “WHERE”
Outside the “WHAT”/ “WHEN”/ “WHERE” space:
SEGREGATIONInside the “WHAT”/ “WHEN”/ “WHERE space: FUSIONBetween the “WHAT”/ “WHEN”/ “WHERE
dimensions: TRADE-OFF

TRADE-OFF:The Heisenberg-Gabor principle
f t = k
extended: f t = k or f t [(1-ft )(1-f )(1-t )]
-1 = k

Are the three dimensions orthogonal?
Why is orthogonality (or correlation) important?
Can we determine the correlation between the dimensions?
Questions:

f0 lo
Left
f0 lo
Right
(Interval 1) (Interval 2)
Stimulus:
Response:
f0 hi
Right
f0hi
Left
“High f0 pitch went from
Right to Left”: Correct
f0 lo : low pitch; f0 hi: high pitch
: left of midline;Left
Right :right of midline
Dimensions: pitch and azimuth

Hypothesis:
1D resolution in “informational noise” is a prerequisite for segregation, where “informational noise” could be:
Informational noise:
• Pitch: many f0’s each with many components (same location and flat envelope)
• Location: many locations (same spectrum/pitch and flat envelope)
• Envelope structure: random pattern of bursts (same spectrum/pitch and location)
1. Informational masking within one dimension between streams2. Interference of information between dimensions
Goal:
Compare thresholds obtained for different dimensions

0.01 0.10 1.00f0/f0 (Hz)
0
5
10
15
20S
/N a
t Th r
e sho
ld (
d B)
S3S2S1
SUBJECT
Pitch diff. (3-comp. signals)
Informational maskers

Spectrum < 1 kHz
S3S2S1
SUBJECT
10 100Azimuth (deg)
0
7
14
21
28
35S
/N a
t Th r
e sho
ld (
d B)
Azimuth diff. (multicomp. signals)
Informational maskers

Rhythmic pattern (3-comp. signal)
Informational maskers
0 4 8 12Weighted AM-Depth S/N (dB)
5
7
9
11
13
15S
/N a
t Th r
e sho
ld (
d B)
S3S2S1
SUBJECT
Diff. rhythmic patterns (3-comp. signals)

Finding: because the masking functions are (quasi-) linear in log, i.e.,
b log D constant ,informational masking in 1D resolution seems to obey the power law
Db = C
• Use b obtained from 1D informational masking results to transform 2D thresholds D into informational masking S/N thresholds in dB

2D segregation on dimensions D1, D2 can be predicted from one-dimensional observations through the trade-off
D1 D2 = k
or
b1 log D1 = log k – b2 log D2
Since
b log D constant ,
and informational masking in 1D resolution approximately obeys the power law
Db = C ,
b1 b2

Spectrum < 1 kHz
Azimuth vs. rhythm in 1D (predicted)
7 8 9 10 11 12 131-D INFO MASKING FOR TEMP FLUCT (dB)
50
60
70
801-
D I
NF
O M
AS
KIN
G F
OR
AZ
IMU
TH
RE
SO
L (d
B)
S3S2S1
SUBJECT

Spectrum 1<2.5 kHz
5 10 15 201-D INFO MASKING FOR f0/f0 RESOL
0
10
20
30
401-
D I
NF
O M
AS
KIN
G F
OR
AZ
IM R
ES
OL
(dB
)
S3S2S1
SUBJECT
Azimuth vs. frequency in 1D (predicted)

Frequency vs. rhythm in 1D (predicted)
7 8 9 10 11 12 131-D INFO MASKING FOR TEMP FLUCT (dB)
0
5
10
151-
D I
NF
O M
AS
KIN
G F
OR
f0/
f 0 R
ESO
L
S3S2S1
SUBJECT

Now let’s see real 2D segregation data
• First use x/x scales for both dimensions
• Then show the same data with both scales transformed to dB as indicated by the 1D informational masking data

Spectrum < 2.4 kHz
Azimuth vs. Pitch (rhythm same)
3 4 5 6 7 8 9 102D Pitch Segreg. Info. Masking (dB)
10
15
20
25
30
2D A
zim
u th
Se g
reg .
Inf
o. M
ask i
n g (
dB)
s3s2s1
SUBJECT
0.1 1.0f0/f0 (Pitch)
10
100
Azi
mut
h S
egre
g . T
hres
h . (
deg )
s3s2s1
SUBJECT

Rhythm vs. Spectrum/Pitch (azimuth same)
2D INFO. MASK. FOR SPECTR./PITCH SEGREG. (dB)
Average fmod = 4.375 Hz
0.1 0.2 0.3 0.4 0.5 0.6 0.7 0.8SPECTR/PITCH f/f
0
1
2
3
4
5
6
TE
MP.
FLU
CT .
SE
GR
EG
. T
HR
ES
H.
(dB
)
S3S2S1
SUBJECT
10 12 14 16 18 2010
20
30
40
50
60
70
2D I
NF
O.
MA
SK
. F
OR
RH
YT
HM
SE
GR
EG
. (d
B)
S3S2S1
SUBJECT

Spectrum < 2.4 kHz
Azimuth vs. rhythm (pitch/spectrum same)
5 6 7 8 9 10TEMP FLUCT. FOR SEGREGATION (dB)
10
100
AZ
IMU
TH
TH
RE
SH
. F
OR
SE
GR
EG
. (D
EG
)
S3S2S1
SUBJECT
4 5 6 7 8 9 10 11TEMP FLUCT. FOR SEGREGATION (dB)
0
10
20
30
40
INF
O.
MA
SK
. T
HR
ES
H.
FO
R A
ZIM
. S
EG
RE
G.
(dB
)
S3S2S1
SUBJECT
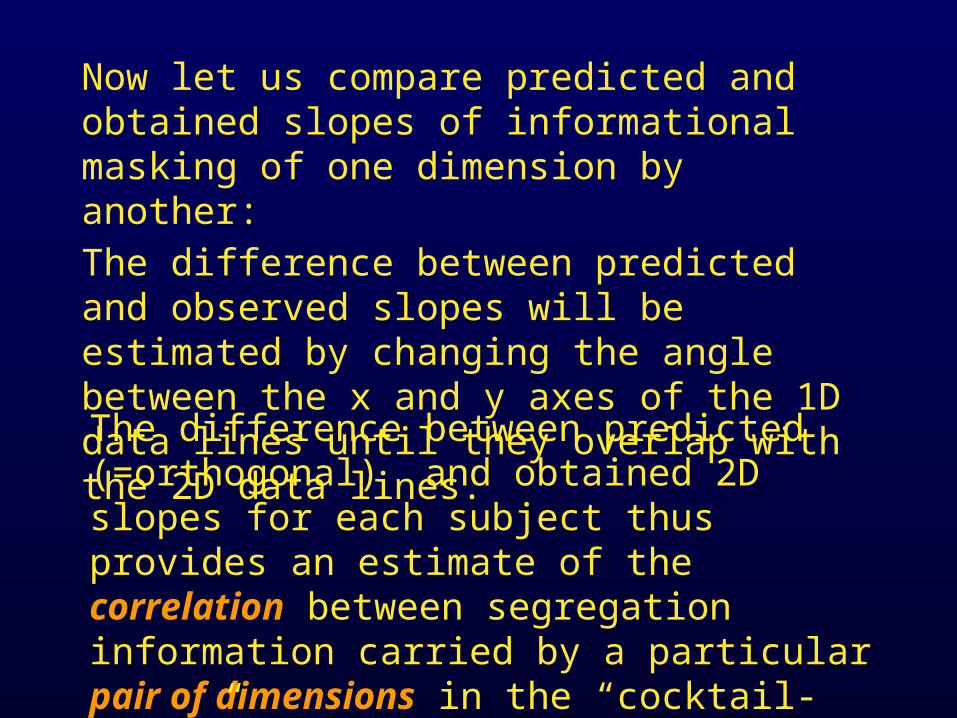
Now let us compare predicted and obtained slopes of informational masking of one dimension by another:
The difference between predicted and observed slopes will be estimated by changing the angle between the x and y axes of the 1D data lines until they overlap with the 2D data lines.
The difference between predicted (=orthogonal) and obtained 2D slopes for each subject thus provides an estimate of the correlation between segregation information carried by a particular pair of dimensions in the “cocktail-party” effect for that subject

Spectrum < 2.4 kHz
pred./orth.
1-D INFO MASKING FOR AZIM RESOL (dB)
obs.=0.220
=0.152
=0.003
5 10 15 201-D INFO MASKING FORf0/f0RESOL
0
10
20
30
40
S3S2S1
SUBJECT
Azimuth vs. Pitch (spectrum and rhythm same)

6 7 8 9 10 11 12 131-D INFO MASKING FOR TEMP FLUCT (dB)
40
50
60
70
80
1-D
IN
FO
MA
SK
ING
FO
R A
ZIM
UT
H R
ES
OL
(dB
)
S3S2S1
SUBJECT
S3S2S1
SUBJECT
Spectrum <1kHz
obs.
pred./orth.
=0.217
=0.017
=0.251
Azimuth vs. rhythm (pitch and spectrum same)

=0.307
=0.340=0.053
pred./orth.
obs.
5 7 9 11 13 151-D INFO MASKING FOR TEMP FLUCT (dB)
0
20
40
60
1-D
IN
FO
MA
SK
ING
FO
R f
0/f 0
RES
OL
S3S2S1
SUBJECT
S3S2S1
SUBJECT
Spectrum/Pitch vs. Rhythm (location same)
Spectrum 1< kHz
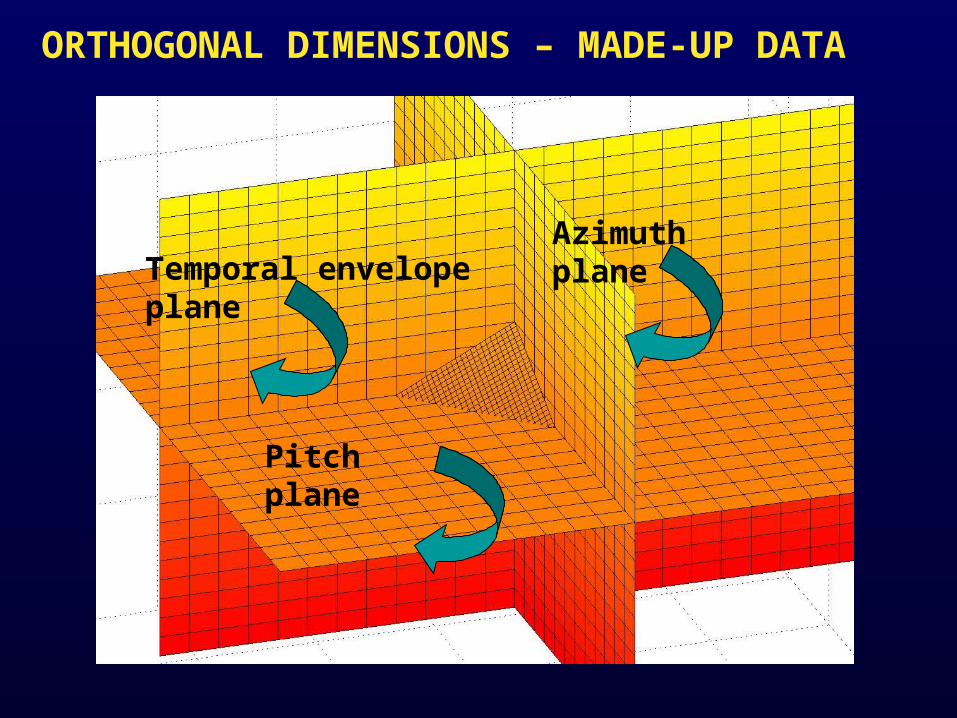
ORTHOGONAL DIMENSIONS – MADE-UP DATA
Temporal envelope plane
Pitch plane
Azimuth plane

Pitch plane
Temporal envelope plane
Azimuth plane
SUBJECT 1

Azimuth plane
Temporal envelope plane
Pitch plane
SUBJECT 2

Azimuth planeTemporal envelope plane
Pitch plane
SUBJECT 3

• By and large, segregation cues provided by the three cardinal dimensions are not independent
• To segregate two streams, listeners will obtain cues from whatever dimension yields them the most easily
Conclusions
• Non-optimal choice of cues leads to interference between streams and between dimensions
• Segregation is likely to be helped by highlighting streams rather than by aiding the processing of a given dimension

The End
(can you segregate these?)