Embed Size (px)
Citation preview
A Micro-Sized Ornithopter Design
Final Report
16.622
Fall 2001
Author: Emily Craparo
Advisor: Steven Hall Partner: Ben Ingram
12/11/2001
2
Contents
1. Introduction…………………………………………………………………………………….5
1.1 Motivation…………………………………………………………………………….5
1.2 Background and Previous Work……………………………………………………...5
2. Project Objectives……………………………………………………………………………...6
3. Technical Approach……………………………………………………………………………6
3.1 Overview………………………………………………………………………..……6
3.2 Wing Design……………………………………………………………………….…7
3.3 Wing Construction and Verification……………………………………………...…10
3.4 Wing Performance Evaluation………………………………………………………14
4. Testing and Analysis………………………………………………………………………….14
4.1 Experimental Setup………………………………………………………………….14
4.2 Testing Conditions…………………………………………………………………..16
5. Results………………………………………………………………………………….……..16
6. Discussion…………………………………………………………………………………….19
6.1 Unexpected Results - Propeller Moment…………………………………………....19
6.2 Error Analysis…………………………………………………………………….…21
7. Conclusions……………………………………………………………………………..….…22
7.1 Summary………………………………………………………………………...22
7.2 Future Work……………………………………………………………….…….22
8. References…………………………………………………………………………………….23
Appendix A: Details of Experimental Setup…………………………………………………….24
Appendix B: Full Results……………………………………………………………………..….28
Appendix C: Detailed Error Analysis……………………………………………………………34
3
List of Figures
1. Sectioned wing……………………………………………………………………….…………8
2. Custom airfoil based on NACA 0012 and E168………………………………………………..8
3. Final wing design, including double spar and fiberglass reinforcements.………….…………10
4. Spar construction technique……………………………..………………………...…………..11
5. Large sheets of balsa and foam were bonded together…..…….…………….……….……….12
6. Airfoil sections were cut using a CNC mill.……………………………………………….….12
7. A space for the spar was drilled into the foam………………………………………………...12
8. A completed wing….………………………………………………………..………………...13
9. Verification of torsional stiffness of spar……………………………………………………...13
10. Schematic diagram of experimental setup…………………………………………………...15
11. A wing mounted on the propeller balance..………………………………………………….15
12. Static test results……………………………………..……………..…………………..……16
13. Results of 10 mph wind tunnel test……...…………………………………………………...17
14. Hysteresis in motor voltage and angular velocity…...……………………………………….18
15. Propeller moment.……………………………………………………………...…………….19
16. Actual thrust and predicted thrust, with and without propeller moment………….....………20
17. Twist angle instability……..…………………………………………………………………21
4
Abstract
There are many potential advantages to flapping flight, including increased propulsive
efficiency, maneuverability, and stealth compared to fixed-wing aircraft. Ornithopters may be
particularly well suited to use as micro air vehicles (MAVs), which are used by the military to
fulfill covert surveillance missions. Recent theoretical work concerning minimum induced loss
suggests that ornithopters may be able to reach a propulsive efficiency of 85% [2,4]. This project
used the results of that work to design an ornithopter wing capable of deforming aeroelastically
into an efficient shape. The wing was constructed in three person hours at a cost of about $10 per
unit, and the wing’s quasi-steady performance was evaluated in a wind tunnel. Specifically,
thrust and efficiency were measured over a range of wind speeds and flapping frequencies using
a propeller balance. It was found that although the wing was capable of producing the thrust
required for a small MAV and achieved an efficiency of 80%, the effect of propeller moment had
not been accounted for and produced unexpected effects. Thus, this project proved the feasibility
of aeroelastically deforming ornithopter wings while identifying a crucial area for further
improvement.
5
1 Introduction
1.1 Motivation
In theory, ornithopters represent a promising alternative to conventional propeller-driven
vehicles. Based on observations of birds, researchers assert that ornithopters are capable of
operating with superior maneuverability compared to fixed-wing vehicles and can be made to
hover more easily than conventional aircraft [1]. The propulsive efficiency of flapping flight has
been shown to meet and possibly even exceed that of more traditional means of propulsion [2],
and because small ornithopters can be designed to look like birds, they are more stealthy than
conventional vehicles. These qualities make ornithopters particularly well suited for use as micro
air vehicles (MAVs), which are typically deployed to fulfill covert surveillance missions.
Unfortunately, the mechanical and aerodynamic complexities inherent in ornithopter design and
fabrication have thus far caused most man-made ornithopters to be only moderately successful
[1]. Nevertheless, the possible advantages in maneuverability, efficiency, and stealth that
ornithopters may offer to MAV missions and other applications justify continued research in this
area.
1.2 Background and previous work
The study of ornithopters is very old. As demonstrated by art and literature, fascination with
flapping flight it one of the oldest human characteristics. Some of the first earnest attempts at
ornithopter design were made by Leonardo da Vinci around 1490 [3]. In 1870, a combustion-
powered ornithopter was successfully flown by Gustav Trouvé, and a variety of successful
ornithopters have been designed and built since then [3]. Significant work has been done at the
University of Toronto, where James DeLaurier and his students have built an assortment of
successful ornithopters and have recently designed a manned ornithopter [3]. Potentially valuable
6
theoretical work concerning minimum induced loss has also recently been done by Hall, Hall and
Yang [2, 4], but has not yet been utilized in ornithopter design. This work indicates that
ornithopters should be able to achieve a maximum efficiency of about 85%, a feat that no
ornithopter has been able to achieve in the past [2].
2 Project Objectives
This project addressed a crucial issue in MAV ornithopter design – namely, the design and
construction of a micro-sized ornithopter wing capable of deforming aeroelastically into an
efficient shape. Specifically, the objectives of the project were to design a micro-sized
ornithopter wing based on previously derived optimal circulation distributions [1, 2], to construct
this design, and to test its performance in a wind tunnel. Measurements of thrust and propulsive
efficiency were taken at various advance ratios and flapping frequencies, and the propulsive
efficiency of the wings was compared with predictions made by the minimum induced loss
theoretical models used during the design of the wing. Because the wings were small, this project
also addressed the challenges inherent in micro-sized wing design, such as material selection and
fabrication techniques.
3 Technical Approach
3.1 Overview
This project consisted of three major phases: wing design, construction, and evaluation.
During the design phase, recent theoretical work involving minimum induced loss was utilized to
design a high-efficiency wing. Next, during the construction phase, an iterative process of
fabrication and verification took place in order to ensure that the wing behaved according to
design predictions. Verification was achieved through measurement of the torsional stiffness of
7
the wing and the thrust it produced in static tests. Finally, during the evaluation phase, the wing
was spun on a propeller balance in order to simulate flapping. Tests were run in MIT’s Wright
Brothers Wind Tunnel, and the wing’s efficiency and thrust were measured.
3.2 Wing Design
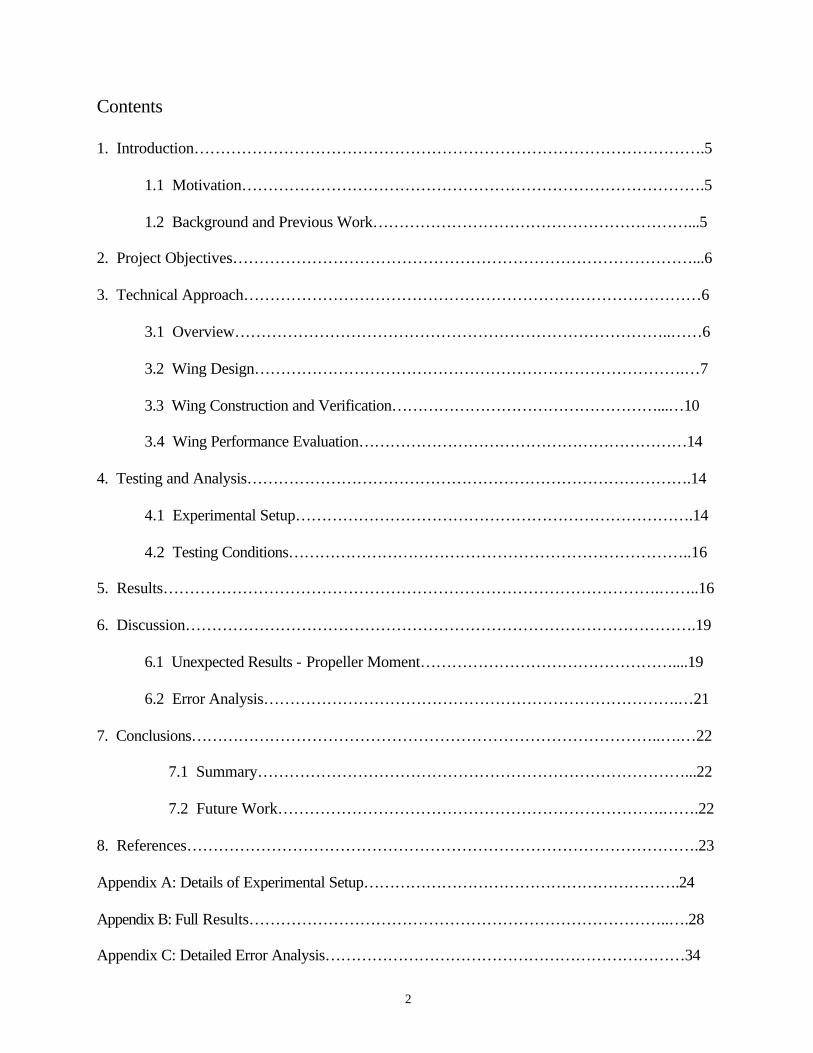
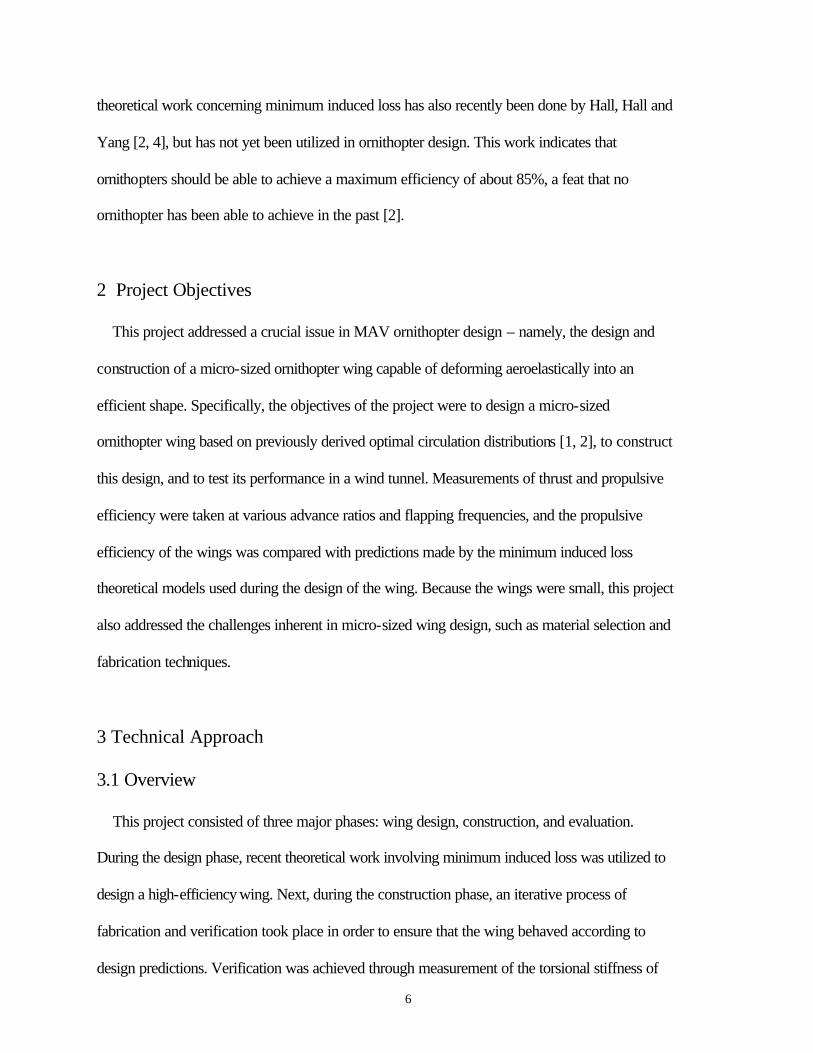
The first step in wing design was the selection of the overall layout of the wing. In order to
twist appropriately during flight, the wing had to be designed to have a combination of high
bending stiffness and low torsional stiffness. To achieve this combination, the sectioned wing
design shown in Figure 1 was chosen. In this configuration, twelve independently rotating foam
sections are attached to a central spar via balsa ribs. There are several benefits to this structural
configuration. Because the sections do not come into contact with the spar, they do not
contribute to the overall torsional stiffness of the wing. The sections aren’t required to twist, so
the troublesome effects of wrinkled skin that plague most other aeroelastic wings are not present.
A wing of this configuration is also significantly easier to construct at a small scale than most
other types of wings, since it consists of a relatively small number parts whose interfaces are
straightforward. Finally, although this wing configuration differs significantly in appearance
from most others, it is actually quite similar aerodynamically. There is very little spanwise flow,
so discontinuities along the span of the wing present minimal aerodynamic problems [1].
8
Figure 1: A sectioned wing.
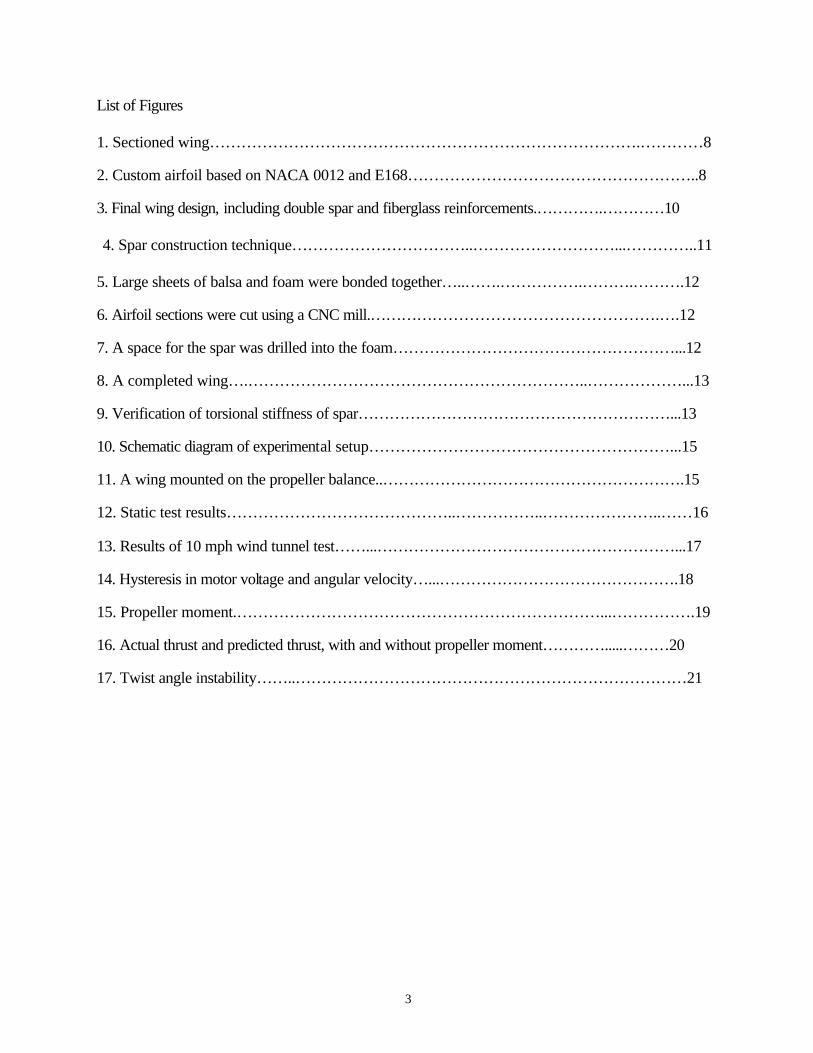
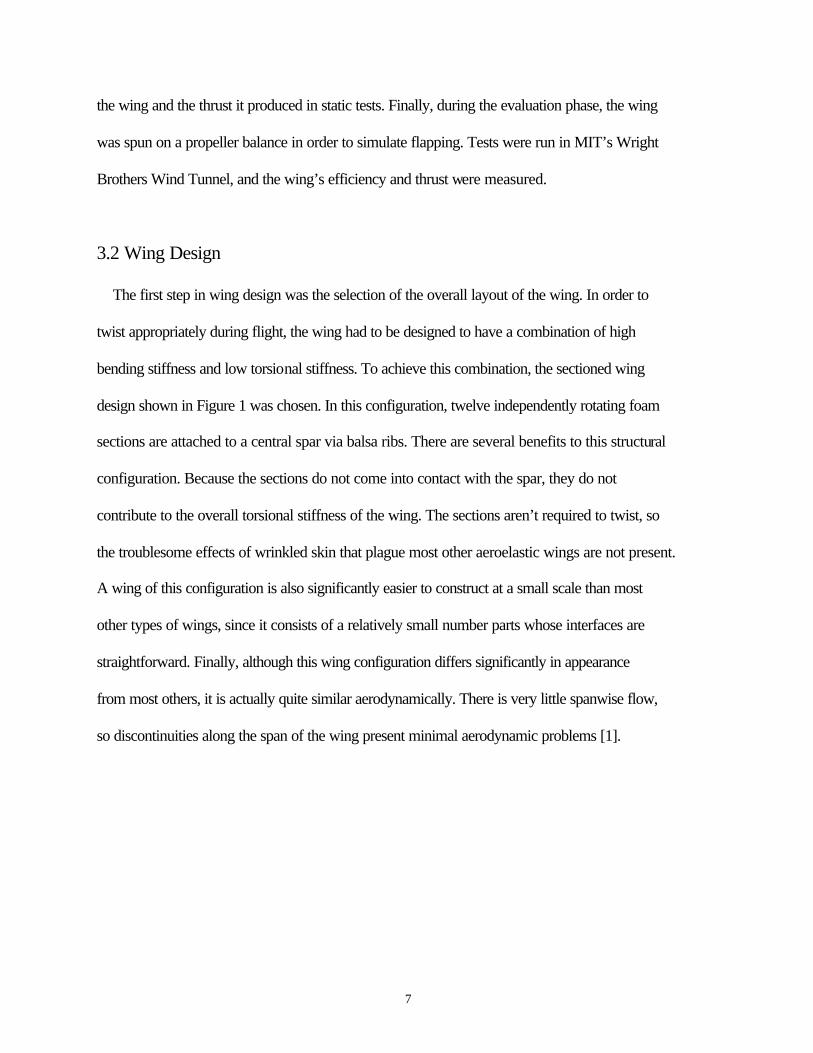
Once the overall structural layout of the wing was determined, the airfoil was selected. The
most appropriate airfoil for an ornithopter is one that is suitable for low Reynolds number flight
and is relatively insensitive to errors in angle of attack. In order to improve efficiency, a high lift
to drag ratio is favored. Finally, the selected airfoil should be thick enough to accommodate
torsionally compliant structural members while maintaining a maximum span of seven inches
and an aspect ratio of around four. A search was performed with these criteria in mind, and two
possible candidate airfoils emerged - the NACA 0012 and the E168 [3]. Each of these airfoils
was predicted to perform well over part of the target performance envelope, so in order to
capture some of the strengths of each, a composite airfoil was created. This blended airfoil is
shown in Figure 2.
6
Figure 2: Custom airfoil based on NACA 0012 and E168.
9
Next, the necessary stiffness distribution of the wing was determined. The first step in this
process was to use the results of a previously-derived vortex lattice code to calculate the wing’s
optimal circulation distribution [7]. This distribution, along with the airfoil’s sectional lift curve
data generated by XFOIL, was then used to calculate the moment distribution along the span,
∫ Γ=chord
dxxLyM ),()( (1)
where y is the spanwise coordinate and x is the chordwise coordinate, centered at the spar. The
required angle of attack distribution was then calculated by assuming a lift curve slope of 2π [8].
From these distributions the required torsional stiffness of the wing was calculated,
dydT
yMGJ
)(= (2)
where T is the angle of twist:
αω −⋅=∞
− )(tan 1
UxT (3)
To simplify wing construction, a typical section approach was used to calculate the best uniform
torsional stiffness for the wing.
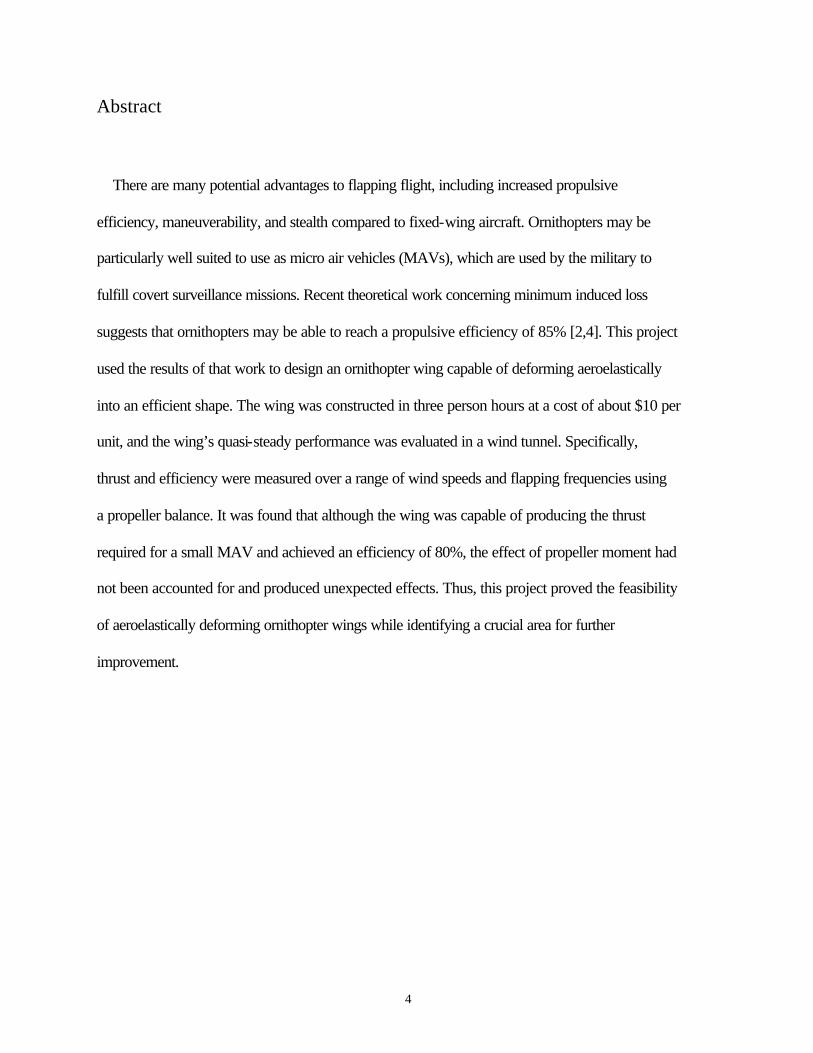
Finally, it remained to determine how this stiffness distribution was to be attained. Because the
foam sections contribute no torsional stiffness to the wing, all of the torsional stiffness must
come from the spar. The spar is also responsible for providing the wing's required high bending
stiffness. Thus, a good candidate spar would be a thin, open section with a high second moment
of area and a relatively simple and compact geometry to limit construction difficulties and ensure
compatibility with the thickness of the airfoil. Because it is difficult to construct a single spar
that is both stiff in bending and compliant in torsion, a nested pair of spars was used as shown in
Figure 3. In this configuration, wing sections are attached to a thin, open outer spar, while an
inner rod provides bending stiffness. Because the thin outer spar slides freely over the inner rod,
10
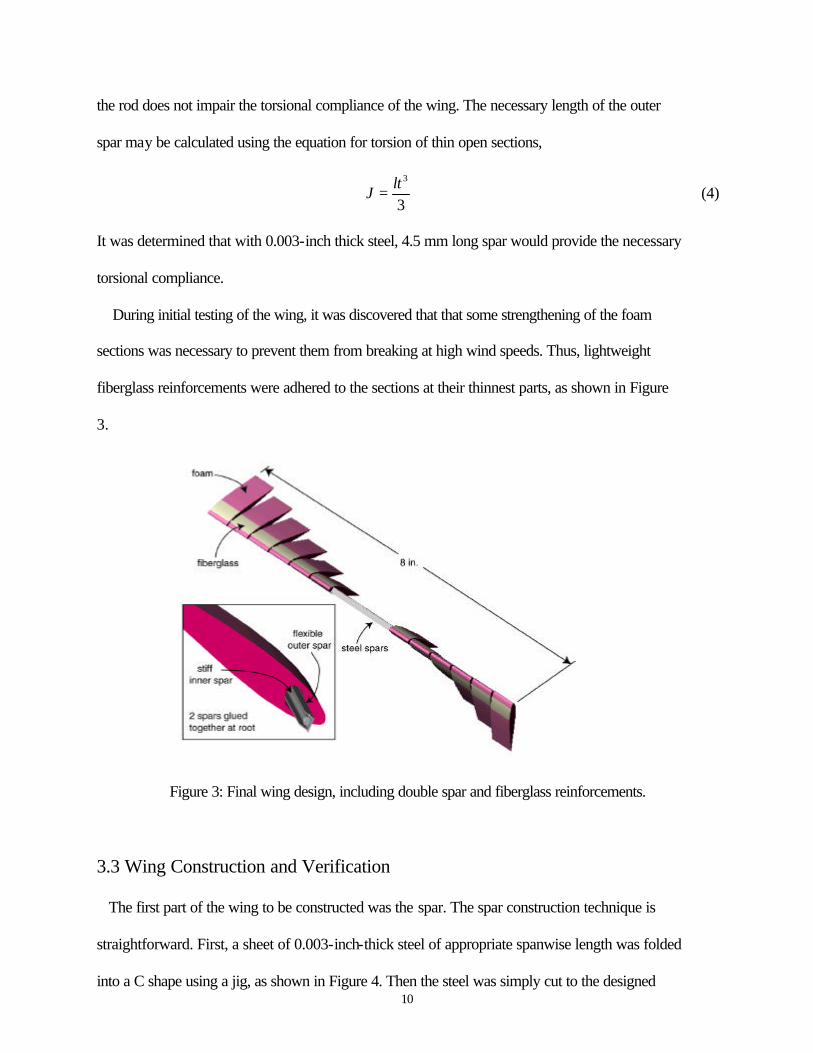
the rod does not impair the torsional compliance of the wing. The necessary length of the outer
spar may be calculated using the equation for torsion of thin open sections,
3
3ltJ = (4)
It was determined that with 0.003-inch thick steel, 4.5 mm long spar would provide the necessary
torsional compliance.
During initial testing of the wing, it was discovered that that some strengthening of the foam
sections was necessary to prevent them from breaking at high wind speeds. Thus, lightweight
fiberglass reinforcements were adhered to the sections at their thinnest parts, as shown in Figure
3.
Figure 3: Final wing design, including double spar and fiberglass reinforcements.
3.3 Wing Construction and Verification
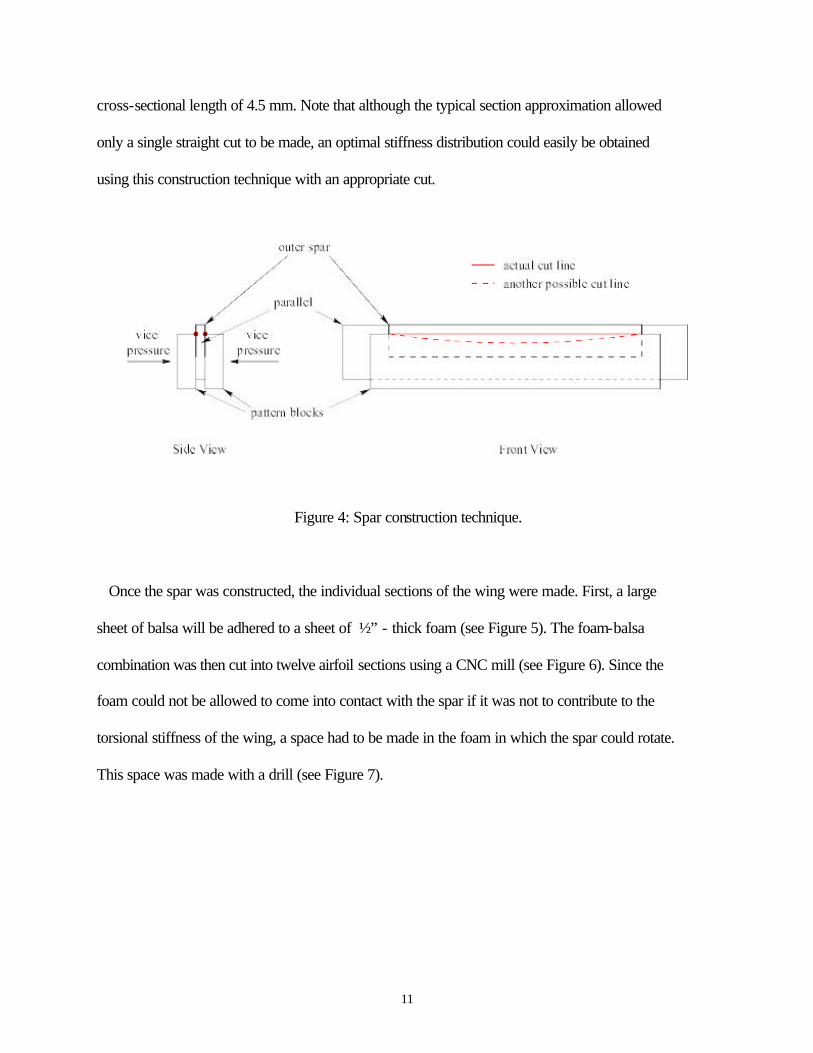
The first part of the wing to be constructed was the spar. The spar construction technique is
straightforward. First, a sheet of 0.003-inch-thick steel of appropriate spanwise length was folded
into a C shape using a jig, as shown in Figure 4. Then the steel was simply cut to the designed
11
cross-sectional length of 4.5 mm. Note that although the typical section approximation allowed
only a single straight cut to be made, an optimal stiffness distribution could easily be obtained
using this construction technique with an appropriate cut.
Figure 4: Spar construction technique.
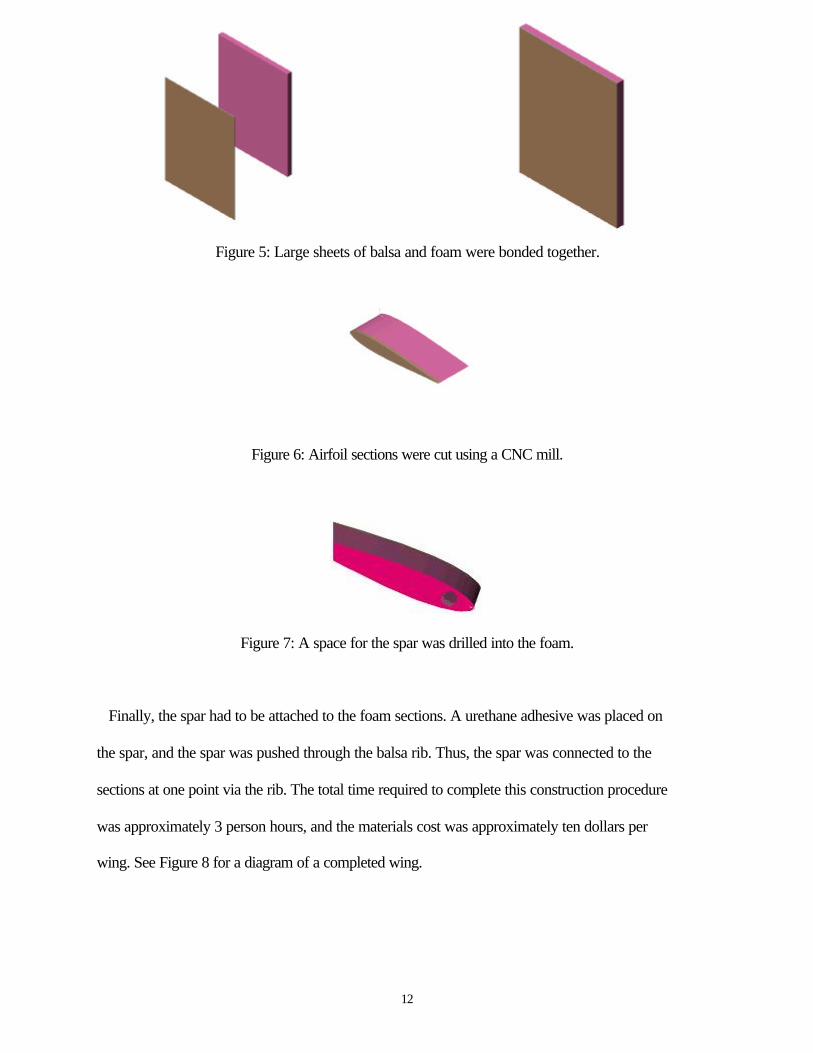
Once the spar was constructed, the individual sections of the wing were made. First, a large
sheet of balsa will be adhered to a sheet of ½” - thick foam (see Figure 5). The foam-balsa
combination was then cut into twelve airfoil sections using a CNC mill (see Figure 6). Since the
foam could not be allowed to come into contact with the spar if it was not to contribute to the
torsional stiffness of the wing, a space had to be made in the foam in which the spar could rotate.
This space was made with a drill (see Figure 7).
12
Figure 5: Large sheets of balsa and foam were bonded together.
9
Figure 6: Airfoil sections were cut using a CNC mill.
Figure 7: A space for the spar was drilled into the foam.
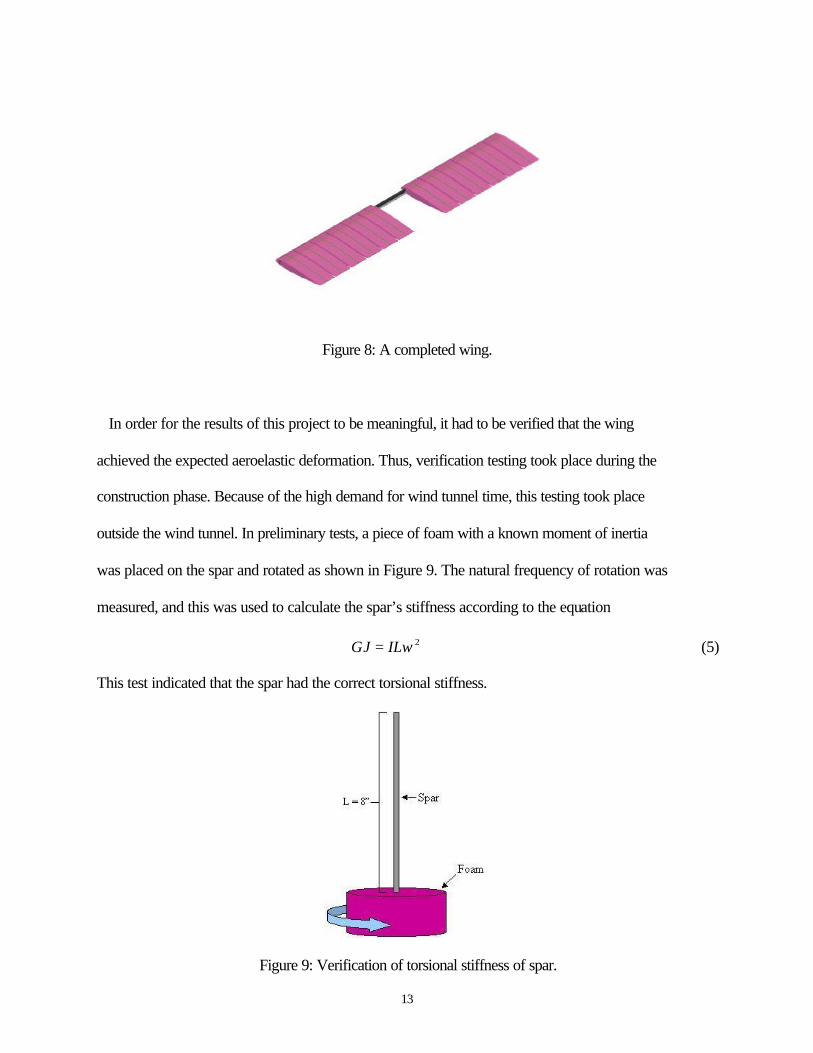
Finally, the spar had to be attached to the foam sections. A urethane adhesive was placed on
the spar, and the spar was pushed through the balsa rib. Thus, the spar was connected to the
sections at one point via the rib. The total time required to complete this construction procedure
was approximately 3 person hours, and the materials cost was approximately ten dollars per
wing. See Figure 8 for a diagram of a completed wing.
13
Figure 8: A completed wing.
In order for the results of this project to be meaningful, it had to be verified that the wing
achieved the expected aeroelastic deformation. Thus, verification testing took place during the
construction phase. Because of the high demand for wind tunnel time, this testing took place
outside the wind tunnel. In preliminary tests, a piece of foam with a known moment of inertia
was placed on the spar and rotated as shown in Figure 9. The natural frequency of rotation was
measured, and this was used to calculate the spar’s stiffness according to the equation
2ωILGJ = (5)
This test indicated that the spar had the correct torsional stiffness.
Figure 9: Verification of torsional stiffness of spar.
14
3.4 Wing Performance Evaluation The propulsive efficiency of the wing is the ratio of the useful thrust power produced by the
wing to the mechanical power put into it. Power produced by the wing is the product of the thrust
produced and the velocity of flow in the wind tunnel. Power put into the wing is the product of
the torque and angular velocity of the motor. Thus, thrust, torque, flow velocity, and angular
velocity were measured.
4 Testing and Analysis
4.1 Experimental Setup
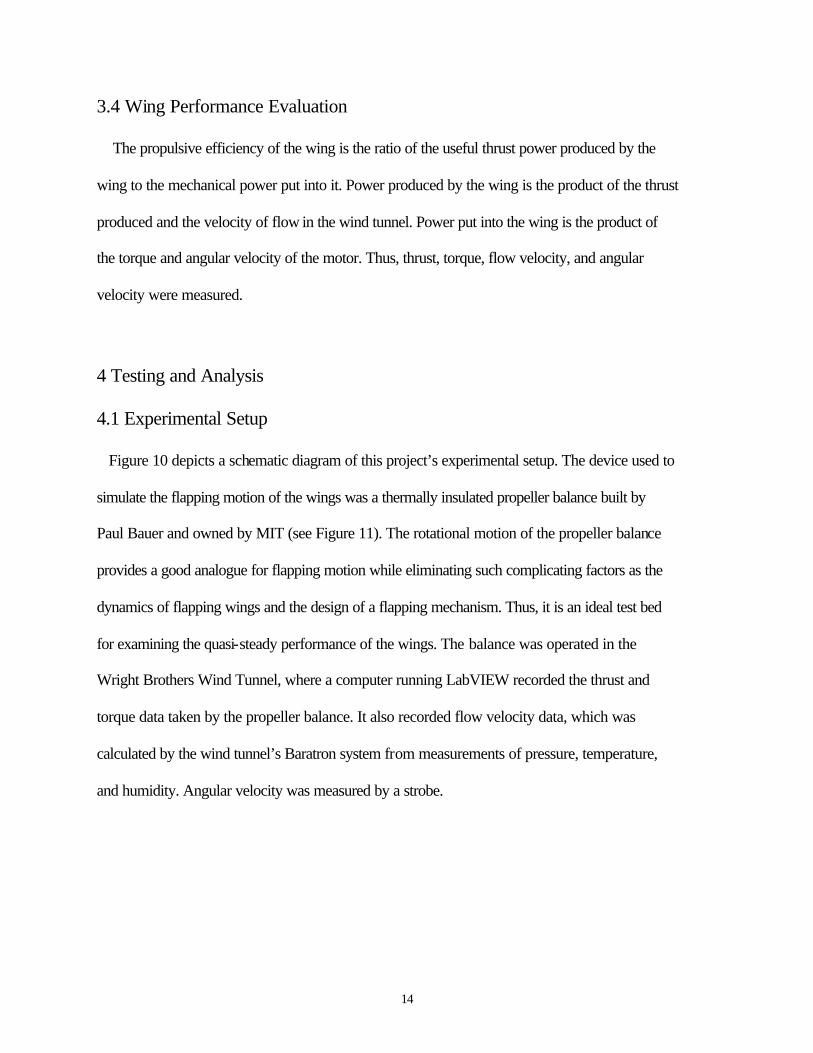
Figure 10 depicts a schematic diagram of this project’s experimental setup. The device used to
simulate the flapping motion of the wings was a thermally insulated propeller balance built by
Paul Bauer and owned by MIT (see Figure 11). The rotational motion of the propeller balance
provides a good analogue for flapping motion while eliminating such complicating factors as the
dynamics of flapping wings and the design of a flapping mechanism. Thus, it is an ideal test bed
for examining the quasi-steady performance of the wings. The balance was operated in the
Wright Brothers Wind Tunnel, where a computer running LabVIEW recorded the thrust and
torque data taken by the propeller balance. It also recorded flow velocity data, which was
calculated by the wind tunnel’s Baratron system from measurements of pressure, temperature,
and humidity. Angular velocity was measured by a strobe.
15
Figure 10: Schematic diagram of experimental setup.
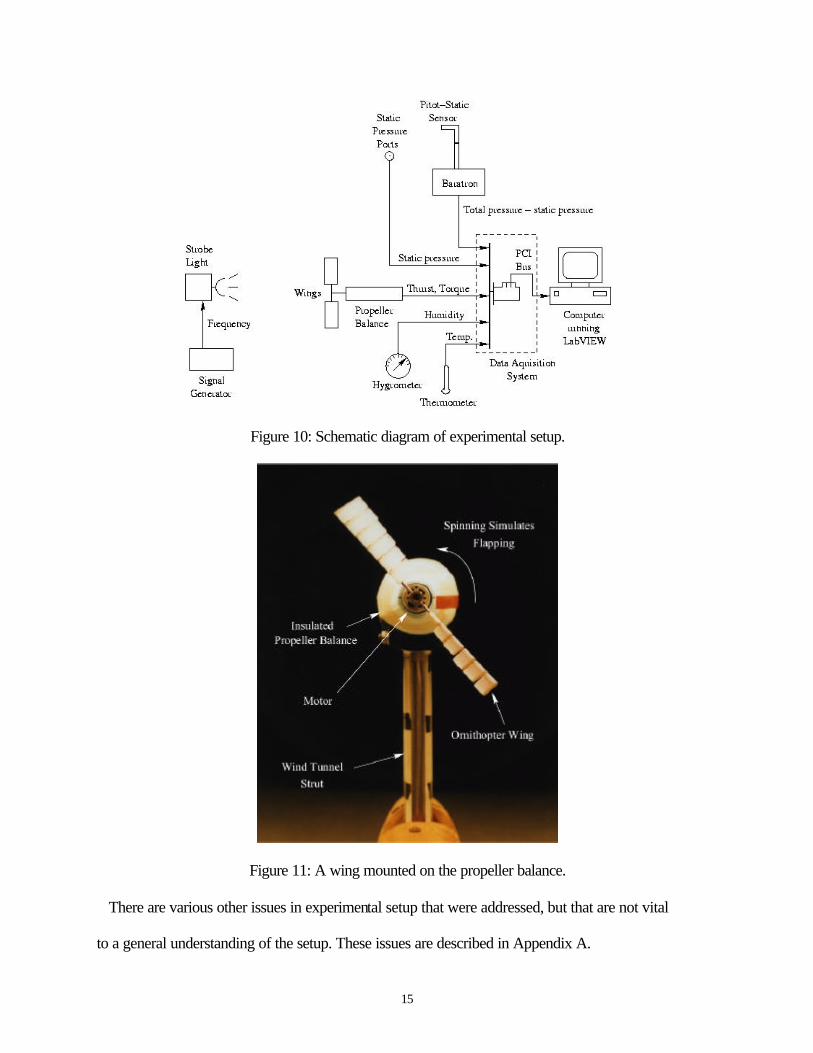
Figure 11: A wing mounted on the propeller balance.
There are various other issues in experimental setup that were addressed, but that are not vital
to a general understanding of the setup. These issues are described in Appendix A.
16
4.2 Testing Conditions
The test matrix for the wing performance characterization portion of this project called for the
wing to be operated under a wide range of conditions. In order to determine both the maximum
efficiency of the wing and the manner in which efficiency degrades under non-optimal
conditions, it was proposed that the wing be spun at angular velocities ranging from zero to twice
its design frequency of 60 Hz (377 rad/sec) and at forward velocities ranging from zero to twice
the calculated advance ratio for maximum efficiency, corresponding to wind speed was to range
from zero to 45 mph.
5 Results
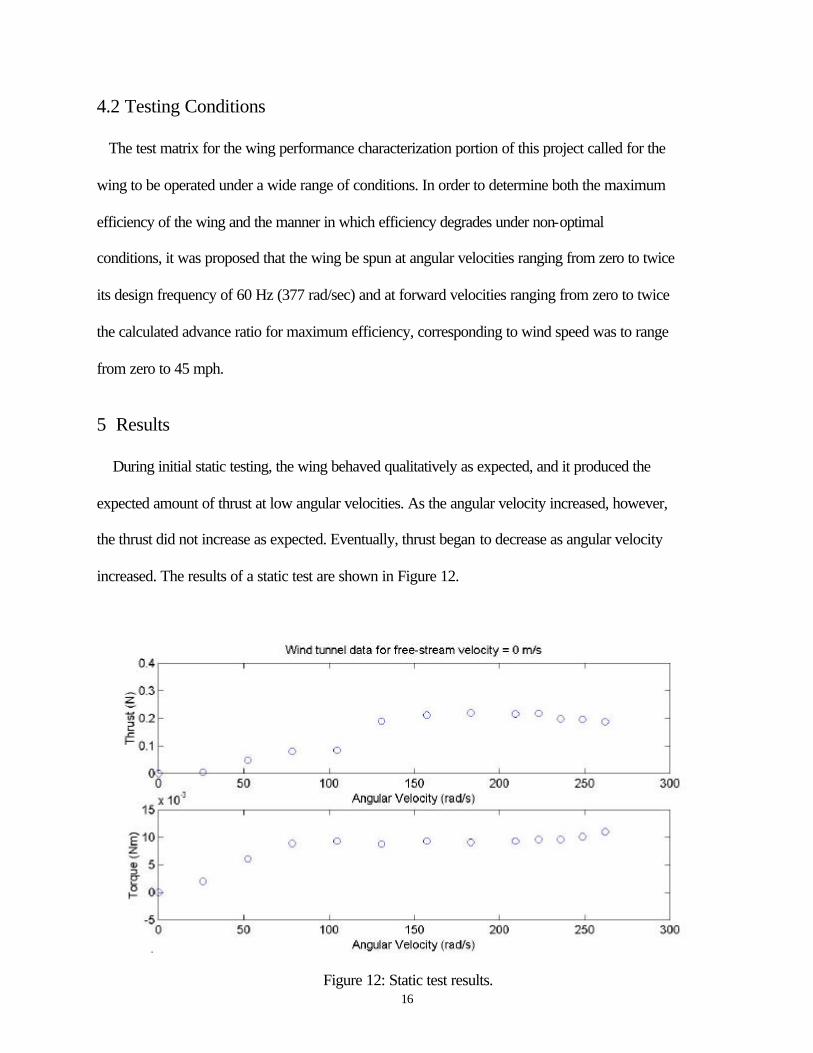
During initial static testing, the wing behaved qualitatively as expected, and it produced the
expected amount of thrust at low angular velocities. As the angular velocity increased, however,
the thrust did not increase as expected. Eventually, thrust began to decrease as angular velocity
increased. The results of a static test are shown in Figure 12.
Figure 12: Static test results.
17
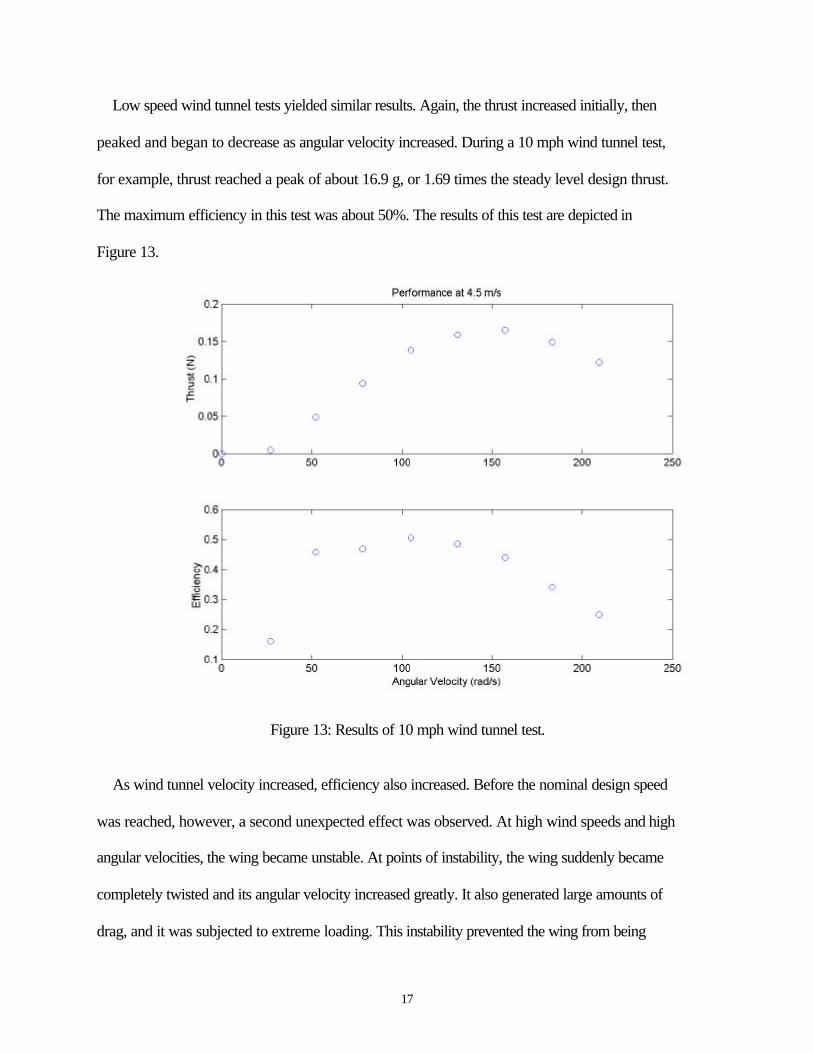
Low speed wind tunnel tests yielded similar results. Again, the thrust increased initially, then
peaked and began to decrease as angular velocity increased. During a 10 mph wind tunnel test,
for example, thrust reached a peak of about 16.9 g, or 1.69 times the steady level design thrust.
The maximum efficiency in this test was about 50%. The results of this test are depicted in
Figure 13.
Figure 13: Results of 10 mph wind tunnel test.
As wind tunnel velocity increased, efficiency also increased. Before the nominal design speed
was reached, however, a second unexpected effect was observed. At high wind speeds and high
angular velocities, the wing became unstable. At points of instability, the wing suddenly became
completely twisted and its angular velocity increased greatly. It also generated large amounts of
drag, and it was subjected to extreme loading. This instability prevented the wing from being
18
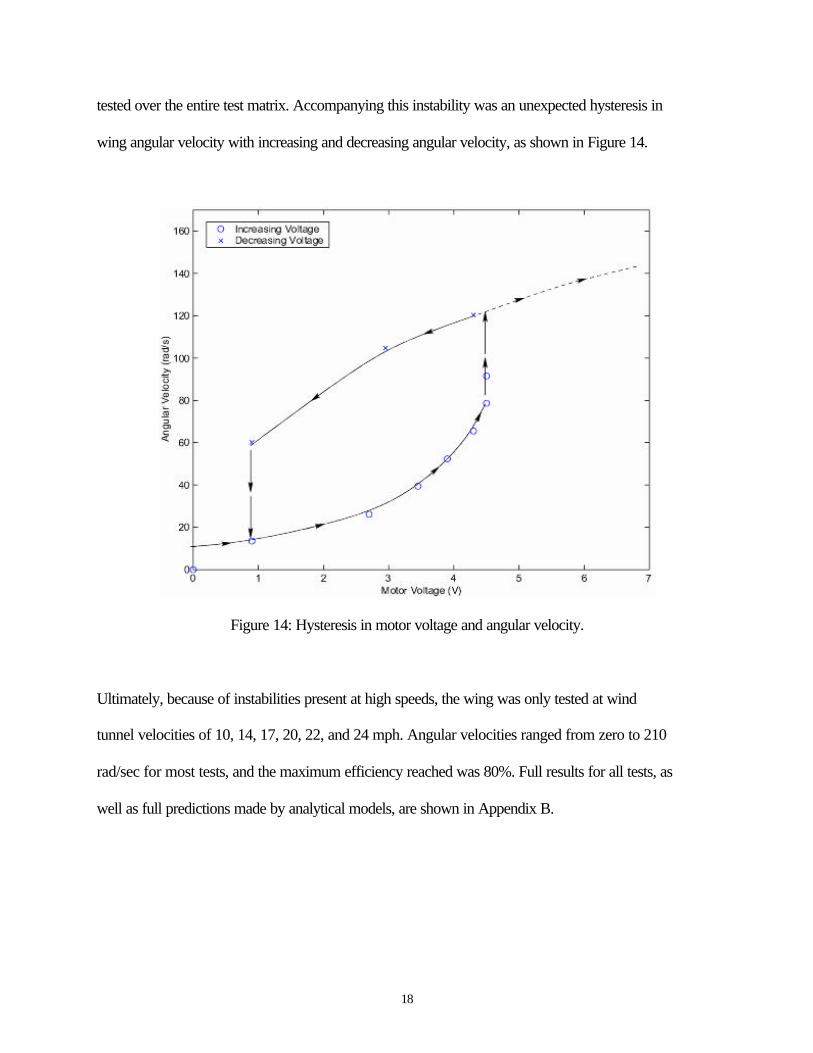
tested over the entire test matrix. Accompanying this instability was an unexpected hysteresis in
wing angular velocity with increasing and decreasing angular velocity, as shown in Figure 14.
Figure 14: Hysteresis in motor voltage and angular velocity.
Ultimately, because of instabilities present at high speeds, the wing was only tested at wind
tunnel velocities of 10, 14, 17, 20, 22, and 24 mph. Angular velocities ranged from zero to 210
rad/sec for most tests, and the maximum efficiency reached was 80%. Full results for all tests, as
well as full predictions made by analytical models, are shown in Appendix B.
19
6 Discussion
6.1 Unexpected Results - Propeller Moment
Although the maximum efficiency produced by the wing was comparable to that predicted by
the typical section model, its behavior was quite different. Namely, the model did not predict that
the wing’s thrust would ever decrease with increasing angular velocity, and it did not predict any
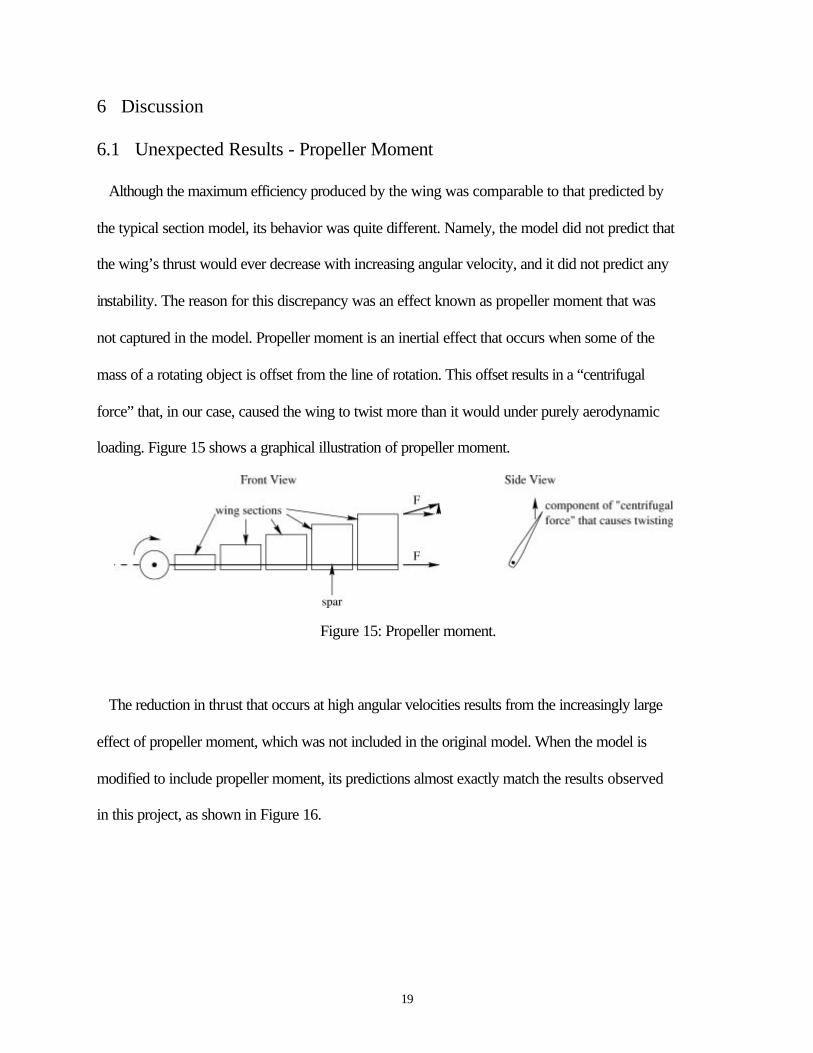
instability. The reason for this discrepancy was an effect known as propeller moment that was
not captured in the model. Propeller moment is an inertial effect that occurs when some of the
mass of a rotating object is offset from the line of rotation. This offset results in a “centrifugal
force” that, in our case, caused the wing to twist more than it would under purely aerodynamic
loading. Figure 15 shows a graphical illustration of propeller moment.
Figure 15: Propeller moment.
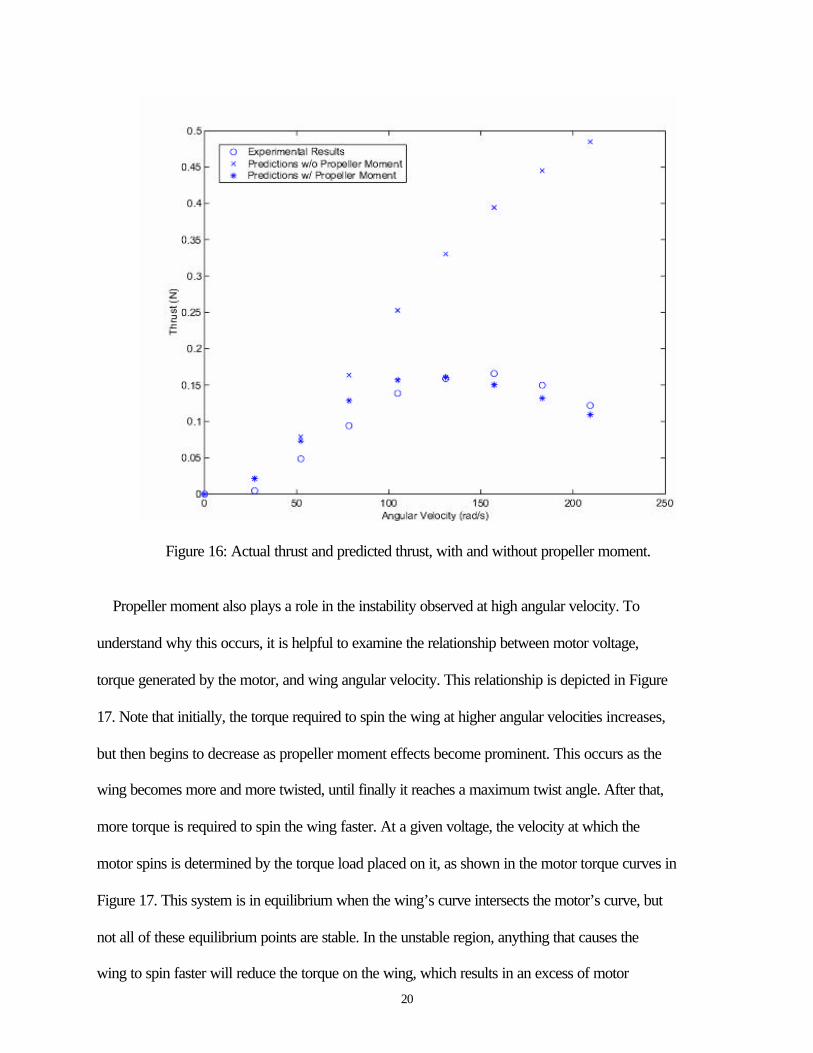
The reduction in thrust that occurs at high angular velocities results from the increasingly large
effect of propeller moment, which was not included in the original model. When the model is
modified to include propeller moment, its predictions almost exactly match the results observed
in this project, as shown in Figure 16.
20
Figure 16: Actual thrust and predicted thrust, with and without propeller moment.
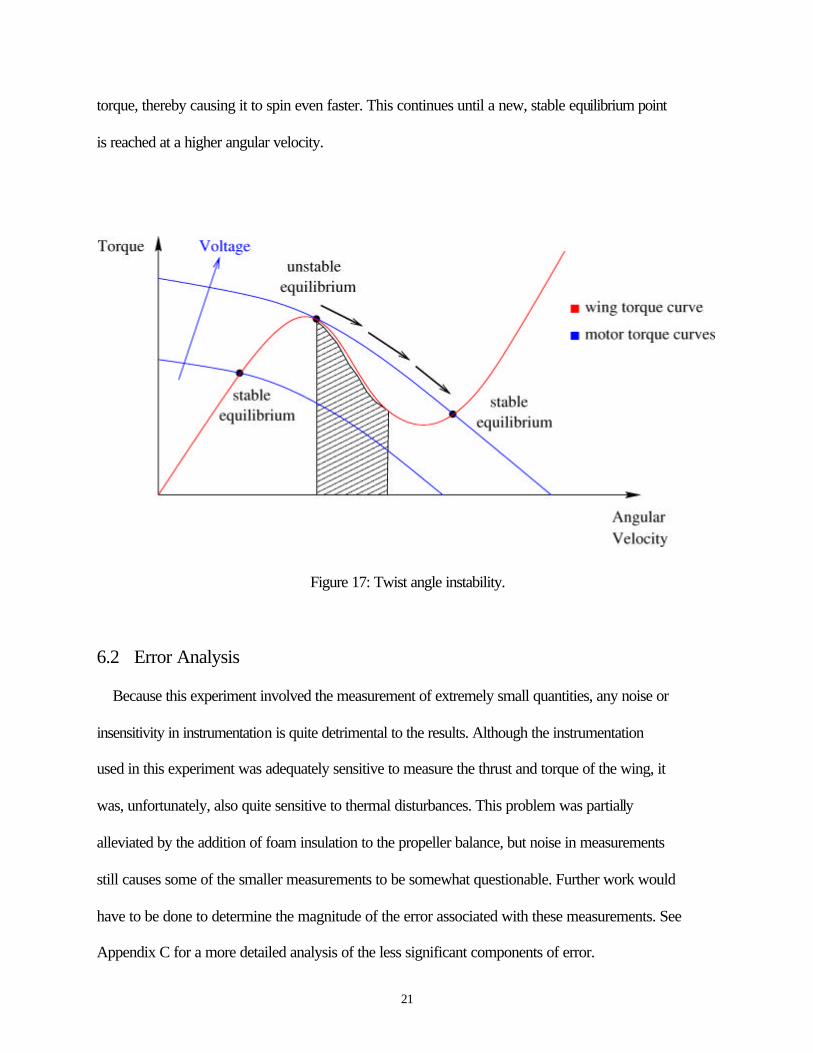
Propeller moment also plays a role in the instability observed at high angular velocity. To
understand why this occurs, it is helpful to examine the relationship between motor voltage,
torque generated by the motor, and wing angular velocity. This relationship is depicted in Figure
17. Note that initially, the torque required to spin the wing at higher angular velocities increases,
but then begins to decrease as propeller moment effects become prominent. This occurs as the
wing becomes more and more twisted, until finally it reaches a maximum twist angle. After that,
more torque is required to spin the wing faster. At a given voltage, the velocity at which the
motor spins is determined by the torque load placed on it, as shown in the motor torque curves in
Figure 17. This system is in equilibrium when the wing’s curve intersects the motor’s curve, but
not all of these equilibrium points are stable. In the unstable region, anything that causes the
wing to spin faster will reduce the torque on the wing, which results in an excess of motor
21
torque, thereby causing it to spin even faster. This continues until a new, stable equilibrium point
is reached at a higher angular velocity.
Figure 17: Twist angle instability.
6.2 Error Analysis Because this experiment involved the measurement of extremely small quantities, any noise or
insensitivity in instrumentation is quite detrimental to the results. Although the instrumentation
used in this experiment was adequately sensitive to measure the thrust and torque of the wing, it
was, unfortunately, also quite sensitive to thermal disturbances. This problem was partially
alleviated by the addition of foam insulation to the propeller balance, but noise in measurements
still causes some of the smaller measurements to be somewhat questionable. Further work would
have to be done to determine the magnitude of the error associated with these measurements. See
Appendix C for a more detailed analysis of the less significant components of error.
22
7 Conclusions
7.1 Summary Ornithopters represent a promising alternative to conventional propeller-driven aircraft
because of their potential for increased efficiency, maneuverability, and stealth. In particular,
ornithopter wings that deform aeroelastically into an efficient shape are quite effective, as well as
inexpensive and simple to construct. Specifically, a wing capable of producing enough thrust to
drive a small MAV ornithopter and operating with a propulsive efficiency of about 80% costs
about $10 in materials and takes 3 person hours to build. When designing this wing, however, it
is important to account for propeller moment, since this effect is prominent in the wing’s
performance.
7.2 Future Work
Many improvements and refinements may be made to both the design and experimentation
parts of this project. In the design phase, wing performance may be more accurately predicted if
propeller moment and three-dimensional aerodynamic effects are included in the model.
Additionally, higher efficiencies may be achieved if a spar with an optimal stiffness distribution
is used instead of one with uniform stiffness. Finally, the effects of propeller moment could be
partially alleviated if the cross-sectional moment of inertia of the wing were lowered. To
improve the experimental portion of the project, it would be desirable to eliminate the problems
caused when wing instability is encountered. This could be accomplished by using a speed-
controlled motor, and it would result in the ability to test the wing across a more complete test
matrix. Finally, to more accurately replicate the operating conditions of an ornithopter wing, it
would be beneficial to construct a flapping mechanism on which to test the wing. This would
23
allow the effects of wing dynamics to be examined, and it would address the challenges inherent
in the design and construction of a small, light flapping mechanism.
8 References
1. Hall, Steven. Personal Communication, 2/16/2001.
2. Hall, Kenneth C. and Hall, Steven R., “Minimum Induced Power Requirements for Flapping
Flight,” Journal of Fluid Mechanics, Vol. 323, 1996, pp. 285-315.
3. The Ornithopter Society, http://indev.hypermart.net/about1.html, What’s an Ornithopter,
4/13/2001.
4. Hall, S. R.; Yang, K. Y.; and Hall, K. C.; “Helicopter rotor lift distributions for minimum
induced power loss,” Journal of Aircraft, Vol. 31, 1994, pp. 837-845.
5. DeLaurier, J. D., “The Development of an Efficient Ornithopter Wing,” The Aeronautical
Journal of The Royal Aeronautical Society, May 1993, pp. 153-161.
6. DeLaurier, J. D., personal communication, March 2001.
7. Hall, K. C.; Pigott, S. A.; and Hall, R. C.; “Power Requirements for Large-Amplitude
Flapping Flight,” Journal of Aircraft, Vol. 35, No. 3, May-June 1998, pp. 359-360.
8. Hall, S., personal communication, March 2001.
9. Durgin, F., personal communication, March 2001.
10. Perdichizzi, R., personal communication, March 2001.
11. McMaster-Carr Supply Company, McMaster-Carr Catalog, 2000.
12. Sherrill, B. M., Lecture Notes for ISP205: Visions of the Universe,
http://111.nsci.msu.edu/~sherrill/isp205s1/12.html, 3/6/2001/
13. Clarke, J.-P., Measurement Systems,
http://web.mit.edu/16.621/www/MeasurementSystems.pdf, 3/8/2001.
24
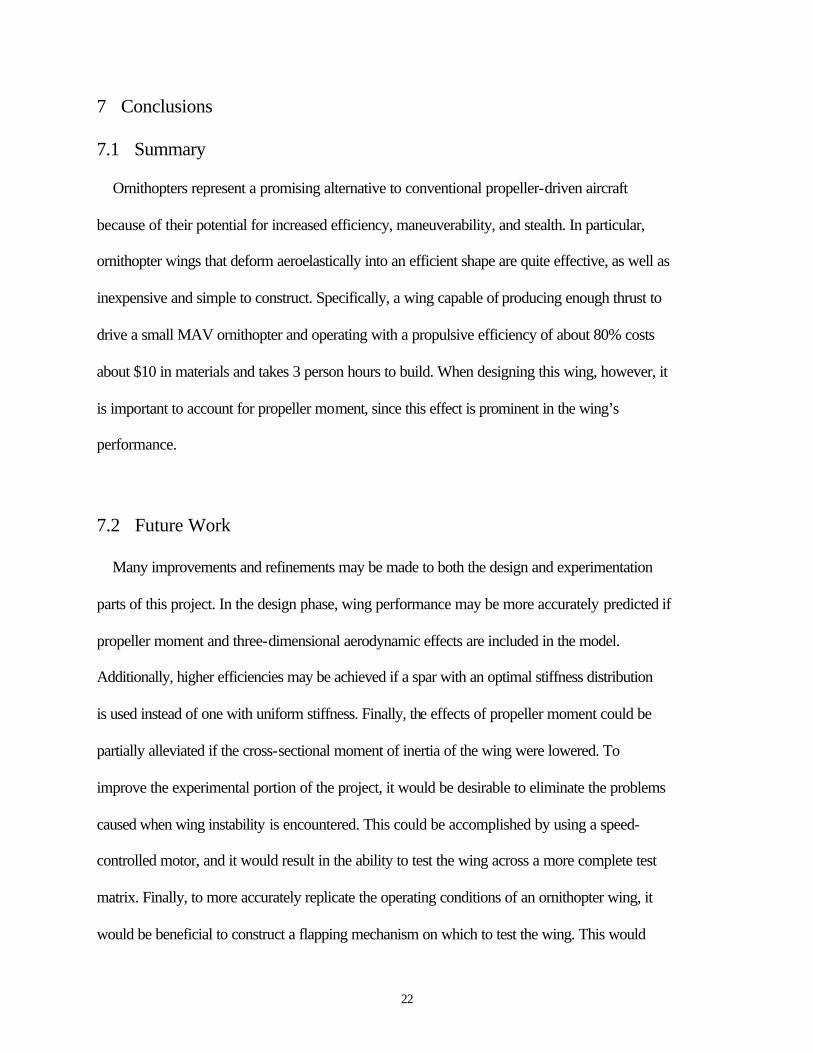
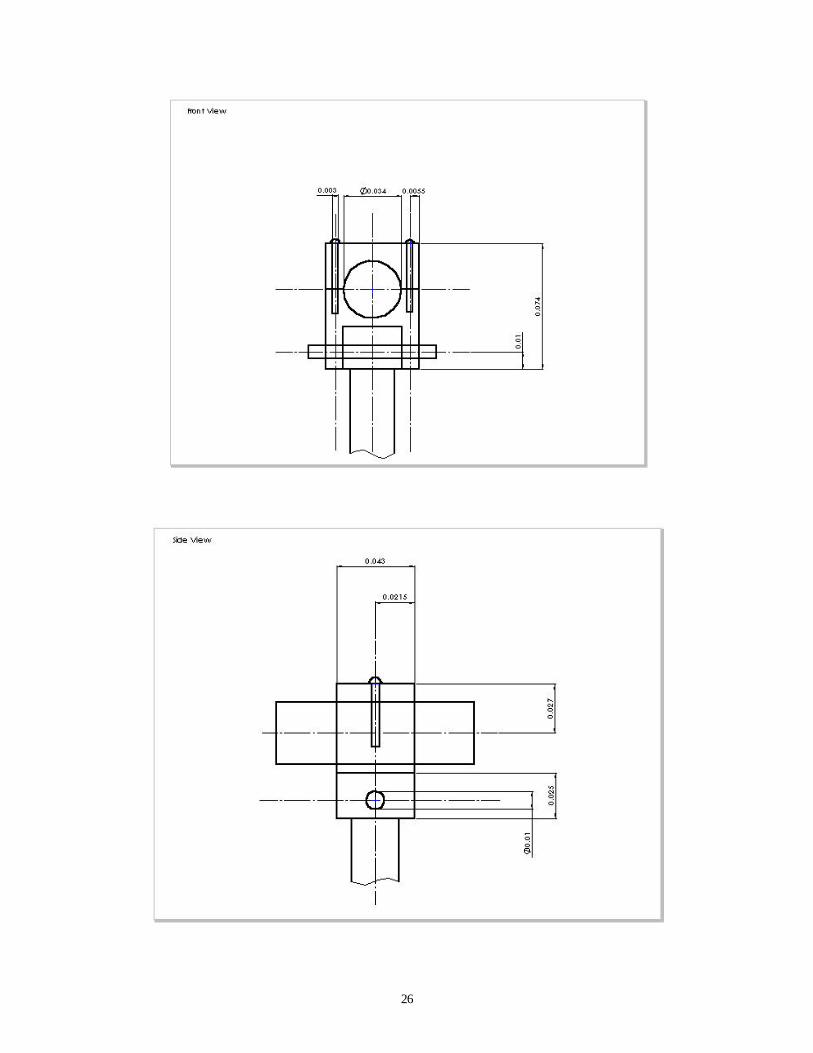
Appendix A: Details of Experimental Setup Various connections needed to be made in the experimental setup of this project, specifically
between the wing and motor, the motor and propeller balance, and the balance and the wind
tunnel.
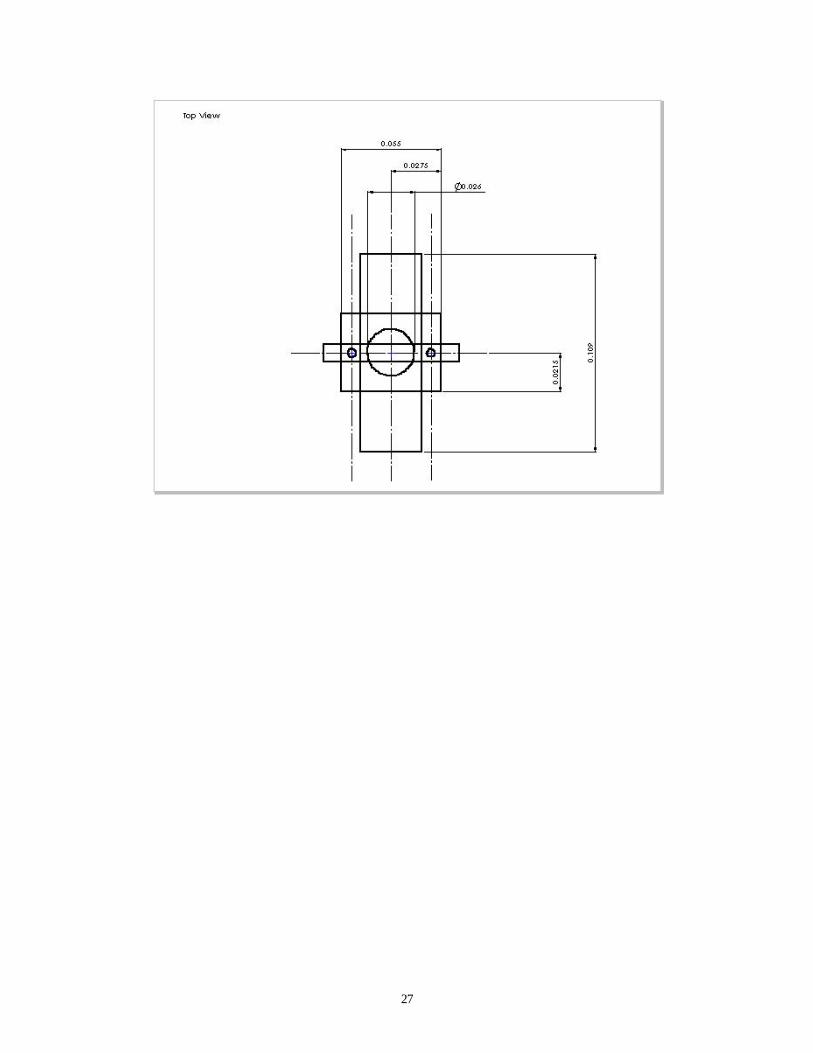
To connect the motor to the balance, a thin plate was used as illustrated (all dimensions are in
meters):
Top view
25
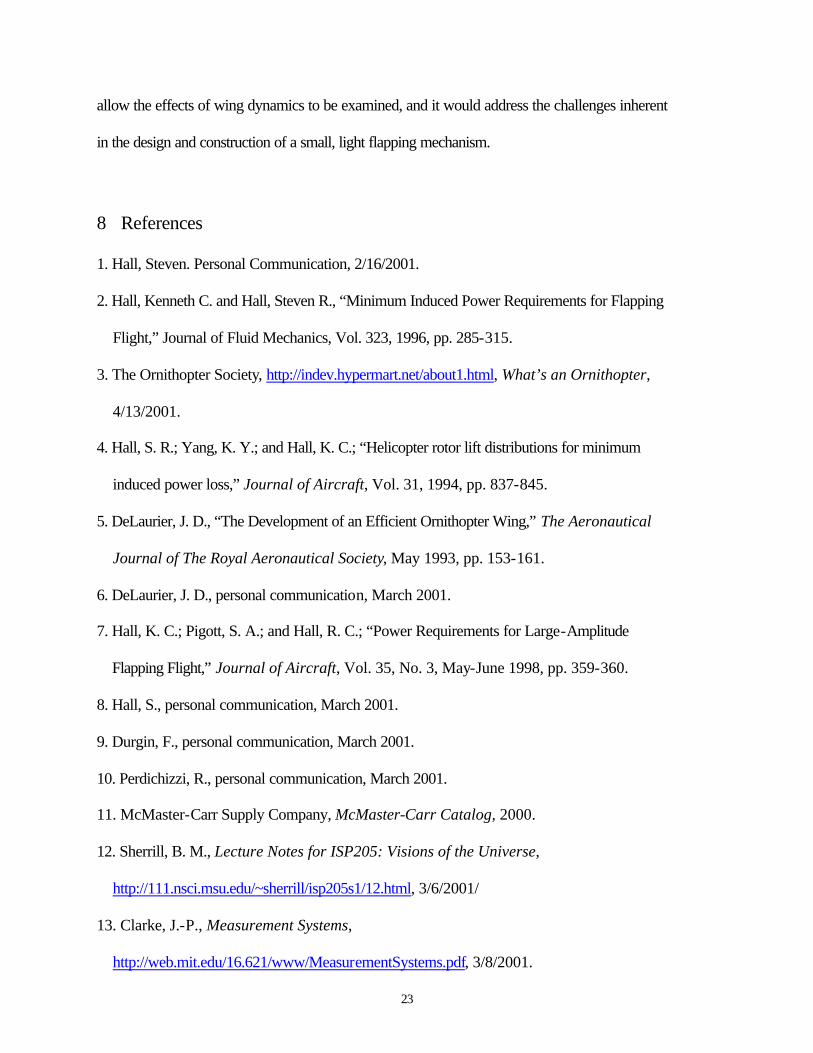
Front view
An aluminum block and a large bolt were used to connect the balance to the wind tunnel
fairing:
Aluminum
26
27
28
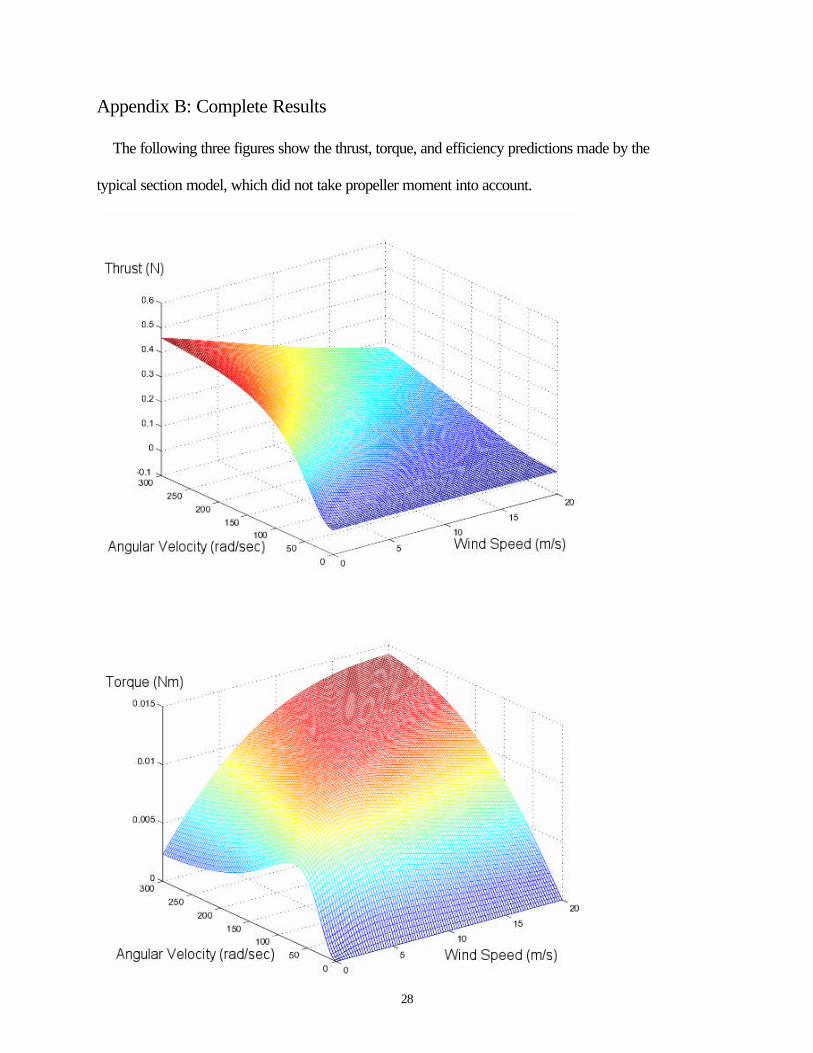
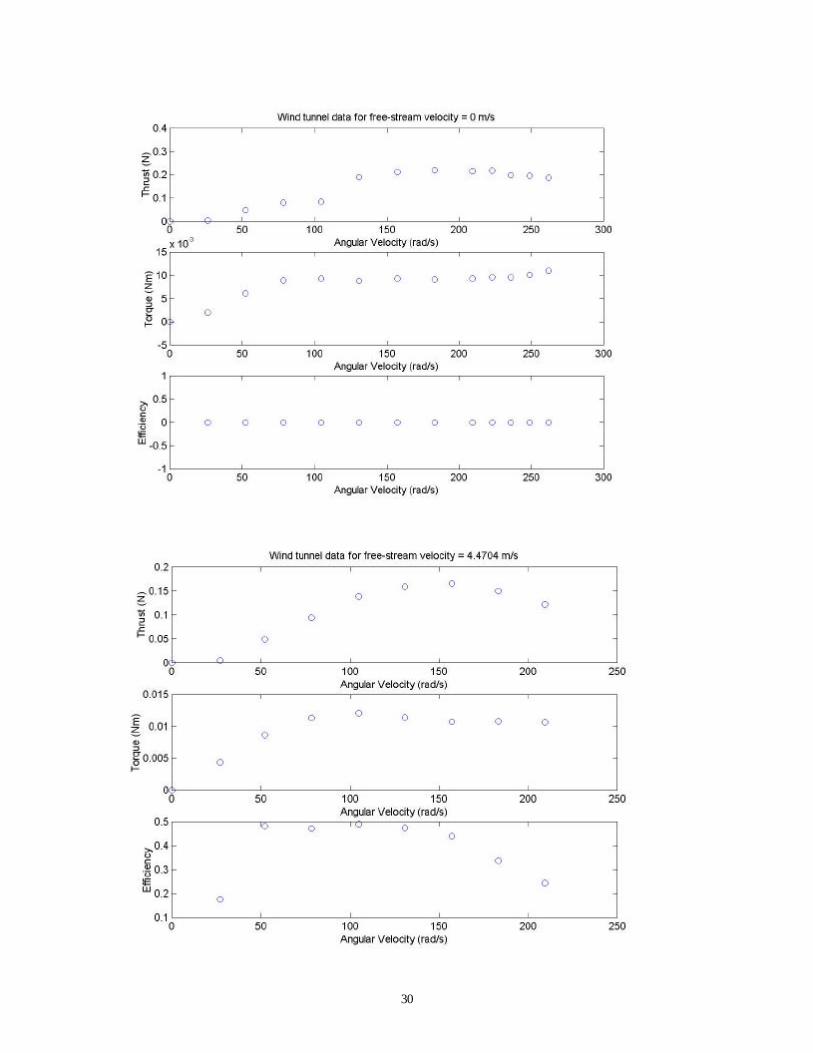
Appendix B: Complete Results
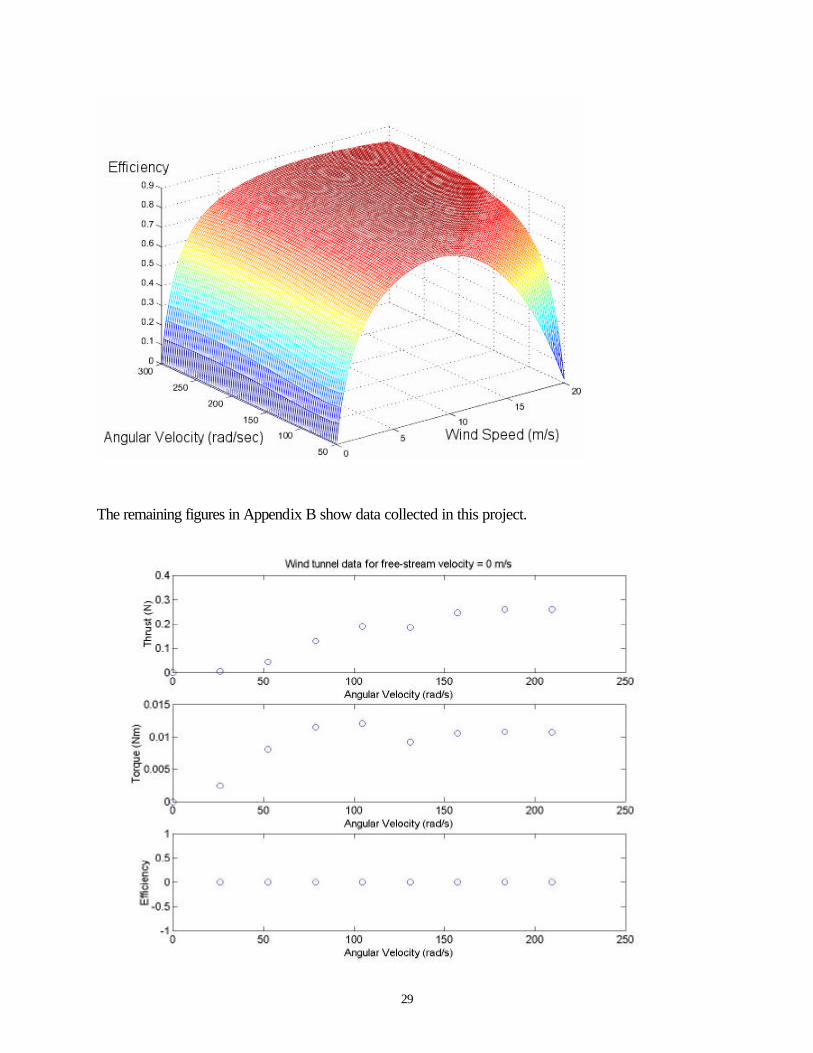
The following three figures show the thrust, torque, and efficiency predictions made by the
typical section model, which did not take propeller moment into account.
29
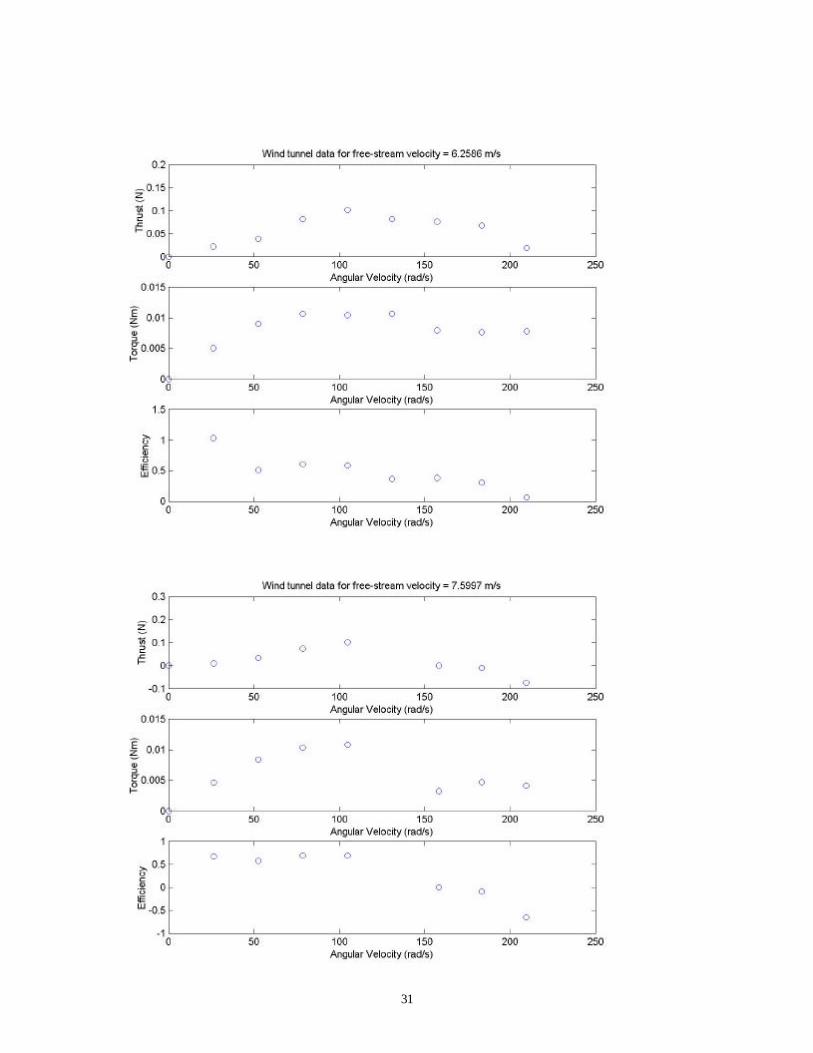
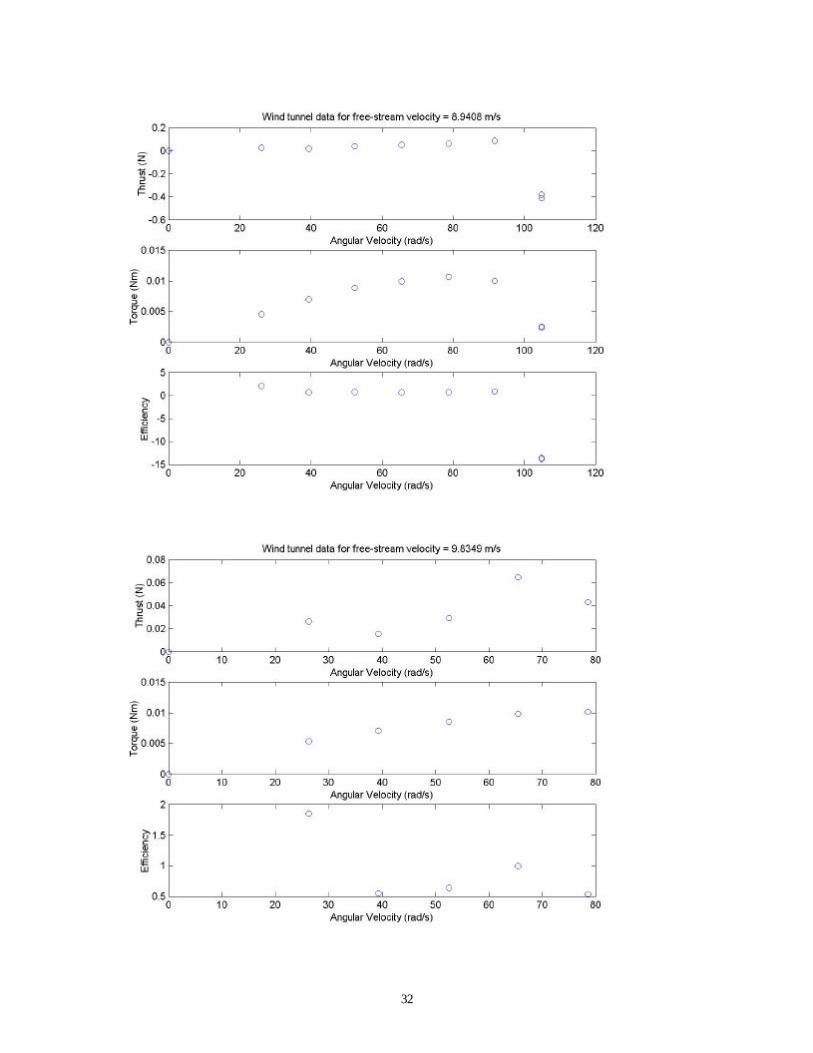
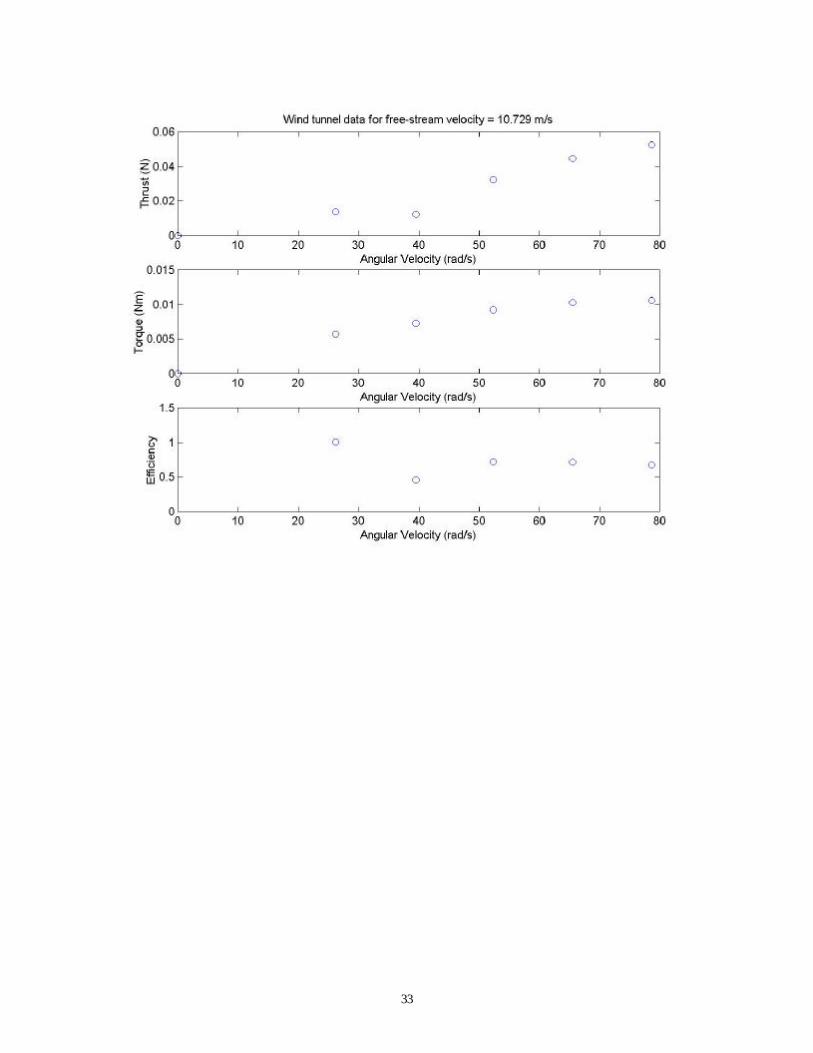
The remaining figures in Appendix B show data collected in this project.
30
31
32
33
34
Appendix C: Detailed Error Analysis
There are errors associated with the measuring devices that will be used to examine wing
performance. The velocity of the flow in the Wright Brothers Wind Tunnel is calculated by
applying compressible flow equations to measurements of temperature, absolute static pressure,
relative humidity, and the difference between total and static pressure. The most critical of these
quantities is the difference between total and static pressure, and the Baratron system used to
measure it is accurate to .12% of the reading [9, 10]. Thus, according to Bernoulli’s equation, the
maximum error in velocity measurement is approximately .1%. Based on strain gauge
specifications, the thrust and torque measurements given by the propeller balance have worst
case errors of .18% and .1%, respectively, and expected errors of .11% and .06% for the range of
values encompassed by this experiment [11]. Finally, the measurement of the angular velocity of
the motor, which is accomplished by using a strobe, carries with it an error due mainly to the
finite resolution of the human eye. This resolution of approximately 8 arc-minutes is good
enough to distinguish a variation in position of the wingtip of approximately 2.32 mm if an
observer is located 1 m away from the wing [12]. If the wing is about 10 cm long, this
corresponds to an error in angular velocity of
Eω = 2⋅π⋅f (0.00232/(2⋅π⋅0.1))
radians per second, or .4% of the total measurement.
Thus, by the product and quotient rules, one can calculate a maximum error of .80% in the
propulsive efficiency of the wings, with an expected error of .69% [13].


![株式会社ナノテック・システムズ|Golden Stradaシリーズ...Ja anese Paper e The Golden Ratios of Nano-sized Gold & Silver Micro Particles Mk-4EXTJ [2.0] 4 15612182](https://img.pdfslide.tips/doc/110x75/61006e2beb37f065d6676515/cffffffffioegolden-stradaff-ja.jpg)