Embed Size (px)
Citation preview

Physics Letters B 718 (2012) 43–55
Contents lists available at SciVerse ScienceDirect
Physics Letters B
www.elsevier.com/locate/physletb
A model-independent Dalitz plot analysis of B± → D K ± with D → K 0S h+h−
(h = π, K ) decays and constraints on the CKM angle γ ✩
.LHCb Collaboration
a r t i c l e i n f o a b s t r a c t
Article history:Received 27 September 2012Accepted 5 October 2012Available online 9 October 2012Editor: L. Rolandi
A binned Dalitz plot analysis of B± → D K ± decays, with D → K 0S π+π− and D → K 0
S K + K −, isperformed to measure the CP-violating observables x± and y± which are sensitive to the CKM angle γ .The analysis exploits 1.0 fb−1 of data collected by the LHCb experiment. The study makes no model-based assumption on the variation of the strong phase of the D decay amplitude over the Dalitz plot,but uses measurements of this quantity from CLEO-c as input. The values of the parameters are found tobe x− = (0.0 ± 4.3 ± 1.5 ± 0.6) × 10−2, y− = (2.7 ± 5.2 ± 0.8 ± 2.3) × 10−2, x+ = (−10.3 ± 4.5 ± 1.8 ±1.4) × 10−2 and y+ = (−0.9 ± 3.7 ± 0.8 ± 3.0) × 10−2. The first, second, and third uncertainties are thestatistical, the experimental systematic, and the error associated with the precision of the strong-phaseparameters measured at CLEO-c, respectively. These results correspond to γ = (44+43
−38)◦, with a second
solution at γ → γ + 180◦, and rB = 0.07 ± 0.04, where rB is the ratio between the suppressed andfavoured B decay amplitudes.
© 2012 CERN. Published by Elsevier B.V. All rights reserved.
1. Introduction
A precise determination of the Unitarity Triangle angle γ (alsodenoted as φ3), is an important goal in flavour physics. Measure-ments of this weak phase in tree-level processes involving the in-terference between b → cus and b → ucs transitions are expectedto be insensitive to new physics contributions, thereby providing aStandard Model benchmark against which other observables, morelikely to be affected by new physics, can be compared. A powerfulapproach for measuring γ is to study CP-violating observables inB± → D K ± decays, where D designates a neutral D meson recon-structed in a final state common to both D0 and D0 decays. Ex-amples of such final states include two-body modes, where LHCbhas already presented results [1], and self CP-conjugate three-bodydecays, such as K 0
S π+π− and K 0S K +K − , designated collectively as
K 0S h+h− .
The proposal to measure γ with B± → D K ± , D → K 0S h+h−
decays was first made in Refs. [2,3]. The strategy relies on com-paring the distribution of events in the D → K 0
S h+h− Dalitz plotfor B+ → D K + and B− → D K − decays. However, in order to de-termine γ it is necessary to know how the strong phase of theD decay varies over the Dalitz plot. One approach for solving thisproblem, adopted by BaBar [4–6] and Belle [7–9], is to use an am-plitude model fitted on flavour-tagged D → K 0
S h+h− decays to pro-vide this input. An attractive alternative [2,10,11] is to make use ofdirect measurements of the strong-phase behaviour in bins of the
✩ © CERN for the benefit of the LHCb Collaboration.
Dalitz plot, which can be obtained from quantum-correlated D Dpairs from ψ(3770) decays and that are available from CLEO-c [12],thereby avoiding the need to assign any model-related systematicuncertainty. A first model-independent analysis was recently pre-sented by Belle [13] using B± → D K ± , D → K 0
S π+π− decays. Inthis Letter, pp collision data at
√s = 7 TeV, corresponding to an in-
tegrated luminosity of 1.0 fb−1 and accumulated by LHCb in 2011,are exploited to perform a similar model-independent study of thedecay mode B± → D K ± with D → K 0
S π+π− and D → K 0S K +K − .
The results are used to set constraints on the value of γ .
2. Formalism and external inputs
The amplitude of the decay B+ → D K + , D → K 0S h+h− can be
written as the superposition of the B+ → D0 K + and B+ → D0 K +contributions as
AB(m2+,m2−
) = A + rB ei(δB+γ ) A. (1)
Here m2+ and m2− are the invariant masses squared of the K 0S h+
and K 0S h− combinations, respectively, that define the position of
the decay in the Dalitz plot, A = A(m2+,m2−) is the D0 → K 0S h+h−
amplitude, and A = A(m2+,m2−) the D0 → K 0S h+h− amplitude. The
parameter rB , the ratio of the magnitudes of the B+ → D0 K +and B+ → D0 K + amplitudes, is ∼ 0.1 [14], and δB is the strong-phase difference between them. The equivalent expression for thecharge-conjugated decay B− → D K − is obtained by making thesubstitutions γ → −γ and A ↔ A. Neglecting CP violation, whichis known to be small in D0 − D0 mixing and Cabibbo-favoured
0370-2693/ © 2012 CERN. Published by Elsevier B.V. All rights reserved.http://dx.doi.org/10.1016/j.physletb.2012.10.020

44 LHCb Collaboration / Physics Letters B 718 (2012) 43–55
Fig. 1. Binning choices for (a) D → K 0S π+π− and (b) D → K 0
S K + K − . The diagonal line separates the positive and negative bins.
D meson decays [15], the conjugate amplitudes are related byA(m2+,m2−) = A(m2−,m2+).
Following the formalism set out in Ref. [2], the Dalitz plot ispartitioned into 2N regions symmetric under the exchange m2+ ↔m2− . The bins are labelled from −N to +N (excluding zero), wherethe positive bins satisfy m2− > m2+ . At each point in the Dalitzplot, there is a strong-phase difference δD(m2+,m2−) = arg A − arg Abetween the D0 and D0 decay. The cosine of the strong-phase dif-ference averaged in each bin and weighted by the absolute decayrate is termed ci and is given by
ci =∫Di
(|A|| A| cos δD)dD√∫Di
|A|2 dD√∫
Di| A|2 dD
, (2)
where the integrals are evaluated over the area D of bin i. Ananalogous expression may be written for si , which is the sine ofthe strong-phase difference within bin i, weighted by the decayrate. The values of ci and si can be determined by assuming afunctional form for |A|, | A| and δD , which may be obtained froman amplitude model fitted to flavour-tagged D0 decays. Alterna-tively direct measurements of ci and si can be used. Such mea-surements have been performed at CLEO-c, exploiting quantum-correlated D D pairs produced at the ψ(3770) resonance. This hasbeen done with a double-tagged method in which one D mesonis reconstructed in a decay to either K 0
S h+h− or K 0L h+h− , and the
other D meson is reconstructed either in a CP eigenstate or in adecay to K 0
S h+h− . The efficiency-corrected event yields, combinedwith flavour-tag information, allow ci and si to be determined [2,10,11]. The latter approach is attractive as it avoids any assumptionabout the nature of the intermediate resonances which contributeto the K 0
S h+h− final state; such an assumption leads to a system-atic uncertainty associated with the variation in δD that is difficultto quantify. Instead, an uncertainty is assigned that is related tothe precision of the ci and si measurements.
The population of each positive (negative) bin in the Dalitz plotarising from B+ decays is N+
+i (N+−i ), and that from B− decays is
N−+i (N−
−i). From Eq. (1) it follows that
N+±i = hB+
[K∓i + (
x2+ + y2+)
K±i + 2√
Ki K−i(x+c±i ∓ y+s±i)],
N−±i = hB−
[K±i + (
x2− + y2−)
K∓i + 2√
Ki K−i(x−c±i ± y−s±i)],
(3)
where hB± are normalisation factors which can, in principle, bedifferent for B+ and B− due to the production asymmetries, and
Ki is the number of events in bin i of the decay of a flavour-taggedD0 → K 0
S h+h− Dalitz plot. The sensitivity to γ enters through theCartesian parameters
x± = rB cos(δB ± γ ) and y± = rB sin(δB ± γ ). (4)
In this analysis the observed distribution of candidates over theD → K 0
S h+h− Dalitz plot is used to fit x± , y± and hB± . The pa-rameters ci and si are taken from measurements performed byCLEO-c [12]. In this manner the analysis avoids any dependenceon an amplitude model to describe the variation of the strongphase over the Dalitz plot. A model is used, however, to providethe input values for Ki . For the D0 → K 0
S π+π− decay the modelis taken from Ref. [5] and for the D0 → K 0
S K +K − decay the modelis taken from Ref. [6]. This choice incurs no significant systematicuncertainty as the models have been shown to describe well theintensity distribution of flavour-tagged D0 decay data.
The effect of D0 − D0 mixing is ignored in the above discussion,and was neglected in the CLEO-c measurements of ci and si as wellas in the construction of the amplitude model used to calculate Ki .This leads to a bias of the order of 0.2◦ in the γ determination [16]which is negligible for the current analysis.
The CLEO-c study segments the K 0S π+π− Dalitz plot into 2 × 8
bins. Several bin definitions are available. Here the ‘optimal bin-ning’ variant is adopted. In this scheme the bins have been chosento optimise the statistical sensitivity to γ in the presence of a lowlevel of background, which is appropriate for this analysis. The op-timisation has been performed assuming a strong-phase differencedistribution as predicted by the BaBar model presented in Ref. [5].The use of a specific model in defining the bin boundaries doesnot bias the ci and si measurements. If the model is a poor de-scription of the underlying decay the only consequence will be toreduce the statistical sensitivity of the γ measurement.
For the K 0S K +K − final state ci and si measurements are avail-
able for the Dalitz plot partitioned into 2 × 2, 2 × 3 and 2 × 4 bins,with the guiding model being that from the BaBar study describedin Ref. [6]. The bin boundaries divide the Dalitz plot into bins ofequal size with respect to the strong-phase difference between theD0 and D0 amplitudes. The current analysis adopts the 2 × 2 op-tion, a decision driven by the size of the signal sample. The binningchoices for the two decay modes are shown in Fig. 1.
3. The LHCb detector
The LHCb detector [17] is a single-arm forward spectrometercovering the pseudorapidity range 2 < η < 5. The detector includes

LHCb Collaboration / Physics Letters B 718 (2012) 43–55 45
a high precision tracking system consisting of a silicon-strip ver-tex detector surrounding the pp interaction region, a large-areasilicon-strip detector (VELO) located upstream of a dipole magnetwith a bending power of about 4 Tm, and three stations of silicon-strip detectors and straw drift-tubes placed downstream. The com-bined tracking system has a momentum resolution of (0.4–0.6)% inthe range of 5–100 GeV/c, and an impact parameter (IP) resolu-tion of 20 μm for tracks with high transverse momentum (pT).The dipole magnet can be operated in either polarity and thisfeature is used to reduce systematic effects due to detector asym-metries. In the data set considered in this analysis, 58% of datawere taken with one polarity and 42% with the other. Chargedhadrons are identified using two ring-imaging Cherenkov (RICH)detectors. Photon, electron and hadron candidates are identified bya calorimeter system consisting of scintillating-pad and preshowerdetectors, an electromagnetic calorimeter and a hadronic calorime-ter. Muons are identified by a system composed of alternatinglayers of iron and multiwire proportional chambers.
A two-stage trigger is employed. First a hardware-based deci-sion is taken at a frequency up to 40 MHz. It accepts high trans-verse energy clusters in either the electromagnetic calorimeter orhadron calorimeter, or a muon of high pT. For this analysis, it isrequired that one of the charged final-state tracks forming the B±candidate points at a deposit in the hadron calorimeter, or that thehardware-trigger decision was taken independently of these tracks.A second trigger level, implemented in software, receives 1 MHzof events and retains ∼0.3% of them [18]. It searches for a trackwith large pT and large IP with respect to any pp interaction pointwhich is called a primary vertex (PV). This track is then requiredto be part of a two-, three- or four-track secondary vertex with ahigh pT sum, significantly displaced from any PV. In order to max-imise efficiency at an acceptable trigger rate, the displaced vertexis selected with a decision tree algorithm that uses pT, impact pa-rameter, flight distance and track separation information. Full eventreconstruction occurs offline, and a loose preselection is applied.
Approximately three million simulated events for each of themodes B± → D(K 0
S π+π−)K ± and B± → D(K 0S π+π−)π± , and
one million simulated events for each of B± → D(K 0S K +K −)K ±
and B± → D(K 0S K +K −)π± are used in the analysis, as well as
a large inclusive sample of generic B → D X decays for back-ground studies. These samples are generated using a version ofPythia 6.4 [19] tuned to model the pp collisions [20]. EvtGen [21]encodes the particle decays in which final state radiation is gener-ated using Photos [22]. The interaction of the generated particleswith the detector and its response are implemented using theGeant4 toolkit [23] as described in Ref. [24].
4. Event selection and invariant mass spectrum fit
Selection requirements are applied to isolate both B± → D K ±and B± → Dπ± candidates, with D → K 0
S h+h− . Candidates se-lected in the Cabibbo-favoured B± → Dπ± decay mode providean important control sample which is exploited in the analysis.
A production vertex is assigned to each B candidate. This is thePV for which the reconstructed B trajectory has the smallest IPχ2, where this quantity is defined as the difference in the χ2 fitof the PV with and without the tracks of the considered particle.The K 0
S candidates are formed from two oppositely charged tracksreconstructed in the tracking stations, either with associated hitsin the VELO detector (long K 0
S candidate) or without (downstreamK 0
S candidate). The IP χ2 with respect to the PV of each of thelong (downstream) K 0
S daughters is required to be greater than16 (4). The angle θ between the K 0
S candidate momentum and thevector between the decay vertex and the PV, expected to be small
given the high momentum of the B meson, is required to satisfycos θ > 0.99, reducing background from combinations of randomtracks.
The D meson candidates are reconstructed by combining thelong (downstream) K 0
S candidates with two oppositely chargedtracks for which the values of the IP χ2 with respect to the PVare greater than 9 (16). In the case of the D → K 0
S K +K − a looseparticle identification (PID) requirement is placed on the kaonsto reduce combinatoric backgrounds. The IP χ2 of the candidateD with respect to any PV is demanded to be greater than 9 inorder to suppress directly produced D mesons, and the angle θ
between the D candidate momentum and the vector between thedecay and PV is required to satisfy the same criterion as for theK 0
S selection (cos θ > 0.99). The invariant mass resolution of thesignal is 8.7 MeV/c2 (11.9 MeV/c2) for D mesons reconstructedwith long (downstream) K 0
S candidates, and a common window of±25 MeV/c2 is imposed around the world average D0 mass [15].The K 0
S mass is determined after the addition of a constraint thatthe invariant mass of the two D daughter pions or kaons andthe two K 0
S daughter pions have the world average D mass. Theinvariant mass resolution is 2.9 MeV/c2 (4.8 MeV/c2) for long(downstream) K 0
S decays. Candidates are retained for which theinvariant mass of the two K 0
S daughters lies within ±15 MeV/c2
of the world average K 0S mass [15].
The D meson is combined with a candidate kaon or pion bach-elor particle to form the B candidate. The IP χ2 of the bachelorwith respect to the PV is required to be greater than 25. In or-der to ensure good discrimination between pions and kaons in theRICH system only tracks with momentum less than 100 GeV/c areconsidered. The bachelor is considered as a candidate kaon (pion)according to whether it passes (fails) a cut placed on the outputof the RICH PID algorithm. The PID information is quantified as adifference between the logarithm of the likelihood under the masshypothesis of a pion or a kaon. Criteria are then imposed on theB candidate: that the angle between its momentum and the vec-tor between the decay and the PV should have a cosine greaterthan 0.9999 for candidates containing long K 0
S decays (0.99995 fordownstream K 0
S decays); that the B vertex-separation χ2 with re-spect to its PV is greater than 169; and that the B IP χ2 withrespect to the PV is less than 9. To suppress background fromcharmless B decays it is required that the D vertex lies down-stream of the B vertex. In the events with a long K 0
S candidate,a further background arises from B± → Dh± , D → π+π−h+h−decays, where the two pions are reconstructed as a long K 0
S can-didate. This background is removed by requiring that the flightsignificance between the D and K 0
S vertices is greater than 10.In order to obtain the best possible resolution in the Dalitz plot
of the D decay, and to provide further background suppression, theB , D and K 0
S vertices are refitted with additional constraints on theD and K 0
S masses, and the B momentum is required to point backto the PV. The χ2 per degree of freedom of the fit is required tobe less than 5.
Less than 0.4% of the selected events are found to contain twoor more candidates. In these events only the B candidate with thelowest χ2 per degree of freedom from the refit is retained for sub-sequent study. In addition, 0.4% of the candidates are found to havebeen reconstructed such that their D Dalitz plot coordinates lieoutside the defined bins, and these too are discarded.
The invariant mass distributions of the selected candidates areshown in Fig. 2 for B± → D K ± and B± → Dπ± , with D →K 0
S π+π− decays, divided between the long and downstream K 0S
categories. Fig. 3 shows the corresponding distributions for finalstates with D → K 0
S K +K − , here integrated over the two K 0S cate-
gories. The result of an extended, unbinned, maximum likelihood

46 LHCb Collaboration / Physics Letters B 718 (2012) 43–55
Fig. 2. Invariant mass distributions of (a, c) B± → D K ± and (b, d) B± → Dπ± candidates, with D → K 0S π+π− , divided between the (a, b) long and (c, d) downstream K 0
Scategories. Fit results, including the signal and background components, are superimposed.
Fig. 3. Invariant mass distributions of (a) B± → D K ± and (b) B± → Dπ± candidates, with D → K 0S K + K − , shown with both K 0
S categories combined. Fit results, including
the signal and background components, are superimposed.fit to these distributions is superimposed. The fit is performedsimultaneously for B± → D K ± and B± → Dπ± , including bothD → K 0
S π+π− and D → K 0S K +K − decays, allowing several param-
eters to be different for long and downstream K 0S categories. The
fit range is between 5110 MeV/c2 and 5800 MeV/c2 in invariantmass. At this stage in the analysis the fit does not distinguish be-tween the different regions of Dalitz plot or B meson charge. Thepurpose of this global fit is to determine the parameters that de-scribe the invariant mass spectrum in preparation for the binnedfit described in Section 5.
The signal probability density function (PDF) is a Gaussian func-tion with asymmetric tails where the unnormalised form is givenby
f (m;m0,αL,αR ,σ )
={
exp[−(m − m0)2/(2σ 2 + αL(m − m0)
2)], m < m0;exp[−(m − m0)
2/(2σ 2 + αR(m − m0)2)], m > m0; (5)
where m is the candidate mass, m0 the B mass and σ , αL , andαR are free parameters in the fit. The parameter m0 is taken ascommon for all classes of signal. The parameters describing theasymmetric tails are fitted separately for events with long anddownstream K 0
S categories. The resolution of the Gaussian func-tion is left as a free parameter for the two K 0
S categories, butthe ratio between this resolution in B± → D K ± and B± → Dπ±decays is required to be the same, independent of category. Theresolution is determined to be around 15 MeV/c2 for B± → Dπ±decays of both K 0
S classes, and is smaller by a factor 0.95 ± 0.06for B± → D K ± . The yield of B± → Dπ± candidates in each cat-egory is determined in the fit. Instead of fitting the yield ofthe B± → D K ± candidates separately, the ratio R = N(B± →D K ±)/N(B± → Dπ±) is a free parameter and is common acrossall categories.
The background has contributions from random track combina-tions and partially reconstructed B decays. The random track com-binations are modelled by linear PDFs, the parameters of which are

LHCb Collaboration / Physics Letters B 718 (2012) 43–55 47
Table 1Yields and statistical uncertainties in the signal region from the invariant mass fit, scaled from the full fit mass range, for candidates passing theB± → Dh± , D → K 0
S π+π− selection. Values are shown separately for candidates containing long and downstream K 0S decays. The signal region is
between 5247 MeV/c2 and 5317 MeV/c2 and the full fit range is between 5110 MeV/c2 and 5800 MeV/c2.
Fit component B± → D K ± selection B± → Dπ± selection
Long Downstream Long Downstream
B± → D K ± 213 ± 13 441 ± 25 – –B± → Dπ± 11 ± 3 22 ± 5 2809 ± 56 5755 ± 82Combinatoric 9 ± 4 29 ± 6 22 ± 3 90 ± 7Partially reconstructed 11 ± 1 25 ± 2 25 ± 1 55 ± 1
Table 2Yields and statistical uncertainties in the signal region from the invariant mass fit, scaled from the full fit mass range, for candidates passing theB± → Dh± , D → K 0
S K + K − selection. Values are shown separately for candidates containing long and downstream K 0S decays. The signal region is
between 5247 MeV/c2 and 5317 MeV/c2 and the full fit range is between 5110 MeV/c2 and 5800 MeV/c2.
Fit component B± → D K ± selection B± → Dπ± selection
Long Downstream Long Downstream
B± → D K ± 32 ± 2 70 ± 4 – –B± → Dπ± 1.6 ± 1.2 3.4 ± 1.8 417 ± 20 913 ± 29Combinatoric 0.6 ± 0.5 2.5 ± 0.9 4.8 ± 1.4 18 ± 2Partially reconstructed 2.2 ± 0.4 2.9 ± 0.5 3.7 ± 0.3 7.7 ± 0.5
floated separately for each class of decay. Partially reconstructedbackgrounds are described empirically. Studies of simulated eventsshow that the partially reconstructed backgrounds are dominatedby decays that involve a D meson decaying to K 0
S h+h− . Thereforethe same PDF is used to describe these backgrounds as used in asimilar analysis of B± → D K ± decays, with D → K ±π∓ , K +K −and π+π− [1]. In that analysis the shape was constructed by ap-plying the selection to a large simulated sample containing manycommon backgrounds, each weighted by its production rate andbranching fraction. The invariant mass distribution for the surviv-ing candidates was corrected to account for small differences inresolution and PID performance between data and simulation, andtwo background PDFs were extracted by kernel estimation [25];one for B± → D K ± and one for B± → Dπ± decays. The partiallyreconstructed background PDFs are found to give a good descrip-tion of both K 0
S categories.An additional and significant background component exists in
the B± → D K ± sample, arising from the dominant B± → Dπ±decay on those occasions where the bachelor particle is misiden-tified as a kaon by the RICH system. In contrast, the B± → D K ±contamination in the B± → Dπ± sample can be neglected. Thesize of this background is calculated through knowledge of PID andmisidentification efficiencies, which are obtained from large sam-ples of kinematically selected D∗± → Dπ± , D → K ∓π± decays.The kinematic properties of the particles in the calibration sam-ple are reweighted to match those of the bachelor particles in theB decay sample, thereby ensuring that the measured PID perfor-mance is representative of that in the B decay sample. The effi-ciency to identify a kaon correctly is found to be around 86%, andthat for a pion to be around 96%. The misidentification efficien-cies are the complements of these numbers. From this informationand from knowledge of the number of reconstructed B± → Dπ±decays, the amount of this background surviving the B± → D K ±selection can be determined. The invariant mass distribution of themisidentified candidates is described by a Crystal Ball function [26]with the tail on the high mass side, the parameters of which arefitted in common between all the B± → D K ± samples.
The number of B± → D K ± candidates in all categories is de-termined by R, and the number of B± → Dπ± events in thecorresponding category. The ratio R is determined in the fit andmeasured to be 0.085 ± 0.005 (statistical uncertainty only) and isconsistent with that observed in Ref. [1]. The yields returned by
the invariant mass fit in the full fit region are scaled to the sig-nal region, defined as 5247–5317 MeV/c2, and are presented inTables 1 and 2 for the D → K 0
S π+π− and D → K 0S K +K − selec-
tions respectively. In the B± → D(K 0S π+π−)K ± sample there are
654 ± 28 signal candidates, with a purity of 86%. The correspond-ing numbers for the B± → D(K 0
S K +K −)K ± sample are 102 ± 5and 88%, respectively. The contamination in the B± → D K ± selec-tion receives approximately equal contributions from misidentifiedB± → Dπ± decays, combinatoric background and partially recon-structed decays. The partially reconstructed component in the sig-nal region is dominated by decays of the type B → Dρ , in whicha charged pion from the ρ decay is misidentified as the bachelorkaon, and B± → D∗π± , again with a misidentified pion.
The Dalitz plots for B± → D K ± data in the signal region for thetwo D → K 0
S h+h− final states are shown in Fig. 4. Separate plotsare shown for B+ and B− decays.
5. Binned Dalitz fit
The purpose of the binned Dalitz plot fit is to measure theCP-violating parameters x± and y± , as introduced in Section 2.Following Eq. (3) these parameters can be determined from thepopulations of each B± → D K ± Dalitz plot bin given the externalinformation that is available for the ci , si and Ki parameters. In or-der to know the signal population in each bin it is necessary bothto subtract background and to correct for acceptance losses fromthe trigger, reconstruction and selection.
Although the absolute numbers of B+ and B− decays integratedover the Dalitz plot have some dependence on x± and y± , the ad-ditional sensitivity gained compared to using just the relative bin-to-bin yields is negligible, and is therefore not used. Consequentlythe analysis is insensitive to any B production asymmetries, andonly knowledge of the relative acceptance is required. The relativeacceptance is determined from the control channel B± → Dπ± . Inthis decay the ratio of b → ucd to b → cud amplitudes is expectedto be very small (∼ 0.005) and thus, to a good approximation,interference between the transitions can be neglected. Hence therelative population of decays expected in each B± → Dπ± Dalitzplot bin can be predicted using the Ki values calculated with theD → K 0
S h+h− model. Dividing the background-subtracted yield ob-served in each bin by this prediction enables the relative accep-tance to be determined, and then applied to the B± → D K ± data.

48 LHCb Collaboration / Physics Letters B 718 (2012) 43–55
Fig. 4. Dalitz plots of B± → D K ± candidates in the signal region for (a, b) D → K 0S π+π− and (c, d) D → K 0
S K + K − decays, divided between (a, c) B+ and (b, d) B− . Theboundaries of the kinematically-allowed regions are also shown.
In order to optimise the statistical precision of this procedure, thebins +i and −i are combined in the calculation, since the efficien-cies in these symmetric regions are expected to be the same in thelimit that there are no charge-dependent reconstruction asymme-tries. It is found that the variation in relative acceptance betweennon-symmetric bins is at most ∼ 50%, with the lowest efficiencyoccurring in those regions where one of the pions has low mo-mentum.
Separate fits are performed to the B+ and B− data. Each fitsimultaneously considers the two K 0
S categories, the B± → D K ±and B± → Dπ± candidates, and the two D → K 0
S h+h− final states.In order to assess the impact of the D → K 0
S K +K − data the fitis then repeated including only the D → K 0
S π+π− sample. ThePDF parameters for both the signal and background invariant massdistributions are fixed to the values determined in the global fit.The yields of all the background contributions in each bin are freeparameters, apart from bins where a very low contribution is de-termined from an initial fit, in which case they are fixed to zero,to facilitate the calculation of the error matrix. The yields of sig-nal candidates for each bin in the B± → Dπ± sample are also freeparameters. The amount of signal in each bin for the B± → D K ±sample is determined by varying the integrated yield and the x±and y± parameters.
A large ensemble of simulated experiments are performed tovalidate the fit procedure. In each experiment the number anddistribution of signal and background candidates are generated
according to the expected distribution in data, and the full fit pro-cedure is then executed. The values for x± and y± are set closeto those determined by previous measurements [14]. It is foundfrom this exercise that the errors are well estimated. Small biasesare, however, observed in the central values returned by the fitand these are applied as corrections to the results obtained ondata. The bias is (0.2–0.3) × 10−2 for most parameters but risesto 1.0 × 10⁻² for y+ . This bias is due to the low yields in someof the bins and is an inherent feature of the maximum likelihoodfit. This behaviour is associated with the size of data set being fit,since when simulated experiments are performed with larger sam-ple sizes the biases are observed to reduce.
The results of the fits are presented in Table 3. The system-atic uncertainties are discussed in Section 6. The statistical un-certainties are compatible with those predicted by simulated ex-periments. The inclusion of the D → K 0
S K +K − data improves theprecision on x± by around 10%, and has little impact on y± . Thisbehaviour is expected, as the measured values of ci in this mode,which multiply x± in Eq. (4), are significantly larger than thoseof si , which multiply y± . The two sets of results are compatiblewithin the statistical and uncorrelated systematic uncertainties.
The measured values of (x±, y±) from the fit to all data, withtheir statistical likelihood contours are shown in Fig. 5. The ex-pected signature for a sample that exhibits CP violation is thatthe two vectors defined by the coordinates (x−, y−) and (x+, y+)
should both be non-zero in magnitude, and have different phases.
LHCb Collaboration / Physics Letters B 718 (2012) 43–55 49
Table 3Results for x± and y± from the fits to the data in the case when both D →K 0
S π+π− and D → K 0S K + K − are considered and when only the D → K 0
S π+π− fi-nal state is included. The first, second, and third uncertainties are the statistical, theexperimental systematic, and the error associated with the precision of the strong-phase parameters, respectively. The correlation coefficients are calculated includingall sources of uncertainty (the values in parentheses correspond to the case whereonly the statistical uncertainties are considered).
Parameter All data D → K 0S π+π− alone
x− [×10−2] 0.0 ± 4.3 ± 1.5 ± 0.6 1.6 ± 4.8 ± 1.4 ± 0.8y− [×10−2] 2.7 ± 5.2 ± 0.8 ± 2.3 1.4 ± 5.4 ± 0.8 ± 2.4corr(x−, y−) −0.10 (−0.11) −0.12 (−0.12)x+ [×10−2] −10.3 ± 4.5 ± 1.8 ± 1.4 −8.6 ± 5.4 ± 1.7 ± 1.6y+ [×10−2] −0.9 ± 3.7 ± 0.8 ± 3.0 −0.3 ± 3.7 ± 0.9 ± 2.7corr(x+, y+) 0.22 (0.17) 0.20 (0.17)
Fig. 5. One (solid), two (dashed) and three (dotted) standard deviation confidencelevels for (x+, y+) (blue) and (x−, y−) (red) as measured in B± → D K ± decays(statistical only). The points represent the best fit central values. (For interpretationof the references to colour in this figure legend, the reader is referred to the webversion of this Letter.)
The data show this behaviour, but are also compatible with the noCP violation hypothesis.
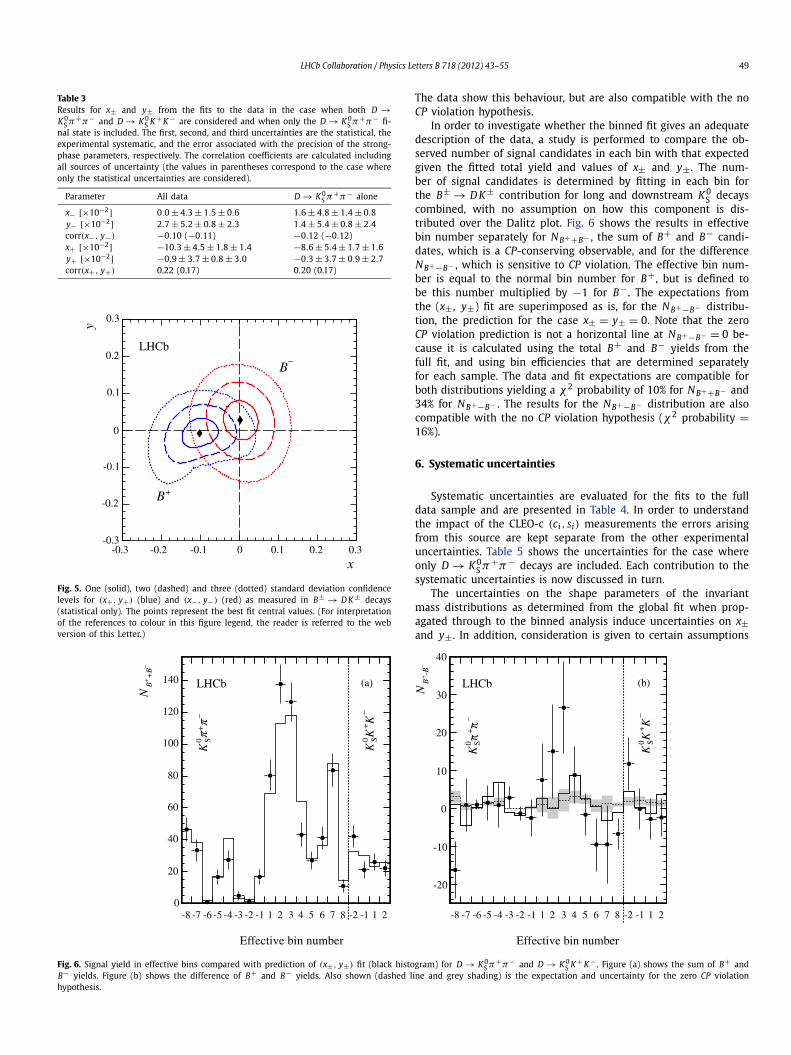
In order to investigate whether the binned fit gives an adequatedescription of the data, a study is performed to compare the ob-served number of signal candidates in each bin with that expectedgiven the fitted total yield and values of x± and y± . The num-ber of signal candidates is determined by fitting in each bin forthe B± → D K ± contribution for long and downstream K 0
S decayscombined, with no assumption on how this component is dis-tributed over the Dalitz plot. Fig. 6 shows the results in effectivebin number separately for NB++B− , the sum of B+ and B− candi-dates, which is a CP-conserving observable, and for the differenceNB+−B− , which is sensitive to CP violation. The effective bin num-ber is equal to the normal bin number for B+ , but is defined tobe this number multiplied by −1 for B− . The expectations fromthe (x± , y±) fit are superimposed as is, for the NB+−B− distribu-tion, the prediction for the case x± = y± = 0. Note that the zeroCP violation prediction is not a horizontal line at NB+−B− = 0 be-cause it is calculated using the total B+ and B− yields from thefull fit, and using bin efficiencies that are determined separatelyfor each sample. The data and fit expectations are compatible forboth distributions yielding a χ2 probability of 10% for NB++B− and34% for NB+−B− . The results for the NB+−B− distribution are alsocompatible with the no CP violation hypothesis (χ2 probability =16%).
6. Systematic uncertainties
Systematic uncertainties are evaluated for the fits to the fulldata sample and are presented in Table 4. In order to understandthe impact of the CLEO-c (ci, si) measurements the errors arisingfrom this source are kept separate from the other experimentaluncertainties. Table 5 shows the uncertainties for the case whereonly D → K 0
S π+π− decays are included. Each contribution to thesystematic uncertainties is now discussed in turn.
The uncertainties on the shape parameters of the invariantmass distributions as determined from the global fit when prop-agated through to the binned analysis induce uncertainties on x±and y± . In addition, consideration is given to certain assumptions
Fig. 6. Signal yield in effective bins compared with prediction of (x±, y±) fit (black histogram) for D → K 0S π+π− and D → K 0
S K + K − . Figure (a) shows the sum of B+ andB− yields. Figure (b) shows the difference of B+ and B− yields. Also shown (dashed line and grey shading) is the expectation and uncertainty for the zero CP violationhypothesis.

50 LHCb Collaboration / Physics Letters B 718 (2012) 43–55
Table 4Summary of statistical, experimental and strong-phase uncertainties on x± and y±in the case where both D → K 0
S π+π− and D → K 0S K + K − decays are included in
the fit. All entries are given in multiples of 10−2.
Component σ(x−) σ (y−) σ (x+) σ (y+)
Statistical 4.3 5.2 4.5 3.7Global fit shape parameters 0.4 0.4 0.6 0.4Efficiency effects 0.3 0.4 0.3 0.4CP violation in control mode 1.3 0.4 1.5 0.2Migration 0.4 0.2 0.4 0.2Partially reconstructed background 0.2 0.3 0.2 0.2PID efficiency 0.1 0.2 0.2 < 0.1Shape of misidentified B± → Dπ± 0.1 0.1 0.3 < 0.1Bias correction 0.2 0.3 0.2 0.5
Total experimental systematic 1.5 0.9 1.8 0.8
Strong-phase systematic 0.6 2.3 1.4 3.0
Table 5Summary of statistical, experimental and strong-phase uncertainties on x± and y±in the case where only D → K 0
S π+π− decays are included in the fit. All entries aregiven in multiples of 10−2.
Component σ(x−) σ (y−) σ (x+) σ (y+)
Statistical 4.8 5.4 5.4 3.7Global fit shape parameters 0.4 0.4 0.6 0.4Efficiency effects 0.2 0.2 0.3 0.4CP violation in control mode 1.2 0.5 1.5 0.2Migration 0.4 0.2 0.4 0.2Partially reconstructed background 0.1 0.1 0.3 0.2PID efficiency < 0.1 0.2 < 0.1 < 0.1Shape of misidentified B± → Dπ± 0.1 < 0.1 0.1 < 0.1Bias correction 0.2 0.3 0.2 0.6
Total experimental systematic 1.4 0.8 1.7 0.9
Strong-phase systematic 0.8 2.4 1.6 2.7
made in the fit. For example, the slope of the combinatoric back-ground in the data set containing D → K 0
S K +K − decays is fixed tobe zero on account of the limited sample size. The induced errorsassociated with these assumptions are evaluated and found to besmall compared to those coming from the parameter uncertaintiesthemselves, which vary between 0.4×10⁻² and 0.6×10⁻² for thefit to the full data sample.
The analysis assumes an efficiency that is flat across each Dalitzplot bin. In reality the efficiency varies, and this leads to a poten-tial bias in the determination of x± and y± , since the non-uniformacceptance means that the values of (ci, si) appropriate for theanalysis can differ from those corresponding to the flat-efficiencycase. The possible size of this effect is evaluated in LHCb simula-tion by dividing each Dalitz plot bin into many smaller cells, andusing the BaBar amplitude model [5,6] to calculate the values of ciand si within each cell. These values are then averaged together,weighted by the population of each cell after efficiency losses, toobtain an effective (ci, si) for the bin as a whole, and the resultscompared with those determined assuming a flat efficiency. Thedifferences between the two sets of results are found to be smallcompared with the CLEO-c measurement uncertainties. The datafit is then rerun many times, and the input values of (ci, si) aresmeared according to the size of these differences, and the meanshifts are assigned as a systematic uncertainty. These shifts varybetween 0.2 × 10⁻² and 0.3 × 10⁻².
The relative efficiency in each Dalitz plot bin is determinedfrom the B± → Dπ± control sample. Biases can enter the mea-surement if there are differences in the relative acceptance overthe Dalitz plot between the control sample and that of signalB± → D K ± decays. Simulation studies show that the acceptanceshapes are very similar between the two decays, but small vari-ations exist which can be attributed to kinematic correlations in-
duced by the different PID requirements on the bachelor particlefrom the B decay. When included in the data fit, these varia-tions induce biases that vary between 0.1 × 10⁻² and 0.3 × 10⁻².In addition, a check is performed in which the control sampleis fitted without combining together bins +i and −i in the effi-ciency calculation. As a result of this study small uncertainties of� 0.3 × 10⁻² are assigned for the D → K 0
S K +K − measurement toaccount for possible biases induced by the difference in interactioncross-section for K − and K + mesons interacting with the detec-tor material. These contributions are combined together with theuncertainty arising from efficiency variation within a Dalitz plotbin to give the component labelled ‘Efficiency effects’ in Tables 4and 5.
The use of the control channel to determine the relative effi-ciency on the Dalitz plot assumes that the amplitude of the sup-pressed tree diagram is negligible. If this is not the case then theB− final state will receive a contribution from D0 decays, and thiswill lead to the presence of CP violation via the same mechanismas in B → D K decays. The size of any CP violation that existsin this channel is governed by rDπ
B , γ and δDπB , where the pa-
rameters with superscripts are analogous to their counterparts inB± → D K ± decays. The naive expectation is that rDπ
B ∼ 0.005 butlarger values are possible, and the studies reported in Ref. [1] arecompatible with this possibility. Therefore simulated experimentsare performed with finite CP violation injected in the control chan-nel, conservatively setting rDπ
B to be 0.02, taking a wide variationin the value of the unknown strong-phase difference δDπ
B , andchoosing γ = 70◦ . The experiments are fit under the no CP vio-lation hypothesis and the largest shifts observed are assigned asa systematic uncertainty. This contribution is the largest source ofexperimental systematic uncertainty in the measurement, for ex-ample contributing an error of 1.5 × 10⁻² in the case of x+ in thefull data fit.
The resolution of each decay on the Dalitz plot is approxi-mately 0.004 GeV2/c4 for candidates with long K 0
S decays and0.006 GeV2/c4 for those containing downstream K 0
S in the m2+ andm2− directions. This is small compared to the typical width of a bin,nonetheless some net migration is possible away from the moredensely populated bins. At first order this effect is accounted forby use of the control channel, but residual effects enter becauseof the different distribution in the Dalitz plot of the signal events.Once more a series of simulated experiments is performed to as-sess the size of any possible bias which is found to vary between0.2 × 10−2 and 0.4 × 10⁻².
The distribution of the partially reconstructed background isvaried over the Dalitz plot according to the uncertainty in themake-up of this background component. From these studies an un-certainty of (0.2–0.3) × 10−2 is assigned to the fit parameters inthe full data fit.
Two systematic uncertainties are evaluated that are associatedwith the misidentified B± → Dπ± background in the B± → D K ±sample. Firstly, there is a 0.2 × 10⁻² uncertainty on the knowledgeof the efficiency of the PID cut that distinguishes pions from kaons.This is found to have only a small effect on the measured values ofx± and y± . Secondly, it is possible that the invariant mass distribu-tion of the misidentified background is not constant over the Dalitzplot, as is assumed in the fit. This can occur through kinematic cor-relations between the reconstruction efficiency on the Dalitz plotof the D decay and the momentum of the bachelor pion fromthe B± decay. Simulated experiments are performed with differ-ent shapes input according to the Dalitz plot bin and the results ofsimulation studies, and these experiments are then fitted assum-ing a uniform shape, as in data. Uncertainties are assigned in therange (0.1–0.3) × 10−2.

LHCb Collaboration / Physics Letters B 718 (2012) 43–55 51
Fig. 7. Two-dimensional projections of confidence regions onto the (γ , rB ) and (γ , δB ) planes showing the one (solid) and two (dashed) standard deviations with all uncer-tainties included. For the (γ , rB ) projection the three (dotted) standard deviation contour is also shown. The points mark the central values.
An uncertainty is assigned to each parameter to accompany thecorrection that is applied for the small bias which is present in thefit procedure. These uncertainties are determined by performingsets of simulated experiments, in each of which different valuesof x± and y± are input, corresponding to a range that is widecompared to the current experimental knowledge, and also encom-passing the results of this analysis. The spread in observed biasis taken as the systematic error, and is largest for y+ , reaching avalue of 0.5 × 10⁻² in the full data fit.
Finally, several robustness checks are conducted to assess thestability of the results. These include repeating the analysis withalternative binning schemes for the D → K 0
S π+π− data and per-forming the fits without making any distinction between K 0
S cate-gory. These tests return results compatible with the baseline pro-cedure.
The total experimental systematic uncertainty from LHCb-related sources is determined to be 1.5 × 10⁻² on x− , 0.9 × 10⁻²
on y− , 1.8 × 10⁻² on x+ and 0.8 × 10⁻² on y+ . These are allsmaller than the corresponding statistical uncertainties. The dom-inant contribution arises from allowing for the possibility of CPviolation in the control channel, B → Dπ . In the future, whenlarger data sets are analysed, alternative analysis methods will beexplored to eliminate this potential source of bias.
The limited precision on (ci, si) coming from the CLEO-c mea-surement induces uncertainties on x± and y± [12]. These un-certainties are evaluated by rerunning the data fit many times,and smearing the input values of (ci, si) according to their mea-surement errors and correlations. Values of (0.6–3.0) × 10−2 arefound for the fit to the full sample. When evaluated for the D →K 0
S π+π− data set alone, the results are similar in magnitude, butnot identical, to those reported in the corresponding Belle analy-sis [13]. Differences are to be expected, as these uncertainties havea dependence on the central values of the x± and y± parameters,and are sample-dependent for small data sets. Simulation stud-ies indicate that these uncertainties will be reduced when largerB± → D K ± data sets are analysed.
After taking account of all sources of uncertainty the correla-tion coefficient between x− and y− in the full fit is calculated tobe −0.10 and that between x+ and y+ to be 0.22. The correla-tions between B− and B+ parameters are found to be small andcan be neglected. These correlations are summarised in Table 3, to-gether with those coming from the statistical uncertainties alone,and those from the fit to D → K 0
S π+π− data.
7. Interpretation
The results for x± and y± can be interpreted in terms of theunderlying physics parameters γ , rB and δB . This is done usinga frequentist approach with Feldman–Cousins ordering [27], us-ing the same procedure as described in Ref. [13]. In this mannerconfidence levels are obtained for the three physics parameters.The confidence levels for one, two and three standard deviationsare taken at 20%, 74% and 97%, which is appropriate for a three-dimensional Gaussian distribution. The projections of the three-dimensional surfaces bounding the one, two and three standarddeviation volumes onto the (γ , rB) and (γ , δB) planes are shownin Fig. 7. The LHCb-related systematic uncertainties are taken asuncorrelated and correlations of the CLEO-c and statistical uncer-tainties are taken into account. The statistical and systematic un-certainties on x and y are combined in quadrature.
The solution for the physics parameters has a two-fold ambigu-ity, (γ , δB) and (γ + 180◦, δB + 180◦). Choosing the solution thatsatisfies 0 < γ < 180◦ yields rB = 0.07 ± 0.04, γ = (44+43
−38)◦ and
δB = (137+35−46)
◦ . The value for rB is consistent with, but lower than,the world average of results from previous experiments [15]. Thislow value means that it is not possible to use the results of thisanalysis, in isolation, to set strong constraints on the values of γand δB , as can be seen by the large uncertainties on these param-eters.
8. Conclusions
Approximately 800 B± → D K ± decay candidates, with the Dmeson decaying either to K 0
S π+π− or K 0S K +K − , have been se-
lected from 1.0 fb−1 of data collected by LHCb in 2011. Thesesamples have been analysed to determine the CP-violating param-eters x± = rB cos(δB ± γ ) and y± = rB sin(δB ± γ ), where rB is theratio of the absolute values of the B+ → D0 K − and B+ → D0 K −amplitudes, δB is the strong-phase difference between them, andγ is the angle of the unitarity triangle. The analysis is performedin bins of D decay Dalitz space and existing measurements ofthe CLEO-c experiment are used to provide input on the D de-cay strong-phase parameters (ci, si) [12]. Such an approach allowsthe analysis to be essentially independent of any model-dependentassumptions on the strong-phase variation across Dalitz space. It isthe first time this method has been applied to D → K 0
S K +K − de-cays. The following results are obtained

52 LHCb Collaboration / Physics Letters B 718 (2012) 43–55
x− = (0.0 ± 4.3 ± 1.5 ± 0.6) × 10−2,
y− = (2.7 ± 5.2 ± 0.8 ± 2.3) × 10−2,
x+ = (−10.3 ± 4.5 ± 1.8 ± 1.4) × 10−2,
y+ = (−0.9 ± 3.7 ± 0.8 ± 3.0) × 10−2,
where the first uncertainty is statistical, the second is system-atic and the third arises from the experimental knowledge of the(ci, si) parameters. These values have similar precision to those ob-tained in a recent binned study by the Belle experiment [13].
When interpreting these results in terms of the underlyingphysics parameters it is found that rB = 0.07 ± 0.04, γ = (44+43
−38)◦
and δB = (137+35−46)
◦ . These values are consistent with the worldaverage of results from previous measurements [15], although theuncertainties on γ and δB are large. This is partly driven by therelatively low central value that is obtained for the parameter rB .More stringent constraints are expected when these results arecombined with other measurements from LHCb which have com-plementary sensitivity to the same physics parameters.
Acknowledgements
We express our gratitude to our colleagues in the CERN accel-erator departments for the excellent performance of the LHC. Wethank the technical and administrative staff at CERN and at theLHCb institutes, and acknowledge support from the National Agen-cies: CAPES, CNPq, FAPERJ and FINEP (Brazil); CERN; NSFC (China);CNRS/IN2P3 (France); BMBF, DFG, HGF and MPG (Germany); SFI(Ireland); INFN (Italy); FOM and NWO (The Netherlands); SCSR(Poland); ANCS (Romania); MinES of Russia and Rosatom (Russia);MICINN, XuntaGal and GENCAT (Spain); SNSF and SER (Switzer-land); NAS Ukraine (Ukraine); STFC (United Kingdom); NSF (USA).We also acknowledge the support received from the ERC under FP7and the Region Auvergne.
Open access
This article is published Open Access at sciencedirect.com. Itis distributed under the terms of the Creative Commons Attribu-tion License 3.0, which permits unrestricted use, distribution, andreproduction in any medium, provided the original authors andsource are credited.
References
[1] LHCb Collaboration, R. Aaij, et al., Phys. Lett. B 712 (2012) 203, arXiv:1203.3662.
[2] A. Giri, Y. Grossman, A. Softer, J. Zupan, Phys. Rev. D 68 (2003) 054018, arXiv:hep-ph/0303187.
[3] A. Bondar, Proceedings of BINP special analysis meeting on Dalitz analysis, 24–26 Sep. 2002, unpublished.
[4] BaBar Collaboration, B. Aubert, et al., Phys. Rev. Lett. 95 (2005) 121802, arXiv:hep-ex/0504039.
[5] BaBar Collaboration, B. Aubert, et al., Phys. Rev. D 78 (2008) 034023, arXiv:0804.2089.
[6] BaBar Collaboration, P. del Amo Sanchez, et al., Phys. Rev. Lett. 105 (2010)121801, arXiv:1005.1096.
[7] Belle Collaboration, A. Poluektov, et al., Phys. Rev. D 70 (2004) 072003, arXiv:hep-ex/0406067.
[8] Belle Collaboration, A. Poluektov, et al., Phys. Rev. D 73 (2006) 112009, arXiv:hep-ex/0604054.
[9] Belle Collaboration, A. Poluektov, et al., Phys. Rev. D 81 (2010) 112002, arXiv:1003.3360.
[10] A. Bondar, A. Poluektov, Eur. Phys. J. C 47 (2006) 347, arXiv:hep-ph/0510246.[11] A. Bondar, A. Poluektov, Eur. Phys. J. C 55 (2008) 51, arXiv:0801.0840.[12] CLEO Collaboration, J. Libby, et al., Phys. Rev. D 82 (2010) 112006, arXiv:
1010.2817.[13] Belle Collaboration, H. Aihara, et al., Phys. Rev. D 85 (2012) 112014, arXiv:
1204.6561.[14] Heavy Flavor Averaging Group, D. Asner, et al., Averages of b-hadron, c-hadron,
and τ -lepton properties, arXiv:1010.1589, updates available online at http://www.slac.Stanford.edu/xorg/hfag.
[15] Particle Data Group, J. Beringer, et al., Phys. Rev. D 86 (2012) 010001.[16] A. Bondar, A. Poluektov, V. Vorobiev, Phys. Rev. D 82 (2010) 034033, arXiv:
1004.2350.[17] LHCb Collaboration, A.A. Alves Jr., et al., JINST 3 (2008) S08005.[18] V.V. Gligorov, C. Thomas, M. Williams, The HIT inclusive B triggers, LHCb-PUB-
2011-016.[19] T. Sjöstrand, S. Mrenna, P. Skands, JHEP 0605 (2006) 026, arXiv:hep-ph/
0603175.[20] I. Belyaev, et al., in: Nuclear Science Symposium Conference Record (NSS/MIC),
IEEE, 2010, p. 1155.[21] D.J. Lange, Nucl. Instrum. Meth. A 462 (2001) 152.[22] P. Golonka, Z. Was, Eur. Phys. J. C 45 (2006) 97, arXiv:hep-ph/0506026.[23] GEANT4 Collaboration, J. Allison, et al., IEEE Trans. Nucl. Sci. 53 (2006) 270;
GEANT4 Collaboration, S. Agostinelli, et al., Nucl. Instrum. Meth. A 506 (2003)250.
[24] M. Clemencic, et al., J. Phys.: Conf. Ser. 331 (2011) 032023.[25] K.S. Cranmer, Comput. Phys. Comm. 136 (2001) 198, arXiv:hep-ex/0011057.[26] T. Skwarnicki, A study of the radiative cascade transitions between the Upsilon-
prime and Upsilon resonances, PhD thesis, Institute of Nuclear Physics, Krakow,1986, DESY-F31-86-02.
[27] G.J. Feldman, R.D. Cousins, Phys. Rev. D 57 (1998) 3873, arXiv:physics/9711021.
LHCb Collaboration
R. Aaij 38, C. Abellan Beteta 33,n, A. Adametz 11, B. Adeva 34, M. Adinolfi 43, C. Adrover 6, A. Affolder 49,Z. Ajaltouni 5, J. Albrecht 35, F. Alessio 35, M. Alexander 48, S. Ali 38, G. Alkhazov 27, P. Alvarez Cartelle 34,A.A. Alves Jr. 22, S. Amato 2, Y. Amhis 36, L. Anderlini 17,f , J. Anderson 37, R.B. Appleby 51,O. Aquines Gutierrez 10, F. Archilli 18,35, A. Artamonov 32, M. Artuso 53, E. Aslanides 6, G. Auriemma 22,m,S. Bachmann 11, J.J. Back 45, C. Baesso 54, W. Baldini 16, R.J. Barlow 51, C. Barschel 35, S. Barsuk 7,W. Barter 44, A. Bates 48, Th. Bauer 38, A. Bay 36, J. Beddow 48, I. Bediaga 1, S. Belogurov 28, K. Belous 32,I. Belyaev 28, E. Ben-Haim 8, M. Benayoun 8, G. Bencivenni 18, S. Benson 47, J. Benton 43, A. Berezhnoy 29,R. Bernet 37, M.-O. Bettler 44, M. van Beuzekom 38, A. Bien 11, S. Bifani 12, T. Bird 51, A. Bizzeti 17,h,P.M. Bjørnstad 51, T. Blake 35, F. Blanc 36, C. Blanks 50, J. Blouw 11, S. Blusk 53, A. Bobrov 31, V. Bocci 22,A. Bondar 31, N. Bondar 27, W. Bonivento 15, S. Borghi 48,51, A. Borgia 53, T.J.V. Bowcock 49, C. Bozzi 16,T. Brambach 9, J. van den Brand 39, J. Bressieux 36, D. Brett 51, M. Britsch 10, T. Britton 53, N.H. Brook 43,H. Brown 49, A. Büchler-Germann 37, I. Burducea 26, A. Bursche 37, J. Buytaert 35, S. Cadeddu 15, O. Callot 7,M. Calvi 20,j, M. Calvo Gomez 33,n, A. Camboni 33, P. Campana 18,35, A. Carbone 14,c, G. Carboni 21,k,R. Cardinale 19,i, A. Cardini 15, L. Carson 50, K. Carvalho Akiba 2, G. Casse 49, M. Cattaneo 35, Ch. Cauet 9,M. Charles 52, Ph. Charpentier 35, P. Chen 3,36, N. Chiapolini 37, M. Chrzaszcz 23, K. Ciba 35, X. Cid Vidal 34,

LHCb Collaboration / Physics Letters B 718 (2012) 43–55 53
G. Ciezarek 50, P.E.L. Clarke 47, M. Clemencic 35, H.V. Cliff 44, J. Closier 35, C. Coca 26, V. Coco 38, J. Cogan 6,E. Cogneras 5, P. Collins 35, A. Comerma-Montells 33, A. Contu 52,15, A. Cook 43, M. Coombes 43, G. Corti 35,B. Couturier 35, G.A. Cowan 36, D. Craik 45, S. Cunliffe 50, R. Currie 47, C. D’Ambrosio 35, P. David 8,P.N.Y. David 38, I. De Bonis 4, K. De Bruyn 38, S. De Capua 21,k, M. De Cian 37, J.M. De Miranda 1,L. De Paula 2, P. De Simone 18, D. Decamp 4, M. Deckenhoff 9, H. Degaudenzi 36,35, L. Del Buono 8,C. Deplano 15, D. Derkach 14, O. Deschamps 5, F. Dettori 39, A. Di Canto 11, J. Dickens 44, H. Dijkstra 35,P. Diniz Batista 1, F. Domingo Bonal 33,n, S. Donleavy 49, F. Dordei 11, A. Dosil Suárez 34, D. Dossett 45,A. Dovbnya 40, F. Dupertuis 36, R. Dzhelyadin 32, A. Dziurda 23, A. Dzyuba 27, S. Easo 46, U. Egede 50,V. Egorychev 28, S. Eidelman 31, D. van Eijk 38, S. Eisenhardt 47, R. Ekelhof 9, L. Eklund 48, I. El Rifai 5,Ch. Elsasser 37, D. Elsby 42, D. Esperante Pereira 34, A. Falabella 14,e, C. Färber 11, G. Fardell 47,C. Farinelli 38, S. Farry 12, V. Fave 36, V. Fernandez Albor 34, F. Ferreira Rodrigues 1, M. Ferro-Luzzi 35,S. Filippov 30, C. Fitzpatrick 35, M. Fontana 10, F. Fontanelli 19,i, R. Forty 35, O. Francisco 2, M. Frank 35,C. Frei 35, M. Frosini 17,f , S. Furcas 20, A. Gallas Torreira 34, D. Galli 14,c, M. Gandelman 2, P. Gandini 52,Y. Gao 3, J.-C. Garnier 35, J. Garofoli 53, P. Garosi 51, J. Garra Tico 44, L. Garrido 33, C. Gaspar 35, R. Gauld 52,E. Gersabeck 11, M. Gersabeck 35, T. Gershon 45,35, Ph. Ghez 4, V. Gibson 44, V.V. Gligorov 35, C. Göbel 54,D. Golubkov 28, A. Golutvin 50,28,35, A. Gomes 2, H. Gordon 52, M. Grabalosa Gándara 33,R. Graciani Diaz 33, L.A. Granado Cardoso 35, E. Graugés 33, G. Graziani 17, A. Grecu 26, E. Greening 52,S. Gregson 44, O. Grünberg 55, B. Gui 53, E. Gushchin 30, Yu. Guz 32, T. Gys 35, C. Hadjivasiliou 53,G. Haefeli 36, C. Haen 35, S.C. Haines 44, S. Hall 50, T. Hampson 43, S. Hansmann-Menzemer 11,N. Harnew 52, S.T. Harnew 43, J. Harrison 51, P.F. Harrison 45, T. Hartmann 55, J. He 7, V. Heijne 38,K. Hennessy 49, P. Henrard 5, J.A. Hernando Morata 34, E. van Herwijnen 35, E. Hicks 49, D. Hill 52,M. Hoballah 5, P. Hopchev 4, W. Hulsbergen 38, P. Hunt 52, T. Huse 49, N. Hussain 52, D. Hutchcroft 49,D. Hynds 48, V. Iakovenko 41, P. Ilten 12, J. Imong 43, R. Jacobsson 35, A. Jaeger 11, M. Jahjah Hussein 5,E. Jans 38, F. Jansen 38, P. Jaton 36, B. Jean-Marie 7, F. Jing 3, M. John 52, D. Johnson 52, C.R. Jones 44,B. Jost 35, M. Kaballo 9, S. Kandybei 40, M. Karacson 35, T.M. Karbach 9, J. Keaveney 12, I.R. Kenyon 42,U. Kerzel 35, T. Ketel 39, A. Keune 36, B. Khanji 20, Y.M. Kim 47, O. Kochebina 7, V. Komarov 36,29,R.F. Koopman 39, P. Koppenburg 38, M. Korolev 29, A. Kozlinskiy 38, L. Kravchuk 30, K. Kreplin 11,M. Kreps 45, G. Krocker 11, P. Krokovny 31, F. Kruse 9, M. Kucharczyk 20,23,j, V. Kudryavtsev 31,T. Kvaratskheliya 28,35, V.N. La Thi 36, D. Lacarrere 35, G. Lafferty 51, A. Lai 15, D. Lambert 47,R.W. Lambert 39, E. Lanciotti 35, G. Lanfranchi 18,35, C. Langenbruch 35, T. Latham 45, C. Lazzeroni 42,R. Le Gac 6, J. van Leerdam 38, J.-P. Lees 4, R. Lefèvre 5, A. Leflat 29,35, J. Lefrançois 7, O. Leroy 6, T. Lesiak 23,Y. Li 3, L. Li Gioi 5, M. Liles 49, R. Lindner 35, C. Linn 11, B. Liu 3, G. Liu 35, J. von Loeben 20, J.H. Lopes 2,E. Lopez Asamar 33, N. Lopez-March 36, H. Lu 3, J. Luisier 36, A. Mac Raighne 48, F. Machefert 7,I.V. Machikhiliyan 4,28, F. Maciuc 26, O. Maev 27,35, J. Magnin 1, M. Maino 20, S. Malde 52, G. Manca 15,d,G. Mancinelli 6, N. Mangiafave 44, U. Marconi 14, R. Märki 36, J. Marks 11, G. Martellotti 22, A. Martens 8,L. Martin 52, A. Martín Sánchez 7, M. Martinelli 38, D. Martinez Santos 35, A. Massafferri 1, Z. Mathe 35,C. Matteuzzi 20, M. Matveev 27, E. Maurice 6, A. Mazurov 16,30,35, J. McCarthy 42, G. McGregor 51,R. McNulty 12, M. Meissner 11, M. Merk 38, J. Merkel 9, D.A. Milanes 13, M.-N. Minard 4,J. Molina Rodriguez 54, S. Monteil 5, D. Moran 51, P. Morawski 23, R. Mountain 53, I. Mous 38, F. Muheim 47,K. Müller 37, R. Muresan 26, B. Muryn 24, B. Muster 36, J. Mylroie-Smith 49, P. Naik 43, T. Nakada 36,R. Nandakumar 46, I. Nasteva 1, M. Needham 47, N. Neufeld 35, A.D. Nguyen 36, C. Nguyen-Mau 36,o,M. Nicol 7, V. Niess 5, N. Nikitin 29, T. Nikodem 11, A. Nomerotski 52,35, A. Novoselov 32,A. Oblakowska-Mucha 24, V. Obraztsov 32, S. Oggero 38, S. Ogilvy 48, O. Okhrimenko 41, R. Oldeman 15,35,d,M. Orlandea 26, J.M. Otalora Goicochea 2, P. Owen 50, B.K. Pal 53, A. Palano 13,b, M. Palutan 18, J. Panman 35,A. Papanestis 46, M. Pappagallo 48, C. Parkes 51, C.J. Parkinson 50, G. Passaleva 17, G.D. Patel 49, M. Patel 50,G.N. Patrick 46, C. Patrignani 19,i, C. Pavel-Nicorescu 26, A. Pazos Alvarez 34, A. Pellegrino 38, G. Penso 22,l,M. Pepe Altarelli 35, S. Perazzini 14,c, D.L. Perego 20,j, E. Perez Trigo 34, A. Pérez-Calero Yzquierdo 33,P. Perret 5, M. Perrin-Terrin 6, G. Pessina 20, K. Petridis 50, A. Petrolini 19,i, A. Phan 53,E. Picatoste Olloqui 33, B. Pie Valls 33, B. Pietrzyk 4, T. Pilar 45, D. Pinci 22, S. Playfer 47, M. Plo Casasus 34,F. Polci 8, G. Polok 23, A. Poluektov 45,31, E. Polycarpo 2, D. Popov 10, B. Popovici 26, C. Potterat 33,A. Powell 52, J. Prisciandaro 36, V. Pugatch 41, A. Puig Navarro 36, W. Qian 3, J.H. Rademacker 43,B. Rakotomiaramanana 36, M.S. Rangel 2, I. Raniuk 40, N. Rauschmayr 35, G. Raven 39, S. Redford 52,

54 LHCb Collaboration / Physics Letters B 718 (2012) 43–55
M.M. Reid 45, A.C. dos Reis 1, S. Ricciardi 46, A. Richards 50, K. Rinnert 49, V. Rives Molina 33,D.A. Roa Romero 5, P. Robbe 7, E. Rodrigues 48,51, P. Rodriguez Perez 34, G.J. Rogers 44, S. Roiser 35,V. Romanovsky 32, A. Romero Vidal 34, J. Rouvinet 36, T. Ruf 35, H. Ruiz 33, G. Sabatino 21,k,J.J. Saborido Silva 34, N. Sagidova 27, P. Sail 48, B. Saitta 15,d, C. Salzmann 37, B. Sanmartin Sedes 34,M. Sannino 19,i, R. Santacesaria 22, C. Santamarina Rios 34, R. Santinelli 35, E. Santovetti 21,k, M. Sapunov 6,A. Sarti 18,l, C. Satriano 22,m, A. Satta 21, M. Savrie 16,e, P. Schaack 50, M. Schiller 39, H. Schindler 35,S. Schleich 9, M. Schlupp 9, M. Schmelling 10, B. Schmidt 35, O. Schneider 36, A. Schopper 35,M.-H. Schune 7, R. Schwemmer 35, B. Sciascia 18, A. Sciubba 18,l, M. Seco 34, A. Semennikov 28,K. Senderowska 24, I. Sepp 50, N. Serra 37, J. Serrano 6, P. Seyfert 11, M. Shapkin 32, I. Shapoval 40,35,P. Shatalov 28, Y. Shcheglov 27, T. Shears 49,35, L. Shekhtman 31, O. Shevchenko 40, V. Shevchenko 28,A. Shires 50, R. Silva Coutinho 45, T. Skwarnicki 53, N.A. Smith 49, E. Smith 52,46, M. Smith 51, K. Sobczak 5,F.J.P. Soler 48, F. Soomro 18,35, D. Souza 43, B. Souza De Paula 2, B. Spaan 9, A. Sparkes 47, P. Spradlin 48,F. Stagni 35, S. Stahl 11, O. Steinkamp 37, S. Stoica 26, S. Stone 53, B. Storaci 38, M. Straticiuc 26,U. Straumann 37, V.K. Subbiah 35, S. Swientek 9, M. Szczekowski 25, P. Szczypka 36,35, T. Szumlak 24,S. T’Jampens 4, M. Teklishyn 7, E. Teodorescu 26, F. Teubert 35, C. Thomas 52, E. Thomas 35, J. van Tilburg 11,V. Tisserand 4, M. Tobin 37, S. Tolk 39, D. Tonelli 35, S. Topp-Joergensen 52, N. Torr 52, E. Tournefier 4,50,S. Tourneur 36, M.T. Tran 36, A. Tsaregorodtsev 6, P. Tsopelas 38, N. Tuning 38, M. Ubeda Garcia 35,A. Ukleja 25, D. Urner 51, U. Uwer 11, V. Vagnoni 14, G. Valenti 14, R. Vazquez Gomez 33,P. Vazquez Regueiro 34, S. Vecchi 16, J.J. Velthuis 43, M. Veltri 17,g , G. Veneziano 36, M. Vesterinen 35,B. Viaud 7, I. Videau 7, D. Vieira 2, X. Vilasis-Cardona 33,n, J. Visniakov 34, A. Vollhardt 37, D. Volyanskyy 10,D. Voong 43, A. Vorobyev 27, V. Vorobyev 31, H. Voss 10, C. Voß 55, R. Waldi 55, R. Wallace 12,S. Wandernoth 11, J. Wang 53, D.R. Ward 44, N.K. Watson 42, A.D. Webber 51, D. Websdale 50,M. Whitehead 45, J. Wicht 35, D. Wiedner 11, L. Wiggers 38, G. Wilkinson 52,∗, M.P. Williams 45,46,M. Williams 50,p, F.F. Wilson 46, J. Wishahi 9, M. Witek 23,35, W. Witzeling 35, S.A. Wotton 44, S. Wright 44,S. Wu 3, K. Wyllie 35, Y. Xie 47, F. Xing 52, Z. Xing 53, Z. Yang 3, R. Young 47, X. Yuan 3, O. Yushchenko 32,M. Zangoli 14, M. Zavertyaev 10,a, F. Zhang 3, L. Zhang 53, W.C. Zhang 12, Y. Zhang 3, A. Zhelezov 11,L. Zhong 3, A. Zvyagin 35
1 Centro Brasileiro de Pesquisas Físicas (CBPF), Rio de Janeiro, Brazil2 Universidade Federal do Rio de Janeiro (UFRJ), Rio de Janeiro, Brazil3 Center for High Energy Physics, Tsinghua University, Beijing, China4 LAPP, Université de Savoie, CNRS/IN2P3, Annecy-Le-Vieux, France5 Clermont Université, Université Blaise Pascal, CNRS/IN2P3, LPC, Clermont-Ferrand, France6 CPPM, Aix-Marseille Université, CNRS/IN2P3, Marseille, France7 LAL, Université Paris-Sud, CNRS/IN2P3, Orsay, France8 LPNHE, Université Pierre et Marie Curie, Université Paris Diderot, CNRS/IN2P3, Paris, France9 Fakultät Physik, Technische Universität Dortmund, Dortmund, Germany10 Max-Planck-Institut für Kernphysik (MPIK), Heidelberg, Germany11 Physikalisches Institut, Ruprecht-Karls-Universität Heidelberg, Heidelberg, Germany12 School of Physics, University College Dublin, Dublin, Ireland13 Sezione INFN di Bari, Bari, Italy14 Sezione INFN di Bologna, Bologna, Italy15 Sezione INFN di Cagliari, Cagliari, Italy16 Sezione INFN di Ferrara, Ferrara, Italy17 Sezione INFN di Firenze, Firenze, Italy18 Laboratori Nazionali dell’INFN di Frascati, Frascati, Italy19 Sezione INFN di Genova, Genova, Italy20 Sezione INFN di Milano Bicocca, Milano, Italy21 Sezione INFN di Roma Tor Vergata, Roma, Italy22 Sezione INFN di Roma La Sapienza, Roma, Italy23 Henryk Niewodniczanski Institute of Nuclear Physics, Polish Academy of Sciences, Kraków, Poland24 AGH University of Science and Technology, Kraków, Poland25 National Center for Nuclear Research (NCBJ), Warsaw, Poland26 Horia Hulubei National Institute of Physics and Nuclear Engineering, Bucharest-Magurele, Romania27 Petersburg Nuclear Physics Institute (PNPI), Gatchina, Russia28 Institute of Theoretical and Experimental Physics (ITEP), Moscow, Russia29 Institute of Nuclear Physics, Moscow State University (SINP MSU), Moscow, Russia30 Institute for Nuclear Research of the Russian Academy of Sciences (INR RAN), Moscow, Russia31 Budker Institute of Nuclear Physics (SB RAS) and Novosibirsk State University, Novosibirsk, Russia32 Institute for High Energy Physics (IHEP), Protvino, Russia33 Universitat de Barcelona, Barcelona, Spain34 Universidad de Santiago de Compostela, Santiago de Compostela, Spain35 European Organization for Nuclear Research (CERN), Geneva, Switzerland36 Ecole Polytechnique Fédérale de Lausanne (EPFL), Lausanne, Switzerland37 Physik-Institut, Universität Zürich, Zürich, Switzerland

LHCb Collaboration / Physics Letters B 718 (2012) 43–55 55
38 Nikhef National Institute for Subatomic Physics, Amsterdam, The Netherlands39 Nikhef National Institute for Subatomic Physics and VU University Amsterdam, Amsterdam, The Netherlands40 NSC Kharkiv Institute of Physics and Technology (NSC KIPT), Kharkiv, Ukraine41 Institute for Nuclear Research of the National Academy of Sciences (KINR), Kyiv, Ukraine42 University of Birmingham, Birmingham, United Kingdom43 H.H. Wills Physics Laboratory, University of Bristol, Bristol, United Kingdom44 Cavendish Laboratory, University of Cambridge, Cambridge, United Kingdom45 Department of Physics, University of Warwick, Coventry, United Kingdom46 STFC Rutherford Appleton Laboratory, Didcot, United Kingdom47 School of Physics and Astronomy, University of Edinburgh, Edinburgh, United Kingdom48 School of Physics and Astronomy, University of Glasgow, Glasgow, United Kingdom49 Oliver Lodge Laboratory, University of Liverpool, Liverpool, United Kingdom50 Imperial College London, London, United Kingdom51 School of Physics and Astronomy, University of Manchester, Manchester, United Kingdom52 Department of Physics, University of Oxford, Oxford, United Kingdom53 Syracuse University, Syracuse, NY, United States54 Pontifícia Universidade Católica do Rio de Janeiro (PUC-Rio), Rio de Janeiro, Brazil q
55 Institut für Physik, Universität Rostock, Rostock, Germany r
* Corresponding author.E-mail address: [email protected] (G. Wilkinson).
a P.N. Lebedev Physical Institute, Russian Academy of Science (LPI RAS), Moscow, Russia.b Università di Bari, Bari, Italy.c Università di Bologna, Bologna, Italy.d Università di Cagliari, Cagliari, Italy.e Università di Ferrara, Ferrara, Italy.f Università di Firenze, Firenze, Italy.g Università di Urbino, Urbino, Italy.h Università di Modena e Reggio Emilia, Modena, Italy.i Università di Genova, Genova, Italy.j Università di Milano Bicocca, Milano, Italy.k Università di Roma Tor Vergata, Roma, Italy.l Università di Roma La Sapienza, Roma, Italy.
m Università della Basilicata, Potenza, Italy.n LIFAELS, La Salle, Universitat Ramon Llull, Barcelona, Spain.o Hanoi University of Science, Hanoi, Viet Nam.p Massachusetts Institute of Technology, Cambridge, MA, United States.q Associated to Universidade Federal do Rio de Janeiro (UFRJ), Rio de Janeiro, Brazil.r Associated to Physikalisches Institut, Ruprecht-Karls-Universität Heidelberg, Heidelberg, Germany.