Embed Size (px)
Citation preview

A Research Agenda for Water Smart Tropical and Sub-Tropical Cities and Towns
Sharon BiermannWater Smart Cities
Science Forum, 19-20 June 2012
Urban Water Security Research Alliance
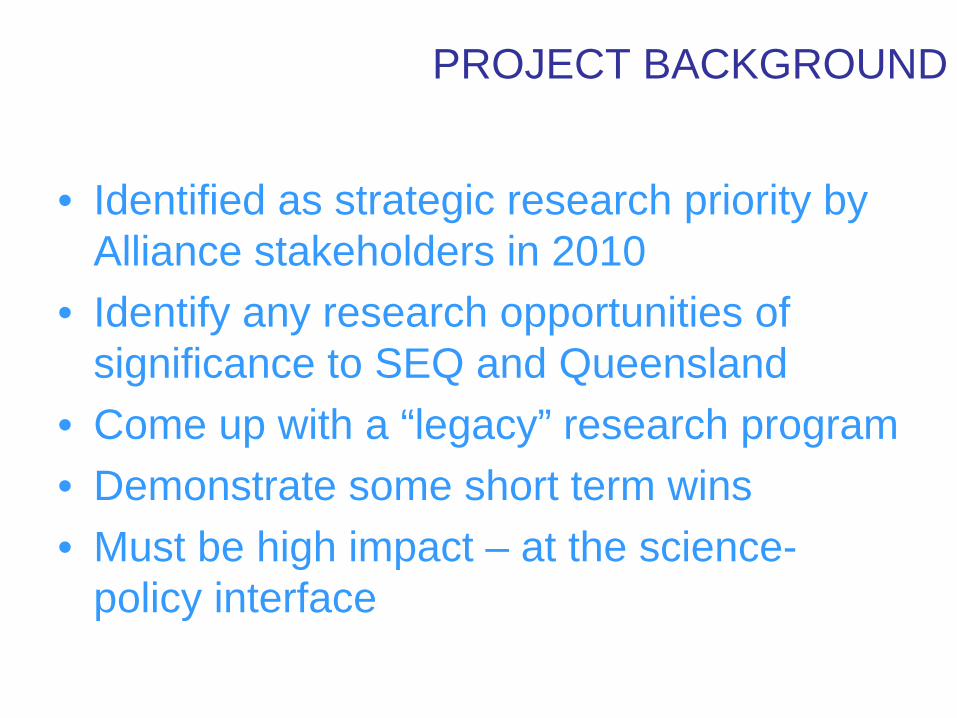
PROJECT BACKGROUND
• Identified as strategic research priority by Alliance stakeholders in 2010
• Identify any research opportunities of significance to SEQ and Queensland
• Come up with a “legacy” research program• Demonstrate some short term wins• Must be high impact – at the science-
policy interface
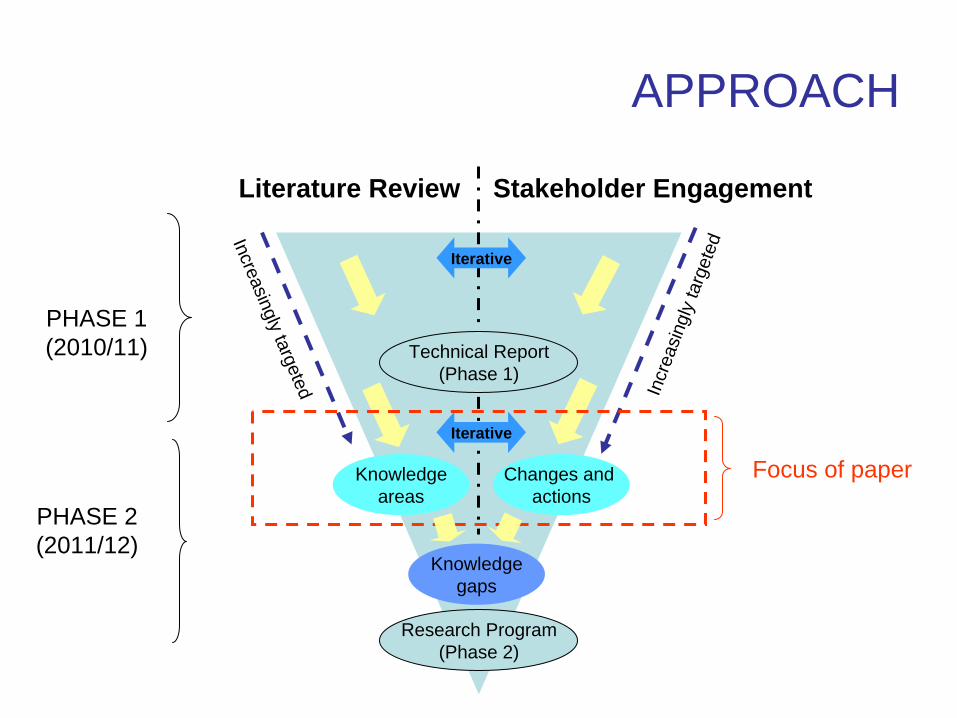
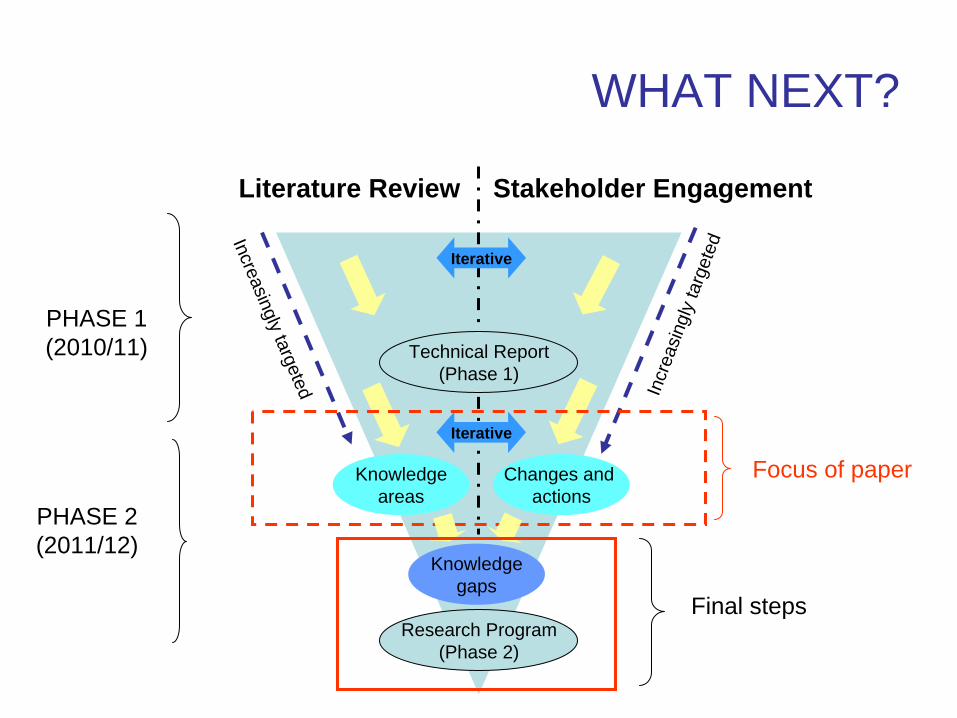
APPROACH
PHASE 1(2010/11)
PHASE 2(2011/12)
Stakeholder EngagementLiterature Review
Incr
easi
ngly
targ
etedIterative
Iterative
Knowledgegaps
Technical Report(Phase 1)
Research Program(Phase 2)
Changes and actions
Knowledgeareas
Increasingly targeted
Focus of paper
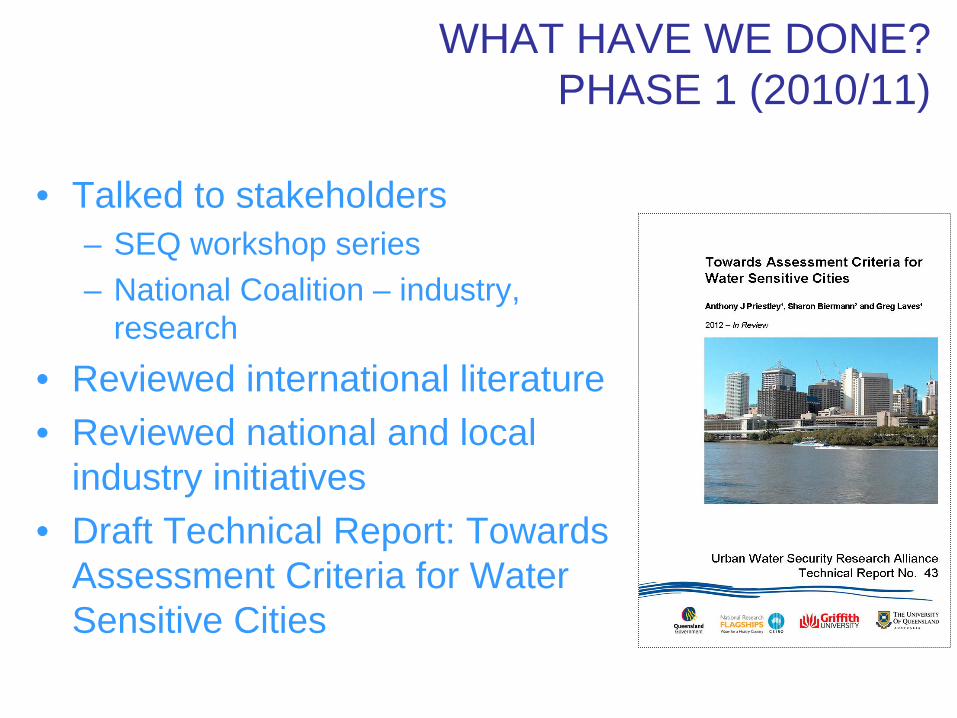
WHAT HAVE WE DONE? PHASE 1 (2010/11)
• Talked to stakeholders– SEQ workshop series– National Coalition – industry,
research• Reviewed international literature• Reviewed national and local
industry initiatives• Draft Technical Report: Towards
Assessment Criteria for Water Sensitive Cities

KNOWLEDGE GAPS IDENTIFIED (PHASE 1)
• Barriers to adoption• Common, guiding Conceptual Framework
– Urban metabolism based?– Paradigm of cities as integrated, complex, adaptive socio-ecological
systems• Comparable (space and time) performance indicators• Land use – water integration
– Integrate water systems design into planning considerations for the overall city
• Water- energy-carbon integration– Integrate aspects within area of resource efficiency - energy and water,
nutrients• Integration of area within its wider regional context
– virtual water flows through import of food, energy and materials• Tools/models
– Integrate resource use efficiency tools/aspects with other tools to answer questions related to factors such as cost, resilience and risk
• City/regional level rather than building and cluster scale
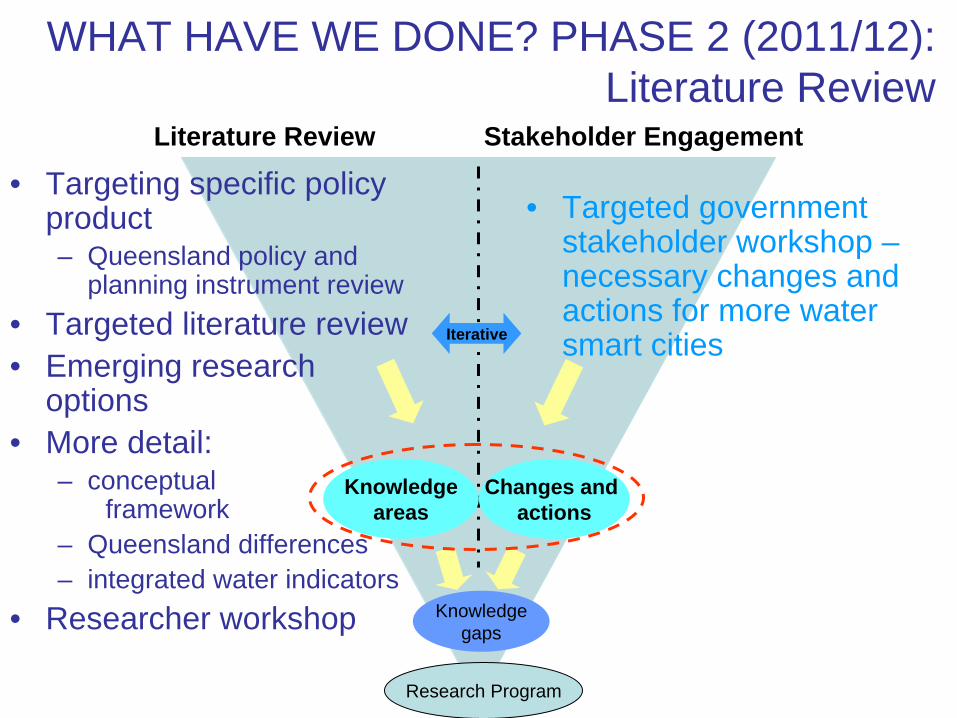
WHAT HAVE WE DONE? PHASE 2 (2011/12): Literature Review
Stakeholder EngagementLiterature Review
Knowledgegaps
Research Program
Changes and actions
Knowledgeareas
• Targeting specific policy product– Queensland policy and
planning instrument review• Targeted literature review• Emerging research
options• More detail:
– conceptual framework
– Queensland differences– integrated water indicators
• Researcher workshop
• Targeted government stakeholder workshop – necessary changes and actions for more water smart citiesIterative
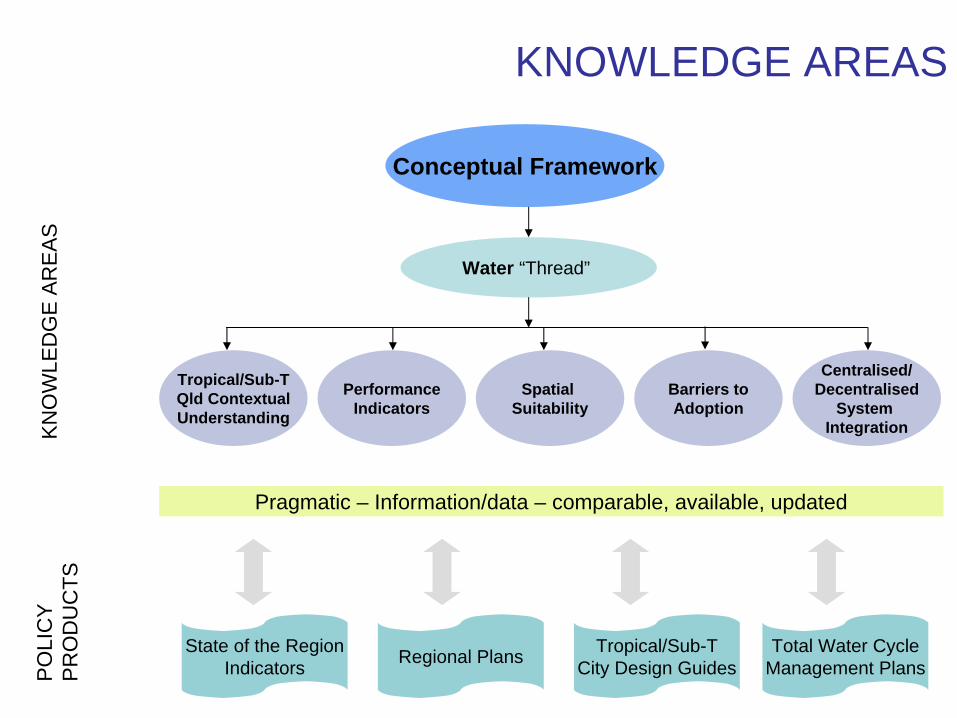
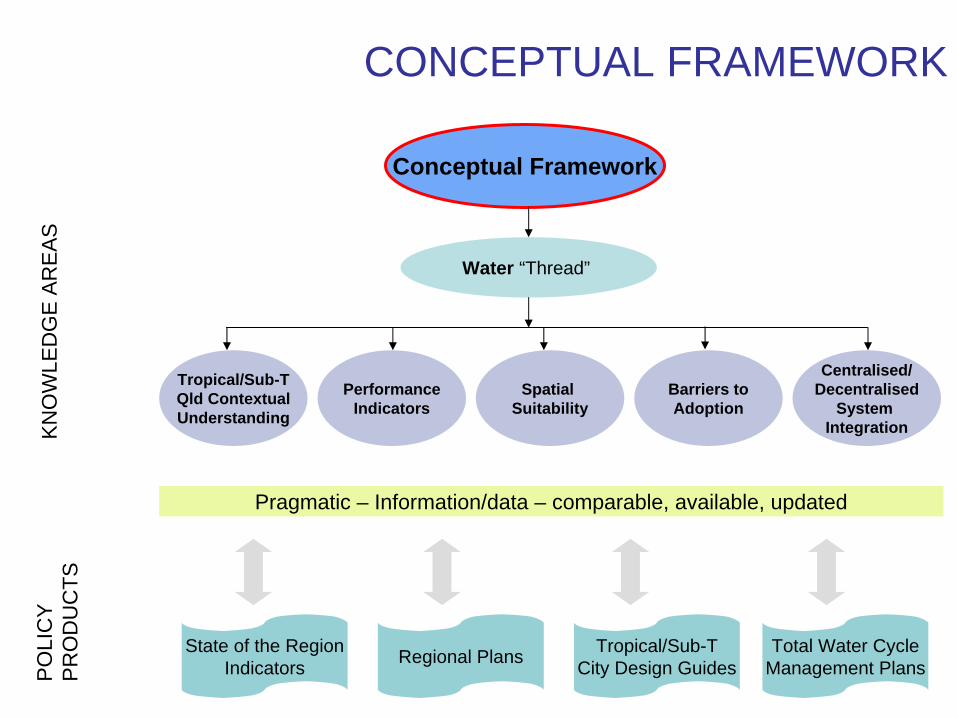
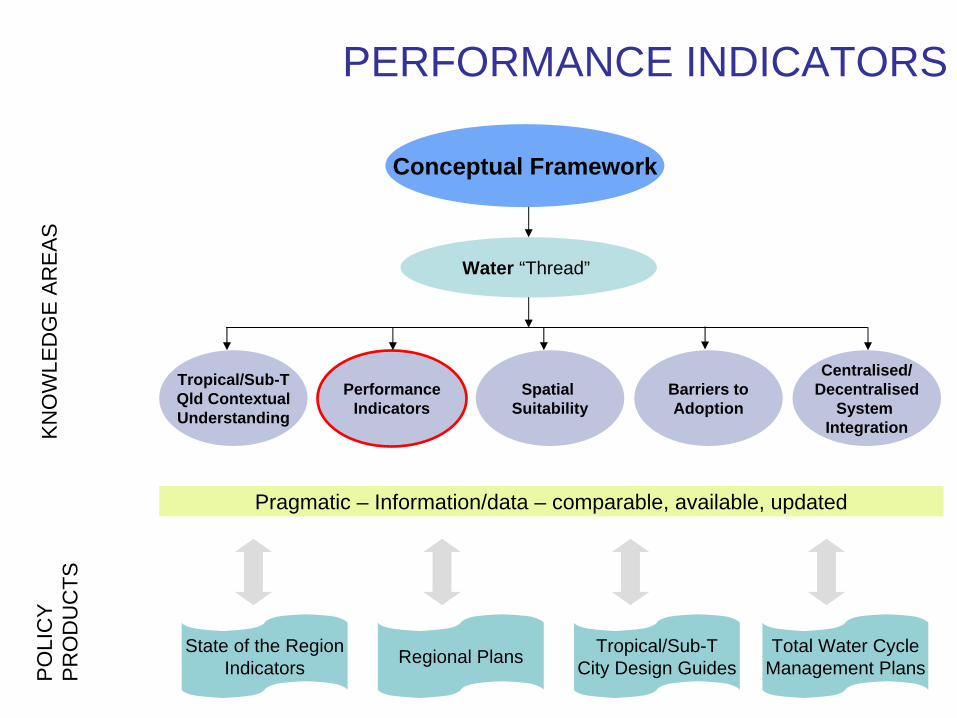
KNOWLEDGE AREAS
Conceptual Framework
Water “Thread”
KNO
WLE
DG
E AR
EAS
PO
LIC
YPR
OD
UC
TS
Tropical/Sub-TQld ContextualUnderstanding
PerformanceIndicators
Spatial Suitability
Barriers toAdoption
Centralised/Decentralised
System Integration
Pragmatic – Information/data – comparable, available, updated
State of the RegionIndicators Regional Plans Tropical/Sub-T
City Design GuidesTotal Water Cycle
Management Plans
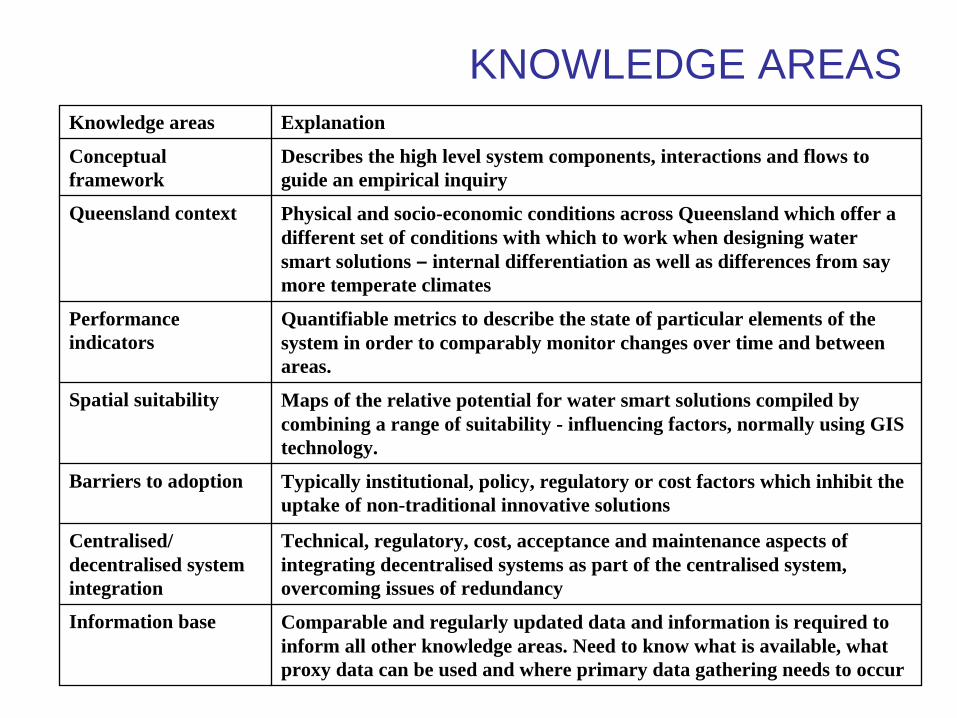
KNOWLEDGE AREASKnowledge areas Explanation
Conceptual framework
Describes the high level system components, interactions and flows to guide an empirical inquiry
Queensland context Physical and socio-economic conditions across Queensland which offer a different set of conditions with which to work when designing water smart solutions – internal differentiation as well as differences from say more temperate climates
Performance indicators
Quantifiable metrics to describe the state of particular elements of the system in order to comparably monitor changes over time and between areas.
Spatial suitability Maps of the relative potential for water smart solutions compiled by combining a range of suitability - influencing factors, normally using GIS technology.
Barriers to adoption Typically institutional, policy, regulatory or cost factors which inhibit the uptake of non-traditional innovative solutions
Centralised/ decentralised system integration
Technical, regulatory, cost, acceptance and maintenance aspects of integrating decentralised systems as part of the centralised system, overcoming issues of redundancy
Information base Comparable and regularly updated data and information is required to inform all other knowledge areas. Need to know what is available, what proxy data can be used and where primary data gathering needs to occur
CONCEPTUAL FRAMEWORK
Conceptual Framework
Water “Thread”
KNO
WLE
DG
E AR
EAS
PO
LIC
YPR
OD
UC
TS
Tropical/Sub-TQld ContextualUnderstanding
PerformanceIndicators
Spatial Suitability
Barriers toAdoption
Centralised/Decentralised
System Integration
Pragmatic – Information/data – comparable, available, updated
State of the RegionIndicators Regional Plans Tropical/Sub-T
City Design GuidesTotal Water Cycle
Management Plans

CONCEPTUAL FRAMEWORK ADVANCES• What should the objective be? Then, what is the appropriate
model– Metabolic efficiency, resilience, stability?
• Flows, feedback loops, cause and effects critical• Beyond just material and energy flows
– Physical networked flows along built infrastructure– Social and spatial factor incorporation
• From simple “dualistic” view of society and nature to more complex interweaving of social and biophysical processes
• The resource consumption – economic growth link – dematerialisation (decoupling)
• Identify the water thread (indicators developed along that thread)
• Pragmatic – subsets, data availability and comparability, data “creation” (downscaling)
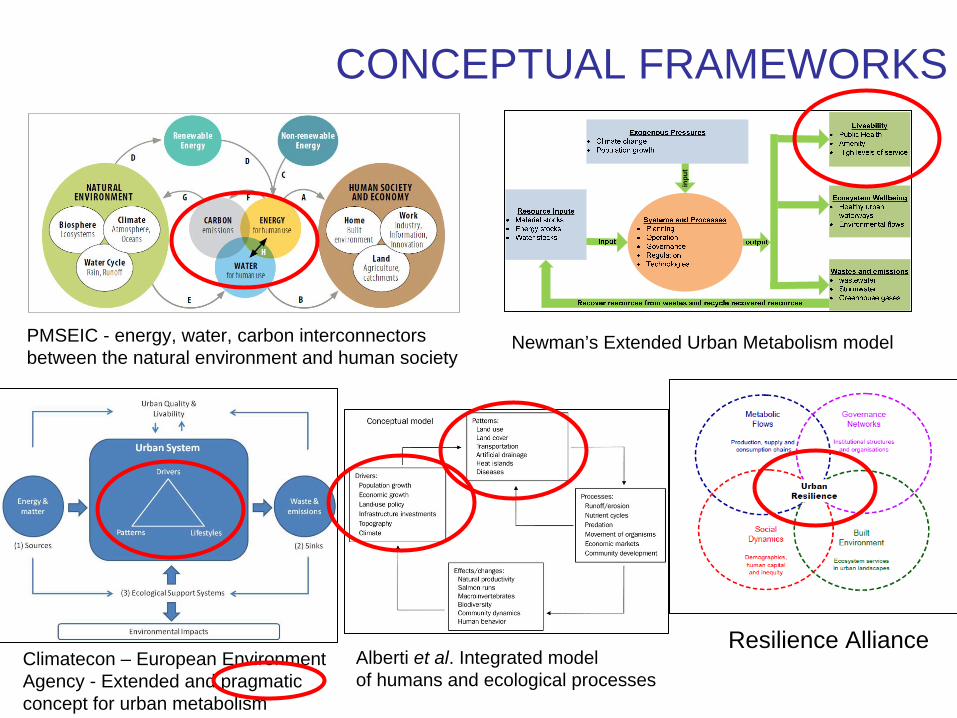
CONCEPTUAL FRAMEWORKS
Resilience Alliance
Newman’s Extended Urban Metabolism modelPMSEIC - energy, water, carbon interconnectorsbetween the natural environment and human society
inpu
t
Climatecon – European EnvironmentAgency - Extended and pragmaticconcept for urban metabolism
Alberti et al. Integrated modelof humans and ecological processes
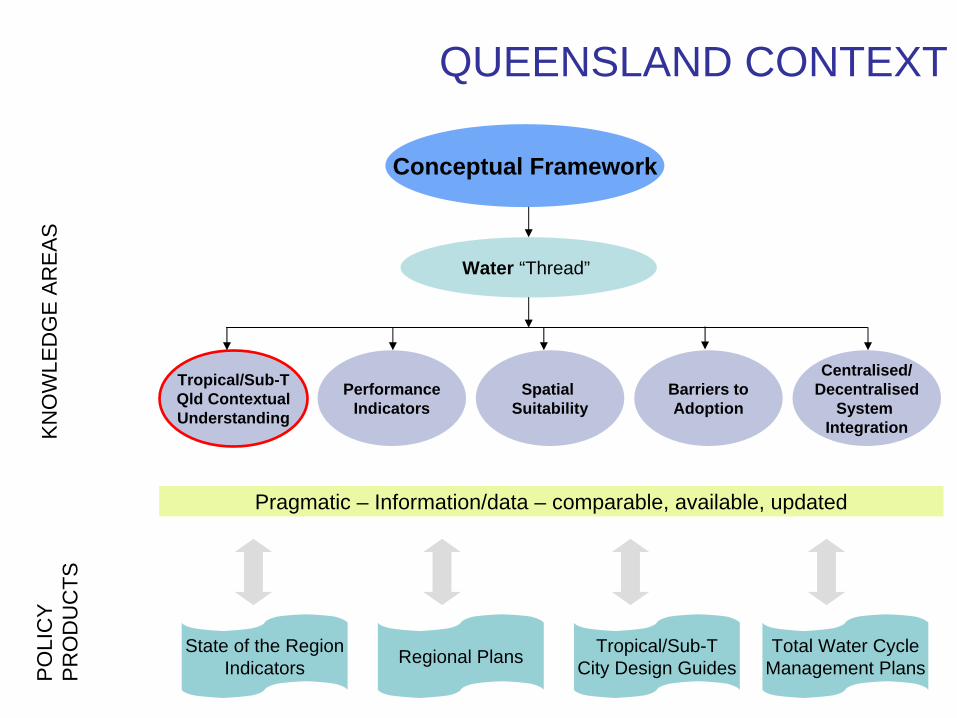
QUEENSLAND CONTEXT
Conceptual Framework
Water “Thread”
KNO
WLE
DG
E AR
EAS
PO
LIC
YPR
OD
UC
TS
Tropical/Sub-TQld ContextualUnderstanding
PerformanceIndicators
Spatial Suitability
Barriers toAdoption
Centralised/Decentralised
System Integration
Pragmatic – Information/data – comparable, available, updated
State of the RegionIndicators Regional Plans Tropical/Sub-T
City Design GuidesTotal Water Cycle
Management Plans
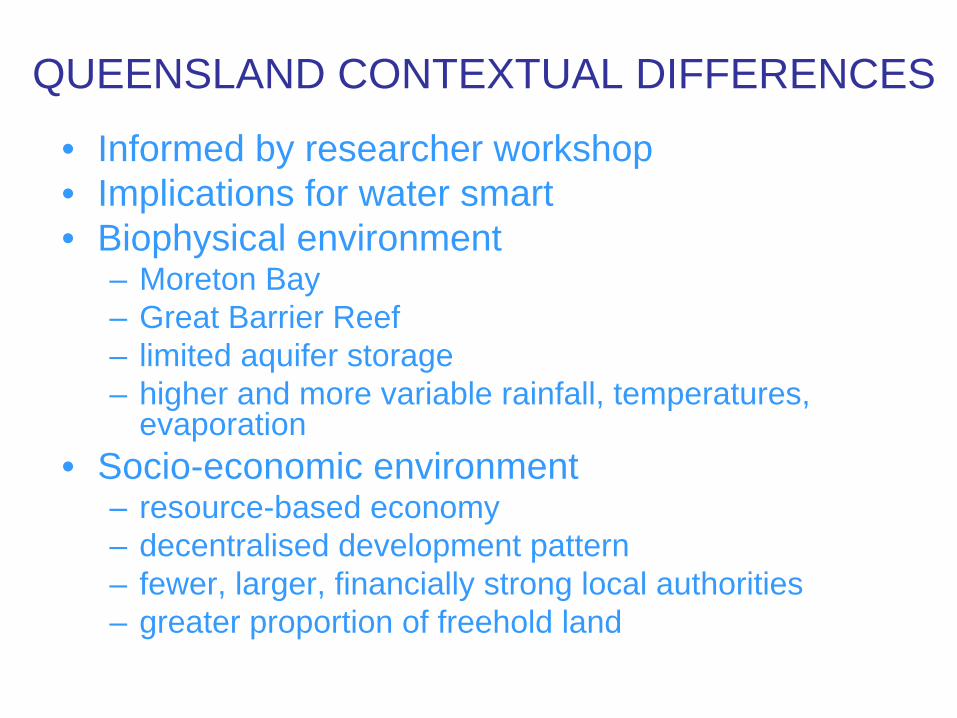
QUEENSLAND CONTEXTUAL DIFFERENCES
• Informed by researcher workshop• Implications for water smart• Biophysical environment
– Moreton Bay– Great Barrier Reef– limited aquifer storage– higher and more variable rainfall, temperatures,
evaporation• Socio-economic environment
– resource-based economy– decentralised development pattern– fewer, larger, financially strong local authorities– greater proportion of freehold land
PERFORMANCE INDICATORS
Conceptual Framework
Water “Thread”
KNO
WLE
DG
E AR
EAS
PO
LIC
YPR
OD
UC
TS
Tropical/Sub-TQld ContextualUnderstanding
PerformanceIndicators
Spatial Suitability
Barriers toAdoption
Centralised/Decentralised
System Integration
Pragmatic – Information/data – comparable, available, updated
State of the RegionIndicators Regional Plans Tropical/Sub-T
City Design GuidesTotal Water Cycle
Management Plans
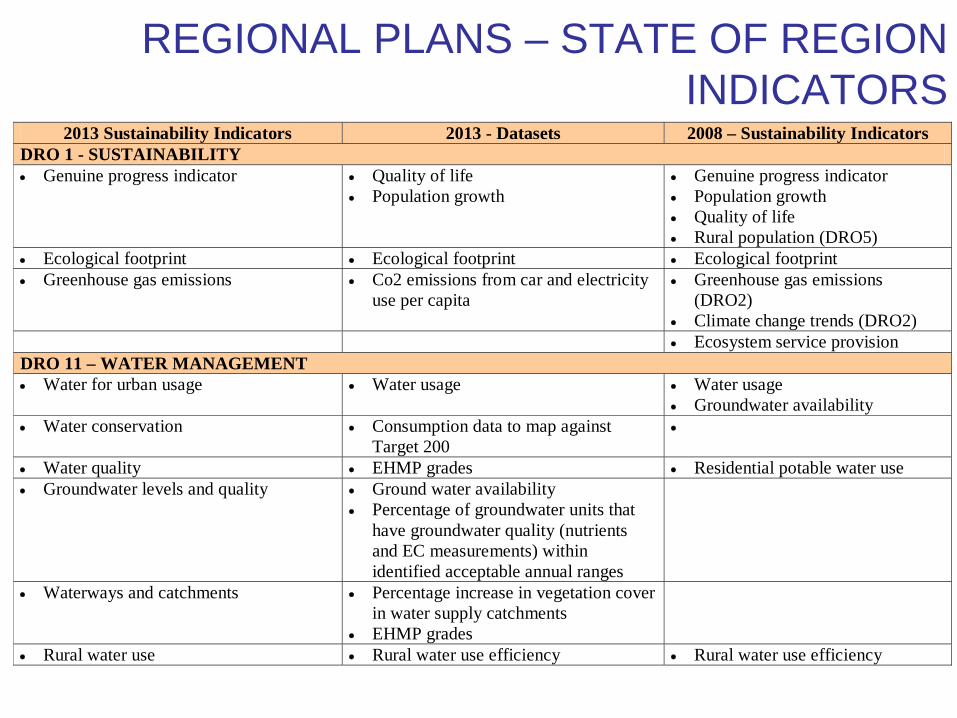
REGIONAL PLANS – STATE OF REGION INDICATORS
2013 Sustainability Indicators 2013 - Datasets 2008 – Sustainability Indicators DRO 1 - SUSTAINABILITY Genuine progress indicator Quality of life
Population growth Genuine progress indicator Population growth Quality of life Rural population (DRO5)
Ecological footprint Ecological footprint Ecological footprint Greenhouse gas emissions Co2 emissions from car and electricity
use per capita Greenhouse gas emissions
(DRO2) Climate change trends (DRO2)
Ecosystem service provision DRO 11 – WATER MANAGEMENT Water for urban usage Water usage Water usage
Groundwater availability Water conservation Consumption data to map against
Target 200
Water quality EHMP grades Residential potable water use Groundwater levels and quality Ground water availability
Percentage of groundwater units that have groundwater quality (nutrients and EC measurements) within identified acceptable annual ranges
Waterways and catchments Percentage increase in vegetation cover in water supply catchments
EHMP grades
Rural water use Rural water use efficiency Rural water use efficiency

INTEGRATED INDICATORS
• State of Region Indicators– Propose 2-3 “new” integrated indicators for DRO 11
Water Management and /or DRO 1 Sustainability – mass balance - related (Kenway et al., 2011);– City Blueprint – 24 indicators to assess sustainability of
the urban water cycle, water footprints-based, 2012
• Integrated (relational/intensity) indicators, informed by conceptual framework– Water-water– Water-energy– Water-economic growth– Water-social

WHAT HAVE WE DONE? PHASE 2 (2011/12): Stakeholder Engagement
Stakeholder EngagementLiterature Review
Knowledgegaps
Research Program
Changes and actions
Knowledgeareas
• Targeting specific policy product– Queensland policy and
planning instrument review• Targeted literature review• Emerging research
options• More detail:
– conceptual framework
– Queensland differences– integrated water indicators
• Researcher workshop
• Targeted government stakeholder workshop – necessary changes and actions for more water smart citiesIterative

GOVERNMENT STAKEHOLDER WORKSHOP
• What needs to change to achieve more water smart cities and towns in tropical and sub-tropical Queensland?– and where should we be focussing our
attention?• What can we do better to get change
happening?• Overcoming barriers? Actions for change?• Which are the most important?• How achievable (easy/hard) and effective are the
actions for change?
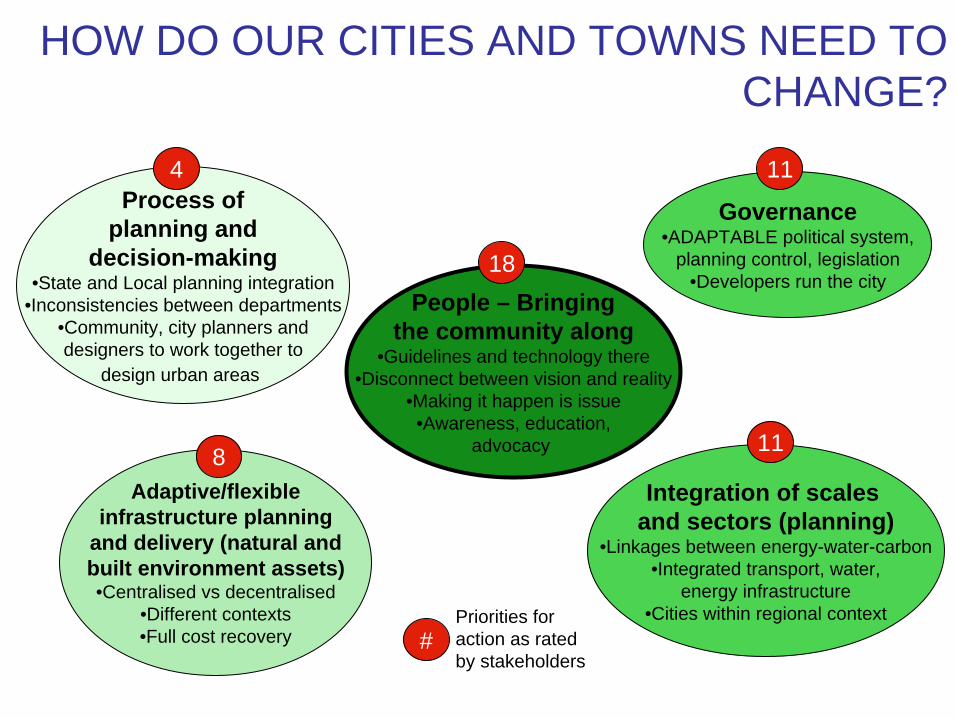
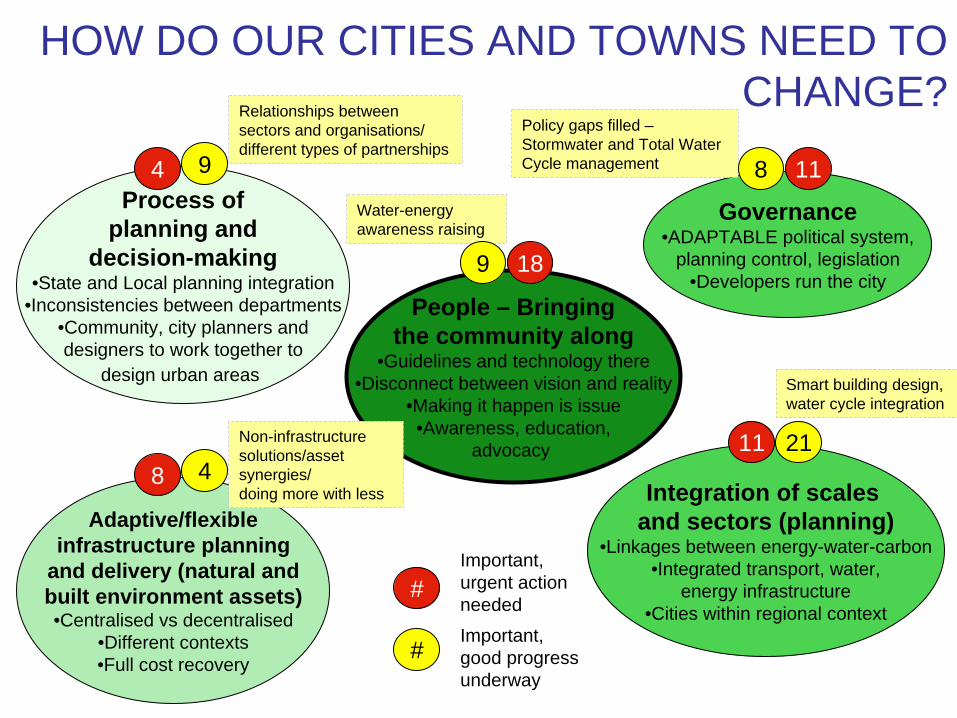
HOW DO OUR CITIES AND TOWNS NEED TO CHANGE?
Process ofplanning and
decision-making•State and Local planning integration
•Inconsistencies between departments•Community, city planners anddesigners to work together to
design urban areas
People – Bringingthe community along
•Guidelines and technology there•Disconnect between vision and reality
•Making it happen is issue•Awareness, education,
advocacy
Adaptive/flexibleinfrastructure planning
and delivery (natural andbuilt environment assets)•Centralised vs decentralised
•Different contexts•Full cost recovery
Integration of scales and sectors (planning)
•Linkages between energy-water-carbon•Integrated transport, water,
energy infrastructure•Cities within regional context
Governance•ADAPTABLE political system,
planning control, legislation•Developers run the city
18
11
11
8
4
#Priorities for action as rated by stakeholders
HOW DO OUR CITIES AND TOWNS NEED TO CHANGE?
Process ofplanning and
decision-making•State and Local planning integration
•Inconsistencies between departments•Community, city planners anddesigners to work together to
design urban areas
People – Bringingthe community along
•Guidelines and technology there•Disconnect between vision and reality
•Making it happen is issue•Awareness, education,
advocacy
Adaptive/flexibleinfrastructure planning
and delivery (natural andbuilt environment assets)•Centralised vs decentralised
•Different contexts•Full cost recovery
Integration of scales and sectors (planning)
•Linkages between energy-water-carbon•Integrated transport, water,
energy infrastructure•Cities within regional context
Governance•ADAPTABLE political system,
planning control, legislation•Developers run the city
18
11
11
8
4
4
Relationships between sectors and organisations/ different types of partnerships
9
Non-infrastructure solutions/asset synergies/doing more with less
Policy gaps filled – Stormwater and Total Water Cycle management 8
Water-energy awareness raising
9
21
Smart building design, water cycle integration
Important,urgent action needed Important,good progress underway
#
#

ACTIONS FOR CHANGE
• Most actions relate to “People – bringing the community along”
• Easy-effective - high level community engagement, awareness-raising to effect behavioural change
• Effective-harder - evidence-based, targeted information to create a deeper level of awareness and understanding of issues to– effect a change in behaviour – enable community participation in
infrastructure planning, visioning eg, making things costs and benefits clear and transparent so that informed decision-making can take place on the basis of shared understanding of implications
HARD
EFFECTIVE
1
2
4
3
5 6 7
8 9 10 12
13 14 15 16
17
1918
11
EASY
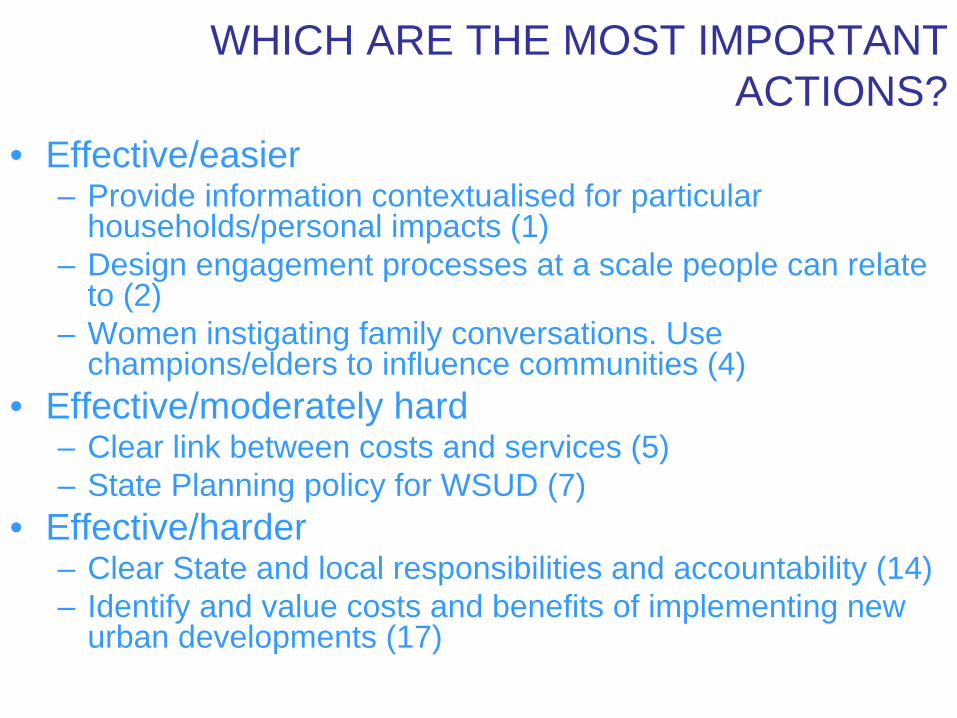
WHICH ARE THE MOST IMPORTANT ACTIONS?
• Effective/easier– Provide information contextualised for particular
households/personal impacts (1)– Design engagement processes at a scale people can relate
to (2)– Women instigating family conversations. Use
champions/elders to influence communities (4)• Effective/moderately hard
– Clear link between costs and services (5)– State Planning policy for WSUD (7)
• Effective/harder– Clear State and local responsibilities and accountability (14)– Identify and value costs and benefits of implementing new
urban developments (17)
WHAT NEXT?
PHASE 1(2010/11)
PHASE 2(2011/12)
Stakeholder EngagementLiterature Review
Incr
easi
ngly
targ
etedIterative
Iterative
Knowledgegaps
Technical Report(Phase 1)
Research Program(Phase 2)
Changes and actions
Knowledgeareas
Increasingly targeted
Focus of paper
Final steps

Urban Water Security Research Alliance
THANK YOU
www.urbanwateralliance.org.au