Embed Size (px)
Citation preview
A STUDYGUIDE by RobeRt lewis & AndRew Fildes
www.metromagazine.com.au
www.theeducationshop.com.au
a global warning
by far the most terrifying film you will ever see
a n i n c o n v e n i e n t t r u t h
OVERVIEW
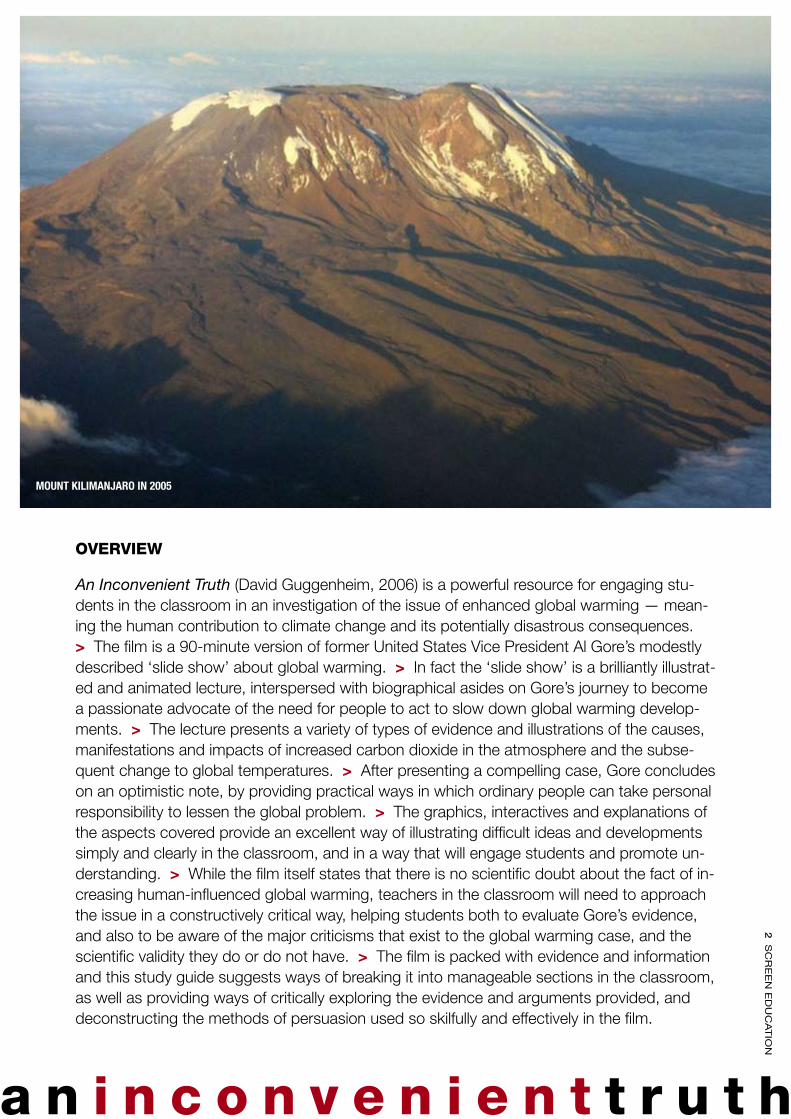
An Inconvenient Truth (David Guggenheim, 2006) is a powerful resource for engaging stu-dents in the classroom in an investigation of the issue of enhanced global warming — mean-ing the human contribution to climate change and its potentially disastrous consequences. > The film is a 90-minute version of former United States Vice President Al Gore’s modestly described ‘slide show’ about global warming. > In fact the ‘slide show’ is a brilliantly illustrat-ed and animated lecture, interspersed with biographical asides on Gore’s journey to become a passionate advocate of the need for people to act to slow down global warming develop-ments. > The lecture presents a variety of types of evidence and illustrations of the causes, manifestations and impacts of increased carbon dioxide in the atmosphere and the subse-quent change to global temperatures. > After presenting a compelling case, Gore concludes on an optimistic note, by providing practical ways in which ordinary people can take personal responsibility to lessen the global problem. > The graphics, interactives and explanations of the aspects covered provide an excellent way of illustrating difficult ideas and developments simply and clearly in the classroom, and in a way that will engage students and promote un-derstanding. > While the film itself states that there is no scientific doubt about the fact of in-creasing human-influenced global warming, teachers in the classroom will need to approach the issue in a constructively critical way, helping students both to evaluate Gore’s evidence, and also to be aware of the major criticisms that exist to the global warming case, and the scientific validity they do or do not have. > The film is packed with evidence and information and this study guide suggests ways of breaking it into manageable sections in the classroom, as well as providing ways of critically exploring the evidence and arguments provided, and deconstructing the methods of persuasion used so skilfully and effectively in the film.
Mount KiliManjaro in 2005
� S
Cr
EE
n E
DU
Ca
Tio
n
a n i n c o n v e n i e n t t r u t h
CURRICULUM APPLICABILITY
An Inconvenient Truth will be a rich and challenging resource for middle and senior secondary and tertiary level students in:
• Geography/Society and Environment – Care and management of places
• Science – The scientific method and global warming
• English – Exploring contemporary issues• Media Studies – analysing an activist documentary• Information Technology – ways of presenting infor-
mation• Environmental Studies – global problems and their
solutions• Civics and Citizenship – People’s and governments’
rights and responsibilities• Values Education – Ethical and moral behaviour
BEfOREWATCHINGTHEfILMBrainstorm about global warming
1 Have students brainstorm their knowledge and ideas about global warming. record these on a white-board.
2 ask students to classify their ideas into:
• Definite facts• Possible facts• Theories or explanations. Students should come back to
this list after watching the film, and commenting on whether they would now change any aspects of it.
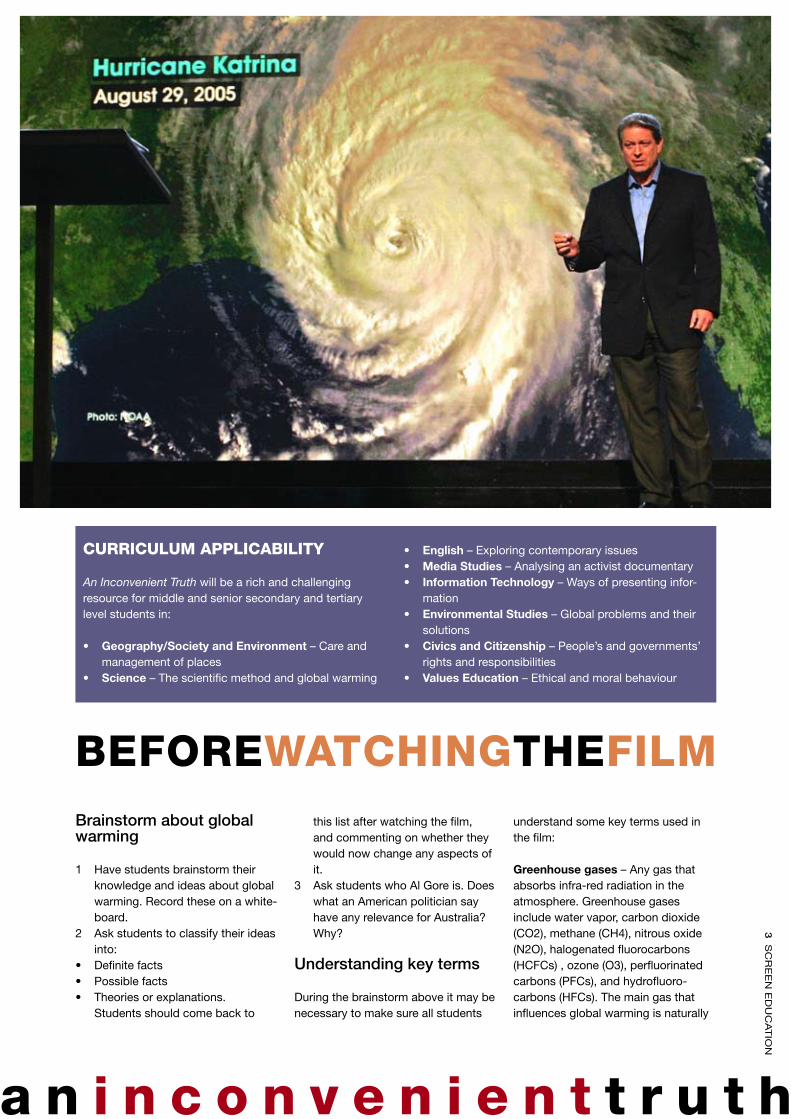
3 ask students who al gore is. Does what an american politician say have any relevance for australia? why?
Understanding key terms
During the brainstorm above it may be necessary to make sure all students
understand some key terms used in the film:
Greenhouse gases – any gas that absorbs infra-red radiation in the atmosphere. greenhouse gases include water vapor, carbon dioxide (Co2), methane (CH4), nitrous oxide (n2o), halogenated fluorocarbons (HCFCs) , ozone (o3), perfluorinated carbons (PFCs), and hydrofluoro-carbons (HFCs). The main gas that influences global warming is naturally
� S
Cr
EE
n E
DU
Ca
Tio
n
a n i n c o n v e n i e n t t r u t h
occurring water vapour. The main one produced by human activity is carbon dioxide.
Carbon dioxide – The gas released by the burning of fossil fuels such as oil.
Global warming – The observable increase in global temperatures caused by the emission of gases that trap the sun’s heat in the Earth’s atmosphere.
Climate change – a statistically signif-icant difference in the measurements of either the mean state or variability of the climate in a place or region over an extended period of time, typically decades or longer.
http://www.answers.com/topic/green-house-gas
Understanding the science – Global warming experiments
Have students carry out these experi-ments to help them understand the science of greenhouse gases and global warming.
1. Measuring Carbon dioxide samples (Grade level: senior)
To compare differing proportions of Carbon Dioxide (CO2) in gases from different sources
resources: For each group - 2 to 4 students• Test tubes and stand• a graduated cylinder• a funnel straw• a marble-size piece of plasticine
• 4 different coloured balloons• 4 twist-ties or balloon clips• a narrow-necked bottle (the neck
should be narrow enough for a bal-loon to fit over it)
• a dropper bottle of bromthymol blue indicator solution
• a dropper bottle of dilute house-hold ammonia (1:50 ammonia to distilled water)
• 100 ml vinegar• 5 ml baking soda• Safety goggles to wear at all times• access to a bicycle tyre pump or
balloon pump
Teacher’s Notes:
The students will fill balloons with carbon dioxide, exhaled air, and ambi-ent air. You (the teacher) should fill the balloons containing the car exhaust gases. For safety reasons, you should wear thick gloves to protect your hands from being burned. Fill the balloons in an open area and when a slight breeze is blowing to keep the exhaust gases away from your face. Place a balloon over the narrow end of a metal funnel and place the wide end of the funnel over the exhaust pipe of a running car. when inflated, the bal-loons should be about 7.5 cm in diam-eter. it may be easier to over-inflate the balloon and then let a little gas escape. Twist and tie off the balloon or use a clip. repeat the procedure with the same color balloon until you have one for each group of students.
note that the air solution in tube a will not turn yellow. The level of Co2 in ambient air is too low to affect bromthymol blue.
Students will need around 60 drops of the diluted ammonia to neutralize the solution in test tube D (vinegar-baking soda reaction). The other two vials should require between 7 and 40 drops. warn students to add the drops slowly and shake solutions between drops so they can get a careful record of when the color changes back to the same color blue as the control.
Since the students will have to add a relatively large amount of ammonia to the solution in vial D, the color of this sample may be affected by dilution. To equalize this effect, you can tell stu-dents to add some water to the other samples to make the volume in each sample equal. This is easiest to do if sample D is titrated last.
You should demonstrate the balloon procedure first to avoid error.
Procedure:
1. add 15 ml of water and 10 drops of bromthymol blue indicator solu-tion to each test tube. label the vials a, b, C, D, and Control.
2. Fill each balloon until it has a 7.5cm diameter.
Sample A (Ambient Air) – Use a tyre pump to inflate the bal-loon to the required diameter. Twist the rubber neck of the balloon and fasten it shut with a twist tie. The tie should be at least 1 cm from the opening of the balloon. record the colour of the balloon used for this sample.Sample B (Human Exhalation) – Have one team member blow up a balloon to the required
-
-
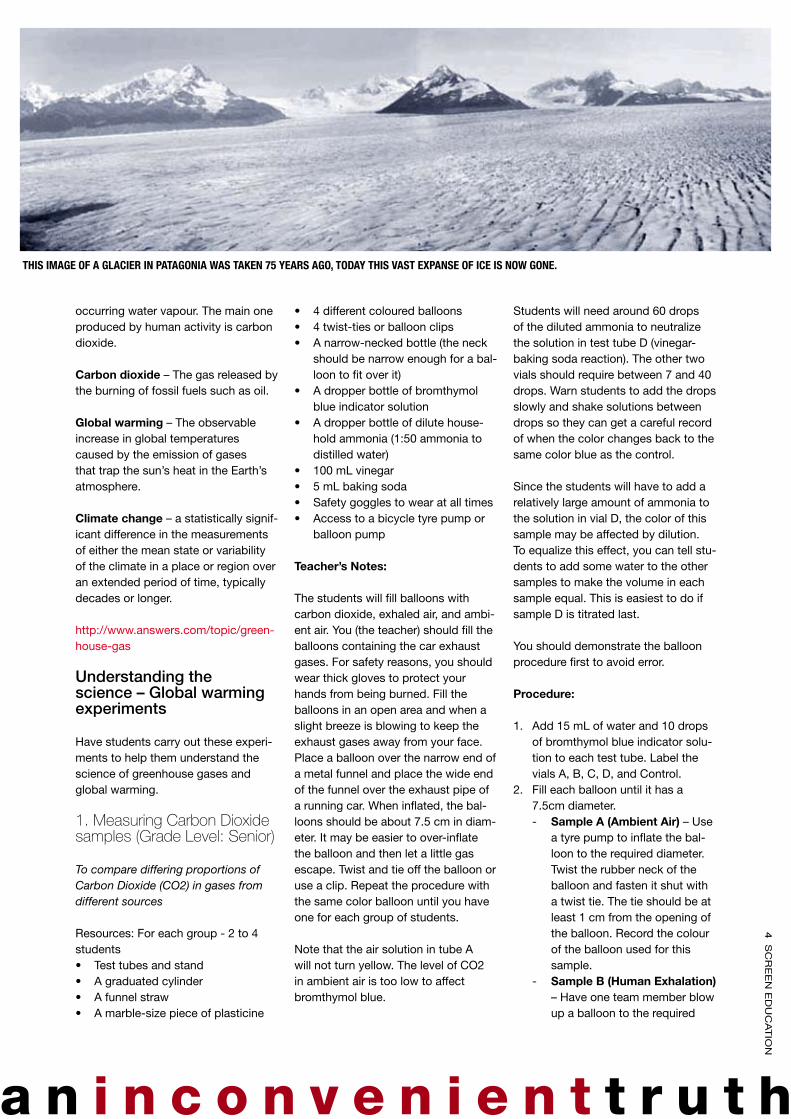
this iMage of a glacier in Patagonia was taKen 75 years ago, today this vast exPanse of ice is now gone.
� S
Cr
EE
n E
DU
Ca
Tio
n
a n i n c o n v e n i e n t t r u t h
diameter. Twist and tie the bal-loon, and record balloon colour.Sample C (Automobile Exhaust) – Your teacher will supply you with this balloon. record the balloon colour.Sample D (Nearly pure CO2) – Put 100 ml of vinegar in the narrow-necked bottle. Using a funnel, add 5 ml of baking soda. let the mixture bubble for 3 seconds to drive the air out, then slip the balloon over the neck of the bottle. let the balloon inflate to the proper diameter. Twist, tie, and record the balloon colour.
3. Soften the plasticine and wrap it around one end of the straw to make a small airtight collar that will fit into the neck of a balloon. The collar should look like a cone with the straw in its middle, and should be large enough to plug the neck
-
-
of the balloon.4. Pick up balloon a. Keeping the tie
on it, slip the balloon’s neck over the collar and hold it against the collar to make an airtight seal. Place the other end of the straw into the test tube of water and bromthymol blue labelled a. Have another partner remove the tie on the balloon and slowly untwist the balloon. Keep-ing the neck of the balloon pinched to control the flow of gas, gently squeeze the balloon so the gas slowly bubbles through the solution.
5. repeat the same procedure with the other balloons and their tubes. in some cases, the bromthymol blue solution will change color, from blue to yellow, indicating the presence of carbonic acid formed from Co2.
6. analyse each of the samples by titrating them with drops of dilute ammonia. ammonia neutralizes the carbonic acid. The bromthymol blue
will return to a blue colour when all the acid has reacted. add drops of ammonia to each of the samples that turned yellow, carefully counting the number of drops needed until they are about the same color as your control. record the results.
Discussion:
Make a chart on the board to pool each group’s results.which samples had the most and the least carbon dioxide?why didn’t the ambient air sample turn yellow? (The test isn’t sensi-tive enough to detect low concen-trations of Co2. Carbon dioxide is a natural part of our atmosphere, but too much Co2 could make the Earth warmer through an increased greenhouse effect.)why is automobile exhaust a concern?
•
•
•
•
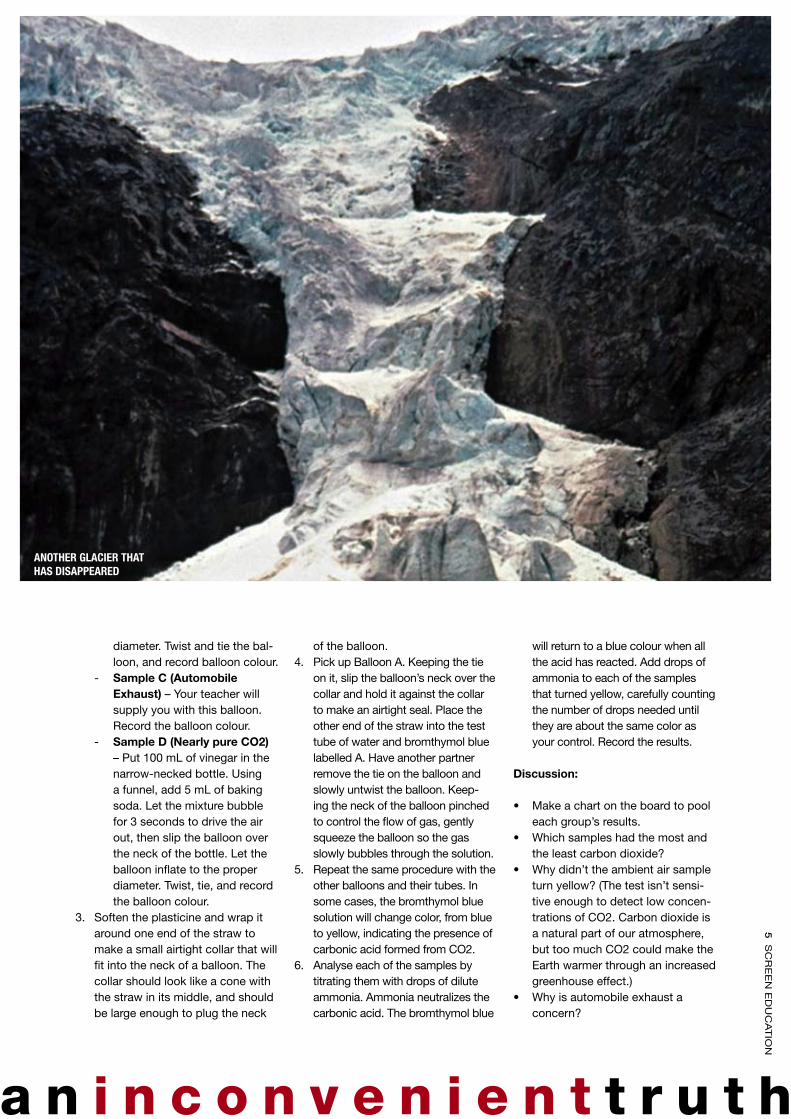
another glacier that has disaPPeared
� S
Cr
EE
n E
DU
Ca
Tio
n
a n i n c o n v e n i e n t t r u t h
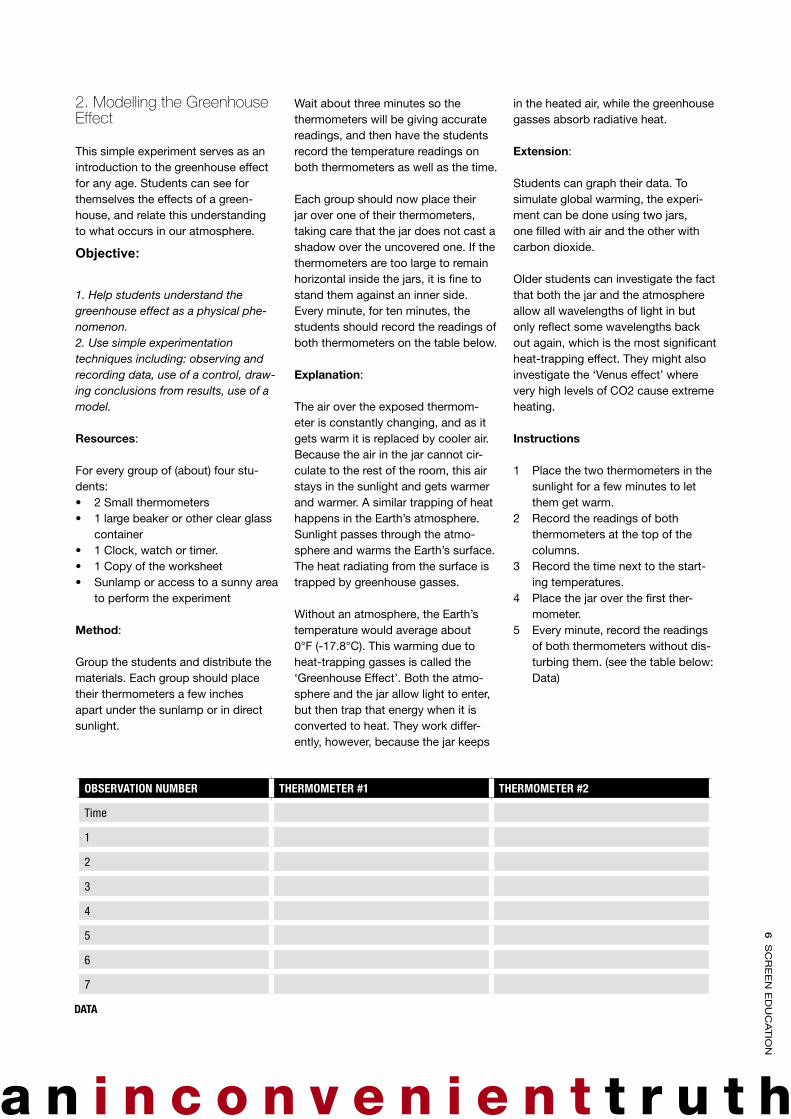
2. Modelling the Greenhouse effect
This simple experiment serves as an introduction to the greenhouse effect for any age. Students can see for themselves the effects of a green-house, and relate this understanding to what occurs in our atmosphere.
Objective:
1. Help students understand the greenhouse effect as a physical phe-nomenon.2. Use simple experimentation techniques including: observing and recording data, use of a control, draw-ing conclusions from results, use of a model.
Resources:
For every group of (about) four stu-dents:• 2 Small thermometers• 1 large beaker or other clear glass
container• 1 Clock, watch or timer.• 1 Copy of the worksheet• Sunlamp or access to a sunny area
to perform the experiment
Method:
group the students and distribute the materials. Each group should place their thermometers a few inches apart under the sunlamp or in direct sunlight.
wait about three minutes so the thermometers will be giving accurate readings, and then have the students record the temperature readings on both thermometers as well as the time.
Each group should now place their jar over one of their thermometers, taking care that the jar does not cast a shadow over the uncovered one. if the thermometers are too large to remain horizontal inside the jars, it is fine to stand them against an inner side. Every minute, for ten minutes, the students should record the readings of both thermometers on the table below.
Explanation:
The air over the exposed thermom-eter is constantly changing, and as it gets warm it is replaced by cooler air. because the air in the jar cannot cir-culate to the rest of the room, this air stays in the sunlight and gets warmer and warmer. a similar trapping of heat happens in the Earth’s atmosphere. Sunlight passes through the atmo-sphere and warms the Earth’s surface. The heat radiating from the surface is trapped by greenhouse gasses.
without an atmosphere, the Earth’s temperature would average about 0°F (-17.8°C). This warming due to heat-trapping gasses is called the ‘greenhouse Effect’. both the atmo-sphere and the jar allow light to enter, but then trap that energy when it is converted to heat. They work differ-ently, however, because the jar keeps
in the heated air, while the greenhouse gasses absorb radiative heat.
Extension:
Students can graph their data. To simulate global warming, the experi-ment can be done using two jars, one filled with air and the other with carbon dioxide.
older students can investigate the fact that both the jar and the atmosphere allow all wavelengths of light in but only reflect some wavelengths back out again, which is the most significant heat-trapping effect. They might also investigate the ‘Venus effect’ where very high levels of Co2 cause extreme heating.
Instructions
1 Place the two thermometers in the sunlight for a few minutes to let them get warm.
2 record the readings of both thermometers at the top of the columns.
3 record the time next to the start-ing temperatures.
4 Place the jar over the first ther-mometer.
5 Every minute, record the readings of both thermometers without dis-turbing them. (see the table below: Data)
observation nuMber therMoMeter #1 therMoMeter #2
Time
1
2
3
4
5
6
7
data
� S
Cr
EE
n E
DU
Ca
Tio
n
a n i n c o n v e n i e n t t r u t h
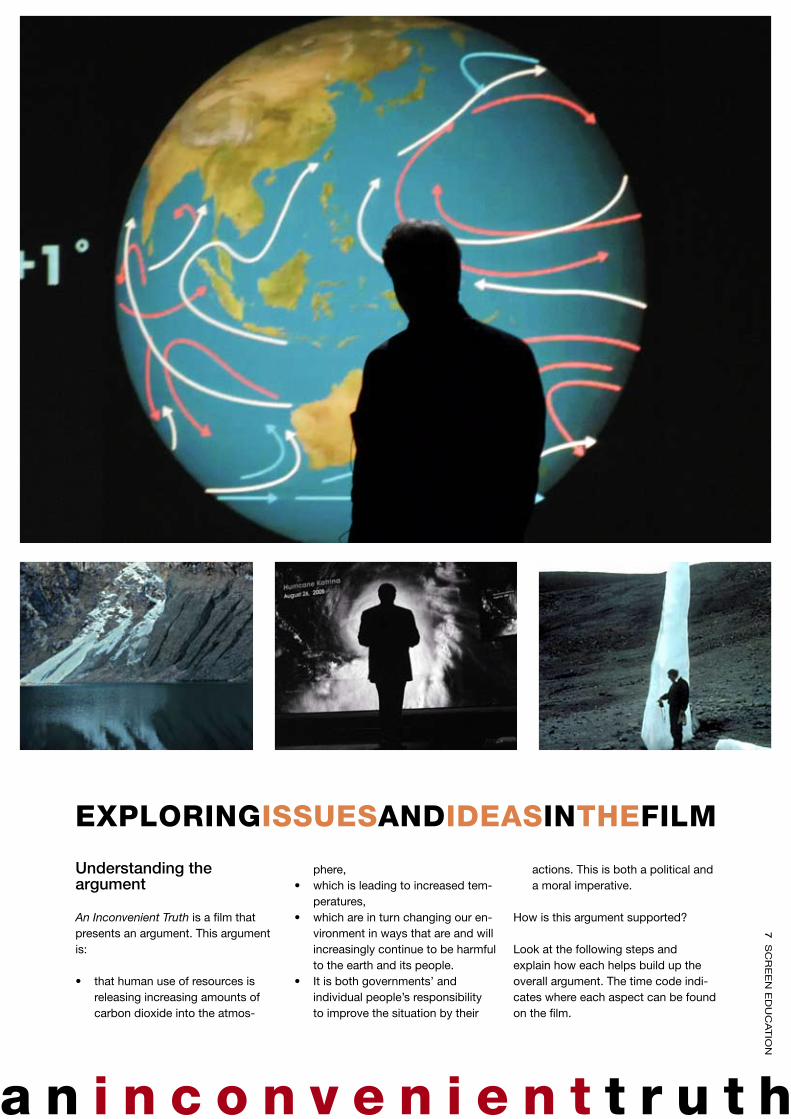
Understanding the argument
An Inconvenient Truth is a film that presents an argument. This argument is:
• that human use of resources is releasing increasing amounts of carbon dioxide into the atmos-
phere,• which is leading to increased tem-
peratures,• which are in turn changing our en-
vironment in ways that are and will increasingly continue to be harmful to the earth and its people.
• it is both governments’ and individual people’s responsibility to improve the situation by their
actions. This is both a political and a moral imperative.
How is this argument supported?
look at the following steps and explain how each helps build up the overall argument. The time code indi-cates where each aspect can be found on the film.
EXPLORINGISSUESANDIDEASINTHEfILM
� S
Cr
EE
n E
DU
Ca
Tio
n
a n i n c o n v e n i e n t t r u t h
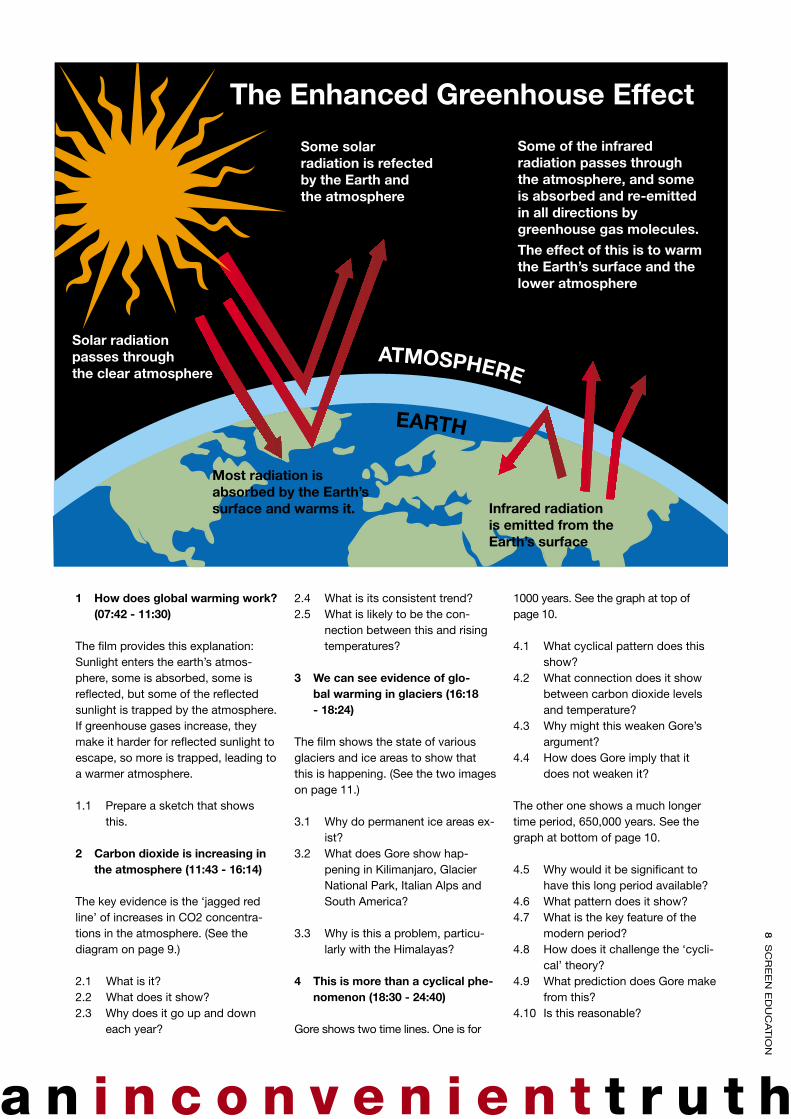
1 How does global warming work? (07:42 - 11:30)
The film provides this explanation: Sunlight enters the earth’s atmos-phere, some is absorbed, some is reflected, but some of the reflected sunlight is trapped by the atmosphere. if greenhouse gases increase, they make it harder for reflected sunlight to escape, so more is trapped, leading to a warmer atmosphere.
1.1 Prepare a sketch that shows this.
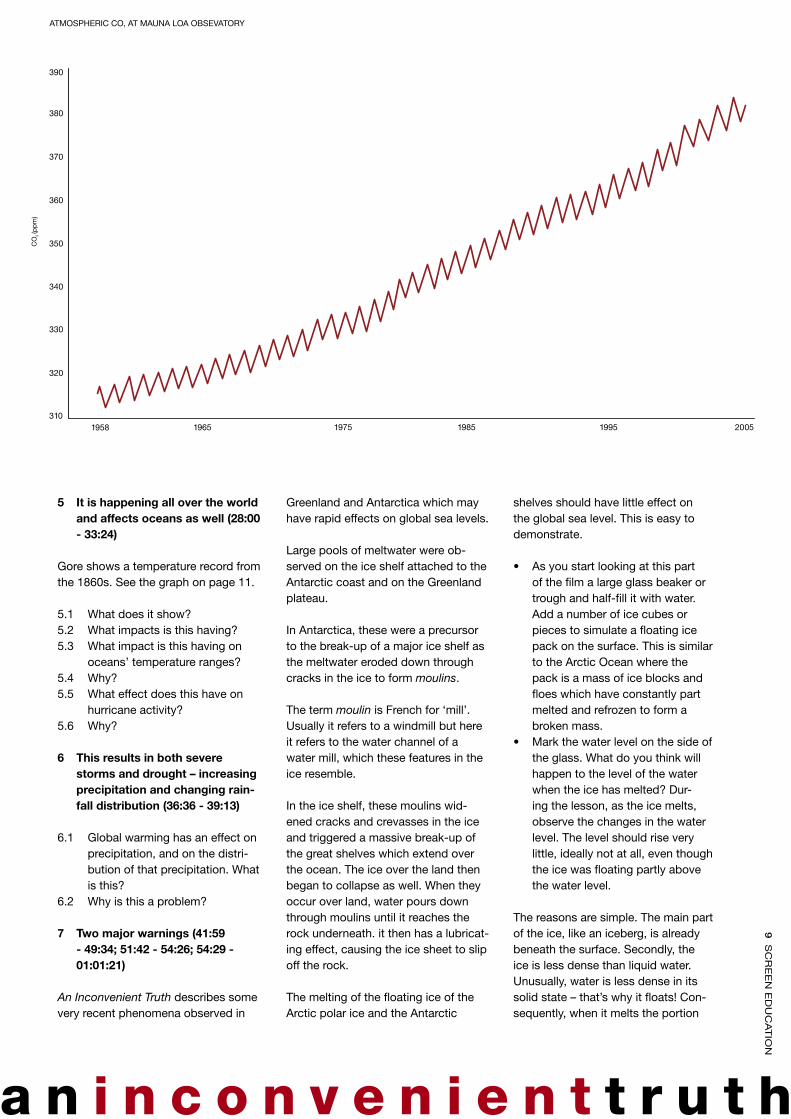
2 Carbon dioxide is increasing in the atmosphere (11:43 - 16:14)
The key evidence is the ‘jagged red line’ of increases in Co2 concentra-tions in the atmosphere. (See the diagram on page 9.)
2.1 what is it?2.2 what does it show?2.3 why does it go up and down
each year?
2.4 what is its consistent trend?2.5 what is likely to be the con-
nection between this and rising temperatures?
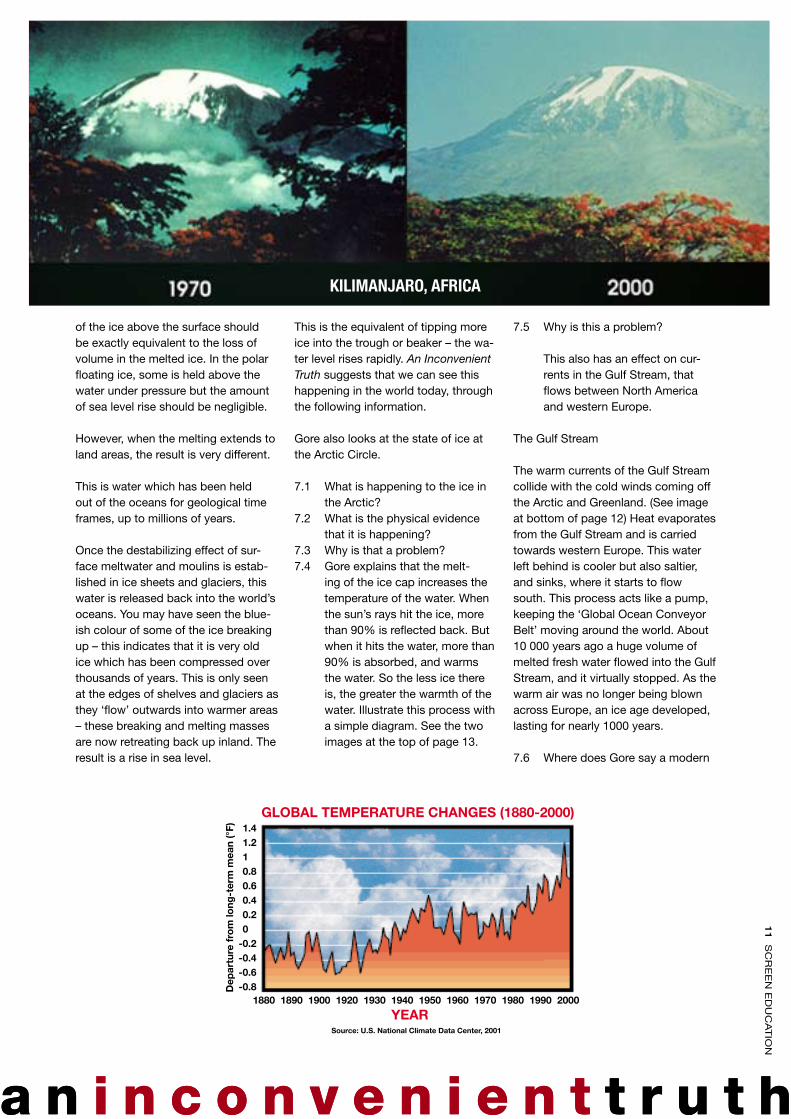
3 We can see evidence of glo-bal warming in glaciers (16:18 - 18:24)
The film shows the state of various glaciers and ice areas to show that this is happening. (See the two images on page 11.)
3.1 why do permanent ice areas ex-ist?
3.2 what does gore show hap-pening in Kilimanjaro, glacier national Park, italian alps and South america?
3.3 why is this a problem, particu-larly with the Himalayas?
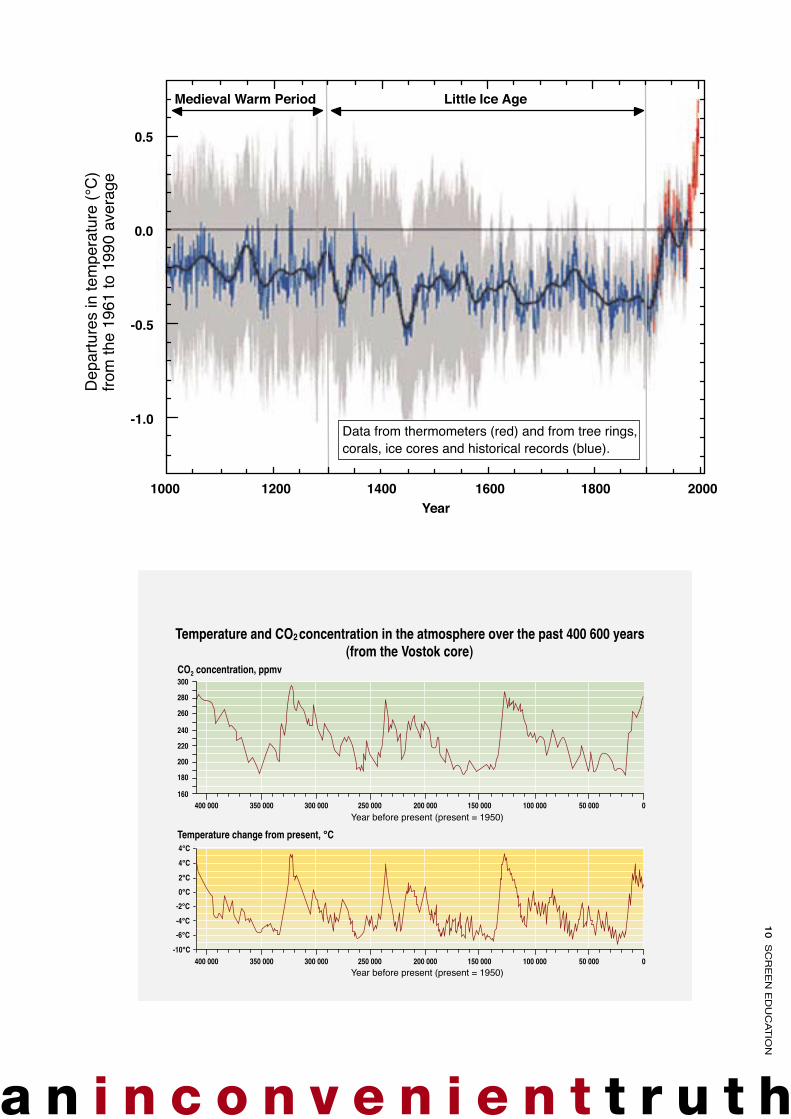
4 This is more than a cyclical phe-nomenon (18:30 - 24:40)
gore shows two time lines. one is for
1000 years. See the graph at top of page 10.
4.1 what cyclical pattern does this show?
4.2 what connection does it show between carbon dioxide levels and temperature?
4.3 why might this weaken gore’s argument?
4.4 How does gore imply that it does not weaken it?
The other one shows a much longer time period, 650,000 years. See the graph at bottom of page 10.
4.5 why would it be significant to have this long period available?
4.6 what pattern does it show?4.7 what is the key feature of the
modern period?4.8 How does it challenge the ‘cycli-
cal’ theory?4.9 what prediction does gore make
from this?4.10 is this reasonable?
iMage P 26 & 27
The Enhanced Greenhouse Effect
Some solar radiation is refected by the Earth and the atmosphere
Solar radiationpasses throughthe clear atmosphere
Some of the infraredradiation passes throughthe atmosphere, and someis absorbed and re-emittedin all directions bygreenhouse gas molecules.
The effect of this is to warmthe Earth’s surface and thelower atmosphere
ATMOSPHERE
EARTH
Most radiation isabsorbed by the Earth’ssurface and warms it. Infrared radiation
is emitted from theEarth’s surface
� S
Cr
EE
n E
DU
Ca
Tio
n
a n i n c o n v e n i e n t t r u t h
390
380
370
360
350
340
330
320
3101958 1965 1975 1985 1995 2005
ATMOSPHERIC CO, AT MAUNA LOA OBSEVATORYC
O2 (p
pm
)
5 It is happening all over the world and affects oceans as well (28:00 - 33:24)
gore shows a temperature record from the 1860s. See the graph on page 11.
5.1 what does it show?5.2 what impacts is this having?5.3 what impact is this having on
oceans’ temperature ranges?5.4 why?5.5 what effect does this have on
hurricane activity?5.6 why?
6 This results in both severe storms and drought – increasing precipitation and changing rain-fall distribution (36:36 - 39:13)
6.1 global warming has an effect on precipitation, and on the distri-bution of that precipitation. what is this?
6.2 why is this a problem?
7 Two major warnings (41:59 - 49:34; 51:42 - 54:26; 54:29 - 01:01:21)
An Inconvenient Truth describes some very recent phenomena observed in
greenland and antarctica which may have rapid effects on global sea levels.
large pools of meltwater were ob-served on the ice shelf attached to the antarctic coast and on the greenland plateau.
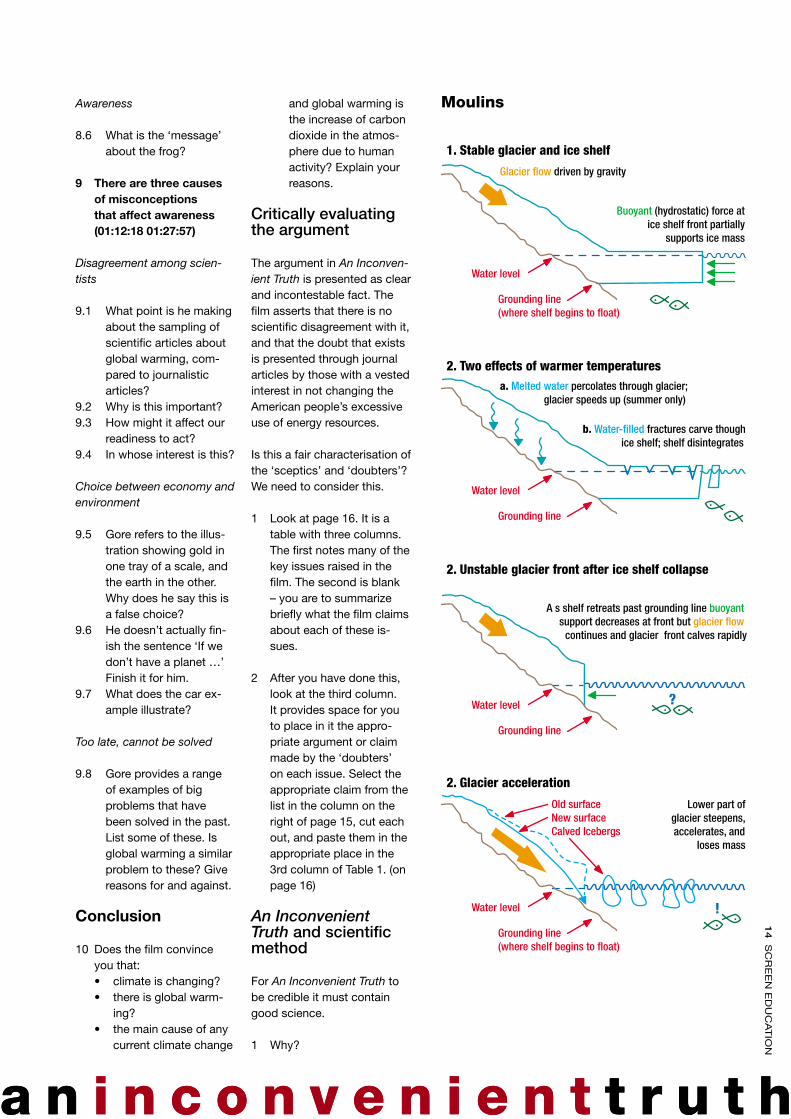
in antarctica, these were a precursor to the break-up of a major ice shelf as the meltwater eroded down through cracks in the ice to form moulins.
The term moulin is French for ‘mill’. Usually it refers to a windmill but here it refers to the water channel of a water mill, which these features in the ice resemble.
in the ice shelf, these moulins wid-ened cracks and crevasses in the ice and triggered a massive break-up of the great shelves which extend over the ocean. The ice over the land then began to collapse as well. when they occur over land, water pours down through moulins until it reaches the rock underneath. it then has a lubricat-ing effect, causing the ice sheet to slip off the rock.
The melting of the floating ice of the arctic polar ice and the antarctic
shelves should have little effect on the global sea level. This is easy to demonstrate.
as you start looking at this part of the film a large glass beaker or trough and half-fill it with water. add a number of ice cubes or pieces to simulate a floating ice pack on the surface. This is similar to the arctic ocean where the pack is a mass of ice blocks and floes which have constantly part melted and refrozen to form a broken mass.Mark the water level on the side of the glass. what do you think will happen to the level of the water when the ice has melted? Dur-ing the lesson, as the ice melts, observe the changes in the water level. The level should rise very little, ideally not at all, even though the ice was floating partly above the water level.
The reasons are simple. The main part of the ice, like an iceberg, is already beneath the surface. Secondly, the ice is less dense than liquid water. Unusually, water is less dense in its solid state – that’s why it floats! Con-sequently, when it melts the portion
•
•
� S
Cr
EE
n E
DU
Ca
Tio
n
a n i n c o n v e n i e n t t r u t h
Medieval Warm Period Little Ice Age
0.5
1000 1200 1400 1600Year
1800 2000
0.0
-0.5
-1.0
Dep
artu
res
in te
mpe
ratu
re (°
C)
from
the
1961
to 1
990
aver
age
Data from thermometers (red) and from tree rings,corals, ice cores and historical records (blue).
Temperature and CO2 concentration in the atmosphere over the past 400 600 years(from the Vostok core)
CO2 concentration, ppmv
Temperature change from present, °C
Year before present (present = 1950)
Year before present (present = 1950)
300
280
260
240
220
200
180
160400 000 350 000 300 000 250 000 200 000 150 000 100 000 50 000 0
400 000
4°C
4°C
2°C
0°C
-2°C
-4°C
-6°C
-10°C350 000 300 000 250 000 200 000 150 000 100 000 50 000 0
10
SC
rE
En
ED
UC
aT
ion
a n i n c o n v e n i e n t t r u t ha n i n c o n v e n i e n t t r u t h
of the ice above the surface should be exactly equivalent to the loss of volume in the melted ice. in the polar floating ice, some is held above the water under pressure but the amount of sea level rise should be negligible.
However, when the melting extends to land areas, the result is very different.
This is water which has been held out of the oceans for geological time frames, up to millions of years.
once the destabilizing effect of sur-face meltwater and moulins is estab-lished in ice sheets and glaciers, this water is released back into the world’s oceans. You may have seen the blue-ish colour of some of the ice breaking up – this indicates that it is very old ice which has been compressed over thousands of years. This is only seen at the edges of shelves and glaciers as they ‘flow’ outwards into warmer areas – these breaking and melting masses are now retreating back up inland. The result is a rise in sea level.
This is the equivalent of tipping more ice into the trough or beaker – the wa-ter level rises rapidly. An Inconvenient Truth suggests that we can see this happening in the world today, through the following information.
gore also looks at the state of ice at the arctic Circle.
7.1 what is happening to the ice in the arctic?
7.2 what is the physical evidence that it is happening?
7.3 why is that a problem?7.4 gore explains that the melt-
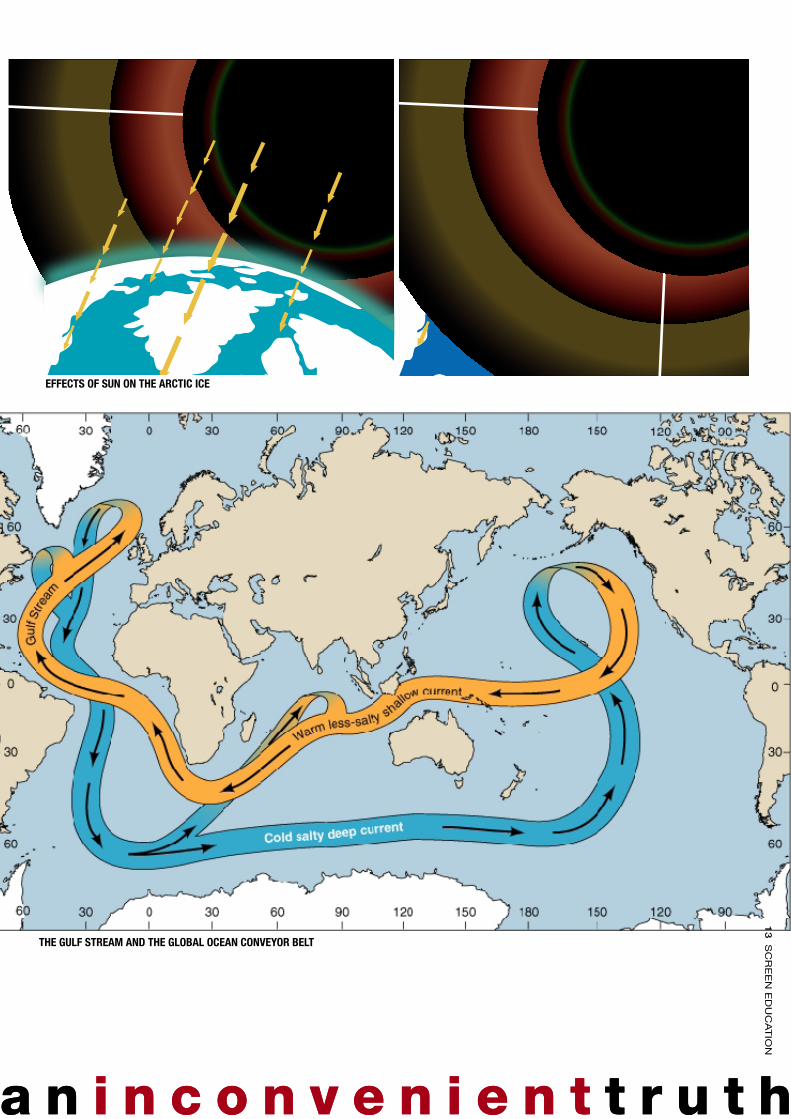
ing of the ice cap increases the temperature of the water. when the sun’s rays hit the ice, more than 90% is reflected back. but when it hits the water, more than 90% is absorbed, and warms the water. So the less ice there is, the greater the warmth of the water. illustrate this process with a simple diagram. See the two images at the top of page 13.
7.5 why is this a problem?
This also has an effect on cur-rents in the gulf Stream, that flows between north america and western Europe.
The gulf Stream
The warm currents of the gulf Stream collide with the cold winds coming off the arctic and greenland. (See image at bottom of page 12) Heat evaporates from the gulf Stream and is carried towards western Europe. This water left behind is cooler but also saltier, and sinks, where it starts to flow south. This process acts like a pump, keeping the ‘global ocean Conveyor belt’ moving around the world. about 10 000 years ago a huge volume of melted fresh water flowed into the gulf Stream, and it virtually stopped. as the warm air was no longer being blown across Europe, an ice age developed, lasting for nearly 1000 years.
7.6 where does gore say a modern
KiliManjaro, africa
GLOBAL TEMPERATURE CHANGES (1880-2000) 1.4 1.2 1 0.8 0.6 0.4 0.2 0-0.2-0.4-0.6-0.8
1880 1890 1900 1920 1930 1940 1950 1960 1970 1980 1990 2000
YEARSource: U.S. National Climate Data Center, 2001
Dep
artu
re f
rom
long
-ter
m m
ean
(°F)
11
SC
rE
En
ED
UC
aT
ion
a n i n c o n v e n i e n t t r u t ha n i n c o n v e n i e n t t r u t h
equivalent body of fresh water could come from to potentially disrupt the gulf Stream again?
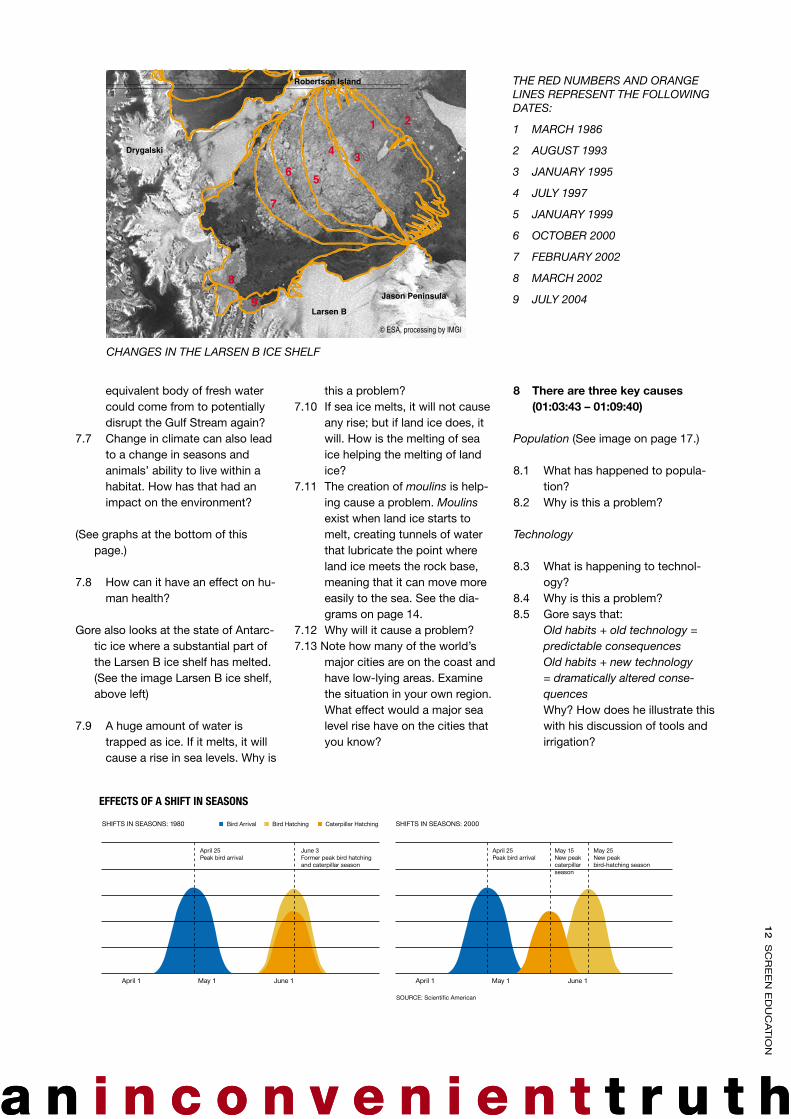
7.7 Change in climate can also lead to a change in seasons and animals’ ability to live within a habitat. How has that had an impact on the environment?
(See graphs at the bottom of this page.)
7.8 How can it have an effect on hu-man health?
gore also looks at the state of antarc-tic ice where a substantial part of the larsen b ice shelf has melted. (See the image larsen b ice shelf, above left)
7.9 a huge amount of water is trapped as ice. if it melts, it will cause a rise in sea levels. why is
this a problem?7.10 if sea ice melts, it will not cause
any rise; but if land ice does, it will. How is the melting of sea ice helping the melting of land ice?
7.11 The creation of moulins is help-ing cause a problem. Moulins exist when land ice starts to melt, creating tunnels of water that lubricate the point where land ice meets the rock base, meaning that it can move more easily to the sea. See the dia-grams on page 14.
7.12 why will it cause a problem?7.13 note how many of the world’s
major cities are on the coast and have low-lying areas. Examine the situation in your own region. what effect would a major sea level rise have on the cities that you know?
8 There are three key causes (01:03:43 – 01:09:40)
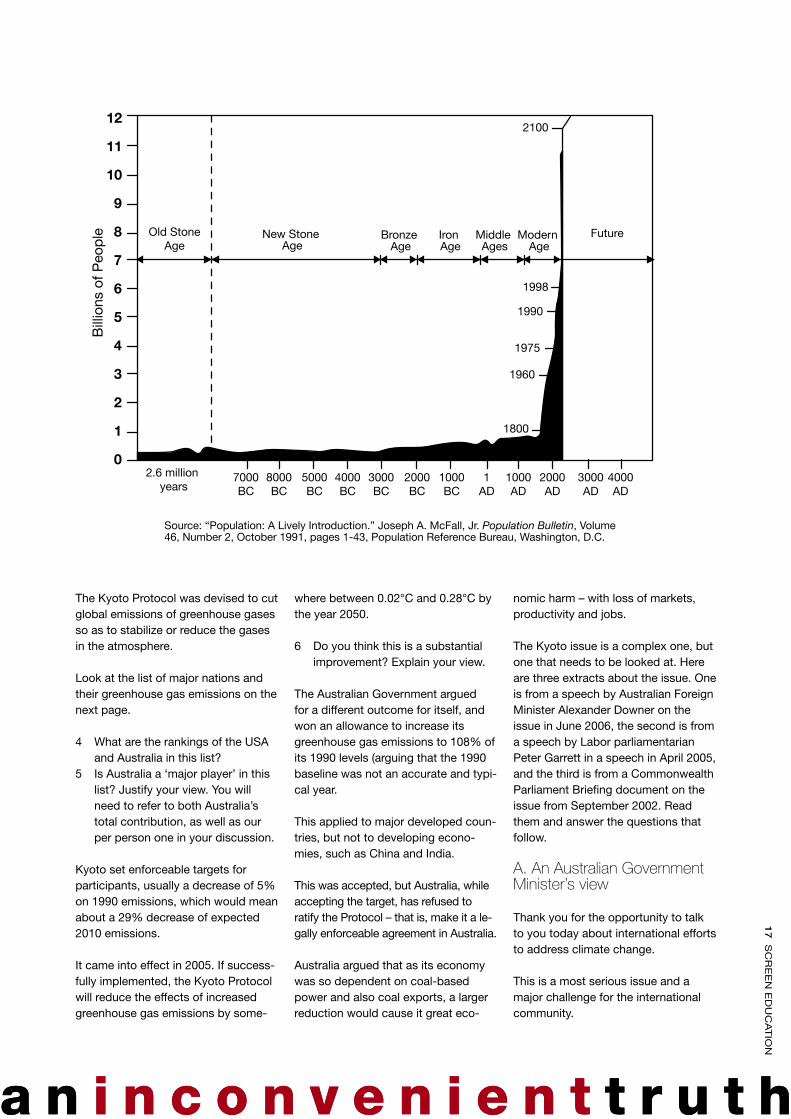
Population (See image on page 17.)
8.1 what has happened to popula-tion?
8.2 why is this a problem?
Technology
8.3 what is happening to technol-ogy?
8.4 why is this a problem?8.5 gore says that: Old habits + old technology =
predictable consequences Old habits + new technology
= dramatically altered conse-quences
why? How does he illustrate this with his discussion of tools and irrigation?
CHAnges In THe LArsen B ICe sHeLf
SOURCE: Scientific American
April 1 May 1 June 1
SHIFTS IN SEASONS: 1980 Bird Arrival Bird Hatching Caterpillar Hatching
April 25Peak bird arrival
June 3Former peak bird hatchingand caterpillar season
April 1 May 1 June 1
SHIFTS IN SEASONS: 2000
April 25Peak bird arrival
May 25New peak bird-hatching season
May 15New peak caterpillar season
effects of a shift in seasons
THe reD nUMBers AnD OrAnge LInes rePresenT THe fOLLOwIng DATes:
1 MArCH 1986
2 AUgUsT 1993
3 JAnUAry 1995
4 JULy 1997
5 JAnUAry 1999
6 OCTOBer 2000
7 feBrUAry 2002
8 MArCH 2002
9 JULy 2004
1�
SC
rE
En
ED
UC
aT
ion
a n i n c o n v e n i e n t t r u t ha n i n c o n v e n i e n t t r u t h
effects of sun on the arctic ice
the gulf streaM and the global ocean conveyor belt
1�
SC
rE
En
ED
UC
aT
ion
a n i n c o n v e n i e n t t r u t ha n i n c o n v e n i e n t t r u t h
Awareness
8.6 what is the ‘message’ about the frog?
9 There are three causes of misconceptions that affect awareness (01:12:18 01:27:57)
Disagreement among scien-tists
9.1 what point is he making about the sampling of scientific articles about global warming, com-pared to journalistic articles?
9.2 why is this important?9.3 How might it affect our
readiness to act?9.4 in whose interest is this?
Choice between economy and environment
9.5 gore refers to the illus-tration showing gold in one tray of a scale, and the earth in the other.why does he say this is a false choice?
9.6 He doesn’t actually fin-ish the sentence ‘if we don’t have a planet …’ Finish it for him.
9.7 what does the car ex-ample illustrate?
Too late, cannot be solved
9.8 gore provides a range of examples of big problems that have been solved in the past. list some of these. is global warming a similar problem to these? give reasons for and against.
Conclusion
10 Does the film convince you that:• climate is changing?• there is global warm-
ing?• the main cause of any
current climate change
and global warming is the increase of carbon dioxide in the atmos-phere due to human activity? Explain your reasons.
Critically evaluating the argument
The argument in An Inconven-ient Truth is presented as clear and incontestable fact. The film asserts that there is no scientific disagreement with it, and that the doubt that exists is presented through journal articles by those with a vested interest in not changing the american people’s excessive use of energy resources.
is this a fair characterisation of the ‘sceptics’ and ‘doubters’? we need to consider this.
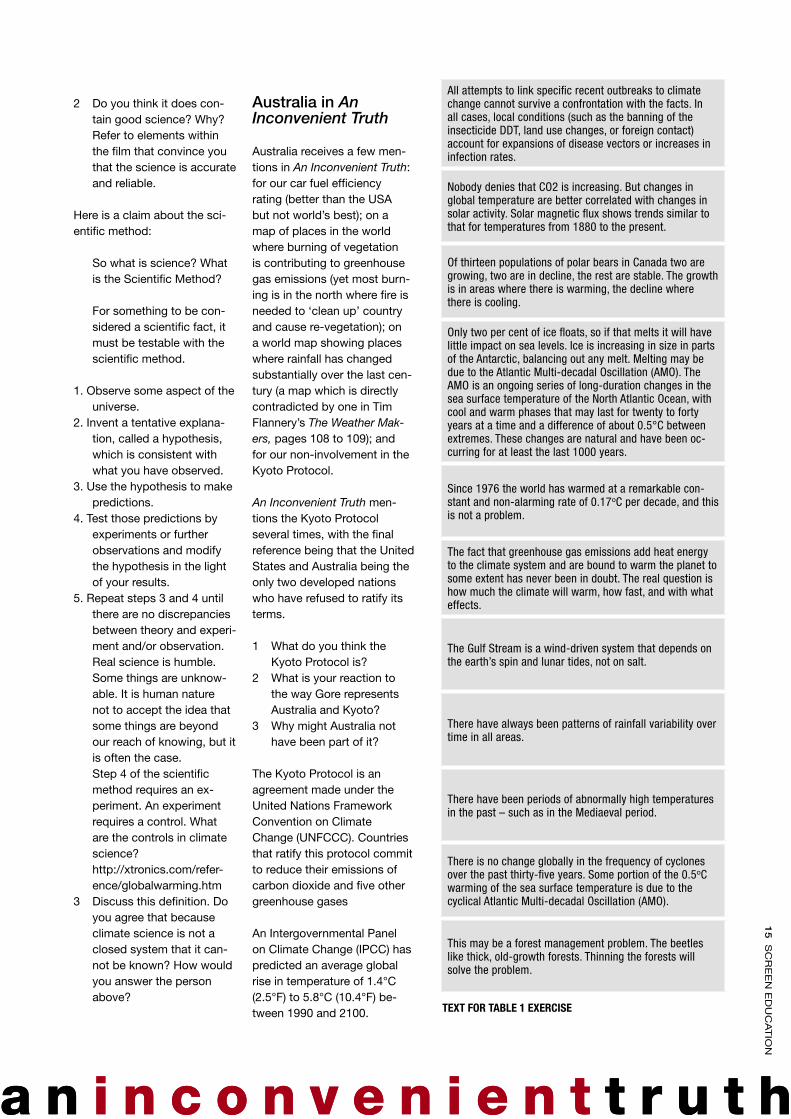
1 look at page 16. it is a table with three columns. The first notes many of the key issues raised in the film. The second is blank – you are to summarize briefly what the film claims about each of these is-sues.
2 after you have done this, look at the third column. it provides space for you to place in it the appro-priate argument or claim made by the ‘doubters’ on each issue. Select the appropriate claim from the list in the column on the right of page 15, cut each out, and paste them in the appropriate place in the 3rd column of Table 1. (on page 16)
An Inconvenient Truth and scientific method
For An Inconvenient Truth to be credible it must contain good science.
1 why?
Moulins
1�
SC
rE
En
ED
UC
aT
ion
a n i n c o n v e n i e n t t r u t ha n i n c o n v e n i e n t t r u t h
All attempts to link specific recent outbreaks to climate change cannot survive a confrontation with the facts. In all cases, local conditions (such as the banning of the insecticide DDT, land use changes, or foreign contact) account for expansions of disease vectors or increases in infection rates.
Nobody denies that CO2 is increasing. But changes in global temperature are better correlated with changes in solar activity. Solar magnetic flux shows trends similar to that for temperatures from 1880 to the present.
Of thirteen populations of polar bears in Canada two are growing, two are in decline, the rest are stable. The growth is in areas where there is warming, the decline where there is cooling.
Only two per cent of ice floats, so if that melts it will have little impact on sea levels. Ice is increasing in size in parts of the Antarctic, balancing out any melt. Melting may be due to the Atlantic Multi-decadal Oscillation (AMO). The AMO is an ongoing series of long-duration changes in the sea surface temperature of the North Atlantic Ocean, with cool and warm phases that may last for twenty to forty years at a time and a difference of about 0.5°C between extremes. These changes are natural and have been oc-curring for at least the last 1000 years.
Since 1976 the world has warmed at a remarkable con-stant and non-alarming rate of 0.17oC per decade, and this is not a problem.
The fact that greenhouse gas emissions add heat energy to the climate system and are bound to warm the planet to some extent has never been in doubt. The real question is how much the climate will warm, how fast, and with what effects.
The Gulf Stream is a wind-driven system that depends on the earth’s spin and lunar tides, not on salt.
There have always been patterns of rainfall variability over time in all areas.
There have been periods of abnormally high temperatures in the past – such as in the Mediaeval period.
There is no change globally in the frequency of cyclones over the past thirty-five years. Some portion of the 0.5oC warming of the sea surface temperature is due to the cyclical Atlantic Multi-decadal Oscillation (AMO).
This may be a forest management problem. The beetles like thick, old-growth forests. Thinning the forests will solve the problem.
text for table 1 exercise
2 Do you think it does con-tain good science? why? refer to elements within the film that convince you that the science is accurate and reliable.
Here is a claim about the sci-entific method:
So what is science? what is the Scientific Method?
For something to be con-sidered a scientific fact, it must be testable with the scientific method.
1. observe some aspect of the universe.
2. invent a tentative explana-tion, called a hypothesis, which is consistent with what you have observed.
3. Use the hypothesis to make predictions.
4. Test those predictions by experiments or further observations and modify the hypothesis in the light of your results.
5. repeat steps 3 and 4 until there are no discrepancies between theory and experi-ment and/or observation.
real science is humble. Some things are unknow-able. it is human nature not to accept the idea that some things are beyond our reach of knowing, but it is often the case.
Step 4 of the scientific method requires an ex-periment. an experiment requires a control. what are the controls in climate science?
http://xtronics.com/refer-ence/globalwarming.htm
3 Discuss this definition. Do you agree that because climate science is not a closed system that it can-not be known? How would you answer the person above?
Australia in An Inconvenient Truth
australia receives a few men-tions in An Inconvenient Truth: for our car fuel efficiency rating (better than the USa but not world’s best); on a map of places in the world where burning of vegetation is contributing to greenhouse gas emissions (yet most burn-ing is in the north where fire is needed to ‘clean up’ country and cause re-vegetation); on a world map showing places where rainfall has changed substantially over the last cen-tury (a map which is directly contradicted by one in Tim Flannery’s The weather Mak-ers, pages 108 to 109); and for our non-involvement in the Kyoto Protocol.
An Inconvenient Truth men-tions the Kyoto Protocol several times, with the final reference being that the United States and australia being the only two developed nations who have refused to ratify its terms.
1 what do you think the Kyoto Protocol is?
2 what is your reaction to the way gore represents australia and Kyoto?
3 why might australia not have been part of it?
The Kyoto Protocol is an agreement made under the United nations Framework Convention on Climate Change (UnFCCC). Countries that ratify this protocol commit to reduce their emissions of carbon dioxide and five other greenhouse gases
an intergovernmental Panel on Climate Change (iPCC) has predicted an average global rise in temperature of 1.4°C (2.5°F) to 5.8°C (10.4°F) be-tween 1990 and 2100.
1�
SC
rE
En
ED
UC
aT
ion

a n i n c o n v e n i e n t t r u t ha n i n c o n v e n i e n t t r u t htable 1: *based on: http://www.cei.org/gencon/030,05288.cfm and http://www.johnstonsarchive.net/environment/index.html
1 asPect 2 Point Made in an inconvenient truth (write your suMMary here)
3 scePtics/deniers (cut and Paste in here)
Global warming is real
Carbon dioxide is increasing rapidly
Temperatures are increasing
Ice melts in glaciers, Arctic and Antarctic
Ocean currents / Gulf Stream
Rising ocean temperatures and extreme weather conditions – rain, hurricanes and drought
Changes in seasons and pest infesta-tions
Polar bears
Drought
Ten hottest years
Global warming and insect vectors
1�
SC
rE
En
ED
UC
aT
ion
a n i n c o n v e n i e n t t r u t ha n i n c o n v e n i e n t t r u t h
The Kyoto Protocol was devised to cut global emissions of greenhouse gases so as to stabilize or reduce the gases in the atmosphere.
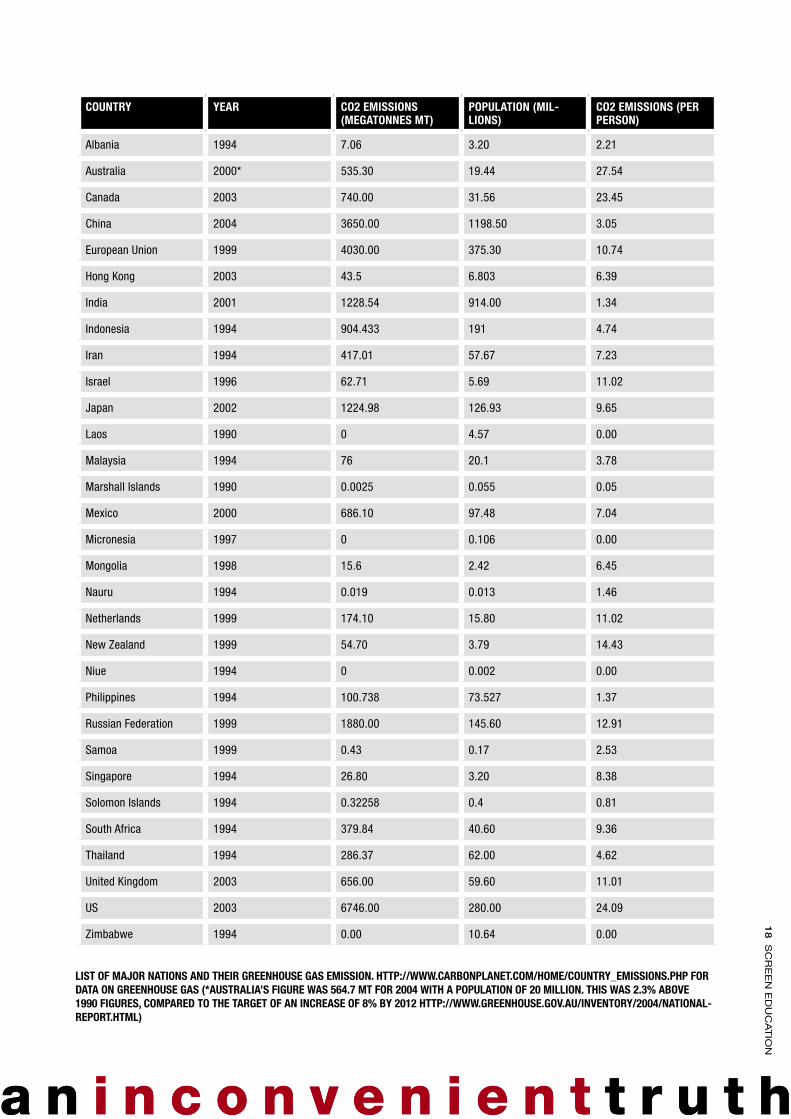
look at the list of major nations and their greenhouse gas emissions on the next page.
4 what are the rankings of the USa and australia in this list?
5 is australia a ‘major player’ in this list? Justify your view. You will need to refer to both australia’s total contribution, as well as our per person one in your discussion.
Kyoto set enforceable targets for participants, usually a decrease of 5% on 1990 emissions, which would mean about a 29% decrease of expected 2010 emissions.
it came into effect in 2005. if success-fully implemented, the Kyoto Protocol will reduce the effects of increased greenhouse gas emissions by some-
where between 0.02°C and 0.28°C by the year 2050.
6 Do you think this is a substantial improvement? Explain your view.
The australian government argued for a different outcome for itself, and won an allowance to increase its greenhouse gas emissions to 108% of its 1990 levels (arguing that the 1990 baseline was not an accurate and typi-cal year.
This applied to major developed coun-tries, but not to developing econo-mies, such as China and india.
This was accepted, but australia, while accepting the target, has refused to ratify the Protocol – that is, make it a le-gally enforceable agreement in australia.
australia argued that as its economy was so dependent on coal-based power and also coal exports, a larger reduction would cause it great eco-
nomic harm – with loss of markets, productivity and jobs.
The Kyoto issue is a complex one, but one that needs to be looked at. Here are three extracts about the issue. one is from a speech by australian Foreign Minister alexander Downer on the issue in June 2006, the second is from a speech by labor parliamentarian Peter garrett in a speech in april 2005, and the third is from a Commonwealth Parliament briefing document on the issue from September 2002. read them and answer the questions that follow.
A. An Australian Government Minister’s view
Thank you for the opportunity to talk to you today about international efforts to address climate change.
This is a most serious issue and a major challenge for the international community.
12
11
10
9
8
7
6
5
4
3
2
1
0
Bill
ions
of P
eop
le Old StoneAge
2.6 million years
New Stone Age
Bronze Age
Iron Age
Middle Ages
Modern Age
Future
2100
1998
1990
1975
1960
1800
7000BC
8000BC
5000BC
4000BC
3000BC
2000BC
1000BC
1AD
1000AD
2000AD
3000AD
4000AD
FIGURE 21-6. World Population Growth through History
Source: “Population: A Lively Introduction.” Joseph A. McFall, Jr. Population Bulletin, Volume46, Number 2, October 1991, pages 1-43, Population Reference Bureau, Washington, D.C.
1�
SC
rE
En
ED
UC
aT
ion
a n i n c o n v e n i e n t t r u t ha n i n c o n v e n i e n t t r u t h
list of Major nations and their greenhouse gas eMission. httP://www.carbonPlanet.coM/hoMe/country_eMissions.PhP for data on greenhouse gas (*australia’s figure was 564.7 Mt for 2004 with a PoPulation of 20 Million. this was 2.3% above 1990 figures, coMPared to the target of an increase of 8% by 2012 httP://www.greenhouse.gov.au/inventory/2004/national-rePort.htMl)
country year co2 eMissions (Megatonnes Mt)
PoPulation (Mil-lions)
co2 eMissions (Per Person)
Albania 1994 7.06 3.20 2.21
Australia 2000* 535.30 19.44 27.54
Canada 2003 740.00 31.56 23.45
China 2004 3650.00 1198.50 3.05
European Union 1999 4030.00 375.30 10.74
Hong Kong 2003 43.5 6.803 6.39
India 2001 1228.54 914.00 1.34
Indonesia 1994 904.433 191 4.74
Iran 1994 417.01 57.67 7.23
Israel 1996 62.71 5.69 11.02
Japan 2002 1224.98 126.93 9.65
Laos 1990 0 4.57 0.00
Malaysia 1994 76 20.1 3.78
Marshall Islands 1990 0.0025 0.055 0.05
Mexico 2000 686.10 97.48 7.04
Micronesia 1997 0 0.106 0.00
Mongolia 1998 15.6 2.42 6.45
Nauru 1994 0.019 0.013 1.46
Netherlands 1999 174.10 15.80 11.02
New Zealand 1999 54.70 3.79 14.43
Niue 1994 0 0.002 0.00
Philippines 1994 100.738 73.527 1.37
Russian Federation 1999 1880.00 145.60 12.91
Samoa 1999 0.43 0.17 2.53
Singapore 1994 26.80 3.20 8.38
Solomon Islands 1994 0.32258 0.4 0.81
South Africa 1994 379.84 40.60 9.36
Thailand 1994 286.37 62.00 4.62
United Kingdom 2003 656.00 59.60 11.01
US 2003 6746.00 280.00 24.09
Zimbabwe 1994 0.00 10.64 0.00
1�
SC
rE
En
ED
UC
aT
ion
a n i n c o n v e n i e n t t r u t ha n i n c o n v e n i e n t t r u t h
and it’s an area where, quite frankly, there are no easy answers.
but as i think about climate change, it always occurs to me that we need to push on many fronts at once.
we need to work domestically to reduce emissions.
and we need to build international co-operation on reducing emissions and also on adapting to climate change.
Most importantly, we need to continue to pursue new technologies and new approaches to reduce carbon emis-sions here and globally.
That’s why i am a strong supporter of the Prime Minister’s call two weeks ago for a full debate on the use of nuclear energy in australia.
it is now fifteen years since the world gathered at rio and forged the Un Framework Convention on Climate Change.
The international community agreed on the need to stabilize greenhouse gases at a level that would prevent dangerous interference with the cli-mate system.
That much, we could all agree on. and australia would like this worthy goal implemented.
Then, ten years ago the Kyoto Proto-col was negotiated, to operationalize the Un Framework Convention by setting targets and timetables for de-veloped countries to limit greenhouse gas emissions.
Kyoto’s great achievement was that forty developed countries all pledged to curb emissions.
However, Kyoto’s great flaw was that it exempted the 149 countries of the developing world from making a simi-lar effort.
Moreover, it locked in a sharp distinc-tion between developed and develop-ing countries that in 2006 does not
reflect the reality of global emissions – and will do so even less by 2012.
now, we are often criticized for not signing onto the Kyoto Protocol but the fact of the matter is that australia is on track to meet our Kyoto target – unlike, by the way, many other de-veloped countries.
The latest greenhouse accounts show that australia has reduced per capita emissions by thirteen per cent since 1990 and emissions per dollar of gDP by thirty-five per cent.
we are indeed taking seriously the need for australia to contribute to greenhouse mitigation.
Yet large emitters such as brazil, Mex-ico, india, indonesia, Korea and China, have made no such commitment.
The net result is that global green-house gas emissions are projected to grow by forty per cent by 2012.
without Kyoto, global emissions would have grown by forty-one per cent.
http://www.foreignminister.gov.au/speeches/2006/060602_esaa.html
b.An Australian opposition Member’s view
The government’s response, record and progress have been woeful.
The advent of climate change and the likelihood of increasing global warm-ing means this issue is one of the most critical we face. its time scale is long, its impact as vast as the oceans already warming. it has presided over a substantial increase in greenhouse gas emissions which by 2020 are expected to increase by 23%. and [experts predict] our energy consump-tion to increase by a whopping 53% by that year too. Yes we are on track to reach the Kyoto first phase target of 108% of 1990 levels but only because of the australia clause whereby we could include as a one off land clear-ing, namely the benefits of the reduc-tions undertaken by the [Queensland]
government, in our emissions total.
otherwise we are stuffed, with no co-herent policy or institutional framework to address the ever growing green-house gas spiral.
whatever the precise effects of increasing amounts of carbon dioxide and other gases will be over the long term, there is strong consensus that deep cuts in greenhouse gas emis-sions will need to be made — some-thing in the order of 60% by 2050, and that the world will need both international agreements and financial instruments to enable and regulate that process.
The Kyoto Protocol, now in force, was the first attempt by the international community to address the issue. The protocol has been called a mod-est first step, which indeed it is, but Kyoto also represents a considerable achievement in;
1) bringing a large number of states to the table;
2) Establishing an international legal framework for reductions that facili-tates the trading of carbon and the investment in energy efficient tech-nologies as initial steps along the path to greenhouse gas reductions.
Critics have concentrated on the defi-ciencies of Kyoto; the status of carbon sinks, that the treaty is inequitable, the absence of developing nations and some big producers of greenhouse emissions like india and China, and the poor track record of those Euro-pean nations that have signed on but made little progress.
Some of these criticisms are ill founded. China and india, along with a number of developing countries are a part of Kyoto, they’ve signed on, but will not act yet. indeed the first obliga-tion agreed to amongst the devel-oped nations, namely to reduce their emissions which have permitted their existing high levels of development, has not really started.
1�
SC
rE
En
ED
UC
aT
ion
a n i n c o n v e n i e n t t r u t ha n i n c o n v e n i e n t t r u t h
and it is true that progress in Europe has been less than spectacular. but for those who say it’s too modest in scope, ‘from little things big things grow’ we say.
http://www.petergarrett.com.au/c.asp?id=35
C. An Australian Parliamentary Paper summary
australia made an international com-mitment in December 1997 at Kyoto to limit its greenhouse gas emissions growth to 108 per cent of its 1990 baseline, which equates to nearly a 30 per cent reduction from its ‘business as usual’ projections.
australia was one of three countries — the other two being norway and iceland — granted an increase of its emission levels on its 1990 base; an argument won on the concept of ‘differentiated targets’ based on a country’s particular economic circum-stance. in contrast, this compares to developed countries collectively agreeing to reduce their aggregate emissions of greenhouse gases by at least 5 per cent from 1990 levels in the first commitment period 2008–2012.
whilst australia has not agreed to ratify Kyoto it has put in place a broad range of measures representing al-most $1 billion worth of investment, to ensure that the commitment made at Kyoto can be met.
[However],the energy sector is one of continuing growth in emissions and an increasing share of australia’s total greenhouse emissions. according to the australian greenhouse office (ago), emissions in the Energy Sector are expected to grow by over 39 per cent between 1990 and 2010 [which would mean that] over the period 2008–2012 australia’s emissions would be 111 per cent of 1990 levels on average.
http://www.aph.gov.au/library/int-guide/SCi/kyoto.htm
7 why has the government not rati-fied the Kyoto Protocol?
8 The government claims that a binding commitment to the Kyoto Protocol would be against the national interest while having no impact on the international green-house emission situation. is this a reasonable attitude for a govern-ment to adopt?
9 The government also claims that it is implementing policies that will achieve the reduction required without having ratified Kyoto. Does this seem to be happening?
australia is reducing its emissions, and has also joined the asia-Pacific Partnership on Clean Development and Climate (or aP6), including USa, australia, China, Japan, South Korea and india. These nations, several of them developing economies, represent over 50% of emissions. The aim is to co-operate on the development and transfer of new technology to reduce greenhouse gases. but there are no set targets, and any targets voluntarily adopted are not legally enforceable.
Here is a document produced by the australian government.
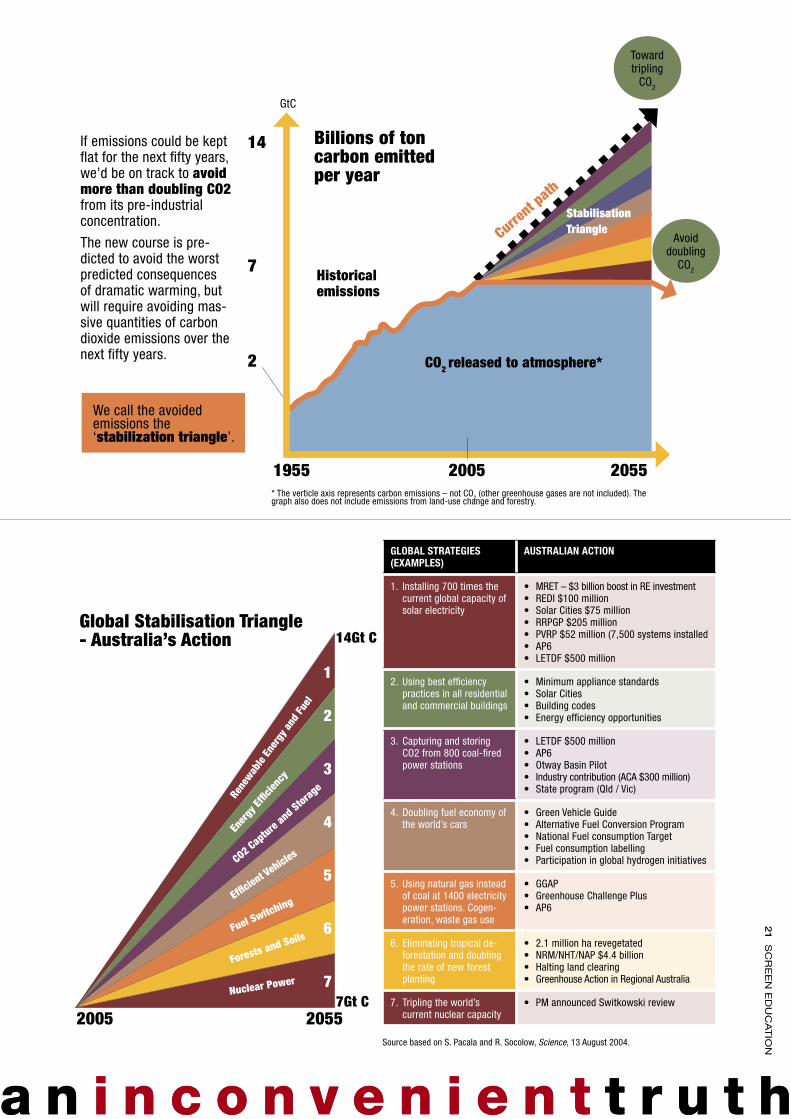
look at the chart on the next page, pro-duced by the australian government.
10 what does it show?11 what is meant by the ‘stabilisation
triangle’?12 what will this ‘stabilisation triangle’
do?13 Divide into seven groups. Have
each group research and explain exactly how each of those seven elements will help solve the prob-lem of greenhouse emissions lead-ing to global warming. report back to the whole class, and add a brief sentence of explanation to each of the seven strategies.
14 Do you think australia is acting responsibly in its greenhouse poli-cies and programs?
15 How would you represent austral-ia’s situation if you could add a small section to An Inconvenient Truth?
LOOKING AT THE fILM’S TRAILER AND POSTER
The trailer to the film has been made by a different company to the film itself. look at the trailer at www.ani-nconvenienttruth.com.au for the film, and read this comment by gore during an interview:
It’s a great trailer, very effective. But the people who make the trailer are completely different from the people who make the movie. I think they’ve done a terrific job on the movie, and I think a different group did a terrific job on the trailer.
The purpose of a trailer is very dif-ferent from the purpose of a movie. I talked with steven spielberg, who saw the movie and loved it, and saw the trailer and loved it. And I asked him pretty much the same question you’re asking me. He said, ‘Al, you’ve got to know this: the purpose of a trailer is to grab an audience by the throat and wrestle them into the seat.’ [Laughs.] They’ve got two minutes instead of ninety-two minutes, and they want to get people in to see the movie.
http://www.grist.org/news/main-dish/2006/05/09/roberts/index.html
look also at the poster for the film, and the interactive exercise on it, at www.aninconvenienttruth.com.au
1 what is each trying to achieve?2 are they fair representations of the
film?3 are they persuasive?
CONSIDERING SOLUTIONS
Finding out more
one of the areas that An Inconvenient Truth raises is alternatives to oil and coal energy.
Here are some alternative sources that are briefly mentioned.
• Solar• wind
�0
SC
rE
En
ED
UC
aT
ion
a n i n c o n v e n i e n t t r u t ha n i n c o n v e n i e n t t r u t h
We call the avoided emissions the ‘stabilization triangle’.
Billions of ton carbon emitted per year
If emissions could be kept flat for the next fifty years, we’d be on track to avoid more than doubling CO2 from its pre-industrial concentration.
The new course is pre-dicted to avoid the worst predicted consequences of dramatic warming, but will require avoiding mas-sive quantities of carbon dioxide emissions over the next fifty years.
* The verticle axis represents carbon emissions – not CO2 (other greenhouse gases are not included). The graph also does not include emissions from land-use change and forestry.
Historical emissions
Toward tripling
CO2
Avoid doubling
CO2
Current p
ath
1955 2005 2055
14
7
2
Stabilisation Triangle
GtC
CO2 released to atmosphere*
global strategies (exaMPles)
australian action
1. Installing 700 times the current global capacity of solar electricity
• MRET – $3 billion boost in RE investment• REDI $100 million• Solar Cities $75 million• RRPGP $205 million• PVRP $52 million (7,500 systems installed• AP6• LETDF $500 million
2. Using best efficiency practices in all residential and commercial buildings
• Minimum appliance standards• Solar Cities• Building codes• Energy efficiency opportunities
3. Capturing and storing CO2 from 800 coal-fired power stations
• LETDF $500 million• AP6• Otway Basin Pilot• Industry contribution (ACA $300 million)• State program (Qld / Vic)
4. Doubling fuel economy of the world’s cars
• Green Vehicle Guide• Alternative Fuel Conversion Program• National Fuel consumption Target• Fuel consumption labelling• Participation in global hydrogen initiatives
5. Using natural gas instead of coal at 1400 electricity power stations. Cogen-eration, waste gas use
• GGAP• Greenhouse Challenge Plus• AP6
6. Eliminating tropical de-forestation and doubling the rate of new forest planting
• 2.1 million ha revegetated• NRM/NHT/NAP $4.4 billion• Halting land clearing• Greenhouse Action in Regional Australia
7. Tripling the world’s current nuclear capacity
• PM announced Switkowski review
Global Stabilisation Triangle - Australia’s Action 14Gt C
7Gt C2005 2055
Source based on S. Pacala and R. Socolow, Science, 13 August 2004.
Rene
wable
Ene
rgy a
nd F
uel
Ener
gy Ef
ficien
cy
CO2 Capture
and Stor
age
Efficient Vehicles
Fuel Switching
Forests and Soils
Nuclear Power
1
2
3
4
5
6
7
�1
SC
rE
En
ED
UC
aT
ion
a n i n c o n v e n i e n t t r u t ha n i n c o n v e n i e n t t r u t h
• Hydro• biomass• wave power• geothermal
1 Divide your class into small groups, with each group having responsibility for exploring a differ-ent source. The key questions to report on are:
• How does it produce energy?• where is it being used?• To what extent?• what are its advantages and dis-
advantages as an energy source? (Consider both environmental and economic aspects here.)
• will it promote ecological sustain-ability?
2 one of the alternative sources that is not mentioned in An Inconven-ient Truth is nuclear energy. is it a low-greenhouse emissions alterna-tive? Do other potential dangers associated with its use make it an unacceptable alternative? re-search and discuss this important issue.
whose responsibility is it to reduce greenhouse emissions? is it up to governments, or do individu-als have a responsibility? Do the developed nations have a greater responsibility than the developing ones, given that we have already benefited from energy use in a way that developing nations are now trying to do? Can an individual really do anything, or is it all too overwhelming?
The film’s website suggests a number of practical steps that every individual can take to reduce their own green-house impact.
3 Here is a practical way of calculat-ing your own personal contribution to greenhouse emissions:
Carbon Dioxide gas emissions are measure and recorded in kilograms.
1. work out how many kilometres your family drove last year in total. if any member of your family drives another vehicle as part of a job,
estimate the distance driven over the year. Calculate the amount of fuel used – family members will have a very good idea of the con-sumption of each vehicle. 2.35kg is produced per litre of petrol – calcu-late the total amount produced in a year.
2. Check your electricity bills for the past year. For each kwh (kilo-watt-hour) allow 0.8kg of carbon dioxide.
3. Do the same for your gas bills. For each cubic metre or 300MJ of natural gas (methane) that your household used, you produced 2.5kg carbon dioxide.
4. if you flew on a commercial airline in the last year, add 0.35kg for each kilometre flown by each per-son (i.e. if a a family of four went on holiday, multiply the distance by four).
add the totals for each section. Then double it to allow for fuel used in the goods and services you used (carbon dioxide is pro-duced to make the products that you buy and in heating or cooling the buildings that you visit). what’s the number?
now, list the ways in which you could reduce your impact.
Extension Question: is it better for your family to fly to a holiday des-tination 500km distant or to drive there? (ignore all other factors!) Calculate the comparative emis-sion figures.
Personal actions
4 look at website http://www.climatecrisis.net go to the TaKE aCTion page.
The next pages show possible actions that individuals in a family can take. Use the information to fill in your own responses to each of the columns in this table.
(SEE TABlE 2 OVERlEAf)
Conclusion
An Inconvenient Truth finishes with this statement:
future generations may well have oc-casion to ask themselves: ‘what were our parents thinking? why didn’t they wake up when they had a chance?’ we have to hear that question, from them, now.’
1 Do you agree that human activity is creating greenhouse gases that are contributing to global warming that may create harmful effects in the world?
2 if not, are you certain that human activity is not having this effect?
3 Do you believe that you have a personal responsibility to act in a way that reduces personal green-house gas emissions?
4 Do you agree with gore’s state-ment above?
5 How would you answer the ques-tion?
Further resources
An Inconvenient Truth website: http://www.climatecrisis.net
an interview with al gore: http://www.grist.org/news/main-dish/2006/05/09/roberts/index.html
a climate scientist site, with its verdict on the film: http://www.realclimate.org/index.php?p-299
a global warming education site: http://www.climatechangeeducation.org/
The Pew Center researching climate change: http://www.pewclimate.org
The Climate institute researching climate change: http://www.climate.org
australia’s CSiro site: http://www.csiro.au
australian government Department of the Environment and Heritage australian greenhouse office: http://www.greenhouse.gov.au
Sceptical sites: http://www.cei.org http://www.junkscience.com http://www.globalwarming.orgal gore, An Inconvenient Truth, ro-
dale, Pennsylvania, 2006.Tim Flannery, The weather Makers,
Text Publishing, Melbourne, 2005.bjorn lomborg, The skeptical environ-
mentalist, Cambridge University Press, Cambridge, 2001.
��
SC
rE
En
ED
UC
aT
ion

a n i n c o n v e n i e n t t r u t ha n i n c o n v e n i e n t t r u t h
1 suggested action
2 why is it desirable?
3 are there any unde-sirable asPects to it?
4 would you consider doing it? yes, no, Maybe and why.
5 iMPact – see the website to get these figures
Replace a regular incandescent light bulb with a compact fluorescent light bulb (cfl).
Move your thermo-stat down 1°C in winter and up 1°C in summer.
Clean or replace fil-ters on your furnace and air conditioner.
Install a programma-ble thermostat.
Wrap your water heater in an insula-tion blanket.
Use less hot water.
Use a clothesline instead of a dryer whenever possible.
Unplug electronics from the wall when you’re not using them.
Only run your dish-washer when there’s a full load and use the energy-saving setting.
Insulate and ‘weather proof’ your home.
Be sure you’re recy-cling at home.
Plant a tree.
Switch to green power.
table 2
��
SC
rE
En
ED
UC
aT
ion

a n i n c o n v e n i e n t t r u t ha n i n c o n v e n i e n t t r u t h
1 suggested action
2 why is it desirable?
3 are there any unde-sirable asPects to it?
4 would you consider doing it? yes, no, Maybe and why.
5 iMPact – see the website to get these figures
Buy locally grown and produced foods.
Buy fresh foods instead of frozen.
Seek out and sup-port local farmers’ markets.
Buy organic foods as much as possible.
Avoid heavily pack-aged products.
Eat less meat.
Reduce the number of miles you drive by walking, biking, car pooling or taking mass transit wher-ever possible.
Start a car pool with your coworkers or classmates.
Keep your car tuned up.
Check your tyres weekly to make sure they’re properly inflated.
When it is time for a new car, choose a more fuel efficient vehicle.
Try car sharing.
Try telecommuting from home.
Fly less.
table 2
��
SC
rE
En
ED
UC
aT
ion
a n i n c o n v e n i e n t t r u t ha n i n c o n v e n i e n t t r u t h
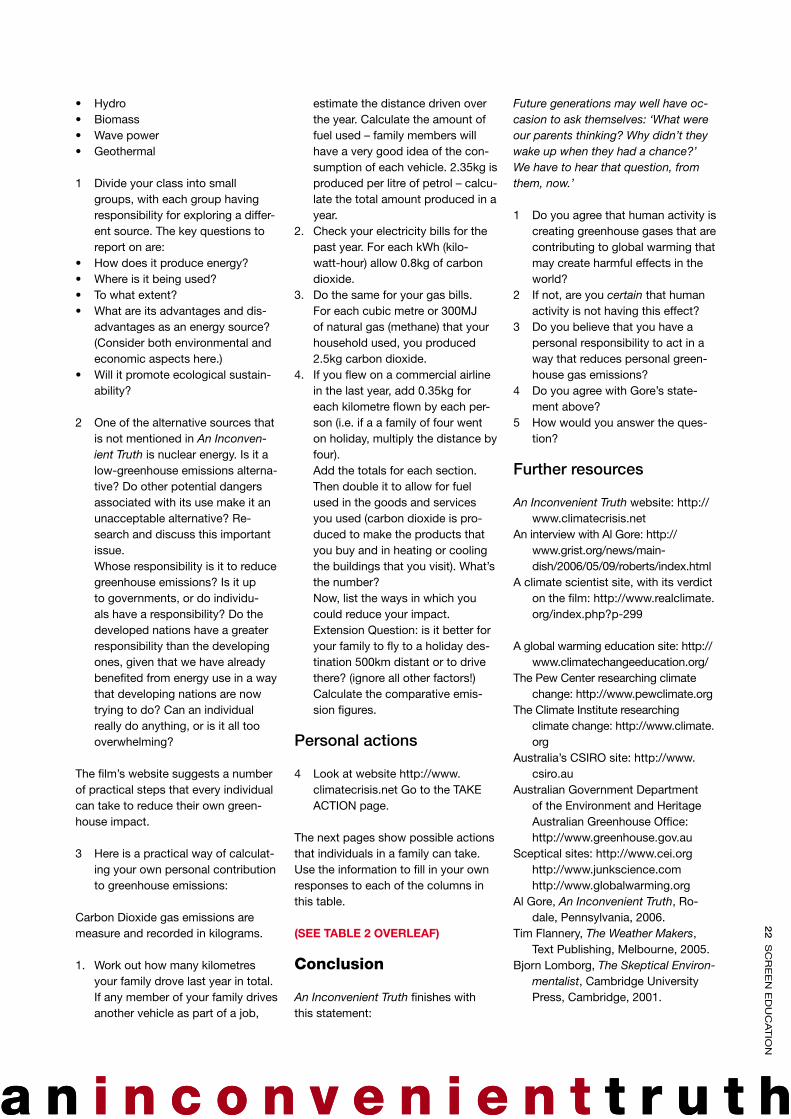
Want to do stomething to help stop global warming?Here are ten simple things you can do and how much carbon dioxide you’ll save doing them.
Change a lightreplacing one regular light bulb with a compact fluorescent light bulb will save 68 kilograms of carbon dioxide a year.
Drive lesswalk, bike, carpool or take mass transit more often. You’ll save 282 grams of carbon dioxide for every kilometre you don’t drive!
Recycle moreYou can save 1.1 tonnes of carbon dioxide per year by recycling just half of your household waste.
Check your tyresKeeping your tyres inflated properly can improve fuel efficiency by more than three per cent.
Every litre of petrol saved keeps 2.4 kilograms of carbon dioxide out of the atmosphere!
Use less hot waterit takes a lot of energy to heat water. Use less hot water by installing a low flow showerhead
(160 kilograms of Co2 saved per year) and washing your clothes in cold or warm water (225 kilograms saved per year).
Avoid products with a lot of packagingYou can save 544 kilograms of carbon dioxide if you cut down your garbage by ten per cent.
Adjust your thermostatMoving your thermostat down just one degree in winter and up one degree in summer
could save about 900 kilograms of carbon dioxide a year.
Plant a treea single tree will absorb 900 kilograms of carbon dioxide over its lifetime.
Be a part of the solutionlearn more and get active at ClimateCrisis.net
Spread the word! Encourage your friends to see An Inconvenient Truth.
tenthingstodo
aninconvenienttruthin cinemas 14 September
for school group bookings:
www.aninconvenienttruth.com.au
��
SC
rE
En
ED
UC
aT
ion
a n i n c o n v e n i e n t t r u t ha n i n c o n v e n i e n t t r u t h
This study guide was produced by ATOM © aToM 2006
For more information on Screen education
magazine or to download other free study guides visit
www.metromagazine.com.au
For hundreds of articles on Film as Text, Screen
literacy, Multiliteracy and Media Studies, visit
www.theeducationshop.com.auNotice: an educational institution may make copies of all or part of this Study guide, provided that it only
makes and uses copies as reasonably required for its own educational, non-commercial, classroom pur-
poses and does not sell or lend such copies.
��
SC
rE
En
ED
UC
aT
ion