Embed Size (px)
Citation preview

A3: Contaminant Reduction, Life Cycle Impacts, and Life Cycle Costs of Ion
Exchange Treatment and Regeneration Treavor Boyer and Alysse Ness, University of Florida
Jane Zhang, University of South Florida
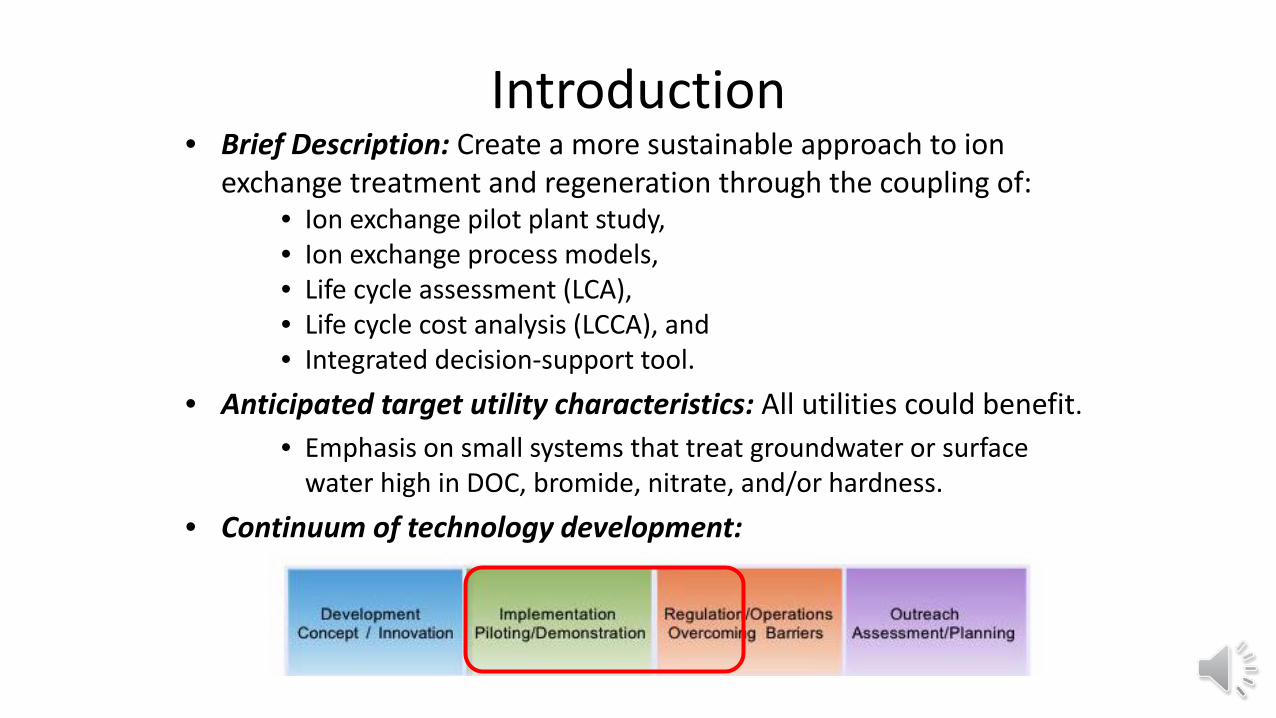
Introduction • Brief Description: Create a more sustainable approach to ion
exchange treatment and regeneration through the coupling of: • Ion exchange pilot plant study, • Ion exchange process models, • Life cycle assessment (LCA), • Life cycle cost analysis (LCCA), and • Integrated decision-support tool.
• Anticipated target utility characteristics: All utilities could benefit. • Emphasis on small systems that treat groundwater or surface
water high in DOC, bromide, nitrate, and/or hardness.
• Continuum of technology development:

Innovative Ion Exchange
IX and Combined IX
Regeneration Disposal NaCl v. non-NaCl
DOC Bromide Nitrate Hardness Ba, Sr
Contaminant-free

Pilot Plant Study • Cedar Key Water & Sewer
District, Cedar Key, FL • Serves approx. 900 customers
• Pilot plant operation • 2–3 days/week, 6–8 hours/day
• Ion exchange operation • 3 service–regeneration cycles • NaCl vs. NaHCO3 regeneration
• Analysis • On-site: UVA254, total hardness,
temperature, conductivity, Fe • UF: DOC, inorganic anions and
cations

Cedar Key Groundwater
Average water quality
TOC 6 mg C/L Conductivity 505 µS/cm
UVA254 0.176 1/cm pH 7.4 SUVA 3.0 L/(mg C-m) Iron 1 mg/L
Hardness 240 mg/L as CaCO3 January–February 2016

Cedar Key Groundwater
Ion Exchange Pilot Plant 2A - NaCl 2B – NaHCO3
Treated Water
Sample Locations: Raw water, Column 2A Effluent, Column 2B Effluent, CK Tap

Sampling
Sample Locations: 1. Column Influent 2. Column 2A Effluent 3. Column 2B Effluent 4. Cedar Key Tap Water

Test Plan Test Water Contaminants Resin [NaHCO3] [NaCl] Breakthrough Regen.
- - - % % [BV] QA/ QC
Cedar Key GW UVA254, DOC A-30 MP - 16 UVA254 removal < 90% 5
1 Cedar Key GW UVA254, DOC A-30 MP
8 16 UVA254 removal < 90% 5 8 Equiv.
2 Cedar Key GW UVA254, DOC A-72 MP
8 16 UVA254 removal < 90% 5 8 Equiv.
3 Cedar Key GW UVA254, DOC TBD 8 16 UVA254 removal < 80% 5
4 Cedar Key GW UVA254, DOC TBD 8 16 UVA254 removal < 90% 7.5
2.5
5 CK + NaBr UVA254, DOC, Br A-30 MP
8
16 UVA254, Br- removal < 90% 5 A-72 MP

Service Cycle Column Description
Inner Diameter 4 in Resin Bed Depth 28 in Resin Bed Volume 352 in3
1.5 gal 5.8 L
Service Cycle Service Flow Rate 0.4 gpm 1.512 L/m Operational Mode Co-current EBCT 3.8 min BV/hr 16 BV/h Flow Rate 4.6 gpm/ft2

Cycle #1 Cycle #3 Cycle #2
0
0.05
0.1
0.15
0.2
0.25
0 200 400 600 800 1000 1200 1400 1600
UV
254
(1/c
m)
BV Treated
Test 0: UV 254
Col Inf 2A Effleunt 2B Effluent CK Tap

0
1
2
3
4
5
6
7
8
9
0 200 400 600 800 1000 1200 1400 1600
DOC
(mg/
L)
BV Treated
Test 0: DOC
Column Inf 2A Effleunt 2B Effluent CK Tap
Cycle #2 Cycle #3 Cycle #1

0
0.5
1
1.5
2
2.5
3
3.5
4
0 200 400 600 800 1000 1200 1400 1600
SUVA
(L/m
g-m
)
BV Treated
Test 0: SUVA
Col Inf 2A Effluent 2B Effluent CK Tap
Cycle #1 Cycle #3 Cycle #2

Cycle #1 Cycle #3 Cycle #2
0
0.5
1
1.5
2
2.5
0 200 400 600 800 1000 1200 1400 1600
Iron
(mg/
L)
BV Treated
Test 0: Iron
Col Inf 2A Effluent 2B Effluent CK Tap

Cycle #1 Cycle #3 Cycle #2
0
100
200
300
400
500
600
700
800
0 200 400 600 800 1000 1200 1400 1600
Cond
uctiv
ity (u
S/cm
)
BV Treated
Test 0: Conductivity
Col Inf 2A Effluent 2B Effluent

Cycle #1 Cycle #3 Cycle #2
4
5
6
7
8
9
10
0 200 400 600 800 1000 1200 1400 1600
pH
BV Treated
Test 0: pH
Col Inf 2B Effluent 2A Effluent

Regeneration Cycle Regeneration
Operational Mode Co-current
Regen Flow Rate 0.2 gpm
0.756 L/m
Regen EBCT 7.6 min
Regen BVs 5
Regen Total Time 39 min
Regen Total Volume 29.5 L
Regen 2A - NaHCO3
Regen 2B - NaCl
Rinse Cycle
Rinse Flow Rate 0.4 gpm
Operational Mode Co-current
Rinse EBCT 3.8 min
Rinse BVs 5
Rinse Total Time 19 min
Backwash
Backwash Flow Rate 0.4 gpm
Operational Mode Countercurrent
Backwash Total Time 10 min
Backwash Total Volume 4.2 gal
Backwash Volume 2.76 BV Sample: 3 samples/regeneration, 1 composite sample, 1 rinse sample Efficiency calculations based off of composite sample

Regeneration Results
Test 0: Regeneration Efficiency DOC On DOC Off Regen Eff DOC Remaining
g g % g Cycle 1 Col 2A 30.29 27.22 90 3.07
Col 2B 30.29 26.38 87 3.91 Cycle 2 Col 2A 17.70 10.86 61 6.84
Col 2B 18.54 13.74 74 4.80 Cycle 3 Col 2A 14.46 6.74 47 7.72
Col 2B 12.42 6.14 49 6.29

Modeling Framework

Modeling Framework: Fixed Bed Configuration
Zhang et al. 2016 Wat. Res.

Modeling Framework: Completely Mixed Flow Reactor
Bicarbonate-form anion exchange
Chloride-form anion exchange
2.2 mg/L DOC
1.7 mg/L DOC

LCA and LCCA: Regeneration Chemicals
Maul et al. 2014 Chemical Engineering J.

LCA and LCCA: Reactor Configuration
Amini et al. 2015 J. of Cleaner Production

Integrated Decision Model

Example: Development of Energy–Aquaculture Sustainability tool

Integration of Process Model with LCA/LCCA

Outputs and Outreach Completed: “Innovative Ion Exchange and Life Cycle Impacts for Small Water
Systems”, Story in WaterOperators.org, Winter 2015/2016 Scheduled: “Combined Ion Exchange in FL”, Small Systems course, U Colorado
Boulder, Spring 2016. “Innovative Ion Exchange and Regeneration”, US EPA Small
Systems webinar series, Fall 2016 Anticipated: Poster or talk entitled, “Pilot-Scale Evaluation of Bicarbonate-Form
Anion Exchange” at AWWA WQTC, Fall 2016 Manuscripts for submission to peer-reviewed journal, Spring 2017