Embed Size (px)
Citation preview

AD 697 631
EVOLUTION OF ENGINEERING PRINCIPLES FOR FRACTURE-SAFE DESIGN OF STEEL STRUCTURES
W. S. Pellini
Naval Research Laboratory Washington, D. C.
23 September 1969
Distributed ...'to foster, serve and promote the nation's
economic development and technological
advancement.'
•••• • • ••
••••• • ••• ••• •
•• • • ••
•••• • ••
• • ••
•• • •••
• • •••• •
• ••
U.S. DEPARTMENT OF COMMERCE/National Bureau of Standards
This document has been approved for public release and sale.
•i


n of Engineering Principles for ] ^esi^n of Steel Structures
NAVAL RESEARCH LABORATORY Washington, B.C.
'ease and


B>WW'WW>aiK>Wlwmw.-m'j*a<«w»"rr?-- sTMWW* »wmiNMrcaMMWP *
PREFACE
The aim of this report is to provide a compact review of the evolution and general engineering status of fracture-safe design in its many ramifications. It is directed to the Information needs of practicing engineers who must evolve optimized solutions to such problems in the full context of scientific, technological, and economic factors. Accordingly, particular emphasis is placed on the ii.teractions of these factors, which dictate the selection of metals featuring adequate fracture resistance for specific applica- tions. Discussions of the range of fracture properties that are available for selection emphasize that the metallurgical optimiza- tion of metals to meet design requirements is an inherent aspect of fracture-safe design.
The chronological treatment and separation of the subject mat- ter in the various sections and Appendices suggested a reference system of bibliographic type. These primary references, which are arranged chronologically and by subject matter, have been selected to lead the reader into details of studies for the various time periods. The titles of the textbooks generally identify the contents. This treatment provides for the broadest possible ref- erence system without complications of multiple cross references.
|
,- ■-■■■ ' ■ ■

CONTENTS
Preface Abstract Problem Status Authorization
LIST OF SYMBOLS
INTRODUCTION
ORIGIN OF THE PROBLEM AND EARLY STUDIES
EVOLUTION OF NATURAL CRACK TESTS
CRACK ARREST TESTS 0
FRACTURE ANALYSIS DIAGRAM (FAD)
SHELF CONSIDERATIONS
FRACTURE MECHANICS PLANE STRAIN TESTS
SECTION SIZE EFFECTS ON THE TRANSITION TEMPERATURE RANGE
EXPANDED VERSION OF FAD
THE STRENGTH TRANSITION
RATIO ANALYSIS DIAGRAM (RAD)
FRACTURE MECHANICS RELATIONSHIPS TO THE STRENGTH TRANSITION
WELDS AND WELDABILITY FACTORS
ISSUES AND PROJECTIONS
BIBLIOGRAPHY
APPENDIX A - Elementary Aspects of Fracture Mechanics 92
APPENDIX B - Fracture Mechanics Terms and Equations 98
i iii iii iii
iv
1
3
12
21
25
41
47
58
65
67
73
77
78
82
88
ii

•■flfl^w"1
ABSTRACT
An interpretive review is presented of the development of scientific knowledge of fracture processes and of the technological application of this information to the evolution of engineering principles for fracture- safe design. The review is in the format of a chronological exposition of the successive advancements in the state of knowledge relating to both the mechanical and metallurgical aspects of the subject. The consolida- tion of these aspects emphasizes that fracture-safe design practices are not separable into metallurgical and mechanical aspects, but rather involve detailed engineering consideration of both factors.
The evolution of modern fracture-safe design technology has Its origins in the broad-scope research activity period of the 1940's. The results of the early research provided an enduring base on which more selective studies were evolved in the ensuing decades. The evolution of significant fracture toughness characterization test methods and of pro- cedures for their analytical interpretation, with respect to both metal- lurgical quality and mechanical aspects, paced the rate of progress dur- ing this time period. In this report a detailed description is provided of these various tests, with separation as to types which were primarily of research interest as compared to those which emerged as suitable for general engineering usage.
The theoretical bases for analytical translation of laboratory test data to structural performance factors are discussed, with particular reference to the subject of fracture mechanics. The role of metallurgi- cal factors is described in relation to microfracture processes which determine the macroscopic engineering properties.
PROBLEM STATUS
This is a special summary and interpretative report covering the results of a wide spectrum of investigations within the Metallurg/Divi- sion of NRL. These investigations are aimed at the general problem of metallurgical optimization andfracture-safe design. The major portions of the studies are continuing under the established problems.
AUTHORIZATION
NRL Problem Nos. M01-25, M01-24, and F01-17 Project Nos. RR 007-01-46-5432, SF 51-541-001-12390,
SF 51-541-002-12380, SF 51-541-003-12383, RR 007-01-46-5431, and S 4607-11894
Manuscr.pt submitted July 3, 1969.
ill
■■"-'"'-"—TuntittitUMi

r MMHMtaWvH«.
LIST OF SYMBOLS
a depth, half length, or half diameter of the crack (in.)
B thickness of the plate or specimen (in.)
K, Kj stress intensity factor; the subscript i denotes the opening mode of crack extension (ksi fin.)
Kjc slow-load (static) plane strain fracture toughness (ksi fW.)
KId dynamic-load plane strain fracture toughness (ksi fin.)
Kc plane stress condition at crack tip for initiation; also, crack conditions in propagation as related to this fracture mode (ksi /hu)
Kc plane stress (surface) and plane strain (center) condition for crack tip Initia- (mlxed tion; also, crack conditions In propagation as related to this fracture mode mode) (ksi /In.)
PZS Plastic Zone Size
r plastic zone radius (in.)
a or aN applied stress (psi or ksi)
a yield strength for static (slow) loading (psi or ksi)
a d yield strength for dynamic loading (psi or ksi)
Q crack shape parameter for semielllptlcal surface cracks
NDT Nil Ductility Transition temperature obtained by DWT or indexed by DT test
FTE Fracture Transition Elastic
FTP Fracture Transition Plastic
DWT Drop Weight Test
DWTT Drop Weight Tear Test (now DT)
DT Dynamic Tear Test-all sizes
CAT Robertson Crack Arrest Temperature
Cv Charpy-V test
(^ Charpy-Keyhole Test
COD Crack Opening Displacement
ECST Explosion Crack Starter Test
FAD Fracture Analysis Diagram
iv

mmmmmsmmMf:y-m.wm>wnW®MK1l
RAD Ratio Analysis Diagram
LTTR Limiting Transition Temperature Range as defined by dynamic fracture propagation tests; normally considered as the NDT to FTP temperature Interval
Enclave fracture propagation condition Involving through-thickness yielding (plastic contraction) and dimpling of the region in advance of the crack
Ratio signifies K Ic/ayi or KId/ayd

a^wwiwwaywMin^^^ fnH,flHHMMSHBHWIf<(l!MPMlNKt
EVOLUTION OF ENGINEERING PRINCIPLES FOR FRACTURE-SAFE DESIGN OF STEEL STRUCTURES
INTRODUCTION
Fracture-safe design implies deliberate engineering analyses of the possibilities for structural failure by fracture-in addition to the usual considerations given to the pre- vention of other forms of failure. It implies that reasonably reliable solutions are evolved for the exclusion of failure by this mode. As for the case of other failure modes, there is no singular procedure which will satisfy all engineering requirements. The fracture research field has provided a variety of procedures for analyses and solutions to specific problems. However, engineering considerations for specific cases may lead to valid conclusions that none of these procedures need to be applied. Such decisions are not the equivalent of simply neglecting the problem. Unfortunately, neglect is often con- sidered as a nonutillzation decision. The problem must be analyzed to qualify as a proper exercise of engineering responsibilities with respect to fracture. Decisions not to utilize specific practices require the same background knowledge as those which lead to the utilization of fracture-safe design practices.
These considerations define one extreme of the subject and relate to the ever recur- ring debate that certain types of structures have experienced very low or nil casualty rates without the benefit of fracture analyses. The reasons for variations of casualty rates with type of structure are analyzable and relate in large measure to the redundancy aspects. The failure of highly redundant structures is improbable because the fracture of a load-bearing member is not translatable to other parts. The redundancy aspect represents one of the first considerations in fracture-safe design. The other extreme, which also bears on this question, is the unreasonable expectation that fracture-safe design procedures should provide protection against fracture to a degree that will offset engineering design and fabrication errors of gross magnitude. The realities of the case are that fracture-safe design procedures can only provide solutions to specific problems in context with the proper exercise of other engineering responsibilities, and that these solutions can never be divorced from reliability considerations. The reliability aspects arise from the fact that the problem of fracture has its origins in the nature of flaws which can be expected to exist in specific structures. U no flaws exist, then the smooth- body ductility of the tensile test can be assumed to apply. If flaws do exist, then the problem is one of cracked-body strength and ductility, for which fracture tests apply.
The performance of a cracked-body structure is the essence of the problem and, as such, the reliability of definitions of the flaw state affects all other reliabilities. While load stresses and the fracture characteristics of the metal may be defined with relatively high engineering precision, the flaw state always remains a matter of semi- qualitative description. In practice, the engineer must expect flaw states which can only be described in the fairly rough cuts, i.e., very small, small, intermediate, and large. This must be the case because the design process is performed prior to the fabrication of the structure. Nondestructive Inspection simply serves the purpose of defining if the "drafting board" assumptions of flaw sizes have been met. Moreover, the reliability of nondestructive testing is also expressible practically in relatively broad cuts of flaw sizes. High precision of a priori definitions of flaw sizes is an illusion, best dispelled at early stages of fracture-safe design considerations.
Because of the flaw-size aspects of the problem, engineering considerations of fracture-safe design can never be separated from questions of relative reliabilities.

2 W.S. PELLINI
Decisions as to the reliability requirements for specific structures are engineering de- cisions outside of the province of the fracture speclallst. One of the most Important engineering decisions Involves selecting the particular fracture-safe design practice which fits the reliability requirements. This selection Is unavoidably related to the fracture characteristics of the metal. The properties of the metal dictate the fracture- safe design practice that should be used and Its relative reliability. Ja effect, the nature of the metal can either offset or accentuate the problem of flaw-size definitions. The Interaction of metal and procedure can be explained simply in terms of three board types of metals as follows.
Type 1 - metals which feature very low resistance to the initiation and propagation of brittle fracture at elastic stress levels.
Type 2 - metals which feature relatively high resistance to the Initiation of brittle fracture, but low resistance to its propagation at elastic stress levels.
Type 3 - metals which can only fall in a ductile mode and at load stresses in excess of yield levels.
The fracture-safe design for brittle metal of types 1 and 2 is provisional to not exceeding specified limits of flaw-size and elastic-stress levels. For the highly brittle metals of type 1, the provisional aspects are not favorable to providing reliable engi- neering assurance because of the very small size of the flaws which may cause fracture initiation at elastic-stress levels. For the moderately brittle metals of type 2, the pro- visional aspects are sufficiently reliable to provide for practical engineering use. The ductile metals of type 3 may be considered Inherently (nonprovisionally) fracture-safe with respect to the propagation of unstable fracture. However, ductile failure may be developed by exceeding other normal requirements for safe design, for example, attaining gross plastic.overloads.
The major emphasis in fracture studies of recent years has been placed on the development of procedures for provisional fracture-safe design based on precluding the Initiation of brittle fracture. Whenever metals of relatively brittle characteristics must be used in engineering structures it is essential to utilize these procedures, which involve direct or indirect applications of fracture mechanics theory.
The engineering procedures for the selection of steels, which are inherently rather than provisionally fracture-safe with respect to unstable (fast) fracture, are based on the definition of mechanical transitions from elastic stress-induced to plastic stress- induced fracture. The transition concepts involve the separation of metal characteris- tics into the three basic types described above. These concepts are not in opposition to fracture mechanics theory but include and utilize all engineering considerations which evolve from this discipline. This fact is emphasized because of popular misconceptions that transition and fracture mechanics considerations represent basically different approaches to fracture-safe design. This is not the case because any expression of mechanical resistance to fracture must include considerations of transitions from brittle to ductile states.
The evolution of fracture-safe design procedures has included both the Inherent and provisional approaches to the problem. In fact, with increasing fracture toughness, the ductility barrier to fracture initiation becomes sufficiently high to provide reliable engineering safeguards based on the provisional approach, even for conditions for which unstable fracture is possible. Thus, the choice between provisional and inherent fracture- safe design reduces to questions of service requirements, structural quality (flaw states), and the criticality of the structure. All of these factors must be considered from the usual engineering points of view.

MMH wmmsKSi
NRL REPORT 6957 3
The problem of the brittle fracture of metals has many ramifications-scientific, technological, and legal. The foremost scientific interest centers on studies of micro- fracture processes and their relation to macroscopic strength. The metallurgist is dependent on this information for the evolution of improved metals. The technological aspect is best represented by the implicit responsibility of designers for the selection of metals which satisfy the requirements of stress analyses with respect to both smooth- body strength and cracked-body ductility. The legal point of view includes the complex of codes, standardization of tests and test procedures, and all other aspects of the certi- fication of reliability which, if not satisfied, would result in assignment of legal respon- sibilities for catastrophic events. This last aspect is rarely mentioned or discussed in the technical literature. However, it is the factor which ultimately enforces the tech- nological utilization of the best available scientific knowledge for fracture-safe design in engineering practice.
ORIGINS OF THE PROBLEM AND EARLY STUDIES
Prior to the 1940's, metal structures were generally fabricated by riveting and bolting. The failure of a component part of such structures is generally an isolated event which rarely }eads to total collapse. It was not appreciated that the monolithic nature of non- redundant welded structures provides continuity conditions such that facture initiation in even a small appendage part can lead to catastrophic consequences. This fact became appallingly clear with the welded fabrication of World War n ships, which led to failures as shown in Fig. 1. The Initiation of fracture in a minute element of the structure, say in a cubic inch or less of metal located at a sharp intersection such as a hatch corner, was often followed by nearly instantaneous fracture of the ship.
Fig. 1 - Example of ship fracture

4 W^. PELLINI \
The problem was compounded by the lack of reliable Information on the relationships of metallurgical factors to the specific fracture sensitivity of steels. Thus, the metallur- gist could not proceed directly to develop steels of Improved fracture properties which could be used to solve the problem. The designer had no basis for analysis of the rela- tionship between flaw size and stress for fracture Initiation. The early welding engineers had been concerned primarily with procedural aspects of welding and not with weldability factors of the steels. In effect, everyone relied on past experience with riveted and bolted structures, which Indicated that the elongation and reductlon-of-area ductility parameters of the tensile test generally ensured ductile performance of the structure. The experience with World War II welded ships clearly demonstrated that tensile test ductility was not a sufficient parameter for the characterization of the structural reliability of steels.
Figure 2 illustrates the brittle fracture of a {ship plate which featured high tensile test ductility. Such glasslike fractures were experienced only at temperatures below 60°F (15°C). The sharpness of the temperature effect led to the designation of the prob- lem as a transition temperature4' phenomenon.
''■1-,7-,iT^Ü1l^aMfBitth^
'I'lV::' i:
Fig. 2 - Features of ship plate fracture. The chevron markinge point back to the aite of the flaw responsible for fracture initiation.
Figure 3 illustrates the effect of temperature on the tensile and fracture toughness properties of a typical ship steel. The smooth-body tensile specimen shows a ductile to brittle transition over a range of very low temperatures, hi the presence of cracks the transition from plastic to elastic levels of fracture strength is developed over a range of much higher temperatures. By the early 1940'8 it waa recognized that the cracked-body, transition temperature range was the critical index for the loss of fracture strength of ship structures. S was then deemed essential to evolve notch tests for determination of this design parameter in the laboratory. Such testd would serve two purposes: (a) as a guide to the designer so that it would be known in advance if a contemplated structure was to be operated at temperatures below the cracked-body transition temperature range, and (b) as a guide to the metallurgist in evolving steels of customized transition temperature range features.
Examinations of ship failures provided the first significant information as to condi- tions for the initiation, propagation, and arrest of fractures. It was noted that the chevron markings (Fig. 2) pointed back to the exact location of fracture initiation. The initiation sites usually involved minute defects such as weld cracks or arc strikes (Fig. 4). Sur- prisingly, large cracks (several inches in length) existing in the same plate were not responsible for the fractures. This confusing aspect was clarified later when it became evident that the large cracks represented incipient fractures which had been arrested and thereby featured a "blunted" crack tip. These large cracks extended from corners or other welded details where the combined weld residual and load stress level was high. *The full course of the transition from ductile to brittle fracture occurs over a range of temperatures. The term "transition temperature" generally relates to the full tempera- ture range of this transition. If the reference is to a specific temperature point in this range, it is so defined: for example, Nil Ductility Transition temperature, Charpy-V 15 ft-lb transition temperature, etc. Because of the confusion which arises from the use of the term "transition temperature," this report will depart from convention and adopt the practice of citing "transition temperature range" when this is the appropriate connotation.

>M
NRL REPORT 6957
150
SlOO
b
90 -
TRUE STRESS AT FRACTURE
STRUCTURAL MILD STEEL STRENGTH AND DUCTILITY
TRANSITIONS
FULL DUCTILITY
G l;C'y
CRACKED BODY FRACTURE TRANSITION
BRITTLE FRACTURE PROMOATION LIMIT
-400 -390 -300 -290
L
-200 i_
150 _L_
-100 -90 90 100 190 200 (*F) I I
-290 -200 -190 -100 -90 TEMPERATURE
90 100 CO
Fig. 3 - Comparison of transition temperature ranges defined by tensile and dynamic fracture tests for a typical structural mild steel. The highest possible transition temperature range is established by increases in dynamic fracture toughness which preclude the development of unstable fracture. All transitions related to flaw size and loading rate aspects must be below this limiting transition temperature range.
The arrests occurred when the crack entered regions of low nominal stress outside the geometric detail. Many such cracks could be found on ships under fabrication in the shipyards, indicating that their initiation had been spontaneous and strictly related to weld residual stresses. The combination of crack-tip blunting and low stresses pre- vented the re-initiation of fractures.
It was then appreciated that the specific level of the elastic stress field through which the moving crack was propagating had a bearing on the fracture problem. In unusual cases it was noted that arrests were obtained in service when the crack entered a new plate in regions which did not feature stress gradients. Figure 5 Illustrates such an arrest. The important feature to note is that the painted surface has crazed at the arrest point, indicating ductile behavior (yielding) of the metal. In this case the arrest is clearly due to a plate of higher fracture toughness than the adjoining propagation plate. We now recognize two conditions which lead to arrests of propagating cracks:, (a) Crack entry into a region of very low stress, and (b) crack entry into a plate of higher fracture toughness. The initiation should be expected to occur at sites of high stresses in plates of low fracture toughness at the service temperature.
The separation of ship plates into the categories of initiation, propagation, and arrest types provided for calibration of the significance of the only standardized notch tests of the time. Figu 6 illustrates the features of the Charpy-Keyhole (Ck) and the Charpy-V (C v) tests. . Bo : tests were evolved about 1905 and had been used for qualita- tive assessments of the tr msltlon temperature range of steels. There was no rational basis for using these tests in predicting structural performance. Additionally, it was not known if measurements of fracture energy or some other criterion should be pre- ferred for the calibration of these tests.
■ "«ilHMHHUHH 'turn

W.S. PELLINI
Fig. 4 - Features of arc strikes. Small cracks extend from a solidified arc-pool of approximately 0.2-in. width. Residual stress fields of close to yield level act across these cracks.

mmmm - • .■-.;•■- 'tm - ••*«wiww»»i»B^^W»
NRL REPORT 6957
Fig. 5 - Crack arreat in ship structure which developed a« the fracture entered a plate of higher-than-average fracture toughneea. The intense craze pattern of the painted surface indicates plastic deformation of the underlying metal.
CHARPY V-NOTCH 0.2511*1 «UNO'IR.
CHARPY KEYHOLE NOTCH J _L
55 MM 12.165")
I0MM 10394'') "7 5MM
(0197)
_J L. 2MM nQn (007^
Fig. 6 - Dimensions of Charpy-V and Charpy-Keyhole tests

8 W.S. FELLINI
Figure 7 Illustrates typical Ck and Cv transition curves for ship steels. It should be noted that the energy transition curves parallel the course of the fracture appearance and the notch-root contraction (ductility) transition curves. The energy curve provides for the most direct definition of the transition features, and no advantage is gained by reference to the other measurements. However, these independent measurements clearly Indicated that the basic source of increasing fracture energy with increasing temperature derives from increasing metal ductility. The early emphasis to this aspect given by Stout and associates, represented the first major step in the rationalization of fracture events. Ductility considerations have dominated scientific studies thereafter.
By 1945 the Ck test was recognized to be totally inadequate for definition of the true transition temperature range experienced in service. Because of its excessively blunt notch, it indicated a transition from ductile to brittle fracture at temperatures which were much lower than experienced by the ships. While the Ck tests were discarded for further studies of ship failure steels by 1945, it surprisingly remains a widely used industry test today In specifications of structural mild steels. The Cv test offered better promise for calibration since its transition region includes the temperatures of ship fractures. Atten- tion was then directed to studies of the ship failure steels solely by the use of the Cv test.
By the late 1940*8 correlations were evolved which disclosed that the fracture initia- tion, propagation, and arrest plates featured distinctly different maximum values of Cv energy at the temperature which corresponded to the service fracture. The results were as follows:
Initiation plates - maximum 10 ft-lb Propagation plates - maximum 20 ft-lb Arrest plates - energy values significantly in excess of 20 ft-lb resulted in
'yielding* arrests (see Fig. 5).
These statistics are summarized in Fig. 8 with reference to the position in the Cv energy transition curve. Service temperatures below the 10 ft-lb transition temperature index would provide for fracture initiation due to the presence of small cracks. Service tem- peratures below the 20 ft-lb transition temperature index would provide for propagation, except in areas of abnormally low stress. Service temperatures in excess of the 20 ft-lb transition temperature index would assure arrests, due to metal ductility, as the fracture extended into a plate of such characteristics. As the result of these studies, it became conventional to reference the transition temperature range quality of the steels in terms of the 15 ft-lb transition temperature index which represented a conservative definition of the highest temperature for fracture initiation.
It should be noted that the best of the ship plate steels featured a 15 ft-lb transition temperature at approximately 0eF (-18eC) and the worst at 140° F (60° C).* The quality distribution was gaussian, as shown in Fig. 9, wit.i a sharp peak at 65° F (18°C) and a high population density in the range of 35 to 90oF (2 to 320C). The broadband distribu- tion of the World War n ship plates results from the inclusion of poorly controlled metallurgical product. With good mill control the full range of variance can be kept within a 60° F (35° C) band.
By 1952 the 15 ft-lb Cy transition temperature was accepted as the definitive cri- terion for purposes of design and as guidance for metallurgical studies. The effects of alloy elements, grain size, normalizing heat treatments, deoxidation practices, etc. were Investigated in terms of the effect on shifting the 15 ft-lb transition temperature. Figure 10 illustrates the shifts to lower temperatures, compared to the ship fracture steels, that can be obtained by combining the benefits of decreased C-Mn ratio, aluminum deoxidation, and the use of normalizing heat treatments. Unfortunately, there was a
♦Temperature conversions will be approximated to the degree of accuracy implied general, to nearest 5°F significance.

;
mfmtAKmMBVBtwni
NRL REPORT 6957
-20 0 20 TEMPERATURE
K» 120 140 KO'F
60 0C
Fig. 7 - Transition temperature range features- of Cv and C^ tests as indexed by fracture energy, fracture appearance, and notch-root lateral contraction. Reference to the C^ transition curves are restricted to the scatterband region because the slopes of the toe and shelf regions are essentially flat. The gradual slopes of the Cv transition curves provide a wider range of temperature indexing possibilities.

»
10 W.S. PELLINI
60
,-. 50 OD -1
1 K II 40 >- O cc ili 30 z w
20
|0 -MIHUIHI
() 20 FT-LB
.© IG FT-LB
TEMPERATURE-
Fig. 8 - Summary of Cv energy va'uea of ship fracture initiation, propagation, and arrest plates at the failure temperatures. These correlations Indicate that the highest temperatures for fracture initiation and propagation in service are index- able, respectively, to the 10 and 20 ft-lb transition temperature points of the Cv curve. Fracture arrest characteristics are attained at temperatures above the 20 ft-lb index point.
1
NRL REPORT 6957 11
N.B.S. I5FT-LB FREQUENCY DISTRIBUTION REPRESENTING SHIP PLATE QUALITY RANGE nOfPUTESIimS'FIIITEIIVALS)
F
-80 -60 0 20 40
TEMPERATURE 100 120 X
Fig. 9 - Spread of Cv transition temperature range characteristico of ship fracture steels. The 15 ft-lb transition temperature provides a significant reference point for defining the quality of specific steels.
UMtt».'«

12 W.S. PELLINI
-20 0 20 40
TEMPERATURE 120 0C
Fig. 10 - Tranaition temperature range features of improved steels coirpared to ship fracture steels. The shaded bands refer to the data for ship fracture steels presented in Fig. 9.
basic error In the assumption that the 10 to 20 ft-lb Cv energy range had the same sig- nificance for these modified steels. By 1953 NRL research investigators demonstrated that the critical transition temperature references moved to higher positions on the Cv energy curve (higher Cv energy indices) for many steels which differed from the original ship fracture type. This finding was catastrophic to the concept of an invariant reference to the Cv energy transition curve. Clearly the Cv test requires specific calibrations for diiferent steels and, as such, poses unacceptable complications for general engineering use across broad families of steels.
EVOLUTION OF NATURAL CRACK TESTS
A wide variety of new fracture tests were evolved during the 1940's. These tests can be separated Into two basic types: (a) tests which utilized small laboratory specimens featuring machined notches and tensile loading, and (b) si ructural prototype tests of very large dimensions featuring machined notches and/or the presence of welds. The interest In large structural prototype tests resulted from the Inability to reproduce ship failure conditions at service temperatures by any of the small test specimens. Irrespective of the acuity of the machined notches and the notch depth, stresses over yielding were always required for initiation of the fractures by the laboratory tests. In contrast, the Initiation of failures in service was always obtained at elastic stress levels. Increasing the size of the test plates did not modify this behavior. Again the service failure condi- tions could not be reproduced.
Obviously a fresh approach was required-slow loading of specimens featuring ma- chined notches did not correspond to the service conditions of fracture initiation. In view

tmw®tFwi:**immim!*ti.>>niiKt
NRL REPORT 6957 18
of the impasse which existed in 1950, the NRL investigations were redirected to fracture studies involving natural cracks. The basic premise which guided this new approach was the recognition of the role of cleavage microfracture processes, which are Inherent to metallurgical considerations of the problem. This information had been evolved by basic research investigators, primarily at universities and most notably by Censamer, Low, Cohen, and Stout. Such considerations had matured to suggesting that the cleavage fracture instability is first developed in embrittled metal adjacent to the weld, i.e., In the heat affected zone (HAZ). Once the cleavage instability is developed within relatively few grains in the embrittled HAZ region, the base metal grains in line are then subjected to the dynamic extension of an ultrasharp natural crack. As a consequence, the mechanical behavior of the structure as a whole is equivalent to that which should be expected for dynamic loading.
The mechanism of cleavage fracture will be discussed further in sections to follow. At this point it is noted that the energy required for the propagation of unstable (fast) fracture is derived from elastic strain. The individual grains may be considered as loaded by elastic springs. As each grain cleaves, the release of elastic energy serves to increase the loading rate on the next grain in a dynamic fashion, to the point of cleav- age fracture. The process is continued indefinitely.
The cleavage of the first few grains is a crucial event for cleavage fracture-the mechanics of the cleavage process are dynamic thereafter. Thus, any form of metallur- gical embrittlement, including strain aging of the crack-tip metal, the presence of a brittle phase, etc. can serve to activate dynamic-mode instability. The HAZ embrittle- ment condition described above represents only one case in point. In the absence of such localized initiation conditions, the base metal responds to slow loading rates by behaving in a more ductile fashion. K is then more difficult to initiate the cleavage fracture of the first grains. The engineering aspects of this problem are best considered in the light of the fact that the micromechanical conditions which control the cleavage of the first grains control the ductility and the effective strength of the structure as a whole.
There were two problems with the long-sought goal of attempting to initiate fracture at elastic levels in the presence of a machined notch loaded at slow rates: (a); the metal grains at the notch root are not subjected to the same high degree of triaxial constraint to plastic flow provided by the ultrasharp natural cracks, and (b) the slow loading rate favored the development of extensive yielding prior to initiating cleavage in the first grains.
The highest temperature range for the initiation of cleavage fr icture at elastic stress levels must be determined by laboratory tests involving cracks of ultimate sharpness and the application of dynamic loading. The test specimen size can be reduced to very small dimensions if these conditions are met. These conditions are essential to ensure that the cleavage of the first grains is developed under the most adverse (wortt case) conditions for suppression of microfracture ductility. The highest temperatures at which a steel structure can be expected to fall is controlled by such worst case conditions. By enforcing the worst case in laboratory tests, an exact match can be found to the highest temperature'» of possible service failure at purely elastic load stresses.
The nature of the first experiments conducted with natural crack tests is Illustrated in Fig. 11. Arc strikes were applied to ship plate steels and dynamic loading was de- veloped by dropping weights in the center of the edge-supported plates. It was found that fracture initiation for conditions of elastic loading resulted at the ship failure tempera- tures of 30 to 60eF (0 to 150C) but not at higher temperatures, i.e., exactly as observed for ship failures. The fractured plates remained perfectly flat, indicating that the loading had not exceeded yield stress levels. Explosion tests of the same plates without the arc strikes demonstrated great ductility at low temperatures, as predicted by the tensile tests. The dramatic effects of such tiny defects can only be rationalized by cleavage fracture instability processes of microscale dimensions. The volume of metal involved in the Initiation of brittle fracture must always be smaller than the defect size.

14 W.S. PELLINI
Fig. 11 - Fracture of ship plate steel at elastic stress levels by dynamic loading in the presence of small cracks due to arc strikes
These findings led to the development of the Explosion Crack Starter Test which featured a short, brittle weld bead (hard surfacing type) deposited on the plate surface. The plates (14 in. * 14 in.) were placed over a circular die and loaded by offset explosion. The intent was to observe the effects of increasing temperature on the propagation of the fractures. The function of the brittle weld bead was to introduce a small crack of natural sharpness, similar to the weld defect cracks or arc strikes of the service failures. The function of the offset explosion loading was to ensure dynamic conditions for the initiation phase and to maintain soft-spring (continued) loading on the plate while the fracture was propagated from the center to the edges. Temperature control was obtained by condition- ing the test plate and then quickly placing it on the die for explosion loading.
The results of typical ship plate test series conducted over a range of temperatures are illustrated In Fig. 12. The test series present a clear panorama of the effects of temperature on the initiation and propagation features of the steel in the service temper- ature range of the ships. At 20oF (-8eC) a flat break is obtained (elastic fracture), while at 40°F (50C) and higher temperatures, increasing bulging (plastic overload) indicates increased resistance to the initiation of fracture. The term Nil Ductility Transition (NDT) temperature was applied to the flat break temperature. In other words, with descending temperature a critical transition point is reached such that elastic fracture initiation (nil ductility) is possible in the presence of a dynamically loaded small flaw.

<
NRL REPORT 6957 15
160° F
Fig. 12 - Features of Explosion Crack Starter Tests of ship plate steels. The steel illustrated features a 15£t-lbCv transition of approximately 30°F (0oC) and is representative of best quality (see Fig. 9). Ship plates of relatively poor quality develop similar transition features at higher temperatures.
It should be noted that the resistance to propagation of the fractures increases markedly with increasing temperature. Between 60 and 80°F (15 and 250C) the fractures no longer run through the elastically loaded edge regions; however, continued propagation is obtained through the plastically loaded center regions. This temperature point was defined as the Fracture Transition Elastic (FTE) and signifies the highest possible tem- perature for unstable fracture propagation through elastic stress fields. Ultimately, a higher temperature is reached at which only ductile tearing is possible. Because of the high resistance to propagation of ductile fracture, the explosion loading resulted in a helmet-type bulge at 120oF (50oC) and higher temperatures. The 160oF (TO'C) bulge resulted from the use of a much larger explosive charge than was applied for the re- mainder of the test series and serves to illustrate the high degree of ductility. The temperature point of fully ductile tearing is defined as the Fracture Transition Plastic (FTP).
The fracture panorama presented by many test series öf this type clearly illustrated why ship fractures only occurred at winter temperatures. The significance of initiation, propagation, and arrest features also becomes clear. The controlling temperature for

16 W.S. PELLINI
I20J60_200 240
•40-20 0 20 40 60 80 100 120 TEMPERATURE
Fig. 13 - Typical correlation of Explosion Crack Starter Teet performance with Cv transition curves for ship fracture steels. Flat break (NDT) fractures are obtained at temperatures below the 10-ft-lb transition temperature. Arrest character- istics are developed in the range indicated by the solid band which spans the 10 to 20 ft-lb transition temperature range. Full ductility is attained on approach to shelf temperatures.
fracture initiation due to small flaws Is obviously the NDT temperature. Fractures due to small flaws could not be expected to Initiate in ship structures above the NDT temper- ature because gross plastic overloads are required.
Figure 13 illustrates a typical correlation of the fracture performance in the explo- sion test with the Cv energy transition curve for ship fracture steels. NDT fracture initiation features are obtained as the explosion test temperature falls below the 10 ft-lb Cv transition temperature. The band superimposed on the Cv curve indicates that the FTE arrest transition is developed close to the 20 ft-lb transition temperature index. The temperature at which the C« curve attains shelf values corresponds to the FTP or full ductility temperature. Thus, the initiation, propagation, and arrest relationships of ship fractures to the Cv curve (Fig. 8) were clearly reproduced by the explosion test series.
The success of the explosion test in providing a direct correspondence to the service performance of the ship steels suggested its utilization on a broad front in studies of the fracture Initiation, propagation, and arrest features. This was required in particular for the wide variety of steels for which there was no detailed documentation of service failure history. These studies were also directed to investigating whether the Cv curve predic- tions of the Initiation and arrest transition temperatures would hold for improved ship plate steels. Unfortunately, these and other types of steels indicated correlations which

NRL REPORT 6957 17
INTERMEDIATE STRENGTH LOW-ALLOY BAINITIC
STEELS
HIGH STRENGTH O-T STEELS
LOW STRENGTH C-MN STEELS
IIP FRACTURE STEELS
TEMPERATURE-» TEMPERATURE- TEMPERATURE•
Fig. J4 - Complications in the interpretation of Cv test transition temperature range curvesfor different steels. The relative positions of the initiation to arrest correla- tion bands (NDT to FTE) are shifted widely in comparison to the toe region position of the Cv curve which was typical of the ship fracture steels. The correlations for improved ship steels (C-Mn steels) are displaced to higher relative position of the C curve. More complex relationships are indicated for steels of over 50 ksi (35 kg/mm2) yield strength.
were indexed to much higher Cv fracture energies and, therefore, higher relative posi- tions on the Cv curve (Fig. 14). These observations were of crucial importance because they negated the then generally accepted conclusion that the 10 and 20 ft-lb Cv transition temperature indices would provide for Invariant assessment of the service fracture characteristics of steels. At the time there was additional distress over the fact that the Cv test had provided an overoptimistlc indication of the decrease in the transition temperature range for the improved ship steels.
The failure of the Cv test to provide an invariant method for characterization of the true transition temperature range features of steels emphasized the need for evolving a simple type of natural crack test for routine laboratory use. This led by 1953 to the invention and validation of the Drop Weight Test (DWT). The DWT was designed specifi- cally for the determination of the NDT temperature because of the critical importance of this index to fracture-safe design. Figure 15 illustrates the DWT equipment.
Figure 16 illustrates the general features of the DWT specimen and the effect of temperature on its fracture characteristics. The specimen features the brittle weld of the explosion test. A saw cut across the weld localizes the fracture of the weld bead to a single crack at the exact center of the specimen. The weld crack provides the equivalent of a small thumbnail-size flaw with an ultrasharp tip. The brittle weld bead is fractured as near-yield-stress levels are attained as a consequence of dynamic loading of the specimen provided by a dropping weight. In practice the DWT is conducted by loading the specimen as a simple edge-supported beam with a stop placed under the center position. The stop restricts the deformation to a very small amount; thus, the deformation is kept constant for steels of different yield strengths.
Figure 16 (top) presents a typical test series which defines the NDT temperature as the highest temperature of nil ductility break. The flat break signifies that fracture

18 W.S. PELLINI
Fig. 15 - Drop Weight Tett (DWT) equipment

inmm*mm win iimmwmm r'i—i-rriiiwiimiii i »i mnw—n m
NRL REPORT 6957 19
Fig. 16 - Typical DWT aeries (top) which define an NDT temperature of 10° F (-120C). The sharp increase in dynamic fracture toughness of the metal above the NDT temperature is illustrated (bottom) by the tolerance for plastic deformation for tests conducted in the absence oi a stop.
initiation due to the small flaw occurred prior to the development of significant plastic deformation. Figure 16 (bottom) illustrates tests conducted without the stop. At NDT+20oF (NDT+10oC) and NDT+30oF (NDT+170C) the specimen can be deformed plastically without causing fracture. This performance clearly indicates that a sharp increase in dynamic fracture toughness is developed above the NDT temperature. Extensive use of the DWT has shown that the NDT reproducibility is within ±10oF (±30C). This degree of reproducibility should not be surprising in view of the pronounced effect of temperature at this critical point of the transition range. It should be noted that the NDT temperature is not affected by orientation of the test specimen with respect to the rolling direction. This is due to the fact that brittle fractures are not influenced by the alignment of nonmetallic phases.
An early illustration of the capabilities of the DWT-NDT procedure for indexing service failure conditions is provided by Fig. 17. A statistical survey of the NDT tem- perature frequency distribution was made by random selection of World War II ship
>,.■■.

20 W.S. PELLINI
SHIP PLATE NDT DISTRIBUTION
(42 STEELS)
20 40 60
2500
2000
1500
1000
500
SERVICE EXPERIENCE SHIP MONTHS OF
SERVICE PER FRACTURE
x
NO FRACTURES
Ufa* L
TbO 100 0F
|
^ 5000 SHIPS 1000 DEVELOPED FRACTURES
1942-1946 200 SERIOUS FRACTURES
1942- 1952
J. 20 40 60 80 100
i J. -20 -10 0 10 20"
TEMPERATURE 30 40^
Fig. 17 - Service temperature statistics of «hipfracture frequency related to the NDT temperature frequency distribution of ship steels. Ship fracture rates in- crease rapidly as the fraction of the steel population which features below-NDT properties is increased with a decrease in the service temperature.
plate steels. The NDT temperatures range from 0eF (-180C) for the best steels to 70oF (20°C) for the worst steels, with a gausslan distribution pattern at intermediate temper- atures. S is evident from this figure that the drbaiatic Increase in the rate of ship failures with falling temperatures in the range of 70 to 30° F (20 to 0eC) is directly related to the NDT temperature distribution of the steels. At temperatures over 70° F (20oC) essentially all of the steels are indicated to be above their NDT temperatures and no ship failures were developed. At approximately 30° F (0oC) essentially half of the population is at or below the NDT temperature and the failure rate becomes very high.
It Is apparent that a metallurgical improvement which would shift the NDT temper- ature frequency curve to lower temperatures by 40° F (25° C) would have prevented most of the ship failures. This is deduced from the fact that the NDT temperature of the worst steels would then be at the low ei.c of the service temperature range. In retrospect, it is tragic to consider that the large losses of lives and supplies that resulted from the ship failures could have been prevented by a small adjustment in the carbon and manganese contents of the steels. This adjustment provides the required shift in the NDT tempera- ture distribution, as may be deduced from Fig. 37.

mm wrtwnrwm iiw mumimmmmmmmm
NRL REPORT 6957 21
LOAD f
@
imtmtHHmm
WEDGE IMPACT
6"- 3FT
REACTION MASS
BALANCING CUT
WELD
LIQUID NITROGEN APPLIED
LOAD
WELD wmuMtKUttHMummh
f
®
IMPACT
SAW CUT VmmttmMMHMItHHHtH
CRACK
WELD 6"-
($)
2FT
Fig. 18 - Features of Robertson Tests. In one type (left), the fracture is initiated by plastic deformation of the saw cut region by wedge impact. The original Robert- son version (right) utilizes the force developed by spreading open a nub region which is deformed by impact while cooled to low temperatures. In both cases the crack is made to traverse a region of fixed temperature and elastic stress.
CRACK ARREST TESTS
The evolution of the Robertson Crack Arrest Test in the late 1940's marked another departure from conventional approaches in fracture studies. The importance of the Robertson test cannot be overestimated because It provided exact definitions of the relationships of stress level to crack arrest features. Since Its invention the test ha« taken various specific forms. Hoover, the basic feature of all forms involves a "forced" initiation of the fracture, which is then caused to propagate (or not) through a flat plate loaded to exactly defined levels of elastic stress. Figure 18 illustrates two types of Robertson tests. The tests are conducted over a range of temperature with either fixed or varied levels of stress.
Figure 19 illustrates typical data obtained by the Esso Laboratories with the design shown on the left side of Fig. 18. The first important feature to note Is the nearly flat portion of the Robertson curve at low temperatures of the transition range. There is little effect of temperature in this region because the metal features very low levels of dynamic fracture toughness. Fracture arrests are obtained for this highly brittle con- dition only if the stress level is reduced significantly below the 5 to 8 ksi (3.5 to 5.5 kg/mm2) range. Obviously, this is too low a stress level to be utilized for fracture prevention in practical structures.

22 W.S. PELLINI
40r
C 30
ui Q:
w 10
CRACK ARREST CURVE
CAT FOR 18 KSI
5 KSI (3.5 KG/Mivn J I I L
-60 -40 -20 I
20 40 60 I I
80
-40 -30 -20 -10 0 10 TEMPERATURE
20 30 40
100 120 0F l oc
Fig. 19 - A typical Crack Arrest Temperature (CAT) transition curve as defined by Robertson teats. The x signifiespropagationwithtotalfractureof the specimen and the circle signifies fracture arrest.
The portion of the curve which rises markedly with increasing temperature is defined as the Robertson Crack Arrest Temperature (CAT) transition. Because of the strong temperature dependence of the stress level required for propagation, the CAT transition region provides a reliable method for fracture-safe design based on arrest properties. For example, the steel of Fig. 19 features a CAT for the 18 ksi (12.5 kg/mm3) stress level .<t 60oF (15°C). Structures which are designed for this level of stress would feature positive assurance of fracture safety (due to arrest properties) at service tem- peratures above 60oF (150C) if fabricated with this steel.
The Esso tests were conducted at the above stress level because it represented the usual design stress of gasoline storage tanks. For engineering reasons it was desired to use steels of fracture arrest properties. A large number of commercial steels were investigated in order to select those types with CAT features appropriate for service in arctic, temperate, and tropical climates. Thus, the CAT of the steels were matched to the service temperature conditions. Purchase specifications were actually based on Cv energy index values which had been correlated to the CAT. This procedure was evolved because Robertson tests are too expensive for use as routine specification tests. The NRL findings of variable correlation of the Cv test to the arrest properties for dif- ferent types of steels were confirmed by these studies. Accordingly, the Cv energy value indices used in the specifications were adjusted for the different types of steels.

NRL REPORT 6957 23
50
40
^ 30 i i20
10
NO FRACTURE
i IFT
tit t t t t t
I TEST PLATE S- 5 FT * {■ DM ■
"TTTTT
-40 •20 20 40 I
-40 -30 -20 -10 0 TEMPERATURE
10 ^
Fig. 20 - Wide plate Robertior^type test featuring fracture initiation in a brittis plate which is welded to the test plate. The CAT for 0.5 Oy, is indicated to be at 150F (-10oC). The NDT temperature determined by the DWT indexes the tem- perature at which the Robertson CAT curve begins to rise from the toe region. The FTE temperature was determined by explosion tests. The FTE represents the CAT for near-yield levels of stress, i.e., the upper limit of the CAT curve.
These combined procedures are of interest because they represent an excellent example of a practical engineering solution to fracture-safe design problems which is optimized by consideration of both technological and economic factors.
Figure 20 illustrates another type of Robertson test featuring fracture initiation in a brittle element of the test assembly. The test data obtained by Mosborg and associates at the University of Illinois are for a 25 ksi (18 kg/mm2) level of stress (0.5ay.).and relate to a high-quality modern ship plate. The 0.5 ayi CAT is noted to be 15° F (-10eC). This figure also introduces the important observation that the NDT temperature marks the point of initial rise of the CAT transition curve from its toe region.
The results of extensive studies of the interrelationships between the DWT-NDT and Robertson CAT tests are illustrated in Fig. 21 for a wide variety of steels. It is noted that the CAT transition curve bears a fixed relationship to the NDT temperature. This relationship may be expressed simply by a temperature increment (At) reference to the NDT temperature. Thus, the simple and inexpensive DWT can be used reliably to locate the temperature scale position of the CAT transition curve. For example, NDT+30oF (NDT+170C) provides a conservative index of the CAT for the 0.5ayi stress level and
mttmm

r mmmmtmi
24 W^. PELJ.INI
(0 UJ K
Y.8.
SMALL-FLAW INITIATION
CURVE
^Y.S.—
X X ■A EXPLOSION
FIE DATA TEST
A / / □
o I
^ 2 i I /'*-7^
/ CAT CURVE, 'LOCATION J
/ RELATIVE TO NOT
ROBERTSON-TYPE TESTS CAT DATA
NOT
I
+ 30
L
+ 60oF
1 NOT +10 +20 +30 +40 •C
TEMPERATURE RELATIVE TO NOT (At)
Fit*. 21 - Summary of testifor a wide variety of ateelt which indicate that the temperature range location of the CAT curve may be established by tempera- ture increment (At) reference to the NDT temperature. The points represent CAT or FTE determinations for different steels.
NDT+60SF (NDT+330C) provides a similar index of the CAT for the yield stress level, I.e., the FTE. Unstable fracture propagation through elastic stress regions, with characteristic velocities of several thousand feet per second, is not possible at temper- atures above the FTE. The propagation rate at over-yield-stress levels is controlled by the rate of application of the plastic load in advance of the crack front.
These findings were of major consequence because they disclosed the specific relationships between Initiation and arrest aspects of unstable fracture. These relation- ships are evident from the temperature dependence of two curves plotted in Fig. 21. The upper curve plots the rise in the level of stress required for dynamic fracture initiation due to a small flaw. It is important to note that the rise of this curve repre- sents a transition from elastic to plastic levels of fracture initiation stress. The NDT Indexes the temperature of the initial rise of this curve to above-yield-stress levels. The sharp rise of the CAT curve also starts at the NDT temperature. Both curves evolve a simultaneous rise above the NDT temperature because the dynamic fracture toughness of the metal develops a strong temperature dependence starting at this reference temperature. Both curves are controlled by the same basic microfracture factor, i.e., the increase in dynamic cleavage fracture ductility of the metal grains.
Since the CAT curve defines the course of the stress-temperature relationship for arrest, it follows that it should also define the limiting stress-temperature relationship for the initiation of unstable fracture. Fracture initiation could be expected only for

■ . ■
NRL REPORT 6957 25
conditions which provide for propagation, i.e., In the region which lies to the left of the CAT curve. Thus, the effects of increasing flaw size should be restricted to lowering the stress level for fracture Initiation from plastic levels to the limit elastic stress level defined by the CAT curve. This effect may be viewed as a shift of the fracture initiation curve with increasing flaw size from the small size flaw curve position to the CAT curve position as a limit. From these considerations it became apparent that the corridor be- tween small flaw and CAT curves should encompass a family of curves of similar form, but related to a spectrum of flaw sizes.
FRACTURE ANALYSIS DIAGRAM (FAD)
The coupling of flaw size considerations with transition temperature concepts evolved at the time that the engineering significance of fracture mechanics definitions of stress intensity factors began to be appreciated. For a brittle metal the stress required for initiation should decrease in proportion to the increase in the square root of the flaw size. Thus, very large increases in flaw sizes should be required for frac- ture initiation, with decrease of stress from yield magnitude to levels of low nominal load stresses. The spectrum of flaw sizes that should lie between the small flaw and CAT limit curves was qualitatively predictable on this basis. Unfortunately, there were no experimental data of fracture mechanics parameters required for calculating these flaw sizes at the NDT temperature, or for establishing the temperature dependence of the stress level above the NDT temperature.
The desirable integration of these concepts directed the attention of NRL investiga- 5 tors to failure analysis as a means for defining the spectrum of flaw size curves. Ex-
tensive studies of service failures were conducted and carefully catalogued with respect to the fracture initiation flaw size, the NDT temperature, the service failure temperature, and the stress level which had applied to the flaw region of the structure. In addition, data became available for the effect of increasing flaw sizes (below NDT) for ship plate steels as the result of large-scale tests conducted by Battelle Memorial Institute in- vestigators. These various data provided the information required for assigning flaw size values for the curves of the diagram shown in Fig. 22, which was evolved about 1060 and was defined as the Fracture Analysis Diagram (FAD).
The FAD provides a generalized definition of the flaw size, relative stress, tem- perature relationships by a 'At* or temperature increment' reference to the NDT temperature. The location of the generalized diagram to specific positions in the tem- perature scale requires the experimental determination of a single parameter-the NDT temperature. Thus, by the simple procedure of conducting a DWT the other factors are made evident by reference to the FAD.
Extensive International use of FAD during the past decade has provided positive documentation of its engineering practicality. All known cases of structural failures by unstable fracture have been analyzed to conform to the limits predicted by the FAD. Ja addition, continuing research of the transition temperature fracture problem Y *s evolved added scientific rationale for its validity. The DWT, which is basic to the use of the FAD, attained the status of an ASTM standard practice method in 1963.
We shall now discuss various details with respect to the use of the FAD which should be understood if its capabilities are to be fully utilized in fracture-safe design. The most important of these is the requirement for careful consideration of the stress level that must be used in entering the FAD. It is emphasized that quantitative definitions of stress relationships apply only to the limit of yielding. The FAD extrapolations into the plastic region are not indexed specifically. These extrapolations only serve the purpose of Indicating that the level of plastic stress should increase with increased temperature. The plastic stress levels are not indexed because there are no procedures for calculations, or failure experience which would indicate the specific relationships. The discussions

26 W.S. PELLINI
£ g In?
^ 5e 12 12 ÜfS «i* -l«i -h "fe
SS3WXS

am 1
NRL REPORT 6957 27
NOT
I TEMPERATURE LIMIT FOR
/INITIATION
COMPLETE FRACTURES
CO CO
o i- ® PARTIAL ®
FRACTURES A
It'- 5-
J. X J. NDT +20 +40 +60^
I ! _l I I NDT +10 +20 +30 +40*0
TEMPERATURE RELATIVE TO NDT
Fig. 23 - Transition temperature features of "low load stress fractures" resulting from weld residual stresses and small cracks. The transition behavior is indicated by the course of the X's which signify fracture initiation. Above the NDT the load stress must always exceed yield for the case of small flaws. Below the NDT, fracture may develop at very low levels of load stress. The transition is extremely sharp and is de- veloped in a range of 10 0F (50C).
to follow will emphasize the Haw size-stress relationships for elastic loading, since structures are not generally designed for plastic loading. The prime engineering interest is the elastic stress region of the FAD.
The stress scale is referenced to the conventional load divided by area (P/A) en- gineering stress. If the flaw is of small size and resides totally in a region of geometric detail (sharp corner, nozzle Junction of a pressure vessel, etc.) the applicable P/A stress is the geometrically intensified local stress field of the region involved. For example, a pressure vessel, nozzle transition region featuring a stress intensification of 3 to 4X should be considered as loaded to yield stress levels for a nominal hoop stress condition of 0.3 or;. Since the best of nozzle designs feature a minimum 3X intensification, flaws which reside totally in nozzle transition regions should normally be considered as sub- jected to yield stress levels. Such rudimentary stress analyses suffice because conven- tional structures normally feature two general levels of stress-the nominal design stress for regions of smooth section, and yield stress levels for most regions of geo- metric transition.
A special consideration must be applied for as-welded (not stress relieved) structures due to the presence of yield level residual stresses in the region of the heat affected zone (HAZ). These localized stress fields act In the direction parallel to the weld, as Illustrated In Fig. 23. The residual stresses result from longitudinal shrinkage during cooling of

28 W.S. PELLINI
-10 0 10 TEMPERATURE
20 90 40 t
Fig. 24 - Typical experimental data from Buried Flaw Tests which define the critical temperature at which "low load stress^ fractures" may develop. The sharp transition to low load stress fracture is controlled by the small-flaw, fracture initiation transition curve. The temperature location of this curve is established by the NDT. Accordingly, the NDT tem- perature denotes the critical temperature for low load stress failures of welded structures.
the hot weld area which is restrained by the adjacent cold metal. The extent of the peak stress region is in the order of 1 to 2 weld widths and, as such, it can only contain small flaws which are oriented in the direction normal to the peak stress. This highly localized residual stress field should not be con/used with general weld contraction stresses, which may extend in any direction through the entire structure or in major elements of the structure. Such long-range stresses do not normally exceed 0.5 ay(.
The consequences of the highly localized residual stress field is that small flaws which reside in the weld or the HAZ are effectively subjected to yield stress levels even in the total absence of a structural load. As the result, welded (not stress relieved) structures may initiate fractures due to small cracks in weld regions, for a wide range of nominal load stresses, provided the service temperature is below the NDT. Fractures are therefore possible at very low levels of applied load. At temperatures above the NDT such 'low load stress fractures' due to small flaws cannot develop because of the re- quirement for severe plastic loading for initiation, as noted previously in Figs. 9 and 16.
Experimental verification of these predictions is presented in Fig. 24 by illustration of typical results obtained in Buried Flaw Tests conducted by Wells. These tests simulate

NHL REPORT 6957 29
the presence of a weld crack by the procedure of cutting sharp notches into the beveled edge of the plates prior to Joining these together by a butt weld. After the weld is com- pleted the notch tips are located in the region of the embrittled HAZ, as indicated by the schematic drawing at the top of the figure, and are subjected to high weld residual stresses. When such welded plates are loaded in tension a sharp transition in fracture stress is developed, as noted by the bold arrow. At temperatures slightly above the NDT the fracture load stress is consistently above yielding. At temperatures below the NDT the fracture load stress may fall to very low values. In the latter case, the load stress simply adds a small increment to the already existing residual stress which may be close to yield levels. Buried Flaw Tests have been conducted extensively for the purpose of determining the critical temperature below which "low stress fracture" is possible. It is apparent that this same information may be obtained by means of the simple DWT.
It should be noted that if fracture initiation is attained in the Buried Flaw Tests at load stresses which are below the level of the Robertson lower toe region, i.e., less than 8 ksi (5.5 kg/mm2), arrests are obtained following a run of only a few inches. The arrests result as the crack moves out of the weld residual stress field and enters the region of low load stress. This behavior is predicted by the Robertson tests. The reason for the existence of short cracks in the ship structures (as described previously) is thus explained.
It is emphasized that the application of effective stress relief eliminates the high peak values of the localized weld residual stresses. Warm mechanical prestressing (loading at temperatures above the NDT) is also effective in preventing low stress frac- tures, due to a crack tip blunting. Thus, low-stress fractures are prevented by those procedures, as documented by the Buried Flaw Tests. The benefits of warm prestressing do not apply for structures involving random loading. The warm prestress must be applied in the direction of the load stress system.
In using the FAD, small cracks located in the HAZ or in the welds of as-welded (not stress relieved) structures should be considered to be loaded to yield stress levels because this is the applicable P/A stress acting on the small flaws in such locations. An example of a structural failure which originated as the result of weld residual stresses is provided by Fig. 25 which represents a typical ship fracture. The fracture origin was at the toe of a fillet weld joining a chock bracket to the deck. An arc strike at this loca- tion provided the small sharp cracks which served as the initiation site. The fillet weld provided the residual stress field. The fracture initiation conditions for this case are indexed to the FAD in Fig. 26. Since the failure temperature was slightly below the NDT, all of the necessary conditions of a small crack loaded to yield stress leval at a temperature below the NDT were met.
The nominal load stress of the ship structure was of consequence only in that it exceeded 8 ksi (5.5 kg/mm2) and thereby ensured uninterrupted propagation. At the 35°F (20C) failure temperature, all plates in line would be expected to be below their respective CAT temperature (see Fig. 17). In fact, one half of the population would be below their NDT temperature at the failure temperature. Since the CAT temperature for low nominal stresses Is in the order of 20 to 30° F (12 to 180C) above the NDT temper- ature, it follows that the probability of intersecting a plate of close to arrest properties would be very low at a service temperature which is close to the midpoint of the NDT frequency distribution. Thus, the failure is in full conformance to all aspects of FAD predictions and of the NDT ship plate statistics as well.
Another example of a small-crack, high-residual-stress fracture initiation below the NDT temperature is provided by the failure of a massive shrink-fit ring for an extrusion press. Thermocouples had been brazed to the ring forging, and this resulted in the de- velopment of small, liquid-metal corrosion cracks which were contained in a small region
■- • . . ■ .' :\ . ..' ■ * . m*

■
30 W.S. PELLINI
Fig. 25 - Typical ship fracture which originated from an arc strike located in a region of high weld residual stress. The ship was the USS Ponaganset, which fractured completely at dockside in Boston Harbor at a temperature of 350F (20C).
CHOCK
WELD )r RESIDUAL
STRESS ^y
ammmmmb
50 70 90 TEMPERATURE
Fig. 26 - Analysis of fracture initiation conditions of the USS Ponaganset

;!5':. '" '?:•->"'•'•'"■'■'-',- -.li^' ''-:'■' ,■■'
NRL REPORT 6957 31
Fig. 27 - Fracture of massive ring forging (12 x 13 in, cross-section dimension) caused by tiny cracks subjected tohigh residual stress. The dark spot in the smooth region of the fracture (upper right corner) marks the position of a thermocouple braze which contained tiny cracks, '''-•■- a companion thermocouple near this point.
Note
of high residual stress, due to rapid cooling of the metal at this spot. Figure 27 illus- trates the fracture of the ring which occurred spontaneously during the cooling of the press from high extrusion service temperatures. At the failure temperature the ring was below the NDT temperature and the necessary conditions of a small crack loaded to near-yield-stress levels were met. It is important to note that the effective stress acting on the tiny crack in the braze region was the residual stress field of this small region and not the shrink-fit hoop stress (0.3 aya) which represents the load applied to the ring. Again, the load stress was of importance only in that it ensured continued propagation as the fracture extended outside the localized residual stress field.
The critical importance of highly localized residual stress fields at temperatures below the NDT has been documented by many other failure analyses. In fact, this is the general condition responsible for ship fractures and explains why the service failure statistics relate so exactly to the NDT temperature distribution of the ship steels. It should be noted that the existence of long-range weld residual stresses, in addition to the highly localized residual stresses, may serve to cause failure below NDT in the absence of load stresses. Such events are not uncommon and have been documented spectacularly by the fracture of ships under construction and of new gasoline storage tanks prior to filling, among others. Such spontaneous fractures are not possible above the NDT temperature.
In the absence of weld residual stress fields it is necessary to load small cracks to near-yield levels in order to obtain fracture initiation below the NDT temperature. As
iiirtiiMiiir-*^--^

32 W.S. PELLINI
Fig. 28 - Failure of 100-ton pressure vessel featuring a threaded end closure. The ladders indicate the vessel size. The fatigue crack (0.12-in. depth) which was the failure source (top right) is the light band next to the dark region which represents the thread surface. The fracture face is shown at the bottom.
described previously, loading of this magnitude may be obtained at positions of sharp change in geometry due to stress intensification effects. An example of this case is provided in Fig. 28 which illustrates the failure of a large pressure vessel featuring a threaded end closure. After only a few months of service involving 1550 duty cycles, a fatigue crack of approximately 0.12-in. depth developed at the root of the first internal thread. The features of this crack are shown at the top right corner of the figure. For the development of fatigue cracks in the order of a few thousand cycles, yield stress loading is required. This feature clearly establishes the level of stress acting on the small crack at the time of failure. This stress condition was obtained as the result of poor mating of the thread system, which forced the first thread to yield on each cycle. Because the service temperature was below the NDT, only a small growth of the fatigue crack was tolerated prior to developing unstable fast fracture. As noted in Fig. 29, the predictions of the FAD were met by a combination of events, including a localized stress of yield level magnitude which acted on the crack tip region, and a service temperature which was below the NDT.
The FAD defines that cracks of very large size are required for fracture initiation in regions of low nominal stress, even for temperatures below the NDT. Figure 30 illus- trates the large size attained by a fatigue crack prior to the failure of a cast steel cylinder

,** €■' f
NRL REPORT 6957 33
«^5 DIAM.
^15' LENGTH
100
"jFWlCTURE ^
/
^
-60 to it
V)
a: 40
STRESS AT ROOT OF THREAD
FLAW 1/8" FATIGUE
CRACK (AFTER 1550 CYCLES)
////'/////// STRESS
20 h - FAILURE ^ TEMP.
40 60 TEMPERATURE
Fig. 29 - Analysis of fracture initiation conditions of the 100-ton pressure vessel
which was loaded to stress levels of 0.3 ayi at temperatures slightly below the NDT. The conditions which led to ultimate failure are predicted by the FAD, as shown in Fig. 31. The casting served as an extrusion press cylinder and, because of its size and slow operating rate, the oil in the ram cavity remained at room temperature. Figure 31 also presents data for a companion press of smaller size which operated continuously at higher temperature due to high pumping rates. The service temperature was therefore restricted to above the CAT for the nominal hoop stress involved. The presence of a crack of equal magnitude in the second press was discovered by observation of a slight leak following the failure of the first press. The FAD predictions for the required level of hoop stress to cause failure of the second press is noted in the figure. At the higher temperature the stress requirement is In the order of two times that of the service hoop stress, and thus the second cylinder did not fail.
We shall now consider failures which Illustrate the effects of increasing temperature above the NDT on the stress requirements for fracture initiation, for the case of large flaws. As a starting point. Fig. 32 presents an analysis for the case of an air flask failure at a temperature slightly below the NDT, due to presence of a 12-ln. long lamina- tion. The failure conditions are in conformance with the predictions of the FAD. Figure 33 presents the case for another service failure Involving a similar air flask and a lami- nation of similar size, which illustrates the much higher level of stress required for fracture initiation at NDT+20oF (NDT+120C). The dashed line connecting the two failure conditions represents a close approximation to the FAD prediction of the effect of tem- perature on the increase in stress level required for fracture initiation due to a 12-ln.- long flaw. The prediction accuracy may seem to be remarkable; however, this should not be surprising in view of the large Increase in fracture toughness which results as a consequence of small increases in temperature above the NDT. The effects on structural

a
34 W.S. PELLINI
Fig. 30 - Fatigue crack which initiated the fracture of a cast ateel extrusion press cylinder. The crack originated from a casting defect.
-^ „.—4.2' —
K-13.5"
J 16.5" FATIGUE CRACK
n 40-
l 30-
0) (0 tu 20 oc i-
10
80 TON CASTING
Y.S.
CASE Cl FRACTURE
TEMP. ^
CASE C2 LEAKAGE
I SERVICE TEMP.
50 70
7b- 90 no *5 TEMPERATURE
130 150 0F
—sb oc
Fig. 31 - Analysis of fracture initiation conditions of the extrusion press cylinder (Case Cl). The development of leak without fracture for a smaller companion cylinder (Case C2) is predicted by the FAD.

■ *is-l
NRL REPORT 6957 35
III
12" LAMINATION IN TUBE WALL
100 wo ■• / ■
80 / /
ST
RE
SS
-KS
I
12"
/ / / /
/ / / /
s /
20 25 KS
FAILURE | NOT TEMP fill!
FTE
1.5"
■ 22.5" DiAM. 70 90 110 130 150 0F
20 L
40 60 0C TEMPERATURE
Fig. 32 - Analysis of fracture initiation conditions for an air flask containing a 12-in.-long lamination. The fractured vessel is shown at the top of Fig. 36.
100 r-
= 80
</) 60 0) UJ IT
W 40
WELD
l2> LAMINATION I IN FORGING
Ix t 10'
1 3.3"-^ 20
FAILURE NOT Wk TEMR
10 30 50 70 90 0F
-20 -10 I J. 0 10 20
TEMPERATURE
30 0C
Fig. 33 - Hydrotest failure conditions of an air flask featuring the same type of flaw (12-in,-long lamination) as shown for the case of Fig. 32, The higher level of stress required for fracture (approximately 0.6(7yl) is compared to the failure stress requirements of the previous case (0.3 0»,) by the dashed curve. The FAD predictions for a large increase in the fracture initiation stress in a narrow range of temperature above the NDT is documented by these two failures.
^♦■^»«•»JWtd^BBjJÜÄ*«**«-!
!
36 W.S. FELLINI
performance cannot be minor - a 20 to 30°F (12 to 170C) Increase in temperature above the NDT effectively doubles the required fracture initiation stress for large flaws. Such changes can hardly be missed, provided an accurate definition is made of the NDT temperature.
Figures 34 and 35 present the case of a pressure vessel failure at NDT+60oF (NDT+33eC) which required loading of a 6-in. flaw in the nozzle region to stresses greatly above yielding. The conditions for this failure were unusual in that the research vessel was loaded to yield level hoop stresses to study low-cycle fatigue crack develop- ment in the nozzle. Accordingly, the nozzle was subjected to severe plastic load cycles which resulted in the development and growth of the fatigue crack to a 6-in. size prior to fracture initiation. Despite the brutal plastic overloading of the fatigue crack region, the flaw remained stable untl) it reached this very large size. The strain level measured by strain gages at the start A the tests was in the order of 0.47%. The loss of section resulting from the growth of the flaw should have raised the local strain condition to higher levels of plastic overload which cannot be defined exactly. Thus, the FAD pre- dictions for severe plastic overload as a failure requirement for very large cracks at NDT+60oF (NDT+330C) were met.
A comparison snould be made with the case of the thread-root case failure (Fig. 29), which required fatigue crack growth to only 0.12-in. depth for fracture initiation because the temperature was below the NDT. The remarkable protection obtained by an increment of 60° F (33 eC) in the NDT to FTE region of the transition temperature range becomes evident from these comparisons.
The various temperature regions of the FAD (below NDT, NDT to FTE, FTE to FTP, and above FTP) also serve to define the nature of fracture that is to be expected. Below the NDT temperature the fracture appearance is flat and devoid of surface shear lips - the ship fracture of Fig. 2 is representative of such fractures. For flat plate structures there is some tendency for forking of the fracture, leading to multiple propagation paths. For pressure vessels, forking is highly developed and leads to the extreme shattering shown in Fig. 36 (top).
The fracture features of the NDT to FTE region are also distinctive. Surface shear lips become easily visible at temperatures of 10 to 20oF (5 to 120C) above the NDT and then increase progressively in thickness with increase of temperature to the FTE. At temperatures above the midpoint of the NDT to FTE region, there is little tendency for forking even for the case of pressure vessels. A single, straight fracture is the rule. This feature is illustrated by the FTE temperature fracture of Fig. 34.
In the region of FTE to FTP a very rapid increase in shear-lip thickness is de- veloped; In fact, the shear-Up designation is not proper. These fractures should be considered as 'mixed mode," i.e., partly flat and partly slant. As the FTP temperature is approached, the fracture becomes entirely of the slant (45° shear) type, at least for section sizes in the order of 1- to 2-In. thickness for low strength steels. For greater thickness there is a tendency for retention of a partly flat region Involving fibrous frac- ture. This aspect will be discussed In greater detail in sections to follow.
A simple illustration of the change in fracture mode that is developed through the NDT to FTP range is provided by the series of failed pressure vessels shown in Fig. 36. These vessels represent examples from an extensive series of burst tests which were conducted following the service failure indicated by the shattered vessel at the top of the figure. This failure was described in relation to FAD in Fig. 32. The other burst ves- sels featured a 20-in.-long slit, cut part way through the thickness to simulate the long lamination which was responsible for the service failujrjew The high resistance to frac- ture propagation at temperatures slightly above'the FTE Is indicated by the arrested fracture of a hydrotest burst (center of Fig. 36).

— mtm ttWusmMvmaimiifm'Mfmmmm» ■
NRL REPORT 6957 87
Fig. 34 - Failure conditions of a 3-ft-dlam, low-cycle fatigue teat vessel. The arrow indicates the location of the 6-in. fatigue crack which initiated the fracture.
HEAVY SHEAR LIP, FATIGUE
CRACK
Y.S. OF NOZZLE
0.47% STRAIN (PLASTIC STRESS AT NOZZLE)
' -20 0 20 TEMPERATURE
4Ü 'C
Fig. 35 - Analysis of failure conditions of a pressure vessel which documents that fracture initiation at NDT+600F (NDT+350C) requires a combination of very large flaw size and high plastic overload stresses

■
38 W.S. PELLINI
SERVICE FAILURE m-mt-
Fig. 36 - Fracture mode of pressure vessel bursts developed in the range of NDT to FTP
Pneumatic pressurization was used in order to increase the test severity for bursts at FT? temperatures. A number of revealing observations may be made for the FTP burst case of Fig. 36 (bottom). Despite the huge size of the flaw, gross plastic bulging of the flaw region was required to force the extension of a ductile tear. This condition represents the application of a very high plastic overload to the flaw tip region. The propagation of the slant plastic fracture did not proceed in a straight line extension because the fracture resistance was too high. The very high energy available, due to the high-pressure gas, resulted in the pushing out of a flap which remained attached to the vessel. The fracture characteristics of these three vessels, which relate to the initial, middle, and end points of the FAD, provide a striking illustration of the progreflve increase in fracture resistance over the temperature range of the diagram.
All of the information which has been presented to this point became available by 1963. The missing item of additional interest was the effect of very large section size on the course of the flaw size curves and the CAT curve, at temperatures significantly above the NDT. The clarification of section size effects for temperatures above the NDT will be described later in the context of 1968 developments. At this point we shall sum- marize the implications of the FAD as it applies to all section sizes at temperatures below the NDT and to section sizes not exceeding 2- to 3-in. thickness for temperatures significantly above the NDT.

NRL REPORT 6957 39
The FAD defines four critical transition temperature range reference points which also serve as "design" points:
1. NDT reference point
Restricting the service temperature to slightly above the NDT provides fracture initiation protection for the most common type of service failures. These in- volve fractures which are initiated due to small cracks subjected to yield stress loading levels.
2. NDT to FTE midrange reference point
Restricting the service temperature to above NDT+30oF (NDT+170C), I.e., the midrange of the NDT to FTE region, provides fracture arrest protection if the nominal stress level does not exceed 0.5 <rys .
3. FTE reference point
Restricting the service temperature to above the FTE provides fracture arrest protection if the nominal stresses do not exceed yield level.
4. FTP reference point
Restricting the service temperature to above the FTP ensures that only fully ductile fracture is possible.
The degree of protection against fracture initiation due to flaw size and stress combinations is Increased dramatically in the NDT to FTE region. The assignment of subdesign points to this narrow temperature region would require exacting definitions of temperature, flaw size, and stress. This observation is made to emphasize that finer cuts than the described 30oF (170C) four-design-point? sectioning of the FAD are not required for most engineering purposes. Thus, the large increases in fracture resistance, obtained by 30eF (170C) temperature increments above the NDT, reduces the problem of fracture-safe design to a temperature reference system of utmost simplicity.
The choice of steel Is dictated by the following factors: (a) the lowest service tem- perature, and (b) the design reference point criterion chosen, i.e., NDT, NDT to FTE midrange, FTE, or FTP. In order to make an appropriate choice of steel, information is required as to the expected NDT frequency distribution. Figure 37 presents typical frequency curve data for a variety of conventional steels. This figure Illustrates the wide range of choice that is available. It also emphasizes that metallurgical control of steel quality is an essential aspect of fracture-safe design. In general, the spread of NET temperature is in the order of 60° F (30oC), with a high concentration in a 30° F (17CC) span. If the yield strength and thickness are specified, information as to the average or the highest expected NDT temperature can be obtained from steel producers. Obviously, there is a correspondence of relative cost to lower NDT temperature. For example, as steels of progressively lower NDT are specified, a requirement for nor- malizing, fine-grain practice, alloy additions, and ultimately quenched and tempered (Q&T) heat treatment will ensue, as indicated in the figure. Accordingly, one should not use a design criterion in excess of real requirements because this results in spec- ifications of lower NDT and, therefore, increased costs.

■■
40 W.S. PELLINI
|0J
Z cn
O ^
2 o
i N 1
\H\ O 00
i wi >
o
2--'S
o
o 2 ^J <» UJ > 5 o 5 S CJ o Q
«-
UJ
QZ Z<
er
_j UJ UJ t- (/) Q UJ fsi
UJ 2 I I- o z UJ
I-
x o X
52 «i
OS
O o
< o UJ jW pegs
O W>
2 xen 3 1-3
a. u. O
.^-8
s / I-
1 N
\ 0
s •
.1 10 1 ■* ^
o^ —
CO 1
O ! >- 00 j
§
o
UJ
Q:
Q. 2
s
M
(o oo V
•-( *« « 2 « o 9 •« S
n •« I
nj ■« ■rt *i T3 ü ö s
ill es E o u u u ■" o
<« *» ö Ort. s^ 0 -rt ■-
ja 3 •r* <o o
i
- o M 4-* L.
80 flj ™
"0 a rt "0 !><o . 2 O O „J ^ B ^ S
> M 0 fl Ü ■" J rt n r ^ p
« r 7, ^ « 'S 2 • 4) H ►< fl
oj « 55 e ' 3^ ..
In H v o

Wti«***^»« ■Ml mBmiwmmvmmfMKtitmBmM
NRL REPORT 6957 41
SHELF CONSIDERATIONS
The nomenclature of transition to a shelf level of fracture toughness was first evolved in relation to dynamic fracture conditions. The dynamic transition defines the limiting (highest possible) transition temperature range (LTTR). The shelf of the LTTR marks the attainment of a fully ductile mechanical state which is both temperature and strain- rate independent. That is, increasing temperature or strain rate does not affect the high ductility which is inherent to the shelf level of low strength steels.
The shelf nomenclature has been broadened to cover other aspects including (a) LTTR shelf conditions of relatively low ductility, and (b) non-LTTR shelf conditions evolved by tests involving slow loading rates. For slow loading rates the shelf condition is tempera- ture independent but not strain-rate independent. Increased loading rates may result in a dramatic change from high-shelf ductility to brittle fracture levels. Thus, the full con- notations of a shelf condition do not apply for the slow (static) loading case.
The purpose of this section is to explain (a) the macro- and micromechanical aspects of the shelf state, (b) The relationships to the temperature-induced transitions, and (c) the test requirements for analysis of shelf level fracture toughness. Since the shelf state represents the completion point of temperature-induced transitions, we shall con- sider the relationship to temperature transition phenomena as an essential introduction to shelf considerations.
The transition temperature range for low strength steels involves three regimes characterized by low, intermediate, and high levels of fracture toughness. In addition there is the baseline starting point of the transition which may be characterized as a highly brittle subregime. While all fracture tests will evolve temperature-induced transitions through these three regimes, it does not follow that the specific transition temperature region that is indicated by these tests is related correctly to the highest temperature range (LTTR) for which brittle fracture propagation is possible in structures. For example, the slow loading of machined-notch tests will indicate a transition range at considerably lower temperatures. The problems of the Cv test largely stem from uncertainties in the definitions of the LTTR for many steels.
Service failures involving unstable fracture are limited by the highest possible temperature range of dynamic fracture instability. The limiting transition temperature range (LTTR) is entered as the result of inhibition to natural processes of unstable fracture propagation. The Robertson test is an excellent example of a test which is controlled by natural processes of unstable fracture propagation. Tests which feature ultrasharp cracks and dynamic loading are necessary to determine the true LTTR.
The LTTR features the subregime starting point plus the three characteristic transi- tion regimes which are defined as follows:
Subregime - the Robertson toe region of the transition (below NDT^which relates to a highly brittle condition.
Regime 1 - the region of rapid increase in dynamic fracture toughness with increas- ing temperature (NOT to FTE).
Regime 2 - the region of transition to full ductility (FTE to FTP).
Regime 3 - the shelf region of full ductility (above FTP).
The temperature range which lies above the FTP is commonly referenced as the shelf region because there is no further increase in fracture toughness above this point.
•"t:., ■-■'-■.- : . s;.

42 W.S. PELLINI
The shelf condition is entered gradually as the microfracture mode of the individual grains attains conditions of high cleavage fracture ductility and then fully ductile rupture. It is not the result of simply eliminating the last signs of cleavage. The ductile rupture process evolves by the opening up of small voids between grains, and particularly at sites of nonmetallic inclusions. The metal bridges between these sites are elongated as tiny tensile specimens which finally rupture in a progressive (slow) ductile mode. Because of these features the fracture process is defined as void coalescence (void growth), i.e., the development and enlargement of microscopic voids.
The fracture appearance at the shelf is termed "fibrous" (silky) when observed by eye and "ductile dimple' when observed at high magnification, as shown in Fig. 38. The dimples represent the sites of microscale tensile rupture. At temperatures considerably below the shelf, the fracture process Involves pure cleavage of the individual grains. The appearance to the eye is one of tiny, shiny facets. The cleavage of single grains is clearly visible at the high magnification shown in Fig. 38.
Fig. 38 - Features of cleavage and ductile dimple (void growth) fractures
The propagation rates of brittle fractures can be very rapid because the cleavage of individual grains is a high-speed process. These rates attain limiting velocities of several thousand feet per second at the toe of the transition because the fracture process entails elastic-stress-induced cleavage. The propagation rates fall off rapidly with increasing temperature in the NDT to FTE interval because time-dependent deformation must then be developed for each grain prior to attaining cleavage fracture strains (strain-induced cleavage).
It is a popular misconception that the observation of cleavage on fracture surfaces always indicates a highly brittle fracture. Such is not the case - the cleavage process at NDT temperatures differs considerably from that at FTE temperature with respect to microfracture ductility. The genesis of these differences evolves from the fact that the cleavage separation of individual grains competes with slip (flow) processes. The effect of increasing temperature is to increase the slip tendency, i.e., to increase the precleavage strain sustained by the metal grain. Strain is developed to the extent required for elevating the flow stress (by work hardening) to the level of the cleavage stress. It is important to note that differences in ductility are not involved in the actual splitting of the crystal (cleavage) but in the slip that occurred prior to attaining the stress required for cleavage. The rise in dynamic fracture toughness from NDT to FTE is strictly related to the temperature-induced increase in the plastic strain of the individual grains

NRL REPORT 6957 43
which precedes cleavage. The development of shear lips at the fracture surfaces in this interval is the result rather than the cause of increasing fracture toughness. The ductility of the last signs of cleavage fracture at temperatures close to the shelf is very close to that of the void growth, fibrous fracture ductility. This is due not only to the high strain required for cleavage but also to a mixture of cleavage and void growth processes at microscale.
The metallurgical factors which determine the specific temperature range of the lower half of the transition are different from those that determine the ductility level attained at the shelf. The temperature transition range is controlled by microcrack incubation processes, i.e., the genesis and enlargement of grain-size-scale cracks. The microcracks represent cleavage sites of individual crystals which crack prefer- entially, or the cracking of brittle metallic phases such as carbides. Grain size, the size and distribution of carbide phases, grain embrittling effects of solute elements such as P, N2, O2, etc. have potent influence on microcrack formation. These effects are well known to the metallurgist and are used to suppress microcleavage and to favor slip processes. The transition temperature range is thus shifted to lower temperatures.
The level of shelf ductility is highly sensitive to the relative cleanliness of the steel. The presence of many sites of void nucleation due to nonmetallic inclusions promotes easy rupturing leading to "low-energy tearing. * Since metal forming processes result in preferentially aligning the nonmetallic constituents, a steel plate or forging will feature directions of low and high tearing resistance. Fracture in the direction of primary rolling will indicate "weak" properties as compared to the transverse or "strong* direc- tion. For low strength steels the weak direction of the commercial product does not ordinarily present a problem of excessively easy tearing. This is due to the high inherent ductility of the grains which form the bridges between the voids nucleated by the non- metallic particles. With increasing yield strength this feature of high grain ductility is progressively decreased, and the presence of nonmetallic phases (high void site density) serves as an additional inhibiting factor on the effective ductility limit of the grain ag- gregates. Retention of high-shelf ductility to highest level's of strength Is crucially related to both void site density and metal bridge ductility. The specific features of the upper half of the transition temperature range are controlled by both cleavage and void coalescence processes, because of the mixed mode fractures involved at both micro- and macromechanical levels.
The consequences of a progressive reduction in the level of shelf fracture toughness is illustrated schematically by reference to the FAD in Fig. 39. The transition tempera- ture effect can be suppressed to the point that it is eliminated entirely. Steels of ultra- high yield strength do not show significant transition temperature features for reasons of very low-shelf characteristics. The transition from plastic fracture to elastic stress fracture indicated by the upper bold arrow of Fig. 39 may be considered a temperature- independent "shelf transition.'' Cleavage fracture is not involved and, therefore, there is no mechanism for temperature effects.
The DWT serves the purpose of defining the NDT temperature for steels which develop transitions to high-shelf ductility levels, i.e., the low and intermediate strength steels. By 1962 it became apparent that a new test of equally simple characteristics was required for investigating the properties of steels which feature low-shelf ductility. These include the high and ultrahigh strength steels, plus steels of intermediate strength levels which feature pronounced weak directions. This need led NRL investigators to the development of a test which was first defined as the Drop Weight Tear Test (DWTT). This first version featured a notched brittle bar welded to a test section. The purpose of the brittle bar was to develop a sharp natural crack. The composite specimen was tested by means of the DWT equipment, and the energy requirements for fracture were noted as a function of increasing temperature, or increasing yield strength resulting from heat treatment.

44 W.S. PELLINI
MTmHt STRESS
riELO ST«SS
Ir.
i«
Ir.
ENEROY SHELF
STEELS
FAD STKSS LEVEL
mi FMCIIM INITIATION fO* SKCTMM OF
FLM SIZES
LOW ENERGY SHELF STEELS
NOT •«o «90
*0T •40 «60 At TEMPERATURE
•isom I
•loo rc)
Fig. 39 - Schematic illustration of the consequences of a drastic reduction in shelf fracture toughness. The plastic fracture regime of the FAD is gradually depressed, and then eliminated entirely. The low-shelf steels are insensitive to temperature changes.
A modified version of the NRL test which substituted a shallow surface-pressed notch for the brittle bar was then evolved by Battelle Memorial Institute investigators and Is known as the BDWTT. Until recently the BDWTT temperature transition curve was plotted as a function of shear fraction (percent of fibrous fracture). This procedure is satisfactory for the definition of the transition temperature range from NDT to ap- proximately the FTP for low-strength steels. The fracture appearance of the BDWTT correlates exactly with the fracture appearance of full-scale pipeline burst tests. How- ever, the fracture appearance transition provides no definition of shelf level characteris- tics. The shelf features of strong and pronouncedly weak directions will be reported as being exactly the same. Such a test procedure is not appropriate for steels of intermedi- ate or high strength which may feature large decreases in shelf level ductility to a degree which may provide for propagation of fractures at elastic stress levels.
By 1964 the DWTT was redesigned to eliminate the brittle crack starter bar and the test was redefined as the Dynamic Tear (DT) test. Figure 40 illustrates the feature of 5/8-in. and 1-in. thick DT specimens. The original standard version involves a deep sharp crack introduced by the use of an electron beam weld which is embrittled metal- lurgically by alloying. For example, a titanium wire added to the site of the weld results in a brittle Fe-Ti alloy. The narrow weld is fractured easily in loading and thus provides a reproducible sharp crack. It has now been established that equivalent results may be obtained by the use of a deep sharp crack produced by fatigue or by slitting, and then sharpening a deep notch by a pressed knife edge. DT specimens featuring a deep flaw produced by any of these methods are tested over a range of temperatures using the pendulum-type machines shown in Fig. 41. The upswing of the pendulum following the fracture defines the energy absorbed in the fracture of a standardized test section.

\mmMmmmmmimamwHm>tr**mmimmmt'wr*y "'»«.WM»- -;--i^yvMa'www>i>: r w ■ ■
NRL REPORT 6957 45
jL^t i
I 8
TT 4.75 f Ti EMBRITTLED
I ELECTRON BEAM '•75 WELD w rt)
16
DIMENSIONS IN INCHES
Fig, 40 - Features of 5/8-in. and 1-in, DT test specimens. The 5/8-in. DT specimen (top) features a machine slit, with a knife-edge-sharpened notch tip. The 1-in. DT specimen (bottom) features the brittle electron beam weld, which is also used for the 5/8-in. DT, as desired. The broken halves of the 1-in. DT specimens illustrate brittle and ductile type fractures.

46 W.S. PELLINI
Fig. 41 - DT test pendulum machines. The single-pendulum type of 5000 and 10,000 ft-lb (688 and 1375 kg-m) capacity is shown on the left. The capacity is modified by changing the hammer heads. The instrumented double-pendulum type of 2000 ft-lb (275 kg-m) capacity, shown on the right, provides for shockless testing of 5/8-in. DT specimens. A simplified low-cost version of the double-pendulum type is being designed for use in routine testing.
Figure 42 illustrates typical relationships of the DT test energy transition curve to the NDT, FTE, and FTP temperatures for a low strength steel of high-shelf fracture toughness. At the NDT temperature the fracture Is brittle and shows a flat, featureless surface devoid of shear lips - exactly similar to the DWT fracture at NDT. A sharp increase in the fracture energy reading is recorded above the NDT temperature as increased ductility is developed by the metal grains prior to cleavage. The fracture surfaces develop visible shear lips as the NDT temperature is exceeded, and these then become progressively thicker as the temperature is increased to FTE levels. As the shelf temperature is entered the fracture no longer shows signs of cleavage but becomes totally of the ductile dimple type. The FTE is located at the midpoint of the DT energy transition curve and indexes the transition from elastic to plastic stress-induced fracture. In effect, the lower half of the DT energy curve traces the temperature course of the CAT curve from NDT to FTE. (These changes in fracture appearance from NDT to FTP temperatures are clearly evident in Fig. 53.)
The DT specimen provides an inexpensive method for determining the full course of the limiting transition temperature range (LTTR) from NDT to FTP. If the temperature transition is to intermediate or low levels of shelf fracture toughness the DT energy curve also provides direct evidence of this characteristic. Figure 43 provides schematic illustrations of DT energy transition curves featuring the same NDT temperature but different shelf quality characteristics. The curves which show high- and intermediate- shelf features represent typical test results for strong and weak directions of intermediate strength steels. The curves which show intermediate- and low-shelf characteristics are typical of steels featuring relatively high yield strengths. The low-shelf curve which shows no significant transition temperature effects is typical of ultrahigh strength steels for both weak or strong directions, i.e., differences due to direction are of small magni- tude. The notations of elastic and plastic fracture emphasize the common mechanical features of the "temperature* and 'shelf* transitions, a change from elastic to plastic levels of fracture toughness.
■'■*- •■" HNBHi

NRL REPORT 6957 47
DT ENERGY
-200 NOT + 200 J_
+SOO *f
-150 ■100 •50 NOT +50 +100 TEMPERATURE RELATIVE TO NOT
+150
Fig. 42 - Significance of OT test transition features for steels which develop high-shelf-level fracture toughness. The rise in fracture energy and change in fracture appearance document a transition from plane strain (elastic) to high-ductility plane stress (plastic) fracture. The transition curve represents a C-Mn steel plate of 1-in. thickness.
A shelf transition to brittle, elastic stress fracture which evolves as a consequence of an increase in strength level has been defined as a ''strength transition.* Because of the strong influence of increasing yield strength on shelf fracture toughness, it is informa- tive to characterize high strength steels in this frame of reference, as will be explained. The condition of low-shelf fracture toughness requires special consideration for these steels because increasing temperature does not provide a solution for fracture-safe de- sign, as for the case of low strength steels. The procedures by which considerations relating to fracture-safe design may be made for the shelf (strength) transition will be described in detail. At this point it should be recognized that the DT test specimen pro- vides for independent assessment of the transition temperature range and shelf level characteristics of a steel; as such, it is a highly versatile test procedure.
The DT test and the analytical procedures for its interpretation have been evolved since 1964, and most notably in the period 1967-1969. The need for such a test was paced by the rapid increase in the engineering utilization of high strength steels, titanium, and aluminum alloys. The analytical interpretations are derived in part from principles of fracture mechanics theory which matured to technological utilization during the late 1960's. Accordingly, an Introduction to fracture mechanics concepts are required before proceeding with discussions of shelf (strength) transition aspects.
FRACTURE MECHANICS PLANE STRAIN TESTS Fracture mechanics aspects will now be considered in terms of test specimen
procedures for interpreting the significance of these tests, and their interrelationships to

48 W.S. PELLINI
OT ENERGY
ELASTIC FRACTURE
OT "TOE"
NOT TEMPERATURE-
Fig. 43 - DT teat transitions to various levels of shelf fracture toughness. Note that with a decrease in shelf level fracture energy there is a corresponding change from fractures withlarge lateral contraction to flat fractures with nil contraction features. The decrease in shelf energy marks a transition from plastic (plane stress) to elastic (plane strain) fracture conditions.
engineering-type tests.4* Fracture mechanics plane strain tests are concerned with the measurement of very fine differences in fracture toughness, at levels which relate to the relatively brittle state. The tests are not applicable to measurement of the full span of fracture toughness from brittle to plastic levels. The development of interrelations with engineering tests is important because these simple tests can then serve the define metal characteristics which are best measured by linear elastic fracture mechanics methods - as well as those which are not. The development of these relationships also provides for indirect use of fracture mechanics based on low-cost tests suitable for routine engineering application in fracture-safe design.
Fracture mechanics plane strain tests depend on the measurement of the mechanical re- sistance to the onset of fracture Ln terms of elastic stress parameters. However, the crack tip region of even the most brittle metals will feature the development of plastic zones prior to the onset of fracture. The microscale events which control fracture toughness always Involve exceeding the strain capacity limits of the metal grains. In customizing of metal characteristics it is not possible to ignore the strain events within the plastic zone. This *A simplified introduction to the subject of linear elastic fracture mechanics is provided in the appendices of this report. The discussions to follow will assume familiarity with the content of these appendices.

mbm
NRL REPORT 6957 49
TRIAXIAL STRESS STATE
FLOW STRESS (YIELDl
STRESS FIELD INTENSITY
'NOMINAL
i PLASTIC I ZONE
Fig. 44 - Relationships of elastic and plastic stress fields to the plastic zone at crack tips for the case of plane strain constraint. As plastic relaxation is developed (large plastic zone and crack tip blunting), the elastic stress fields are replaced by plastic strain fields. Elastic stress field K definitions are not possible for these conditions.
is the crucial parameter which determines brittle or ductile behavior. For purposes of fracture mechanics definitions of the macroscopic fracture characteristics, it is possible to ignore the existence of the plastic zone, at least for highly brittle metals.
As the metal ductility increases, the increase in the plastic zone size is accounted for mathematically by adjusting the crack depth value used in the calculation of stress intensities. This adjustment involves considering the mathematical crack depth as equal to the true physical crack depth a plus the radius r of the plastic zone. The ad- justment is referred to as a "plastic zone correction' and requires calculation of the plastic zone size from the measured *KIC*valueandthenacorrectionofthe*KIC* value by recalculation. With additional increases in metal ductility and related plastic zone size, the plastic zone correction becomes invalid and linear elastic fracture mechanics analyses cannot be applied.
Fracture mechanics plane strain tests define fracture instability conditions in terms of the elastic stress field acting ahead of the crack tip plastic zone. Figure 44 provides a schematic illustration of a sharp crack with a small plastic zone and the associated elastic stress field. The intensity of the stress field, which is represented by the steepness of rise of the stress on approach to the plastic zone, is defined by the parameter Kj- Linear elastic analyses have been evolved which relate crack depth, crack geometry, and nominal section stress to Kr The Ki value at instability is defined as K ic, i.e., the critical value of K,.
A typical fracture mechanics test specimen is illustrated in Fig. 45. The specimen features a deep fatigue crack carefully prepared to ensure maximum acuity. The K| stress intensity applied during the fatigue process must not exceed the minimum expected value of KIc. This is particularly important for the case of fatigue cracking at room temperature, and subsequent tests at low temperatures. The plastic zone developed In fatigue at room temperature remains, and it precludes fracture with a smaller plastic zone size at the low temperature. This in turn precludes measurement of the correct Kie value at the lower temperature. A clip gage is mounted at the notch opening to monitor the crack opening displacement (COD).
...„•..^ajuj-ii»- .. .

■
50 W.S. PELLINI
BEND SPECIMEN
'A FATIGUE CRACK
0.10
<*>
K
M-p ?>
H
LOAD
FATIGUE CRACK
FOIL STRAIN G^GE
CLIP GAGE
Fig. 45 - General features of bend-type KIc test specimens. The clip gage detects the first signs of elastic fracture instability or of crack blunting.
For a valid Klc determination It Is necessary to document that "Instability" Is developed at nominal elastic stress levels and that the clip gage COD trace is recording in the elastic range. In general "instability" signifies a detectable (by the COD gage) forward extension of the crack tip which may be of minute dimensions. It does not imply necessarily that the instability results in fracture of the specimen.
There are three types of instabilities:
1. a nonarrestable "popin" instability which leads to total fracture;
2. a momentary "popin" instability which is arrested and then requires increased load for further extension because the crack tip is blunted in the process of extension; and
3. a secant-offset instability which is indicated by a deviation from elastic response of the COD gage, plus other confirming evidence (such as ultrasonic detector) that the crack tip has moved slightly without becoming unstable.
All of these instabilities are considered acceptable in the determination of K^ values according to ASTM recommended practices. In addition, there are nonstandard definitions of Kfc values which are ASTM nonvalid, but are nevertheless widely used with this qualification. The important point is that the K value signifies a measurement of the "first event» (i.e., the beginnings of separation of metal grains at the crack tip) and does not describe following events unless other information is provided, such as: popin K^, rising load Kfc, secant-off set Klc, nonvalid Kjc, etc.
From an engineering point of view it may be argued that a minute instability that is followed by increasing resistance to further extension of the crack is not of consequence to the structure. It is an event which occurs at the crack border while the crack tip is blunted to some degree and, therefore, leads to increased "resistivity" to crack movement.

•
NRL REPORT 6957 51
The engineering significance of a nonarrestable popin KIc instability is clear - it defines fracture initiation followed by propagation through the structure.
The COD features which separate ASTM-valid KIc values from nonvalid KIc are il- lustrated schematically in Fig. 46 (left). The drop-in-load instability noted as Klc repre- sents a valid type which may (or not) lead to propagation. The nonvalid types are represented by the K c and K, notation.
These test limitations for the ASTM valid determinations of KIc are necessary to ensure that elastic stress field conditions applied at the time of instability. Evidence from a P/A calculation that the net section stress exceeds yield or that the COD trace shows a nonlinear (plastic) response (Kc and K? notations) signifies that the crack tip elastic stress field was distorted or eliminated by excessive plasticity at the time of the 'first event" extension of the crack tip. If the COD deviation from elastic response is small, Kc calcu- lations, commonly referred to as plastic zone corrections, may be made to approximate the Klc value. If the COD response is of the K? type the plasticity level is much too high for any form of acceptable correction calculations. These various restrictions signify that fracture mechanics plane strain tests can apply only when the metal is sufficiently brittle to result in fracture initiation with only a small amount of crack tip plasticity.
These considerations dictate that relationships between valid popin type KIc and DT energy measurements of fracture toughness should be expected only at toe regions of the temperature transition and at low-shelf levels for shelf transitions. Figure 46 relates the previously described COD instability features of the Klc specimen to typical DT energy curves. Elastic fracture instabilities (KIc notation) for static or dynamic KIc tests are indexed to temperatures which cannot exceed the midpoint of the DT energy transition curve featuring high-shelf characteristics. With increased DT energy due to increased temperature, large plastic strains are developed at the crack tip which will cause the static or dynamic K Ic specimen COD trace to indicate instabilities noted as Kc or K? in the figure. A KIc or KId value cannot be assigned for such failure conditions. For high-shelf metals, the Kc condition will apply as the DT energy midpoint (FTE) is ap- proached, and the K ? condition is attained quickly above this point. The large increase in lateral contraction of the DT specimens which is obtained on exceeding the FTE temper- ature (or with increasing shelf level) provides proof of plastic fracture properties beyond the limits of stress intensity (KIc) definition.
The fracture mechanics nomenclature of plane strain is applied to brittle fracture conditions which are mathematically definable by the K Ic stress field parameter. The nomenclature for plastic fracture is plane stress. The basic difference between plane strain and plane stress fractures may be visualized by considering the degree of through- thickness lateral contraction which is developed in the course of fracturing edge-cracked specimens of the Klc and DT types. Plane strain signifies that the lateral (through- thickness) contraction parallel to the crack front is of very small (nil) values. Plane stress signifies that through-section yielding occurs with notch blunting (plastic COD). In other words, for the plane stress case the crack is not effective in constraining the flow of the metal to a small plastic zone.
The features of plane stress fractures are illustrated in Fig. 47. The small plastic '.' zone of the plane strain case is now replaced by a large plastic enclave and features a
surface dimple which represents the equivalent of the neck region for a tensile specimen. The high energy absorption of ductile (plane stress) fractures derives from the require- ment for continuously forming a plastic enclave region ahead of the propagating tear. The large amount of plastic deformation involved requires the application of plastic load stresses.
Plane stress fracture may be of low- or high-shelf characteristics. The energy ab- sorbed is related to the degree of through-thickness contraction which controls the size of the plastic enclave. The degree of through-thickness contraction is controlled in turn by the critical strain which can be endured by the metal grains prior to rupture. The metallurgical quality factors which represent the basic control mechanism of the

■■■■■. ■■ ■ ■
52 W.S. PEI.LINI
Ö <» g
m 0 c
4) S U g
4) .5 *i "O 0. B n «> 4) u
in ** "i
0< 3
w W «M "C
ST, 0^ •H Ot
Q .5 3 u
o. ti «I
4) ö S ö „
<* M 4) <M
.2?|« Q ^2 2 M o « 3
?! d « ™
y.? >• a * rt .3 -a o M n s 3 0 u M0t3 „
ali ™ o « a gä « o •g « « - a .2 « ^ « g
w a >«o « ' o S „ £
* 'S I S « .S? nl « g rt tu i .2 «) 0.

-■^fWVWWIVW'. ■
NRL REPORT 6957 53
A S\
CRITICAL PLASTIC STRAIN
FOR RUPTURE
LOW- VOID-SITE DENSITY
HIGH CRITICAL
STRAIN
SECTION THICKNESS
HIGH- VOID-SITE
DENSITY
LOW CRITICAL STRAIN
Fig. 47 - Features of high-ductility plane stress fracture as illustrated by through-thickness contraction and the develop- ment of plastic enclave dimpling. The intrinsic void site density quality of the steel determines the critical plastic strain for rupture. Accordingly, metallurgical quality con- trols the degree of contraction, the dimple size, and the measured level of fracture toughness.
total process are best expressed at the microscale level. A steel with combined features of high cleanliness (low void site density) and high grain structure ductility resists the incubation and enlargement of microvoids. The inherent microfracture ductility thereby forces the development of large macroscopic contraction and associated large plastic enclave. Conversely, a steel of high void site density combined with low grain structure ductility will suffer early enlargement and rupture of the microvoid bridges. As a con- sequence, low critical strain and small (or nil) lateral contraction will result.
The plane strain condition lb attained when the lateral contraction and enclave fea- tures are reduced to nil values. Since little flow is developed in the through-thickness direction, the Poisson-related flow In the crack opening direction is minimized and the deformation is limited to a narrow plane. The mathematical definition of plane strain assumes zero strain in the thickness (Z) direction and considers strain only on the x-y plane, i.e., plane strain. The plane stresc case starts with the beginning of through- thickness yielding, i.e., loss of constraint at the crack tip. Measurements of plane strain fracture toughness may be considered in terms of a "vernier scale' measurement of crack tip ductility, i.e., very fine differences. Measurements of plane stress fracture for ductile metals require only gross scale definitions by comparison, because both the absolute values and the differences are very large.
■ '>««k«««M«tt*i«t»B*M;;.« :*i«i

54 W.S. PELLINI
I1
SIZE-INDEPENDENT ■ PLANE STRAIN
LIMIT
LARGE SECTION SIZt
SMALL SECTION
SIZE
j I__J L_a
TO VERY HIGH VALUES
/
H HIGH-DUCTILITY PLASTIC FRACTURE
CORRELATIONS
WITH ASTM-E24 VALID K1C
WITH PLASTICITY CORRECTED K^ VALUES
»ftetfifs?'. SELF-INDEXED PLASTIC FRACTURE
MARGINAL BRITtLEl METALLURGICAL DUCTILITY |
(CONSTRAINT CONTROLS) |
J L_l LJ I L
, HIGHLY DUCTILE
_1_J I L Ar J L J I I I l_J I L
DYNAMIC TEAR TEST ENERGY
Fig. 48 - Schematic relationships of DT energy values to KIc and KIc/(T ratio values. The DT energy values are indexable to these plane strain parameters for highly brittle and marginal conditions of metallurgical ductility, i.e., for conditions suchthat the plane strain state is possible. The codes indicate the limits of experimental correlations and the types of Kic measurements involved. For conditions of plane stress fracture, the DT test is self indexing, i.e., it defines if the plane stress ductility is of low, interme- diate, or high levels.
At its present state of development fracture mechanics is restricted to measurement of the fine differences in plane strain fracture toughness, i.e., differences in degrees of brittleness. The DT test specimen provides for measurement of the full span of fracture toughness states from plane strain to high-ductility plane stress. The general relation- ships which have been established experimentally between DT and KIc test values are illustrated in Fig. 48. The general features of the correlations with ASTM-valid Klc data are represented by the solid part of the curve which extends to KIc/a ratios of approximately 1.0. The Klc value relationship rises essentially linearly with the DT test energy and then develops a slight curvature. Above the 1.0 ratio the available Kb data have been of the plasticity-corrected type due to specimen size limitations. These values have been shown to agree reasonably well with ASTM-valid Klc data However, it should be noted that ASTM-valid Klc values in excesses of the 1.0 ratio are generally of the secant-offset type, the engineering significance of which is not clear. In summary, the DT test provides excellent correlations and may be used to index K. values reliably irrespective of whether these are obtained by ASTM-valid or by correction procedures.
With an increase in metallurgical ductility and DT test values, the plane strain limit is exceeded (noted as infinity H ratio) and the plane strain fracture mode no longer applies. No further correlations can then be made between K. and DT test energy. The DT test energy values which rise to a very high value (dashed part of the curve) are self indexing and represent levels of plane stress fracture toughness. The

■••^mi'vvv-^t>n*,'mmn^**'l
NRL REPORT 6957 55
W
i PLASTIC ZONE
-1/ AT SURFACE /
&
INTERIOR PLANE STRAIN
7
SURFACE PLANE STRESS
RATIO
("Vf
4.0 \KC
\ WKIe
1.6
1 0
s* Klc w
Kle
0.4 Klc
1 1 1 1 2.5
THICKNESS (IN.)
RATIO
'A 2.0
1.3
1.0
0.6
10
Fig. 49 - Illustrating requirements for increasing the KIc specimen section size for meaaurement of increasing values of KIe and related Klc/(ryt ratios
point of departure for the K^-DT relationship due to entry into the plane stress state is of major significance because it indicates a transition from elastic to plastic stress levels of fracture toughness. As such, it is of considerable importance to fracture-safe design considerations.
There is no need for engineers to become highly versed in fracture mechanics theory for routine utilization of the subject. The engineering aspects may be expressed by simple analysis charts with instruction as to their use in fracture-safe design. The discussions will now be aimed directly at achieving this degree of utilitarian familiarization.
Section size is an important consideration in K^ testing and in the engineering appli- cation of fracture mechanics principles. Section size establishes the flaw size that can be placed within a section with retention of plane strain conditions. Constraint to metal flow at crack tips is increased with increase in flaw size, provided sufficient metal re- mains surrounding the flaw to contain the plane strain elastic stress fields. If plane strain conditions are to apply, a significant part of the flaw tip region must reside in the equivalent of a semi-infinite medium which does not provide for mechanical 'sensing* of free surfaces.
This aspect is best understood by reference to the K^ specimen size requirements for measurements of valid K Ic. Figure 49 illustrates schematically that edge-cracked specimens have KIc measurement capacities which increase with increasing section thickness. As the intrinsic metallurgical ductility of the metal is increased, the plane strain fracture toughness value and the section size of the specimen used for its measure- ment must increase also. If the intrinsic plane strain fracture toughness of the metal is greater than can be measured for the section size that is involved, say a fixed-plate thickness, then the behavior of the metal will be characterized by plane stress (Kc) for reasons of inadequate mechanical constraint. This follows because the flaw size (width) controls the degree of constraint (a sufficiently deep crack is assumed) and the section size controls the width of the flaw size that can be introduced. For thin sections the metal must be extremely brittle metallurgically in order to provide for a measurement of plane strain fracture toughness. As the metal ductility under constrained stress states is increased, a point will be reached such that plastic fracture is enforced irrespective
.' «-•■«

56 W.S. PELLINI
of section size. This condition Is attained as the transition temperature region Is entered, or as the strength level of the steels Is decreased from the ultrahlgh strength range, as will be demonstrated.
It is Important to note that the K ^ value Is not a sufficient Index of fracture tough- ness - It must be referenced to the yield strength. Low K^ values may relate to high plane strain fracture toughness for metals of low yield strength. These same values may signify low plane strain fracture toughness for a metal of high yield strength. In all cases it is essential to "think* ratio rather than in terms of the Kfc value per se. The relationship of Kic/ffyt is basic to any definition of plane strain fracture toughness because it relates to the plastic zone size developed at crack tips. The test specimen thickness B required for measurement of plane strain fracture toughness is Indicated by the following expression, as recommended by the ASTM E-24 Committee:
B (in •'-©1
For a KIc Ay, ratio of 1.0 a minimum plate thickness of 2.5 in. is required; for ratios of 0.5 .md 2.0 the respective minimum thicknesses are 0.6 and 10 in.
It should be noted that an estimate must be made of the probable level of plane strain fracture toughness (the K Ic value) before the test specimen size is selected. If the estimate is not correct, it may be necessary to reselect specimens of larger section size. If the section size of the metal under consideration precludes such selection then a K tr value cannot be obtained.
The general relationships of low and high ratios to the size of the K^. test specimen and to the relative size of surface flaws is indicated schematically by Fig. 50. Small section size and small flaws suffice for plane strain fracture initiation of low-ratio metals. Conversely, large section size and large flaws are required for high-ratio metals. The mathematical relationships are best expressed graphically as shown in Fig. 51 which relates ratio values to flaw size and stress requirements, as well as to section size. The two sets of curves relate to limit conditions of flaw geometries - stubby and thin. The long thin flaw is more severe than the stubby flaw because it features greater constraint for the same nominal depth. For practical purposes the ratio 2.0 represents the limit of plane strain fracture toughness. The value of plane strain fracture toughness in excess of the ratio 2.0 will be defined as an infinity ratio (a) unattainable.
A confusing situation has evolved in recent years with demands by designers for Klc values for any and all metals. It should be appreciated that this is not possible for reasons which are basic to fracture mechanics, as well as to the ability of the metal- lurgist to produce ductile (plane stress) metals within wide limits of service temperature and strength level requirements. The pressure for K Ic values has resulted in the use of K7-type test Instabilities, which are commonly referred to as 'round-house curves,' for the calculation of "lower bound" K ^ values. These lower bound values signify esti- mates that the true Klc value must be at some higher undefined level. In fact, the true value of fracture toughness can be equal to plane stress. In some cases the metal is defined as potentially brittle when it is actually highly ductile.
The determination of K^ values for the transition temperature range is in fact a measure of the mechanical state which applies to the cleavage of the first few grains when the load is applied slowly. The fracture of the KIc test specimen is controlled by dynamic (KId) fracture toughness properties after the Initial instability is attained. If the KIe test specimen is subjected to dynamic loading, the Initial instability is controlled by dynamic microfracture processes and a KId value is measured. The KId value is ordinarily much lower than the KIc value. Klc tests conducted over a range of loading

■wt&mmmmmmwmmmm
if
LOW -s^- RATIO
i. J
NRL REPORT 6957 57
HIGH -g^ RATIO
Fig. 50 - Schematic illustration of the physical significance of plane strain constraint requirements expressedin terms of sec- tion thickness B and surface flaw size«
Kics j^O-y^ •o
Fig. 51 - Relationship of flaw size and stress requirements for the initiation of plane strain fracture as a function of increasing Kfc /a ratios. The sec- tion size requirements are indicated by the B scale.
..Lv^.M^y.^^ntHtolOT^CTJIfWrfMMtt7aaiMNlft8MMiMI<MBtt^tttf »MMMUffiBWliwriirin WMMMMMMMOTHNnHHIi

58 W.S. PKLLINI
rates should show a decrease In the Klc value to the level of the KM value. Such experi- ments are ordinarily referred to as K tests, where k signifies that the rate of increase of stress intensity is a test variable.
There is growing interest in k experiments and in the conduct of KId tests, trends represent a gradual acceptance of the engineering importance of the LTT
These LTTR which
relates to dynamic fracture and, thereby, to the limiting conditions for the development of structural failures for rate-sensitive metals.
SECTION 3IZE EFFECTS ON THE TRANSITION TEMPERATURE RANGE
The level of mechanical constraint which is applied to the metal during the propagation of a fracture is indicated qualitatively by the degree of through-thickness contraction adjoining the fracture surface. With increasing temperature in the transition temperature range, there is a transition from nil values of lateral contraction to large values. This transition signifies that the effective mechanical constraint was high at the start of the transition (nil contraction) and low at the completion of the transition (large contraction). The effective mechanical constraint is determined by the microfracture ductility, i.e., it is the "allowed" constraint. With increased temperature there is an increase in micro- fracture ductility which lowers the level of allowed constraint for any section size.
The increase in microfracture ductility with increased temperature is an intrinsic metallurgical property. It is developed over a broad range of temperature at an acceler- ating rate, i.e., first gradually and then very rapidly. The low value of the Imposed mechanical constraint due to thin sections is defeated (by crack blunting) at temperatures of relatively low intrinsic microfracture ductility. The high mechanical constraint of thick sections requires metal of greater ductility for its defeat. Crack blunting and lateral contraction is thus developed at a higher temperature, which is related to much greater Intrinsic metallurgical ductility. In effect, the imposed mechanical constraint establishes the degree of metal ductility required for its defeat. As a consequence it establishes the temperature range of the transition. Vice versa, metal ductility estab- lishes the highest temperature at which the imposed mechanical constraint related to a specific section size can be expected to act.
Constraint effects due to section size have been explored extensively since the 1940*8. These studies were concentrated in the 0.5- to 2-in. range, which provides the point of reference In discussions to follow. By the mid 1950's it was well established that section size effects result in large, true shifts of the transition range to lower temperatures for decrease in section size below 0.5 in. The effects of increasing the section size from 0.5- to 2-in. thickness were less pronounced. The temperature shift increase, as deduced by specific Indices of the transition temperature (such as CAT for 0.5 ayi), decreased as the thickness Increased. This behavior suggested an approach to saturation (relatively small further increases) for section sizes greatly in excess of 3 in.
The FAD definitions of the CAT curve were based primarily on data for the 0.75- to 2-in. range. The FAD was not Intended to apply to section sizes significantly below this range. The NDT temperature is not affected by section size above the 0.5-ln. thick- ness level because the constraint level is established by the small flaw size, and not by section size, above this thickness. An expansion (not shift) of the NDT to FTE temper- ature range was expected for large increases in section size. However, it was assumed that these would not be of major consequence to engineering interpretations because of the saturation considerations. It was expected that CAT tests of thick sections would ultimately define the degree of expansion. The concept of saturation was in agreement with metallurgical theory, which dictated that increases in microfracture ductility resulting from increases in temperature should defeat the application of increasing constraint.

.'."'
NRL REPORT 6957
Fig. 52 - Range of DT test specimens in current use for size effect studies. All specimens feature the brittle electron beam weld crack starter. (See Table 1 for dimensions.)
<
By 1964 opposing concepts were evolved, based on theoretical fracture mechanics considerations of constraint effects. It was predicted that Increasing mechanical con- straint should defeat Increasing microfracture ductility. Accordingly, It was poetulated that large Increases In section size to 10 or 12 In. should eliminate the sharp rise in fracture toughness in the transition temperature range. With the elimination of the transi- tion features, the metal should be expected to retain brittle plane strain fracture toughness properties to temperatures far above the NDT.
This postulate caused great concern with respect to reactor pressure vessels of thick-wall sections because It inferred that brittle fracture could be developed at service temperatures which are In the order of 500° F (260° C). Ja a broader context It Inferred that all steels of thick section should be mechanically brittle irrespective of metallurgical considerations. These postulates were unacceptable to those who held the metallurgical point of view that fracture toughness was inherently controlled at microscale. If true, the fracture mechanics postulate would have negated all of the carefully evolved physical metallurgy principles which had guided the evolution of improved steels by control of microstructure.
The basic issues were settled in 1969 by investigations of thick-section (6- and 12-in. thick plates) reactor-grade steel of the A533-B type. Westinghouse Research Laboratories studies by Wessel involved Klc tests to 12-ln. size. NRL studies involved DT tests rang- ing from 5/8- to 12-in. size.
The range of DT specimens investigated is shown In Fig. 52. The dimensions and weights of these specimens are listed in Table 1. The DT energy transition curves of the 5/8- and 12-in. specimens are shown in Figs. 53 and 54. It is clearly evident that

60 W.S. PELLINI
Table 1 Dimensions and Weights of Various Steel Specimens
Used In the DT Test
Specimen Dealgnttlon
Thickness B
Depth W
Length L
Span Between Supports
8
Brittle Weld or Notch Depth
Weight
In. cm In. cm In. cm in. cm in. cm lb kg 8/8-ln. DT* lln. lln. Sin. 6 In. 131n.
0.635
12 15.3 30.5
1.62 4.75
8 8
13 15
4.1 12.0 10.3 30.3 30.5 38.1
7 18 38 38 63 90
18 46 71 71
158 338
6.5 16 36 26 58 84
16.5 40.6 66.U 68.0
147.S 213.3
0.5 1.75
1.3 4.4 7.6 7.6 7.6 7.6
2 24
127 190
1220 4580
0.9 10 57 86
554 2080
*AUo daap machined notch having tip sharpened by pretied knife edge.
1000
0
750
500
250
50° 700C
A-533B PLATE | IN-DT
-40 -20 O 20 40 60 TEMPERATURE
200 »F
IOO »c
Fig. 53 - Temperature transition features of 5/8-in. DT test specimens for the 6- andl2-in. A533-B steel platen. The NOT was determined to be 10 to 20°F (-12 to -70C) by use of the DWT.
■ ..,.■■ , .

iimiwiirwuim'HT ' *'*i**f*.-!*'*r#*iil*min!iii'i*m9*ii*mmuvmm Htmamm* urn* mmjmwwm \itmm*m ih-?mm ^
NRL REPORT 6957 61
160
120
I
40-
12-IN. A533-B PLATE
PLASTIC / SHELF FRACTURE 'ESTIMATE
I I
9 PARTIAL
FRACTURE
STATIC PLANE STRAIN LIMIT
I.OOOjOOO
800,000
-600,000
12 IN. OT TEST
i 400.000
200000
-50 0 50 TEMPERATURE
150*0
Fig. 54 - Temperature transition features of A533-B steel plate as measured at full thickness by the 12-in. DT test. The results of KIc tests conducted by Wessel for the 12-in. plate are plotted with notations of the specimen sizes required for the tests. The steepness of rise of the Kic curve above the NDT indicates a sharp transition to the infinity (unattain- able) plane strain limit.
the transition temperature features were not eliminated by increases in section size to 12-in. thickness. Figure 55 illustrates the high degree of plastic ductility exhibited by the 12-in. DT specimen at 215°F (102oC). A similar performance (partial fracture as shown in Fig. 55) was obtained for the 6-in. plate tested at full thickness at 170° F (770C). The high degree of plastic fracture resistance of the 6- and 12-in. plates at the noted temperatures clearly indicates that the propagation of a fracture through a structure would require loading above yield levels. The principal effect of increasing section size to the 6- and 12-in. thickness is an expansion of the transition temperature range in the order of 60 to 80oF (33 to 450C). For the 5/8- to 1-in. thickness the transition is com- pleted in the range of NDT + 120 to 140° F (NDT + 65 to 80oC). The transition of the 6- and 12-in. thickness plates is completed in the range of NDT + 180 to 220° F (NDT + 100 to 120° C). The transition of both the thin and thick section DT test specimens starts at the NDT temperature. The effect of increased section size is to expand (not shift) the transition temperature range interval. The expansion of this interval for the case of 6-in. thickness is slightly less than for the 12-in. thickness. These results are in con- formance with expectations of saturation effects, as described previously.
estimated KId, and DT test transition curves for the thick A summary of the Klc, section A533-B steel is presented in Fig. 56. follows the general relationships established for a variety of low strength steels, including
The Kid curve plot to the NDT temperature

....
62 W.S. PELLINI
Fig. 55 - Illustrating the highly ductile performance of the 12-in. DT test specimen at 2150F (95eC). The size of the plastic enclave is indicated by the grossly dimpled region between the two tears which extend from the deformed crack root. The 750,000 ft-lb (104,000 kg-m) capacity of the NRL equipment was not sufficient to cause full fracture in this ductile mode.
steels similar to the A533-B type (AS02-B). Theseshowonly a gradual rise from low temper- atures to the NDT temperature. TheKId extrapolation from near NDT temperatures repre- sents an estimate based on the rapid rise of the DT test energy curve. The extrapolation of the Kid curve is limited to temperatures which can approach, but not exceed, the temper- ature midpoint of the DT test transition curve for thick sections. The deduction evolves from the fact that the DT test specimens feature pronounced through-thickness contraction and notch blunting above this temperature point. It is emphasized that the estimated K id curve relates to a dynamic plane strain instability of the nonarrestable (true instability) type.
The course of dynamic fracture events associated with DT energy transition curves is indicated by the fracture photographs of Fig. 53 as follows:
1. Li the toe region of the transition, the fracture is initiated with nil lateral contraction (plane strain). There are no indications of arrests, i.e., the fracture propa- gates in unstable fashion.
2. As the midrange temperature (FTE) is approached, a small amount of lateral contraction is developed which indicates the start of plane strain relaxation. Fracture arrest bands become visible - these are indicated by a change from cleavage (light) to fibrous (dark band) regions. These features are evidence of marginal conditions (close to limit) for propagation of unstable fracture.
3. As the midrange temperature (FTE) is exceeded, the region of cleavage below the starting crack is developed only after considerable lateral contraction (plane stress).

'.di« mmm wn-wwn
NRL REPORT 6957 63
PLASTIC . / SHELF FRACTURE 1 t . ESTIMATE
I jP- — — —
1 / 1 / 1/
FRACTURE -^» SHOWS LARGE r
THROUGH-THICKNESS CONTRACTION
AND PLASTIC ENCLAVE 1
V 12-IN.
J OT TEST
1000.000
800,000
600.000
400.000
I »- u.
>-
z
200.000
-300
-100 -50 0 TEMPERATURE
SOO^F
I50*C
Fig. 56 - Summary of KIc estimated Kjd and DT test data for the 12-in, A533-B steel plates
Gross fracture arrest bands are developed. Both of these aspects indicate that large strains are required to promote cleavage, i.e., the cleavage fracture is of ductile (strain-induced) type. The fracture propagation rate across the specimen is then con- trolled by the rate of application of plastic load to the specimen and, as such, does not represent unstable fracture.
4. As the energy curve "turns' into the shelf, a very large amount of plastic deformation (lateral contraction) is required to develop the last signs of strain-induced (ductile) cleavage. The initially sharp crack tip (of the brittle crack-starting weld) is blunted severely, and re-initiation of cleavage patches is not possible thereafter in the run of the fracture. At slightly higher temperatures all signs of ductile cleavage fracture are eliminated.
These aspects are common to all DT test transition curves which culminate to high levels of shelf fracture energy. From an engineering point of view, the most important reference is the FTE midpoint. This follows from the fact that it represents the "safe temperature* above which unstable fracture propagation is no longer possible. Unstable (brittle) fracture is the only mode of fracture that has been documented in the service

64 W.S. PELLINI
failure records of plate thickness (not sheet) structures. There have been no reports of service failures by ductile fracture. The DT test is ideally suited to define this temperature point because of the very steep features of the energy curve at the midpoint of the transi- tion. It provides a sharp ±10oF (±50C) definition for the FTE, similar to the sharp defi- nition provided by the DWT for the NDT.
The question of the temperature range over which the shelf condition applies is of interest only if prevention of fully plastic fracture is an issue. For high-shelf metals, plastic fracture requires overloads involving gross plastic deformation of the structure as well as the presence of huge flaws. The difference in protection to plastic fracture afforded by being slightly below the shelf, as compared to being fully on the shelf, is minor in comparison to questions of the specific level of the shelf. The fracture energy of the 120°F (50oC) DT specimen of Fig. 53, compared to that of the 160° F (70oC) or higher temperatures, illustrates this point, ft should be observed that the transition to a condition of full fibrous fracture in propagation is attained before the last signs of ductile cleavage fracture are eliminated at the original crack tip.
One of the most important aspects of fracture processes for ductile metals is that the original constraint of sharp crack tips is "sacrificed" immediately in the development of the first extension of fracture. Lack of consideration of this factor, plus the popular misconception that cleavage appearance always indicates brittleness, would suggest that the start of the fracture for the 5/8-in. DT specimens tested at 120eF (50oC) is of brittle type. Actually, the start was highly ductile, so much so that it destroyed the crack tip condition and substituted a grossly blunted ductile tear as the leading edge of the fracture. This observation is significant to comparisons between tests which focus on definitions of K conditions 'while the crack acts* and those which focus on propagation aspects "after the crack has acted." It should be appreciated that COD measurements which con- fine attention to the very first, almost microscopic, signs of tear extension (while the sharp crack tip is still exercising its full constraint capability) may have little meaning to plastic processes of fracture extension. The fracture processes which follow determine the nature of resistance to ductile fracture of structures. The energy reading of the DT test specimen near and on the shelf is derived almost totally by the propagation aspects which have direct meaning to the propagation features in structures. The width of the standard 5/8- and 1-in. specimens provides for the measurement of fracture propagation energy at temperatures of ductile fracture.
If the propagation aspects are of the unstable fracture type, then the starting condi- tion (initiation) controls the performance of the structure. The starting condition is the primary safety barrier which exists at temperatures below the FTE midpoint of the DT test energy curve. The increased energy reading of the DT specimen in the NDT to FTE range largely reflects the increased difficulty (larger plastic zones) associated with the process of initiation. As such, it should be expected to correlate with COD and dynamic Kfc (KH) parameters of Klc tests which relate strictly to the initiation phase. The cor- relation between dynamic DT tests and static Klc values is derived from the fact that KIc and KId parameters are related to each other, since the temperature-induced increase in microfracture ductility exerts its influence over the full span of K loading rates. This fact may be noted in Fig. 56 which shows a common rise of the Klc and K^ curves through the NDT temperature region. As expected, the Klc curve attains saturation at lower temperatures than the KId curve. It should be noted that for some steels the Klc saturation may occur at temperatures below the NDT. For such steels the noted relationship of the KIc curve with respect to the NDT may be considered as a conservative upper bound limit.
The Klc/(7yl ratio at the NDT temperature is noted (Fig. 56) to be in the order of 1.3. The K^/jyj ratio has been calculated by various methods to be in the order of 0.5. The dynamic ratio value represents a very low level of plane strain fracture toughness. The important aspect of these relationships is the sharp increase in plane strain fracture toughness (static and dynamic) which is developed at temperatures immediately above the NDT. In effect, the limits of static and dynamic plane strain fracture toughness are

—■IIMIWIIIIIIiWIill II ITV>T»'BMIIII.» mufliut-i.
NRL REPORT 6957 65
reached in the toe region of the thick-section DT test transition range. The DT transi- tion from the temperature midpoint to shelf involves plastic fracture, I.e., plane stress, as noted in Fig. 56.
The results of these studies clearly documented that plane strain levels of fracture toughness are limited to the lower half of the DT test transition for any thickness of interest. A conservative index of the dynamic plane strain temperature limit for dynamic fracture of thin sections is indicated by the FTE (midpoint) of the 5/8-In. DT test energy transition. For very thick sections the dynamic plane strain limit is Indicated to be in the order of 60 to 80°F (33 to 45°C) higher temperature. Thus, the temperature which relates to the dynamic plane strain limit of a steel can be deduced simply by conducting 5/8-ln. DT tests and then adding this temperature increment to the indicated midpoint (FTE) temperature. This estimate should be sufficiently accurate for most engineering considerations.
Direct engineering utilization of fracture mechanics in the transition temperature range is difficult for the following reasons:
1. Below the NDT temperature, dynamic plane strain fracture toughness is very low. The critical flaw sizes at points of geometry transitions which Involve yield level stresses are too small (0.1 to 0.01 in.) to be detected by inspection. While small size KId test specimens may be used, there is little practical gain for this expensive test procedure.
2. KIc and KId specimens of huge size are required to plot the full temperature course of the static and dynamic plane strain transitions. The costs of such tests are very high and not acceptable for most routine engineering characterization purposes. The small specimens will track the Klc and KId transition only to NDT or lower temperatures.
In view of these considerations it is indicated that fracture mechanics principles are best utilized by indirect methods. These include correlations to simple engineering tests, such as the DWT and the DT test which index NDT to FTE temperature range and thereby indicate the limiting temperature range for the sharp increase (transition) in Kid parameters. The sharp increase In KIc must then evolve at lower temperatures which are Indexable by a At reference to the NDT. By plotting the characteristic sharp increase of the Klc and Kid curves at the proper temperature scale location, critical flaw size calculations may then be made for specific temperatures.
EXPANDED VERSION OF FAD
The information developed in the constraint effects studies indicates that the limiting transition temperature range (LTTR) Is expanded significantly by an Increase in mechanical constraint. The temperature span between the NDT and the FTE is expanded in the order of 60 to 80oF (33 to 450C) by increases in section size from 1- to 2-in. to 6- to 12-in. thick- ness. Full shelf energy ductility (FTP) is estimated to be attained in the order of 60 to 80°F (33 to 450C) above the FTE temperature of these thick sections. Because of the limited statistical data and the recognition of metallurgical variations within a given plate, it is not feasible to generalize the relationships to a finer degree.
This information, plus the relationships of KIc and KId temperature dependence of Fig. 56, provided the basis for evolving an expanded version of the FAD. The expanded version is presented in Fig. 57. The major points to be noted are:
1. There is no effect of section size for the small flaw curve of the FAD. The instability conditions for small flaws are controlled by the flaw size and not the section

66 W.S. PELLINI
ao o ■
« «
n v _ 4) tg „HO
2'«'I •§
tu ß £
«; ^ ß
.2 ' 'S v(rS)
o iD m OB"
t3 S »> ? O > H) X 4) -0
. h a O
0) rt ^ O > »< o; +* i
«a S "^ •« ' 0 c -2 -MV di u ** 'S -^
^ rt S 'S D o ? G
U -H rt Hl ö a "^ JS •H " g -• O « C ** ^ "" «•.
Q m C «
2 §^ g f_ *j >* *>
^ O B "
• S..?2 •H 4) 4) .S » »4 'O ><
>
m 0} 0)
m T) 4)
o
•o v •*J o v
SS3U1S

NRL REPORT 6957 67
size. For example, a small flaw of a few tenths of an inch does not recognize that It Is located in a 1-in. or 12-in. thick section - both are semi-infinite with respect to the flaw size.
2. The instabilities of very large flaws are influenced by section size because increasing size provides additional constraint for the large flaws. Thus, there is a moderate shift of the large flaw size transition curves to higher temperatures, as indi- cated by the expanded FAD.
3. The rise of the CAT carves for small and thick sections starts commonly at the NDT temperature, however, the rate of rise is more gradual for the thick sections. This is a consequence of the shift: of the FTE to a higher relative temperature.
The degree of shift of the flaw size curves to higher temperatures may be noted by considering a fixed level of stress, say 0.5 vy(, and then comparing the At tempera- ture at which the flaw curves for specific sizes Intersect the specified level of stress. It will be apparent that all shifts are less than the shift in the CAT for the specified level of stress, except for the very large flaws.
If uncertainties of stress levels, temperature, etc. are considered it will be evident that practical adjustments of the FAD in excess of 30oF (170C), due to section size, are required only for special situations. These involve very large flaws located in very thick sections which are loaded to relatively high levels of stress, i.e., huge structures, very large defects, and high stress levels. Such conditions could conceptually be attained for thick-walled (12-in.) pressure vessels featuring nozzles (2- to 3-ft section thickness) which develop fatigue cracks exceeding 1-ft dimensions. Since the level of stress may be considered to be of yield magnitude at such positions, an increase in the order of 60 to 80° F (33 to 45"C) in the limiting temperature (compared to thin sections) would be indicated for this exceptional case.
THE STRENGTH TRANSITION
The strength transition is defined as the general effect of increased strength which results in decreasing the shelf level of high strength steels. The term signifies a shelf transition from high to low values due to increased strength. The strength range over which the shelf transition is evolved is related to the metallurgical quality of the steel, as will be described. There is a parallel to the temperature-induced transition in that both transitions in mechanical characteristics are controlled by metallurgical factors of microscale origin.
. Increasing the yield strengths of steels to above 80 ksi (60 kg/mm2) generally re-
quires the addition of alloy elements (Ni, Cr, Mo, V, etc.) plus the use of quenching and tempering (Q&T) or other special heat treatments. These heat treatments result in fine dispersions of metallurgical phases (such as carbides) which are essential for raising the strength level above that of the as-rolled or normalized C-Mn mild steels. The fine structures also have important effects on the transition temperature range, involving potential displacements to low temperatures for optimum combinations of alloys and heat treatment. Physical metallurgy has been evolved to a high degree of scientific sophistication in procedures of microstructural optimizations for specific levels of yield strength and section size. All modern high strength alloys have been designed on these principles, and their fracture toughness characteristics are definitely not a matter of accident. Table 2 presents a highly simplified summary of the compositional aspects of typical, weldable, high strength steels with notations relating to processing factors to be discussed in tne following sections.
Figure 58 illustrates the temperature displacements of DT energy transition curves for Q&T alloy steels of 110 ksi (77 kg/mm2) yield strength, as compared to a C-Mn
a
■

68 W.S. PELLINI
Table 2 Weldable High Strength Steels
Type
Commercial Low Alloy
Yield Strength Range
(kal)
90 - 125
Section Size
Limit» (in.)
Heat Treatment & Melting Practice
Primary Alloy Elements (%) Impurity
Level {%)
C Mn Nl Cr LMo Co V B P&S
2 Q&T (Air)
0.15 0.15
1.0 1.5
1.0 0.S0 0.50 0.50
- 0.05 0.005 0.005
0.03 0.03
Ni-Cr-Mo 80- 100 6 Q&T (Air)
0.15 0.30 3.0 1.5 0.50 - - 0.02
130 - 140 6 Q&T (Air)
0.10 0.80 5.0 0.50 0.50 - 0.10 - 0.008
High Ni + Co
12-5-3 Mar age
160-200
160 - 200
6
6 +
Q&T (VARtoVIM+VAR)
Q&A (VARtoVIM+VAR)
0.20
0.02
0.30 9.0
12.0
0.80
5.0
1.0
3.0
4.0 0.10 - 0.005
0.005
T1&A1
0.10 to 0.30
18-8-4 Marage
200 - 240 6 + Q&A (VARtoVIM+VAR)
0.02 18.0 - 4.0 8.0 - 0.10 to 0.30
0.005
Codes: Q&T Quench and Temper Q&A Quench and Age
»For optimized properties.
Air Air melting under slags VAR Vacuum Arc Remelt VIM Vacuum Induction Melting +For best properties
steel of 48 ksl (34 kg/mm2) yield strength. This displacement In the transition temper- ature range Is obtained with retention of high levels of shelf fracture toughness. With increasing yield strength to levels of 200 ksl (140 kg/mm2) there occurs a progressive decrease of the shelf level (strength transition), an increase in the transition temperature range, and finally the elimination of the temperature transition features. These effects may be noted in Fig. 56 from the DT test curves relating to steels of Increasing yield strength levels. The low-level dashed curve labeled 110 ksl represents a commercial steel which has been optimized with respect to cost rather than maximum fracture tough- ness properties. Again, the properties are intentional and not accidental.
The general effects of increasing strength level on the temperature and strength transitions are presented schematically in the three-dimensional plot of Fig. 59. The vertical scale references the DT test energy. One of the horizontal axes defines the transition temperature range features, and the other the strength transition features. Two surfaces are indicated in this plot. The outer surface relates to the best (premium) quality steels that have been produced to date for the respective yield strength levels. The inner surface, which lies at generally lower DT test energy values, pertains to com- mercial products of lowest practical cost. The latter steels are produced with minimum (marginal) alloy content for the section size Involved and are melted by conventional practices which result in relatively large amounts of nonmetallic inclusions. Both aspects evolve for reasons dictated by minimization of costs.
Low-alloy contents restrict the nature of metallurgical transformations to less than optimum microstructural states and, therefore, result In higher transition temper- ature ranges as compared with the high-alloy grades of higher cost. The relatively low cleanliness of the low-cost commercial steels provides sites for void incubation which decreases the level of shelf fracture toughness. Accordingly, the strength transi- tion to the brittleness levels of plane strain fracture toughness is attained at lower yield strengths as compared to premium products of high cleanliness. These combined effects are evident by comparison of the two steels of 110 ksi yield strength level, represented by the solid and dashed curves of Fig. 58. The low position of the inner surface (Fig. 59)

■i m
NRL REPORT 6957 69
5000
-60 -40 -20 TEMPERATURE ^
Fig. 58 - Illustrating the general trends of increasing yield strength (solid curves) on the 1-in. DT test temperature transition range and on shelf level features. The effects of increasing void site density (see Fig. 47) are indicated by comparison of the two curves for the 110-ksi steels. The solid curve relates to low void-site- density metal and the dashed curve to high void-site-density metal.
\ DT ENERGY
FRACTURE MODE _
.+1To•^ ____^ ^HH FRACTURE MODE
TRANSITION OF Ww 120* y y ' «5». TRANSITION OF \ ^•SPfc, BEST STEELS DUE
» X^. ^^ TO INCREASING She- ^K^ H STRENGTH LEVEL
BEST STEELS DUE J ' ' X TO DECREASING ~$Qmff
/ **■* TEMPERATURE _ /
l K n y^S^ vt\ S" t ^\. \ / i^Ae l^^^B \
| I' -100'
A / %\ 1 / V Nj/ i/i >^~ ■
■/■jll- J.-j—±—£.4.— —~^^L. _ _
H ///
' SOOw" 120/ V^ 160 / ISO /MO y^Z« (KSI1 // / // // AT Y,EU> STRENG™
-I80'FJ s^n ^^^2 ^^^^^^P^^TOOW/MM2)
K-wzy ^^rrrTTT w*%r™ vffi rfffl^pk VßX&ßt&yft ^2* ̂ ^85
60-ro
>
Fig. 59 - Schematic illustration of three-dimensional DT test energy surface evolved by combined effects of temperature- and strength-induced transitions. The nature of changes in fracture appearancefor the 1-in. DT specimens are illustrated by the draw- ings. Transitions from ductile to brittle fracture are developed as a consequence of decreasing temperature or increasing strength level.
1—inwmfiiiiiiiiiwtatBMBiniti,»«».-»

70 W.S. PELLINI
0T ENERGY (FTLB)
f
fzE2 200 -^ 240
(200C) (KSI)
140 170 (KG/MM2)
YIELD STRENGTH
Fig. 60 - Three-dimensional DT teat energy surface for best (piemium) steels. For definition of the specific DT test shelf scale values, refer to the curve labeled 1968 Technological Limit, Fig. 62.
for the commercial steels is dictated by these factors. It is important to note that the metallurgical factors which control the temperature and strength transitions are different and independent in major degree. The metallurgist must therefore consider a wide range of options in evolving steels which are optimized with respect to temperature and shelf transitions, as well as to strength level, section size, cost, weldability, etc.
Extensive studies of the characteristics of high strength steels were conducted by NRL during the period 1962 to 1968. These studies resulted in the first specific defini- tion of the three-dimensional surface for the best steels, shown in Fig. 60. As such, it represents the limit of technological attainment with respect to both the temperature and strength transitions. The shaded region at the bottom of the surface follows the contour of the toe region of the DT test temperature transition range. Accordingly, it indexes the course of the temperature-induced plane strain regime for which fracture mechanics applies. Since the transition features were determined by the use of 1-in. DT test specimens, the plane strain limit relates to sections of small size, as indicated by the notation "plane strain-small B.* The temperature limits of plane strain for large-section size should be located at approximately 60 to 80°F (33 to 450C) higher temperatures, if the metallurgical quality is retained for the large-section size.
The nature of the DT test specimen fracture in the plane strain region is flat and devoid of shear lips. The designation of "mixed mode/B" signifies that the nature of the fracture, in the region of the three-dimensional surface which is not shaded, involves flat central regions with surface shear lips. The relative fraction of flat and slant frac- ture is a function of thickness. The shaded region at the top of the surface indicates very high levels of fracture toughness and fractures of ductile (plastic) features.
«to

vr ——wiw—■wwwwww ■■ K v«mm.wtmmjmm M
NRL REPORT 6957 71
'i*"« imPWDljMiaiiM ntsagwaiHi
Fig. 61 - Cylindrical Bulge Explosion Test series illustrating the structural sig- nificance of temperature and strength transitions from high to low positions of the three-dimensional surface of Fig. 60
The effects on fracture initiation and propagation characterifitlcs, which result from following the downward course of the surface (as the result of increasing strength or decreasing temperature), may be visualized from the Cylindrical Bulge Explosion Test series shown in Fig. 61. These tests involved plates of 1-in. thickness featuring a 2-in. long, through-thickness, brittle, electron beam weld. A sharp crack of this dimension is thus introduced into the test plate as the metal approaches nesr-yield stresses in explosion loading. The capability of the metal for accepting plastic overload in the presence of this sharp crack is the feature of interest. The series represent typical results for tests conducted in the ductile, midtransition, and t <e regions of the three- dimensional surface. An exactly similar change from ductile to brittle performance ensues as the result of decreasing temperature or increasing strength level.
These tests were used in early studies of the structural significance of the strength transition and for purposes of validating the inferences of the DT test. It was found that the fracture appearance of the explosion test fracture surfaces vere reproduced exactly by the DT test. In other words, the mechanical severity of the ])T test was equal to the extreme (ultimate) conditions of the explosion test.
A cut through the three-dimensional diagram at 70° F (20° ) should indicate the effects of increasing yield strength on the shelf level fracture ciaracterlstics. This follows because all of these steels have attained shelf levels at this reference temperature.

: '■ ifliBesww»»-^ y?^mm'^mi«^^m-t^mK-n-it^mkftvHiimf^i»^ M^moww» wvswu^
72 W.S. PELLINI
<M
prrr
'^
OTB
\
"N.
8 -
§2
A»
i«:
o
, a - i S
8 CM
• ■
> « O « C
SHSg8
■ S "> M « ö5 S a 2 ai *^ iSt 3 n ^> >H a S o
ß M " S «> ii ü ü S
ol g «
® ö S 3 So «) -H trl '-» U J M Ö *> 0
'S | .9 a e " 5 -H u 'S
o. „ M „
H >>. I 0 <0 H O i-H go 3 d 4) 0) 41
M (3 ja" ■"
_ u u ^ o 00.S '(S n U
k ''

mmmmmmtmm mmmmmmmtmmwmmmi i ■iiiiiiiwiiiwwwiat.ainwwiiiiiJiiiiiiwaiimfliiiwiwiiriH.ii.Mwr
** NRL REPORT 6957 73
V.
Figure 62 presents a summary of shelf level data points that were obtained for different steels as a function of increasing yield strength. These data points represent the shelf level fracture energy of the 1-in. DT specimen. The test orientation is uniformly in the weak direction for plates that do not feature 1:1 cross rolling. This procedure avoids placing a premium on obtaining high transverse (strong direction) fracture toughness at the expense of the other direction. Thus, it clearly indicates the basic effects of metal- lurgical features relating to void site density. For engineering purposes, the fracture test direction should always be taken in the direction of anticipated fracture propagation in the structure. This will result in relocation of the data points in the diagram, with no change in the methods of analysis to be described. There is no implication that tests should always be made in the weak direction-the choice is a matter of engineering de- cision. From a fracture analysis point of view it is equally wrong to test in the strong or weak directions if the fracture path is deduced to be in other than the test direction. It should be noted that steels of high-cleanliness quality, which are required to maximize fracture toughness at high strength levels, show very little directionality, even in the absence of 1:1 cross rolling.
The Cv shelf level scale has been added by correlation and serves to index the strength transition significance of the Cv shelf value. It is emphasized thatthe correlation between DT and Cv shelf characteristics does not imply that both tests attain shelf characteristics at the same temperature. In general, the Cv test attains shelf levels at lower temperatures than the DT test. While the DT test temperature transition features correspond exactly to those shown by the explosion test (same fracture appearance at same temperature), this is not true of the Cv test. In brief, the Cv test does not represent the true location of the temperature transition range and, as such, poses major difficulties of interpretation. The function of the KIc scale will be discussed later.
The steels available in the early phases of these studies fell under the two lower curves noted as the Technological Limit of 1962. The outer bound Technological Limit curve, noted as 1968, represents the metallurgical improvement obtained by the steel industry during this period, as highlighted by the bold arrow designation. As presented in Fig. 62 the Technological Limit Diagram is only useful in presenting a panorama of general trends in shelf level fractureVoughness. The real need was to evolve a system for indexing significant mechanical parameters to this panorama which can be translated to structural performance. The course of evolution of the desired indexing system began with recognition that the low energy values of the DT test related to brittle fracture, and the high values relate to highly ductile fracture, as illustrated by the DT test specimens in the figure. The next observation is provided by the photographs of the explosion test samples which correspond to the high and low positions in the diagram. Based on such observations the slant line drawn across the diagram serves to separate the diagram region of brittle, unstable, elastic fracture from the region of ductile fractures for steels in the order of 1-in. thickness. Clearly, only the region which lies significantly below the slant line is potentially indexable to the Klc plane strain fracture mechanics parameter. The region above the slant line involves plane stress fracture.
RATIO ANALYSIS DIAGRAM (RAD)
By 1968 the indexing of the unstable elastic fracture region of the strength transition diagram was achieved and the Ku scale was added. This accomplishment was of major importance because the diagram could now be zoned to represent regions which related to specific Klc/(ryi ratios. Figure 63 presents the final version, defined as the Ratio Analysis Diagram (RAD). It should be noted that the diagram is expanded to Include low values of KIc. The 0.5 and 1.0 ratio lines are located accurately in the expanded diagram because a large number of reasonably valid KIc data were obtained for this level of fracture toughness.
i

74 VS. PELLINI
20 40 60 80 100 120 140 160 180 (KG/MM2) T——i 1 i i i 1—r—i 1 f--1 ' ■ ■ ■ ■
^
UJ
I
120
110
100
90
80
70
60
50
40
30
20
10 5
120 160 200 YIELD STRENGTH
280 (KSI)
Fig. 63 - Ratio Analysis Diagram (RAO). The grid of KIc/<TJ1 ratio linet indexes the region of the diagram which relates to plane strain fracture.
The dashed line noted ae the infinity (m) ratio represents the most optimistic esti- mate that can be made at this time of the limit to which unstable (nonarrestable) plane strain fracture toughness can be measured by Klc tests of large section size. These measurements would relate to Klc/cy, ratio 2.0 value or higher, and thus, would require specimens of section size In excess of 10-ln. The high metallurgical ductility of steels with Cv and 1-ln. DT test shelf energy values In excess of this line Is amply demonstrated by highly ductile fracture for section sizes in the order of 3- to 4-in. thickness. There Is no basis for expectations of developing unstable (nonarrestable) plane strain fracture as the result of Increasing section size to 12-ln. thickness for such ductile metals.
The 1.5 and 2.0 ratio lines must lie in the narrow gap remaining between the <*> and the 1.0 ratio lines. There is no attempt to define the location of these lines because the significance of Klc values for ratios in excess of 1.0 is subject to question. These Involve questions of the significance otKu instabilities which are followed by rising load, as well as the procedures for plastic zone corrections of KIc values. Thick-section XJe tests will be required to better define the area of uncertainty between the 1.0 ratio level and the general location of the " ratio estimate. Accordingly, the KIc scale has proper meaning to about the general level of the 1.0 ratio line or slightly higher; it should not be used for design purposes at higher levels at the present state of knowledge. The section sizes required for improved definitions of the KIc scale are indicated by the thickness notations associated with the ratio values. In summary, these relationships Indicate that as the valid 1.0 ratio correlation to DT energy is exceeded, there is a rapid Increase in Ku/oy ratio values. This is generally similar to the rapid rise in static and dynamic ratios as the DT energy curve rises above the lower toe region for the transition temperature case.

NRL REPORT 6957 75
It should be noted that a thickness significantly less than the requirement for the ratio value would result in moving the infinity ratio line downward. For example, plates of 1-ln. thickness are plane strain limited to approximately a 0.7 ratio value. If the intrinsic fracture toughness of the metal significantly exceeds the 0.7 ratio value, it is not possible to enforce a plane strain condition on the 1-in. plate section, i.e., plane strain is unattainable (co) for this section size. Thus, the 1.0 ratio line is conservatively equivalent to the a ratio line for plates of this approximate thickness.
The RAD may be separated into three general regions. The top region, above the GO ratio line, relates to ductile fracture. The bottom region below uie 0.5 ratio line relates to low levels of plane strain fracture toughness, involving flaw sizes which are too small for reliable inspection. This can be deduced by returning to Fig. 51 and noting the flaw sizes associated with ratios below 0.5. These are generally in the order of tenths of inches for stubby flaws and decrease to hundredths of inches for long thin flaws subjected to high elastic stress levels. While fracture mechanics applies well in principle for this region, it applies poorly in practice due to the flaw detection problem. This region requires proof-test procedures for ascertaining preservice structural Integrity.
The width of the remaining "slice" of the RAD, the central region for which plane strain fracture mechanics calculations appear feasible, depends on the section vlze. For very thick sections (to over 10 in.) the applicable region available for possible plane strain- calculations is between the 0.5 and <x> ratio lines. For section sizes in the order of 1- to 3-in. thickness, this region is bounded by the 0.5 and roughly the 1.0 ratio lines. This range represents a very thin slice through the population of the steels represented by the diagram.
Factors which relate to the metallurgical quality of the steel become readily evident by metallurgical zoning of the RAD. The full span of fracture toughness definitions (plane strain to plastic fracture), provided by the DT test specimen energy scale, and the ratio lines definitions for the regions of plane strain fracture, serve as a fixed mechanical reference grid. The analytical value of this grid is exploited by superimposition over zone reference systems which partition the diagram in relation to metallurgical features.
A simple, yet highly significant, zoning of metallurgical type is developed in Fig. 64 by tracing the effects of increasing strength level on the shelf transition features of various generic classes of steels. A series of metallurgical quality corridor zones, which are related to the melting and processing practices used to produce the steels, become evident. The lowest corridor zone Involves relatively low-alloy commercial Q6T steels produced by conventional low-cost melting practices. The corridor is defined by the strength transition of these steels to the 0.5 ratio level, as the result of heat treatment to yield strength levels in the order of 130 to 150 ksl (02 to 105 kg/mm3). Optimizations of the alloy content, coupled with Improved melting and processing practices, elevate the corriuors to higher levels. The strength transition to the 0.5 ratio is shifted accordingly to higher levels of yield strengths.
Recent metallurgical investigations of high strength steels have emphasized process- ing and metal purity aspects rather than purely physical metallurgy considerations of transformations. New scientific know ledge of void growth mechanisms and of the im- portance of void-site-density factors clearly indicates that control of metal bridge ductility can only be effective within limits. As these limits are reached by optimization of mlcrostructures, it then is estteiitial to obtain further Increases in ductility by sup- pression of void initiation aspects. Void sites are provided by the presence of nonmetallic particl ^ of microscopic size featuring noncoherent phase boundaries with the metal grains, i ich separate easily compared to coherent metal grain boundaries. The extent to which ,vuch void sites can be eliminated is related to a number of factors Including melting md deoxidation practices as well as the P and S impurity contents.

76 W.S. PELLINI
140 160 ieO(KG/MM2)
100 120 MO 160 180 200 220 240 260 280 (KSI) YIELD STRENGTH
Flg. 64 - Metallurgical zoning of the RAO which define« the general effect« of melting and processing fcctore on the strength transition. The three corridors of strength transition relate to metallurgical quality (void site density) which controls micro- fracture processes and, thereby, the macroscopic fracture toughness of the metal. The location of generic alloy steel types are indicated by the notations.
Figure 65 Illustrates the effects of specific melting practices which relate directly to void-site-density. Air melting under conventional slags, followed by normal deoKidation practices, results in steels which have numerous nonmetallic particles, as is easily seen with low-power optical microscopes. The carbon deoxidized, vacuum induction - vacuum arc remelted (VIM-VAR) metal requires high-magnifica- tion electron microscope examination in order to locate the few nonmetallic particles that are present. Clearly, anew era in steel making has evol/ed which involves producing ultrahlgh-purity steels at large production scale. Figure 65 also notes a relocation of the Technological Limit curve of the RAD to the 1969 position which has resulted from these metal processing improvements by the steel industry.
The RAD corridor relationships provide a vastly improved definition of metallurgi- cal factors. Systematization of vast amount of data becomes feasible in easily understood form. The required directions for metal processing improvements are predictable from these corridor relationships. Moreover, it becomes apparent that the increased costs of high-quality processing are economically defensible, as well as technologically essential, at high strength levels. Analyses which combine economic, metallurgical, and fracture considerations over the full span of strength levels are of major interest to both users and producers of the steels.

•Mm ««int»i, mm inmmtvwmmm ■
NRL REPORT 6957 77
9000
8000 -
7000 -
6000-
S9000-
>- o U
4000-
u 3000 -
2000 -
1000 -
500 -
ISO 200 220 YIELD STRENGTH
300 (KSI)
Fig. 65 - Metallurgical zoning of the RAO which defines the effects of specific melting practices. These include air melting under slags (Air), vacuum induction melting (VIM) and vacuum arc remelting (VAR); a combination of these is indicated by the VIM-VAR notation. The extension of the Technological Limit curve to the 1969 position results from the use of advanced VIM-VAR melting practices at large production scale.
FRACTURE MECHANICS RELATIONSHIPS TO THE STRENGTH TRANSITION
The foregoing discussion of the RAD has emphasized that a choice can be made be- tween steels of brittle or ductile shelf characteristics over a wide range of yield strength levels. The integration of metallurgical and mechanical parameters provided by the RAD serves to define conditions which require the direct use of plane strain fracture mechanics in design, as well as.those which preclude its use. These definitions are most important to engineering applications of fracture-safe design.
The following major points should be noted in these respects:
1. The combination of metallurgical quality and yield strength features that pro- vide for practical use of plane strain fracture mechanics is relatively restricted. A modest decrease in yield strength, or an economically feasible increase in metallurgical quality, may elevate the metal from plane strain fracture levels and thereby ensure that plane stress (plastic) fracture controls.
■.fij«^*»i»^j1u««4a(tiaö«i»ÄW«w^feT;i.T«fS

78 W.S. PELLINI
2. The very low levels of plane strain fracture toughness below the 0.5 ratio severely restrict the practical engineering use of metals because of inspection lim- itations. The only practical inspection procedure for this level of plane strain frac- ture toughness is the proof test method which defines whether or not critical flaws existed by failure of the structure. However, no warning is provided that flaws of near-critical size exist. A slight increase in such flaw size by fatigue or stress corrosion may then occur in service, leading to unexpected proof of attainment of the critical flaw sizes.
3. If the structures involve plate thickness and feature relatively simple geo- metric configurations, flaw size-stress calculations may be feasible for metals with plane strain properties in the range of approximately 0.8 to 2.0 ratios. The flaw sizes involved will generally be within limits which permit reasonably reliable, nondestructive Inspection. The engineering reliability of this approach increases markedly with an Increase in the ratio value.
4. For most engineering structures of complex design, fracture safety is best assured by choice of metals featuring plane stress fracture toughness. This practice is suggested by the fact that such structures will feature regions of geometric transi- tion involving plastic stresses.
Fracture-safe design which is predicated on the inherent plane stress fracture proper- ties for the metal precludes the application of plane strain fracture mechanics. Thus the design field should not insist on the characterization of plane stress metals by pseudo Kic values of the lower bound" type. Because of the unknowing pressure for develop- ing KIc values, a surprisingly large number of Klc tests are conducted for purposes of defining the "lower bound' KIc values. These values have no meaning except that a measurement of plane strain fracture toughness could not be accomplished, and there- fore the KIc value, if attainable, must lie above the plane strain measurement capacity of the specimen. This practice is introducing confusion in the technical literature, particularly as these values are then used in design or in designating steel quality with- out reference to being 'lower bound.*
In conclusion, the use of plane strain fracture mechanics principles for fracture-safe design in relation to the strength transition is required only for a relatively narrow range of steels, in comparison to the total population evolved by the metallurgist. Except for the strength range in excess of 190 ksi {135 kg/mm2) yield strength, the design engineer has the choice of fracture-safe design based on using inherently ductile metals.
WELDS AND WELDABILITY FACTORS
The fracture toughness characteristics of weld and heat affected zone (HAZ) regions may be of major importance to structural safety, depending on the design features and the location of the weld joints. These regions may provide fracture paths of sufficient length to result in failure of structures. Weld properties may be characterized by con- ducting DWT and DT tests, followed by the use of FAD and RAD interpretive procedures in the same fashion as for the base metal. Standardized test procedures for routine laboratory characterizations of HAZ are not available.
The early observation that ship failures never followed weld paths was explained by their generally lower transition temperature range in comparison to the steel plates. The Cv 15 ft-lb transition temperatures and the NDT temperatures of the welds were found to be below the temperatures of ship fractures. In general, the development of weld metals for low strength steels with equal or better transition temperatures than plates or forgings is not a difficult metallurgical task.

f ■VWf •*■<•■*■■*'.:■
NRL REPORT 69^7 79
WELDABILITY TESTS
HAZ WELD
ANGLE OF BEND TO FRACTURE
UNWELDED
GOOD BAD
WELDED
CRITERION ANGLE
TEMPERATURE
Fig. 66 - Features of weldability testa for assessing the heat affected zone (HAZ) characteristics for steels of low and intermediate strength levels
While the HAZ of mild steels may be moderately embrittled compared to the base metal, the geometry of the HAZ exerts a strong protective influence. Welds are normally of V or W geometry and the HAZ is slanted 45 to 60° with respect to the usual stress vector directions which parallel the base metal. The slant feature results in difficult propagation of brittle fractures, which tend to have normal incidence (90°) to the stress direction. Fractures which run in the HAZ of mild steels are a rarity for the combined reasons of protective geometry and moderate embrittlement. In contrast, even a moder- ately embrittled HAZ may be of serious consequence with respect '0 small weld defects which are oriented transversely to the weld and project into the HAZ. Fracture instabili- ties may then be initiated in the HAZ, with consequent dynamic translation to the unaf- fected base metal. The presence of weld residual stresses markedly accentuates the tendencies for such instabilities, as described previously.
The importance of HAZ characteristics in relation to promoting plate fracture led to the early development of •weldability tests" for indexing the degree of HAZ embrittlement. The term weldability test evolves from the fact that the tests are conducted for purposes of investigating the effects of weld deposition procedures and to assess the response of the steels to specific weld heating and cooling cycles. These tests generally feature bead-on- plate weld deposits of somewhat similar appearance to the weld bead of the DWT. Figure 66 illustrates the general features of the Lehigh and Kinzel type of weldability tests. A notch is cut across the weld bead and plate surface at the center location of the specimen. The tests are conducted by slow bending using a roller-type anvil. The degree of bend angle at fracture is plotted as a function of temperature and results in a transition-type curve. The relative embrittlement of the HAZ is defined in terms of the transition tem- perature, indicated by a low-bend-angle value as noted in Fig. 66. The series represents typical families of transition curves which result from varying weld deposition parameters.
Since the transition curves are developed for slow loading, the low-bend-angle-index temperature will lie below the NDT temperature. As the degree of embrittlement of the HAZ is increased, the transition temperature index point will move to higher temperatures

80 W.S. PELLINI
In the region of the NDT temperature. At this high level of HAZ embrlttlement the HAZ is performing the same function as the brittle weld of the DWT, i.e., it introduces a dy- namic instability which is propagated through the base metal. It should be noted that the notch is cut so as to eliminate the weld and place the notch tip in the HAZ.
The low and intermediate strength steels, for which these weldability tests are appropriate, feature a wide spectrum of response to welding deposition variables. A very large body of weldability data of this type has been evolved. Ho vever, the data can only be considered in qualitative terms because procedures for analytical interpretation to structural performance have not been evolved. The primary value of the tests has been in documenting welding procedures and steels which minimize HAZ embrlttlement and show a close approach to plate characteristics. The comparisons to plate character- istics are based on similar tests conducted in the absence of a weld and HAZ. In this respect valuable metallurgical Information has been obtained as to the effects of com- positional factors which minimize embrlttlement.
Retention of fracture toughness characteristics in welds and HAZ which match plate properties becomes metallurgically more difficult in relation to the strength transition. The general problem is that the high strength steels derive their characteristics from carefully selected heat treatments, including the austenitizing temperature, time of austenitization, cooling rate, tempering temperature, and tempering time. For optimum properties these aspects are carefully controlled in the mill heat treatment. To attain reasonably equivalent properties for weld metals is more difficult because the heating and cooling cycles are nonstandard and their control must be kept within reasonable limits by the manipulation of heat inputs, melting rates, number and size of beads, etc. For other reasons, which relate to cracking tendencies in cooling of the weld, it may be necessary to adjust the weld metal composition to different alloy contents than for the plate; in this respect consideration must be given to base metal additions to the weld pool which affects the composition of the final weld.
With increasing strength levels the weld metal becomes the most difficult aspect of the problem of developing weldable steels. For steels in the yield strength range of 130 to 180 ksi (90 to 125 kg/mm2) the research effort expended for the weld metal development ordinarily exceeds that for the base material by several fold. Nevertheless, remarkable advances have been made in interrelating these complex factors. An example is provided by the weld metal zoning of the RAD presented in Fig. 67. This presentation highlights the strong effects of metal quality factors as related to the welding procedure. For attain- ment of high corridor features it is essential to use weld wire of high metallurgical quality (equal to the low-void-site density of high corridor base metals) and then to protect the weld metal pool by the use of inert gas shielding. The Gas Tungsten Arc (GTA) method is superior to the Gas Metal Arc (GMA) method in these respects. Because of poor pro- tection to atmospheric gases, Stick Metal Arc (SMA) welds are limited to the low corridor Irrespective of improvements in wire quality. Adjusting weld alloy compositions to con- trol microstructures is not sufficient - the metal quality aspects related to void coales- cence processes must be controlled also if the highest corridor relationships are to be utilized in practice.
The HAZ of high strength metals also poses difficult metallurgical problems because of the off-standard rn^ure of the heat treatments developed in the welding cycles. In this case there is no recourse to changing compositions as for the weld metal. For the high- alloy base materials which follow high RAD corridors, the HAZ problem is minimized and excellent properties are obtained with latitude in the control of welding parameters. The high-alloy contents promote the development of optimum metallurgical structures over fairly wide ranges of weld heat treatment variables, as compared to the low-alloy steels.
WntKH^-K«''«'«!
NRL REPORT 6957 81
60
1201-
- 100 m
40
tn 20
10 5
a,
8000
7000
6000
5000
80 — Ä 4000 >-
12 60h u 3000 z Ul
— u. 2000 -i i
_ « 1000
fe 500
80 'T- 100 120 140
_ PLATE 1969 TECHNOlfy,
160 1—
180 200 KG/MM1 2
WELD METAL TECHNOLOGICAL LIMITS
J L i. ± 80 100 420 140 160 180 200 220 240 260 280 300 KSI
YIELD STRENGTH
Fig. 67 - Zoning of the RAD which defines weld metal factors of first order im- portance to strength transition features. The strength transition corridors relate to weld metal deposited by stick metal arc (SMA), inert gas shielded metal arc (GMA), and inert gas shielded tungsten arc (GTA). The boldarrows indicate the strength level of transition to the 0.5 ratio value.
For the low-alloy commercial steels which follow the low-corridor relationships, the HAZ problem becomes more difficult to resolve. This results from the marginal alloy contents which are barely adequate for developing desirable microstructures under con- trolled mill heat treatment conditions. Thus, weld HAZ for such metals may be seriously degraded by off-optimum welding procedures. The shelf characteristics for the HAZ of steels featuring only 90 to 120 ksi yield strength (63 to 85 kg/mm2) may then drop to the very low levels described previously for the ultrahigh strength steels. The shelf level differential between the base metal and the HAZ for such cases is so large (plane stress to plane strain) that preferential fracture in the HAZ becomes the expected fracture modes in structures. An example of a HAZ failure of this type is provided by the pres- sure vessel shown in Fig. 68. This failure represents a low-shelf plane strain fracture which followed the HAZ at elastic stress level loading. Such fractures are not affected significantly by wide variations in service temperature because they are related to the shelf transition and do not involve transition temperature considerations.
Unfortunately, there presently do not exist reliable laboratory fracture test methods of small size for characterization of HAZ properties for high strength steels. Since the propagation of HAZ fractures is strongly influenced by weld geometry, relatively large plates containing welds of specified geometries must be tested. The NRL research studies of these aspects have evolved cylindrical explosion bulge test procedures featuring cracks located in the HAZ region. These tests are conducted after the base metal and weld characteristics are resolved to be adequate by means of the DT test. The welding pro- cedures are then qualified with respect to the HAZ by observation that the explosion test performance is equal to that of the center or top bulges shown in Fig. 61. This level

■,
82 W.S. PELLINI
Fig. 68 - Example of structural failure which followed a HAZ path. The HAZ featured low-shelf fracture toughness in comparison to the base steel. Note that the fracture ia arrested on entering the base steel.
of performance indicates that the HAZ fracture characteristics match those of the plate. Once qualified as acceptable, these procedures are carefully reproduced in the welding of the structure.
It is apparent that a crucial and unfulfilled need exists for the development of simple yet analytically Interpretable laboratory tests for the HAZ. There is also a major need for studies of metallurgical and mechanical weld metal factors, particularly in view of the evolution of novel welding methods such as the narrow gap and electron beam types. The novel geometries of these welds exert a strong protective Influence, particularly for conditions of intermediate levels of fracture toughness. When the plastic zone slzo or the enclave size of the weld metal attains proportions equal to the weld width dimensions, the properties of the base metal are brought into play, which results in an effective ductility enhancement.
It Is concluded that some of the continuing studies of fracture processes should be directed to Issues of welds and HAZ. This area has been largely neglected and urgently requires renewed attention.
ISSUES AND PROJECTIONS
The engineer-user of fracture research Information has faced difficult problems in the study and Interpretation of the literature on the subject. The general appearance of this literature has often been one of divisive and apparently contradictory points of views. Actually, progress has been orderly, despite tendencies for overprolonged attention to the most interesting aspects of the time. For example, a concentration to fracture mechanics studies of relatively brittle metal has been evident during the past ten years. The fracture research field will derive great benefits from this period which resulted in firmly establishing the importance of constraint and stress intensity factors. These aspects will affect all future studies as renewed attention is given to problems of more

»w» *am&..smirzimirrSMwmwmw*ivmiimtB
NRL REPORT 6957 83
ductile metals. The engineer should recognize that the pe'io'iic concentration of research interests represents timely attention to newly emerging issue s, and not the discard of past knowledge.
The new issues of the early 1960*8, which required resenrch attention to the plane strain state, involved the applications of ultrahigh strength n etals to aerospace struc- tures and supersonic aircraft. Tests which emphasized the characterization of transition from brittle to ductile levels of fracture were not adequate i >T these metals, which are inherently brittle. Thus, the emphasis on KIc test developnent was justified. Since these metals are not sensitive to loading rate there was no r eed to investigate dynamic effects. Unfortunately, the success attained in this approach for the rate-insensitive, brittle state led to unwarranted attempts to generalize this approach to include all metals. These extensions were in basic conflict with both fracture mechanics and metallurgical microfracture theories. Thus, it was unavoidable that a nev period of balanced attention to other emerging issues should evolve. This new period m ay tofi traced to the re-establishment of four fundamental principles:
1. The unstable plane strain state has finite limits and is not extendable indefinitely by an increase in mechanical constraint conditions resulting from an increase in section size.
2. Microfracture ductility is a dominant parameter wHch determines the degree of mechanical constraint that is tolerated by the metal.
3. For rate-sensitive metals the limiting mechanical constraint condition is en- forced by dynamic loading, and therefore the measurement of dynamic fracture toughness parameters is mandatory.
4. The mechanics of plastic fracture are inherently different from those of brittle fracture - instability effects are a case in point. Ductile fractures result in increased resistance to crack extension with movement away from the original crack tip.
The re-establishment of these principles evolved as tae result of attempts to extend Klc plane strain concepts to the transition temperature range and to the new metals of intermediate and high strength levels. These extensions were test cases which first appeared to be headon conflicts between metallurgical microfracture theory and fracture mechanics constraint theory. In fact, the conflicts were * aerely a matter of interpreta- tions - both aspects are of crucial iimjortance and require integrated considerations. However, it is fair to say that the new era marks a rett ru of metallurgical considerations in fracture studies. The overemphasis on mechanical aspects arising from purely con- tinum mechanics theory was an unhealthy state of affairs
The new research trends include a variety of interet ts rather than singular concen- tration to a specific mechanical state. The new directio is involve emphasis on:
i. studies of metallurgical aspects of fracture, pan icularly as related to micro- mechanical considerations which can be investigated wit i the new high-resolution microscopy provided by the electron microscope and ace essory equipment such as microprobe, micro x-ray, etc.;
2. investigations of dynamic plane strain fracture > elating to KId and & (stress intensity rate) factors for the strain rate-sensitive met Is;
3. understanding of fracture processes for the case of *3emiductile" plastic frac- ture for metals of low-shelf characteristics. In the no; nenclature of fracture mechanics this is the Kc low-ductility plane stress state which lie i between the brittle plane strain and the highly ductile plane stress states;

84 V.S. PELLINI
4. evolution of improved tests with capabilities for characterizing the^U^^ctrum of plane stress states; and
5. evolution of analytical procedures which apply to the plane strei
These new Erections will necessarily focus attention to test methods which provide measurement capabilities over the full range of fracture toughness, from plane strain to high-ductility plane stress. The separation of tiSsts to plane strain and plane stress types may be Justified for research purposes. However, practical engineering tests must be capable of defining transitions from brittle to ductile fracture properties without losing definition. The new tests of this type Include the DT test and the Crack Opening Displacement (COD) tests.
The DT test is presently in ad/imced stag/s of development for generalized use across the full spectrum of metals. The primarily for the transition temperature rt involving slow loading rates. The Battelle represents a specialized version cf the DT tion temperature range determinations rel mediate strength steels. The BDV/TT is DT and BDWTT utilize the same tast equi] in a large number of engineering test 1
est (to be described) has been investigated determination of low strength steels, of Drop Weight Tear Test (BDWTT)
bst which Is applicable primarily for transi- ting to the dynamic fracture of low and inter-
in advanced stages of development. The ent which is being Installed Internationally
stories. These test machines involve the original equipment shown In Fig. 41 and type, but with improved features for higt]
The standardization of i;lc tc sts hs fracture toughness measurement of mc
iso industrially designed models of the same fproduction rate testing of routine nature.
been accomplished and provides for plane strain Is which are clearly of th<s type.
The status of KId tests is best re; dynamic plane strain Instability cequ restricts the test to research laLor be analyzed to properly deduce the used to attain high rates of K. Pel expected that the new studies shoul procedures In K I(j testing.
esented by the fact that the measurement of a 'es specialized Instrumentation which presently ries. The dynamic response of the specimen must
ing conditions at instability, if Impact loading Is ly few Kid data are available; howe/tr, It Is
irovlde data required for evolving standLMlzed
The Crack Opening Displace Investigated extensively In Eng] test, except that It Is aimed at t elastic. The test Is conducted )yj the static (nondynamic) transltioi nltlons of temperature transltlun those which would be defined b/ to whether this is a realistic proj loading or whether It Is unreal is are controlled by dynamic Insl should be provided with Inform: event, the research directions o: tlons now taken for fracture me Kjd properties.
it (COD) test Is a relatively recent type which Is being As the term COD implies, It Is a derivative of the Klc
leasurement of plastic levels of COD rather than low bending and, therefore. Is considered to define
from brittle to plastic fracture. This results In defl- rints which are 60 to 80oF (33 to 450C) lower than lamic load fracture tests. There is much debate as
[sdure for structures which are subjected to slow because the limiting conditions of service fracture
[Itles^ It would appear that, at a minimum, the engineer ~ oth the static and dynamic transitions. In any
> test development are In opposition to the dlrec- tests which are to emphasize research In dynamic
PODi CCS
The analytical potentialities of the COD test depend on the evolution of elastic-plastic or plastic (plane stress) fraccure mechanics theory. For elastic fracture instabilities the COD test becomes simpl) a Klc test. Thus, plastic COD tests represent Kc tests and suffer the same problem u of analytical limitations. The evolution of plane stress fracture mechanics is the subject of active research. However, it is generally recognized that near-term solutions are not to be expected.
mmmmmmmi
NRL REPORT 6957 85
The Cy test suffers from requirements for calibration against other more definitive tests. These calibrations have been evolved with various degrees of success for steels, but do not appear to be feasible for other metals. The calibrations are unduly compli- cated for general engineering utilization and if pursued will lead to unacceptable con- fusion in specifications. The mechanical limitations of the Cy test are well appreciated. In brief, the test specimen is inadequate with respect to width, depth, and notch acuity, i.e., its mechanical constraint capacity is of low order. A great deal of effort has been expended on modifications involving introducing fatigue cracks, adjusting correlation criteria to other more significant tests, and in searching for nonstandard ways of defining its fracture index value. These activities have one common motivating aim, namely, the preservation of the test because it has been standardized internationally. This reason has practical substance in that the road to standardization, acceptance, widespread in- stallation of test machines, etc. is a long arduous process - once attained it is difficult to modify. However, enough has been learned as to what can be accomplished by modifi- cations of the Cv test to recognize that its basic mechanical llui'tations cannot be elimi- nated. It has its place for limited classes of steels, but it should not be pursued for gen- eral engineering use across a wide variety pf steels and other metals.
The Issues which relate to directions of fracture research and to the evolution of definitive tests may be analyzed in purely technical terms. The issues which relate to processes for the transfer of fracture research information to the engineer-user are much more complex because they involve philosophical points of view. Unfortunately, these issues affect both the nature of fracture studies and the form of literature presen- tation. One extreme point of view is that the evolution of fracture-safe design procedures should be based on expecting complete knowledge of the subject by the engineer (total transfer). The other extreme point of view is based on expecting only that "single-point* reference criteria be developed which separate acceptable from nonacceptable material (minimal transfer).
The single-point reference approach, which separates acceptable from the non- acceptable, is insf-nlssible because such neat separation clearly does not exist. Fracture toughness index ; i uusters such as the C v 15 ft-lb, NDT, specific CAT, specific lateral expansion of the „» test, specific crack opening displacement (COD), specific Kfc, etc. cannot be used for general single-point reference - none suffice per se. On the other hand, the expectation of reasonably complete knowledge can only be conceptual because it has no definable limits.
There is a middle ground which is both realistic and practical. This involves the use of significant fracture toughness index parameters, in conjunction with graphical interpretative diagram systems. This procedure Is exemplified by the FAD-RAD approach to the problem of information transfer. This approach provides for a separation of func- tions: the fracture specialist selects the significant fracture toughness index criteria, Jjut the engineer retains the implicit prerogatives of selecting design criteria. In the absence of this prerogative he can never practice fracture-safe design and falls to the mercy of a single-point reference, which illusorily separates good from bad. The background knowl- edge required of the engineer for the middleground approach reduces to practical attain- ment levels which primarily involve understanding the structural significance of design criteria.
The importance of coupling fracture parameters and design criteria in the evolution of fracture-safe design procedures cannot be overemphasized. The coupling process ensures that fracture research is directed to relevant issues. In particular, it directs attentions to the new issues as engineering design problems emerge from consideration of new structures, new metals, and new aspects of failure experience. The transition- temperature range problem is an old issue which has been resolved to a high degree of engineering sophistication. The ultrahigh strength, brittle metal problem is a relatively new issue which is similarly resolved. The intermediate-shelf level, semiplastic state represents a very recent issue which remains largely unresolved.
-

86 W.S. PELLINI
The evolution of analytical procedures which apply to conditions of plastic fracture is complicated by geometrical effects. By basic definition, the plane stress state is geometry dependent, as contrasted to the plane strain case which, when attained, is geometry independent. The effects of section size on the specific resistance to the propagation of plastic fracture depends on the size of the plastic enclave which is de- veloped in advance of the tear. As explained in relation to Fig. 47, the plastic enclave (dimple) size is a function of metallurgical ductility and section size. For metals of high metallurgical ductility (high-shelf features), an increase in section size results in the development of huge plastic enclaves. Metals of intermediate- to low-shelf features may gravitate to small plastic enclaves with an increase in section size. A dividing line must exist between metallurgical ductility levels that would gravitate (with increased section size) towards decreased plastic enclave size and Uiose that would gravitate towards increased plastic enclave size.
Fracture resistance is always a matter of energy absorption. The preservation of plastic enclaves which are relatively large in relation to thickness is crucial to the re- tention of energy absorption features which ensure that plastic overload stresses are required for rupture of the structure. High energy absorption cannot be obtained for relatively small plastic enclaves. Definitions of the specific energy absorption provided by the intermediate to large plastic enclave sizes requires the use of "energy reading" tests. Reasonable knowledge exists for predicting the retention or loss of relatively large plastic enclave features with increased section size for the high-shelf and the relatively-low-shelf steels, b the case of high-shelf metals, reliance can be placed on the fact that engineering structures of plate thickness do not fail conventionally with evidence of ductile fracture. Since large plastic enclave features are retained for thick ■sections, plastic performance can be assumed as for the 1- to 2-ln. plate thickness experience. For the case of the low-shelf metals, the attainment of the plane strain state provides for use of the analytical processes of plane strain fracture mechanics. The case of intermediate to low levels of shelf ductility requires specialized research attention. The evolution of elastic-plastic analytical treatments (plane stress fracture mechanics) for thick sections should be expected to center on the case of the intermediate- to low- shelf metals because of the relatively low Sc plastic work energy that it may represent.
The foregoing discussions emphasize questions of plate thickness and increases in section size. We shall now consider the effects of decreasing section size. The problems of sheet thickness materials are highly specialized and should be understood in principle, at least to avoid confusion with the thick section case. With the decrease in thickness from plate to thin sheet there is a drastic decrease in the absolute size of the plastic enclave. It then becomes of small (localized) dimensions even for a metal of relatively high metallurgical ductility (low-void-site density). For metals of low metallurgical ductility (coupled with high-void-site density), the decrease can attain minute enclave dimensions which provide very little energy absorption capacity. While the fracture is not of plane strain type (percent lateral contraction is large), it represents a low <*c plastic work energy level of plane stress fracture toughness which may be expected to provide for fracture extension at elastic stresses. In brief, the metallurgical ductility (void-site-density) requirements for thin sheet structures of intermediate 'ind high strength steels are more restrictive than for plate thickness. Fracture research in the thin sheet area has been active in the aircraft and aerospace industries for the high strength to density ratio metals which feature relatively low plastic work energy.
With trends toward the use of intermediate strength steels in tubular form (such as pipe lines), there is need to Investigate what may be called the "thick sheet or thin plate* regime of say 0.20- to 0.5-in. thickness. Because of economic constraints, these steels tend to be of high-void site density and, therefore, of low intrinsic metallurgical ductility type. With increasing strength they become increasingly affected by the strength transition, which is accentuated by the small section sizes involved. Extensive studies of this type
~1 NRL REPORT 6957 87
are underway baaed on the use of the BDWTT, DT, aubslze Cv testa, and "Kc " (4.) tests correlated empirically to full-scale structural failure tests.
These questions, which require the development of an analytical understanding of plastic fracture processes, are only beginning to be investigated. Much work of a semi- empirical nature (vessel burst experiments) is to be expected before reliable analytical treatment can be evolved - the mathematical techniques are lacking. The engineer should recognize that the *KC* values reported for such tests apply only to the specific thickness and the metal Involved in the burst test. Moreover, these are not true Kc values, but simply a mathematical expression of the flaw size-stress relationship at failure. A change of thickness or of the metal quality will void these empirical relationships, ft would be proper to avoid using the Kc or K terminology for such test results and to apply some other term which due* not suggest broad analytical interpretability. These 'Kc* values do not provide for such interpretability - a return to <*c definitions is required.
We shall close by considering the most extreme aspect of fracture-safe design is- sues which has unfortunately served to confuse other aspect*. This is the observation that given a long enough flaw in pressure vessels (say 10 to 20 times thickness) no degree of plastic fracture toughness can be expected to preclude ductile fracture propagation if the loading conditions are pneumatic. This observation (see Fig. 36, FTP failure case) simply represents a special condition which indicates that the presence of flaws of such magnitude call for fracture-safe design practices based on precluding such horrors. The fracture resistance tenacity (plastic work energy) of metals has finite limits, while mechanical force has none. Indefinite increases of flaw sizes in pressure vessels Indefinitely result in indefinite Increases in the force applied to the weakened region which undergoes geometric instability (bulging). This problem of fracture-safe design for pressure vessels is relatable to fracture toughness only within reasonable limits of the locally evolved bulging force. Moreover, it has no bearing for tensile loaded flat- plate structures which do not undergo bulging of the flaw area.
In summary, the present trends in fracture research emphasize an ever-increasing sophistication in the treatment of the problem — building upon rather than eliminating past knowledge. The great variety of fracture research evolves from the need for attention to widely different problems which have special features. Therefore, the engineer should not expect that fracture-safe design should ultimately evolve to a single generalized pro- cedure, but rather to a variety of procedures that overlap and integrate into a coherent pattern.

88 W.S. PELLINI
BIBLIOGRAPHY
Mlcrofracture Mechanisms
Tetelman, A.S., and McEvily, A.J., Jr., «Fracture of Structural Materials,* New York: Wiley, 1967.
Averback, B.L., Feibeck, D.K., Hahn, G.T., and Thomas, D.A., 'Fracture,' Proceedings of International Conference on the Atomic Mechanisms of Fracture, Swampscott, Mass., Apr. 12-16, 1959, New York:Wiley, 1959.
Cohen, M., «Metallurgical Structure and the Brittle Behavior of Steel," Ships Structure Committee, SSC Report 183, National Academy of Sciences, Washington, D.C., May 1968.
General Textbooks
«Residual Stresses in Metals and Metal Construction," W.R. Osgood, ed.. New York: Reinhold, 1954.
«Control of Steel Construction to Avoid Brittle Failure,* M.E. Shank, ed.. New York: Welding Research Council, 1957.
Hall, W.J., Klhara, H., Soete, W., and Wells, A.A., «Brittle Fracture of Welded Plate," New Jer8ey:Prentice-Hall, 1967.
«Welding Handbook - Fundamentals of Welding," 6th Ed., Sect. One, AL. Phillips, ed.. New York:American Welding Society, 1968.
Szczepanski. M., «The Brittleness of Steel," New York:Wilty. 1963.
Parker, E.R., 'Brittle Behavior of Engineering Structures," New York:Wiley, 1957.
Stout, R.D., and Doty, W.D'O., «Weldability of Steels," New York:Welding Research Council, 1953.
«Fracturing of Metals," Cleveland:American Society for Metals, 1948.
Early Investigations of Transition-Temperature Range Problem
Williams, M.L., «Analysis of Brittle Behavior in Ship Plates," Symposium on Effect of Temperature on the Brittle Behavior of Metals with Particular Reference to Low Temper- atures, ASTM Spec. Tech. Publ. 158, p. 11, 1954
Pelllni, W.S., «Evaluation of the Significance of Charpy Tests," Symposium on Effect of Temperature on the Brittle Behavior of Metals, ASTM Spec. Tech. Publ. 158, p. 216, 1954.
Shank, M.E., «A Critical Survey of Brittle Failure in Carbon Plate Steel Structures Other Than Ships," Welding Res. Council Bull. Ser. 17, Jan. 1954.
Murphy, W.J., and Stout, R.D., «Effect of Electrode Type in the Notch Slow-Bend Test," Welding J.,33(No.7):305-s (1954).
Robertson, T.S., "Propagation of Brittle Fracture in Steel," J. Iron Steel Inst. (London) 175:361 (Dec. 1953).

"'•■"•'-—"ii»iu—«M iii«r—imi WiliiliMWIilwm' w >'*vmtmrim-**'mfiimiimmv**-*,,~em**~..
NRL REPORT 695? 89
Williams, M.L., "Investigation of Fractured Steel Plates Removed from Welded Ships,* Report No. 3, Natl. Bur. Standards (U.S.), June 1951; also Williams, M.L., and Ellinger, G.A., «Investigation of Structural Failures of Welded Ships," Welding J., 32:498-s (Oct. 1953).
Puzak, P.P., Eschbacher, E.W., and Pellini, W.S., «Initiation and Propagation of Brittle Fracture in Structural Steels," Welding J., 31:561-s (Dec. 1952).
Gensamer, M., "General Survey of the Problem of Fatigue and Fracture of Metals," in «Fatigue and Fracture of Metals," MrT:Tech. Press, and New York:Wiley, p. 1 1952.
"The Design and Methods of Construction of Welded Steel Merchant Vessels," Report of a Board of Investigation, Govt. Printing Office, Washington: July 1946.
Advanced Investigations of Transition-Temperature Range Problem
Pellini, W.S., and Loss, F.J., «Integration of Metallurgical and Fracture Mechanics Concepts of Transition Temperature Factors Relating to Fracture-Safe Design for Structural Steels," NRL Report 6900, Apr. 1969; also. Welding Res, Council Bull. 141, June 1969.
Loss, F.J., and Pellini, W.S., «Coupling of Fracture Mechanics and Transition Tempera- ture Approaches to Fracture-Safe Design," NRL Report 6913, Apr. 1969.
Puzak, P.P., and Lange, E.A., «Standard Method for 1-Inch Dynamic Tear (DT) Test," NRL Report 6851, Feb. 1969.
Conference "Impact Testing of Metals," STP 466, ASTM, 1970.
Burdekin, F.M., and Stone, D.E.W., «The Crack Opening Displacement Approach to Frac- ture Mechanics in Yielding Materials," J. Strain Anal., l(No. 2):145-153 (1966).
«Method for Conducting Drop-Weight Test to Determine Nil-Ductility Transition Tem- perature of Ferritic Steels," ASTM Designation E208-66T.
Brubaker, E.H., and Dennison, J.D., «Use of Battelle Drop-Weight Tear Test for Determining Notch Toughness of Line Pipe Steel," J. Metals 17:985-989 (1965).
Mylonas, C, «Exhaustion of Ductility and Brittle Fracture of E-Steel Caused by Prestrain and Aging," Ship Structure Committee Report 162, July 1964.
Pelllni, W.S., and Puzak, P.P., «Practical Considerations in Applying Laboratory Frac- ture Test Criteria to the Fracture-Safe Design of Pressure Vessels," NRL Report 6030, Nov. 1963; also. Trans. ASME (Series A): J. Eng. Power 86:429-443 (1964).
Pellini, W.S., and Puzak, P.P., 'Fracture Analysis Diagram Procedures for the Fracture- Safe Engineering Design of Steel Structures," NRL Report 5920, Mar. 1963; also. Weld. Res. Council Bull. 88, 1963.
Hall, W.J., Nordell, W.J., and Munse, W.H., «Studies of Welding Procedures," Weld. J., 41:11(1962), Res. Suppl., p. 505-s.
Wells, A.A., «Brittle Fracture Strength of Welded Steel Plates," Brit. Welding J., 8:259-277 (May 1961).
Mylonas, C, and Rockey, K.C., «Exhaustion of Ductility by Hot Straining - An Explanation of Fracture Initiation Close to Welds," Welding J., 40:7 (1961), Res. Suppl., p. 306-s.

90 W.S. PELLINI
Stout, R.D., and Johnson, H.H., •Comparison and Analysis of Notch Toughness Tests for Steels In Welded Structures," Welding Res. Council Bull. 62, July 1960.
Mosborg, R.J., *An Investigation of Welded Crack Arresters,* Welding J., 39(No. 1): 40-8-48-8 (Jan. 1960).
Kihara, H., Masubuchi, K., lida, K., and Oba, H., "Effect of Stress Relieving on Brittle Fracture Strength of Welded Steel Plate," Intern. Inst. Welding Document X-218-59.
Kihara, H., and Masubuchi, K., "Effect of Residual Stress on Brittle Fracture - Studies on Brittle Fracture of Welded Structure at Low Stress Level," J. Soc. Naval Architects Japan, 103 (July 1958).
Masubuchi, K., "Dislocation and Strain Energy Release during Crack Propagation in Residual Stress Field," Transportation Tech. Res. List. Japan, Report No. 29, 1958
Pellini, W.S., «Notch DuctUity of Weld Metal," Welding J., 35(No. 5):218-s (May 1956).
Feely, F.J., Jr., Northup, M.S., Kleppe, S.R., and Gensamer, M., "Studies on the Brittle Failure of Tankage Steel Plates," Welding J., 34(No. 12):596-s-607-s (Dec 1955).
Shelf and Strength Transition Aspects
Puzak, P.P., and Pellini, W.S., "Evaluation of the Significance of Charpy Tests for Quenched and Tempered Steels," Welding J., 35(No.6):275-s (June 1956).
Babecki, A.J., Puzak, P.P., and Pellini, W.S., "Report of Anomalous 'Brittle' Failures of Heavy Steel Forglngs at Elevated Temperatures," ASME Publication, Paper 59-Met-6, May 1959.
Pellini, W.S., "Advances in Fracture Toughness Characterization Procedures and in Quantitative Interpretations to Fracture-Safe Design for Structural Steels," NRL Report 6713, Apr- 1968; also, Weldlr; Res. Council Bull. 130, 1968.
Goode, R.J., Judy, R.W., Jr., and Huber,R.W., "Procedures for Fracture Toughness Characterization and Interpretations to Failure-Safe Design for Structural Titanium Alloys," NRL Report 6779, Dec. 1968; also. Welding Res. Council Bull. 134, 1968.
Judy, R.W., Jr., Goode, R.J., and Freed, C.N., "Fracture Toughness Characterization Procedures and Interpretations to Fracture Safe Design for Structural Aluminum Alloys, NRL Report 6871, Mar. 1969; also. Welding Res. Council Bull. Ser. 140, 1969.
Forum on "Welding High Strength Steels," Metal Prog., pp. 66-78, Feb 1969.
Fracture Mechanics
Irwin, G.R., "Fracture," in "Encyclopedia of Physics," Vol. VI, BerlinrSpringer, pp. 551- 590, 1958.
Irwin, G.R., "Fracture Mechanics,* in "Structural Mechanics," Goodier, J.N.Aand Hoff, N.J., eds.. New York:Pergamon, p. 557, 1960. \
Irwin, G.R., "Crack-Toughness Testing of Strain-Rate Sensitive Materials," Trans. ASME, J. Eng. Power, pp. 444-450, Oct 1964.
a

gmtwmtmfm>f:!*-i- ■- «•ww»""'" «''<"■•
NRL REPORT 6957 91
Srawley, J.E., and Brown, W.F., "Fracture Toughness Testing,* NASA Tech. Note NASA TN-D-2599, Jan. 1965.
"Fracture Toughness Testing and Its Applications,'' ASTM Spec. Tech. Publ. 381, 1965.
Brown, W.F., and Srawley, J.E., "Plane Strain Crack Toughness Testing of High Strength Metallic Materials," ASTM Spec. Tech. Publ. 410, p. 126, 1966.
Irwin, G.R., Krafft, J.M., Paris, P.C., and Wells, A.A., 'Basic Aspects of Crack Growth and Fracture,' NRL Report 6598, Nov. 1967; Whitman, G.D., Robinson, G.C., Jr., and Savolainen, A.W., eds., "Technology of Stee1 Pressure Vessels for Water-Cooled Nuclear Reactors," Oak Ridge National Laboratory Report ORNL-NSIC-21, Dec. 1967.
Wessel, E.T., 'State of the Art of the WOL Specimen for KIc Fracture Toughness Testing," | Eng. Fracture Mech. 1:77-103 (1968).
Wessel, E.T., 'Linear Elastic Fracture Mechanics for Welded Steel Pressure Vessels: Material Property Considerations,* Symposium on Fracture Toughness Concepts for Weldable Structural Steels, Culcheth, England, April 29-30, 1969.
--• —i-tirf ■ i-vmrif i

APPENDIX A
ELEMENTARY ASPECTS OF FRACTURE MECHANICS
Linear elastic fracture mechanics, conventionally referred to as fracture mechanics, is a subdiscipline of the field jf continuum solid mechanics. It is concerned with linear elastic (purely elastic) definitions of fracture processes. The metal Is considered as an Isotropie continuum, i.e., a featureless solid, and therefore there is no consideration of micromechanical aspects of fracture. Much of the difficulties in grasping the essential aspects of this discipline evolve from the fact that the behavior of the metal at crack tips is elastic-plastic or plastic and Is controlled by microstructural features. Since frac- ture mechanics Is concerned only with measurement of fracture toughness and not its origin, it does not require consideration of microstructural features. Since it is based on elastic stress analyses, there are distinct limits to its applicability with increases in metallurgically controlled, mlcrofracture ductility.
The virtues and limitations of fracture mechanics can be understood in engineering terms by considering a parallel to conventional design procedures based on definitions of nominal stress. The design engineer can evolve reasonably accurate definitions of elastic stress levels in structures. However, calculations of plastic stresses pose com- plex problems of nonlinear relationships between stress and strain. Thus, the only ac- curate method for determining plastic strain levels remains the postfabrication instru- mentation of the structure with strain gages. For this same reason, it is often necessary to fabricate small models and to establish a priori configurations and scantlings by "experimental stress analysis,* which is an elegant term for strain gaging of models.
The appeal of fracture mechanics to the designer lies in the utilization of nominal stress and stress intensity as a reference, i.e., the parallel to usual practices for defin- ing load conditions. Limitations derive from the described difficulties in treating the elastic-plastic or plastic case. S should not be expected that plastic strain calculations which cannot be made reliably for regions of relatively simple geometry and redundancy in structures should be possible for regions of more complex geometry and redundancy at crack tips. Thus, the engineer should not expect more from fracture mechanics definitions of crack-üp mechanical states than is possible for smooth-body stress calcu- lations. In both cases full analytical accuracy is obtainable only for elastic load conditions.
If the expectations are kept within reason there is great benefit to be derived from considering fracture processes in terms of stress intensity concepts. The stress condi- tions at crack tips can only be discussed in terms of such concepts. This follows because the applied nominal stress is intensified at crack tips to a degree that is determined by the nominal stress, the flaw size, and the mechanical constraint to plastic flow. Of these three factors, the mechanical constraint is the most elusive, yet most fundamental, aspect which must be understood. The constraint level determines the triaxlal stress state that the metal must respond to at the crack tip. Fracture toughness tests are generally de- signed to measure the response of the metal to high (ultimate) degrees of triaxlal mechan- ical constraint to plastic flow. Fracture toughness tests can only serve the purpose of measuring this property - they can never serve the purpose of making an Inherently ductile metal brittle. It is only the inherently brittle metals which tolerate the imposition of constraint which leads to brittle (unstable) fracture. In mathematical theory it may be postulated that there is no limit to the degree of mechanical constraint that can
92
■MB
NRL REPORT 6957 93
be imposed. In practice the ductile metal defeats mechanical constraint by blunting the crack tip - the ductility effect is defined as a relaxation of constraint.
This introduction is limited to the primary aspects which must be understood; other- wise, the coupling of concepts which are basic to mechanical stress states and metal- lurgical ductility features of fracture cannot be clarified. The basic concepts are rela- tively simple when considered in terms of their physical significance.
The first aspect which must be understood is the significance of the parameter K in relation to the plastic zone developed at the crack tip. The K parameter defines the elastic stress intensification in the region of the crack tip (Fig. 44). It is a function of the flaw geometry and the nominal stress acting in the region in which the flaw resides. Metals develop a plasticized region at the crack tip, which can be defined generally as a function of the ratio (Klc/a s)
2. Except for conditions of extreme brittleness, fracture is initiated within this plasticyzone. The instability event is basically related to a plastic strain limit (ductility) of the metal crystals located in the plastic zone. Fracture me- chanics avoids the complications involved in definitions of strain conditions by referencing the development of instabilities in the plastic zone to the elastic stress intensity K levels required to attain unstable crack movement. The critical K level for the condition of maximum mechanical constraint (maximum triaxially, i.e., plane strain) that can be imposed on the region of the crack tip is defined as K . The connection between Klc and the corresponding plastic zone size (PZS) is crucial tocductility limits interpretations of fracture toughness in elastic stress field terms.
Unstable crack movement depends on the formation of a critical PZS; the larger the PZS at fracture, the tougher the material. Since the critical PZS is a function of (Klc/(r )2, it is this ratio which properly defines fracture toughness, and not KIc by itself. For example, a low ratio of (Klc/ay, )
2, or simply Klc/ays, means a small PZS. This, in turn means that little energy is expended to develop the unstable crack; conse- quently, the material is brittle. Just the opposite is true for a high ratio. It is impossible to evolve such a simple physical insight into the fracture conditions by sole consideration of Klc values. For instance, a Klc value of 60 ksi yliT cannot be translated into fracture toughness if the yield stress is not specified. If the yield stress is 30 ksi, a KIc of 60 ksi i^n. denotes a very high plane strain fracture toughness because the critical PZS is large. The value of (Ki«/^,)2 is then equal to 4.0. If the yield strength is 180 ksi, a Klc of 60 ksi yTn". denotes low toughness because the critical PZS is very small. The value of (Klc/ayl)
2 is then 0.09, which represents a PZS approximately 1/40 of the previously cited case. Metals of different yield strength will have the same level of fracture tough- ness if the ratio (Kic/a )2 is the same. The simple ratio KIc/ayi provides reference to this relationship and is the simplifying convention used in the text.
The physical significance of plane strain is that it indicates a condition of maximum triaxial constraint to plastic flow that can be imposed (is allowed) by the metal. This means that the plane strain PZS developed at the point of fracture cannot be made smaller by increasing the depth or size of the crack. (Limit sharpness is always assumed and obtained by the use of fatigue cracks in Klc tests.) If the PZS cannot be made smaller, the fracture toughness measured is the lowest possible value (singularity) for the metal. It is on this basis of singularity that Klc is considered a fundamental materials parameter.
The K definitions of elastic stress fields at crack tips appeal to designers and stress analysts in that all aspects of fracture (to their interest) may be described in terms of flaw size—stress parameters. To the metallurgist, the quality of a metal called fracture toughness relates to its ability to endure large strains at the crack tip before separation takes place. The limit strain that can be developed under maximum triaxial constraint is crucial to providing a connection between ductility concepts of fracture toughness, which guide the metallurgist in improvement of the metal, and the purely stress intensity definitions of K values, which are used to calculate flaw instabilities. The basic effects

04 W.S . PELLINI
of the transition temperature range and the shelf transition are expressible in terms of K values at least for the brittle state, but the physical interpretation of the metallurgical events can only be given In terms of mechanically constrained ductility.
The stress intensity at the crack tip is a function of the depth and shape of the crack and the P/A level of the engineering stress. A specific level of Klc stress intensity may be reached by combinations of large flaw sizes and low stresses, or small flaw sizes and high stresses. It is these relationships that provide the basis for linear elastic fracture mechanics calculations of Instabilities. As the triaxially constrained plastic flow duc- tility (fracture toughness) of the metal increases, the P/A stress required to attain instability at the tip of a crack of specified dimensions will eventually exceed yielding. For a brittle metal (small critical PZS) small flaws are of sufficient severity to attain K ic stress intensity at levels of P/A stress below yielding. A more ductile metal (larger critical PZS) will require larger flaws of increased severity to cause failure at P/A stresses below yielding. Increased metal ductility requires both increased mechanical constraint for retention of the plane strain condition and increased flaw severity to develop instabilities at elastic levels of P/A stress.
The constraint to metal flow resulting from the presence of a flaw is of geometric origin - it is related to the suppression of Poisson effects. The cracked area does not contract because there are no longitudinal stresses ricting on it. It tries to maintain its original dimensions, while the metal at the crack tip (plastic zone) is attempting to flow in the direction of the normal stress. To do so it must contract (Poisson effect) in the plane of the crack. The contracting along the crack front must be done while "tied* physically to the noncontracting cracked area. The effect of the crack is to limit lateral contraction and thus to limit extension in the normal direction. Increasing the size of the crack perimeter (flaw size) provides increased constraint because the noncontracting area Is larger; therefore, the Poisson suppression effect is retained to larger plastic zone sizes.
There are three requirements for the development of instability with retention of the plane strain condition: (a) the volume of metal surrounding the crack must be large enough to contain the necessary triaxial elastic stress fields, (b) the crack must be large enough to feature adequate constraint (noncontracting crack area) for the prevention of lateral contraction, and (c) the crack depth must be sufficient to attain the critical K level for Instability at stress levels below P/A yielding.
The physical aspects of these relationships are evident in the features of Klc speci- mens, which are suggested las guidance by the ASTM E-24 Committee based on Klc test experience:
B > 2.5 m' where B is the specimen thickness (In.). The crack depth is suggested as 0.5B for tension-loaded specimens, as is the uncracked (ligament) depth. These conditions com- bined should generally provide for the necessary level of constraint and severity features required by the level of fracture toughness defined by the Klc/ays ratio. Increasing the crack depth (with retention of the 0.5 ligament depth) merely results in decreasing the stress level at Instability - the Kic value is not changed. Increasing B does not change the level of instability stress if the crack depth is held constant - the KIc value is not changed. If the ligament depth is less than the required size, there will not be sufficient volume of metal to contain the triaxial elastic stress fields - plane strain constraint will be lost, and Kc conditions then apply. This will be the case even if the crack depth and B value meet the requirements. The B requirements of the above relationship indicate B i 0.6, 2.5, and 10.0 in. for KIC/O , ratios of 0.5, 1.0, and 2.0 respectively.

.—jwiiwmwc'owoiäwwfl " ■ -' ■" 4^^wiwwJ«i»M«<!W»w.-»»wBim»'^
NRL REPORT 6957 95
With this introduction we may now provide a simplified physical interpretation of section thickness-flaw size relationships for surface crsfks, as shown in Fig. 50, which places two edge-cracked K Ic specimens in superposition to two surface cracks. The B thickness of the specimens is assumed to be the minimirn value. For a low K IcAyi ratio a small B is adequate, while for a high ratio a larger B ralue is required. Next we assume that the volume of metal below the Kic specimei and the surface cracks is suf- ficient to establish the necessary elastic stress fields. The size of surface cracks re- quired for plane strain fracture instability will vary witli the minimum B value. For near-yield-stress loading (maximum permissible) the critical flaw size related to low K ic/ayS ratio metal will be much smaller in comparison to the high-ratio metal. For lower stress levels the flaw sizes indicated schematically will increase; however, for any relative stress the critical flaw size of the low-ratio metal will always be mrch smaller compared to the high-ratio metal.
Actually the difference in relative sizes will increase with decreasing stress level. This simply says that the spectrum of stress-related flaw sizes which are critical for low-ratio metals will be small flaw sizes. Similarly, the spectrum of flaw sizes which are critical for high-ratio metals will be large flaw sizes. Small minimum B and small flaw sizes go together; increasing B above the minimum limit does not change the size spectrum of critical surface cracks. Similarly, if largo B thickness is required for constraint, only large flaws can cause instabilities - the small flaws lead to over yield levels of stress.
The geometry of the flaw has a bearing because of the constraint aspects — stubby flaws feature lower severity as compared to long thin flaws of equal depth. The reason is that the perimeter (constraint index) is wider for the long thin flaw. As an approximation the stubby flaw must be two to three times deeper than the long thin flaw for equivalent severity. While these complexities must be understood in principle, there is no need for requiring engineers to become fracture mechanicians to use the concepts. These may be presented graphically in simple form.
The basis for calculating the graphical plots for s<>mielliptlcal surface flaws in ten- sion is provided by the following flaw size-stress relationship:
KIc = —aVrra
where
a = crack depth a = nominal stress (P/A) Q= flaw geometry parameter obtained from tablet).
All of these factors are simplified to the full graphical presentations jf Fig. 51. The various plots relate critical crack depth to the K, /or ratio for four levels of relar tive nominal stress. The stubby and long thin flaw geometries represent the two extremes of flaw geometries. For most engineering purposes it is adequate to us a one or the other of these extremes - all other Q aspects will lie between and may be inferpolated if desired. The right-hand plot also relates the B thickness to the ratio 'jy dual reference to one of the flaw size curves. The diagram thus indexes the B reor irement for Klc tests and for through-thickness cracks. Lesser thickness vill preclude attainment of plane strain constraint and a Kc condition thus evolves.
The KIc parameter relates to conditions of slow loading (static). Plane strain con- ditions for dynamic loading are defined as KId, and the applicable fracture toughness
•• ' ••TiTiiimaniiw

A
06 W.S. PELLINI
parameter Is then the Klc|/ffyd ratio. The diagram also relates to the dynamic ratios, and Its use depends on determining KId and the dynamic viel«4 strength.
The plane strain condition is tolerated only by relatively brittle metals. An index of the relative brittleness is provided by Table Al, which relates fracture mechanics calcu- lations of PZS (used for plasticity corrections) to the KIc /ays ratios. The R relation- ships for KIc test specimens indicate the constraint requirements.
Table Al Comparison of Plane Strain Constraint Parameters
B (In.)
ttatio Kj^ffy, Plane Strain Instability
PZS (in.)
Plane Stress Kc PZS
0.65
2.5
6.0
10.0
0.5
1.0
1.5
2.0
0.01
0.05
0,12
0.22
0.03
0.15
0.36
0.66
The Increase ii the Klc specimen section size required for retention of constrained (small) plastic zonos is striking. This relationship provides the basis for many of the discussions to foil« w. The increase in PZS associated with transition to Kc (for the mere starting of constraint loss) is also striking. As constraint falls barely below the critical level, the ?ZS immediately jumps to three or more times that of the plane strain value, as indicatec by the Kc column above. With additional losses of constraint the plane stress plastic zones attain enclave (very large) dimension.
K constra i . is moderately inadequate, Kc instability may still be developed before reaching yield Si *ess levels. If it is grossly Inadequate, the increase in PZS causes crack-tip yieldir; and blunting to develop as the load is increased in attempts to reach Kc values. The at' jsslevels will then rise to conditions of general yielding. This physical interpretatio. .s oJBhtor importance in relation to the effects of the transition-temperature
^ssi««» lu $ ,.•? a..\dca» ,»x b -ii W* ••»♦. The rei vaftv.; .^astic enclave. Th: li v ! jice of tear fractures. <^' wimen; it indicates that a relaS Ine energy requirefiNbtiracture 11 developed.
aint is lost due to increasing metal ductility, the PZS -tip blunting. The blunted crack accentuates the plasti- ^ ance of the blunted crack tip may then be described as
be visualised as the 'dimple* of reduced section noted pie region is similar to the neck region of a tensile
arge volume of metal has suffered deformation, very high, and fracture instability cannot be
that the' ovides sufWfent eneri
acture. Tmsois the reaS! der of several thousand feel
rain energy released at the instanUol [je critical PZS required b^he
.of brittle I^Etures ss can onl at velciSiUes ._ _ x m
be devfe^ed fo^PBpic plane strata fracture. As the Kc state is reached, the velocities decrease ano ^ ^CnQll^p to zero—ms crack Is arrested, as for the Robertson test. Propagation of the ti^Mi^« then requlres^en-by-step reappllcatlon of load and strain at the crack tip. Th^ffl|^e jnvolves cracS*^) strain, crack extension, relaxation of local stress, repeated craSK^fatrain, etc.
In summary, the plane strain statefbr cleavage fracture involves nonar Testable instabilities. As the Kc state is entered, arrestable instabilities are developed as the crack tip is blunted microscopically - the physical size of the structure (small or large) can have an effect on the rate of strain energy release because of marginal conditions of

1 NRL REPORT 6957 97
energy balance. As the Kc state becomes more advanced (larger PZS), Instabilities are no longer possible; forced propagation of fracture in progressive steps is then required, and nominal stresses will exceed yield. As the enclave state is entered, loads must rise to plastic levels - a parallel situation to a tensile specimen neck region.
Nonarrestable "popin" instabilities may also be developed for the case of fracture by void coalescence processes (noncleavage). However, this type of instability is usually obtained only if the Klc/ay, ratio is of low value. With an increase in the ratio, popin instability may not be developed, or it may be arrested in the plastic processes involved with extension away from the crack-tip region. In effect, this behavior signifies that a minute instability Involving a popin or a small tear extension is developed only while the fatigue crack exerts full constraint Influence. As the crack extends a minute distance, there Is constraint relaxation (due to plastic flow) which decreases the stress intensity Kj value to less than Klc - despite the fact that the crack is now deeper and the same load is applied. In order to continue the extension of the crack it is then necessary to apply increasing load, usually in successive steps of Increasing load for successive extensions. The high K jc/crys ratio values for noncleavage fractures are generally involved with this experimental behavior. The engineering significance of Klc vtuues determined in the absence of a nonarrestable popin is questionable. From an engineering point of view such behavior signifies arrest rather than fracture initiation.
The most significant fracture mechanics parameter, which relates to conditions of increasing resistance to extension of the crack away from the initial crack border, is the plastic work energy index <JC. While the Klc index is related to the "first event* of crack extension, the Sc index has broader meaning for cases of arrestable first event instabilities. While «^ studies preceded K Ic studies, the ^ tests were de-emphasized because of experimental difficulties in tracing the course of rising resistance to crack extension with movement away from the initial crack border.
In summary, metals which develop nonarrestable instabilities are satisfactorily categorized for engineering purposes by the KIc definition of the first event, because fracture extension follows by release of elastic strain energy. Conversely, metals which develop rising force (increased i) for the extension of the crack are not charac- terized adequately for engineering purposes by the K Ic definition of the first event condition.

•'••nmmiw* •i*mw$tri"t*Mgmm
APPENDIX B
FRACTURE MECHANICS TERMS AND EQUATIONS
1. Strain Energy Release Rate S - Elastic energy released, per unit crack surface area, as the crack extends. The strain energy 4 Is a measure uf the force driving the crack:
A = va2a. ~E~
where
a = one-half of the crack length for a through-thickness crack In a semi-infinite tension plate
o = nominal applied prefracture stress
E= modulus
2. Plastic Work Energy Sc - Index of resistance of the material to crack extension; it is related to elastic energy absorbed, per unit area of new crack surface, in crack ex- tension. Plastic work energy at the crack tip opposes the elastic energy release 4. At the point of Instability the elastic energy and the plastic work energy (resistance) are In balance:
E
where
af = nominal stress at crack extension for a through-thickness crack In a semi- infinite plate in tension
«>, = critical it.
3. Stress Intensity Factor K - Elevation of stress in advance of the crack-tip plastic zone, is related to the plastic work energy term:
K = (EA) 1/2
«W (for plane stress)
(for plane strain)
where v » Polsson's ratio.
4. Stress Intensity Factor at Instability Kc — In the preceding equation, replace K with Kc and replace "3 with Ad therefore, use Sj as nominal stress at crack instability. The subscript c means K is critical or at the point of instability.
98
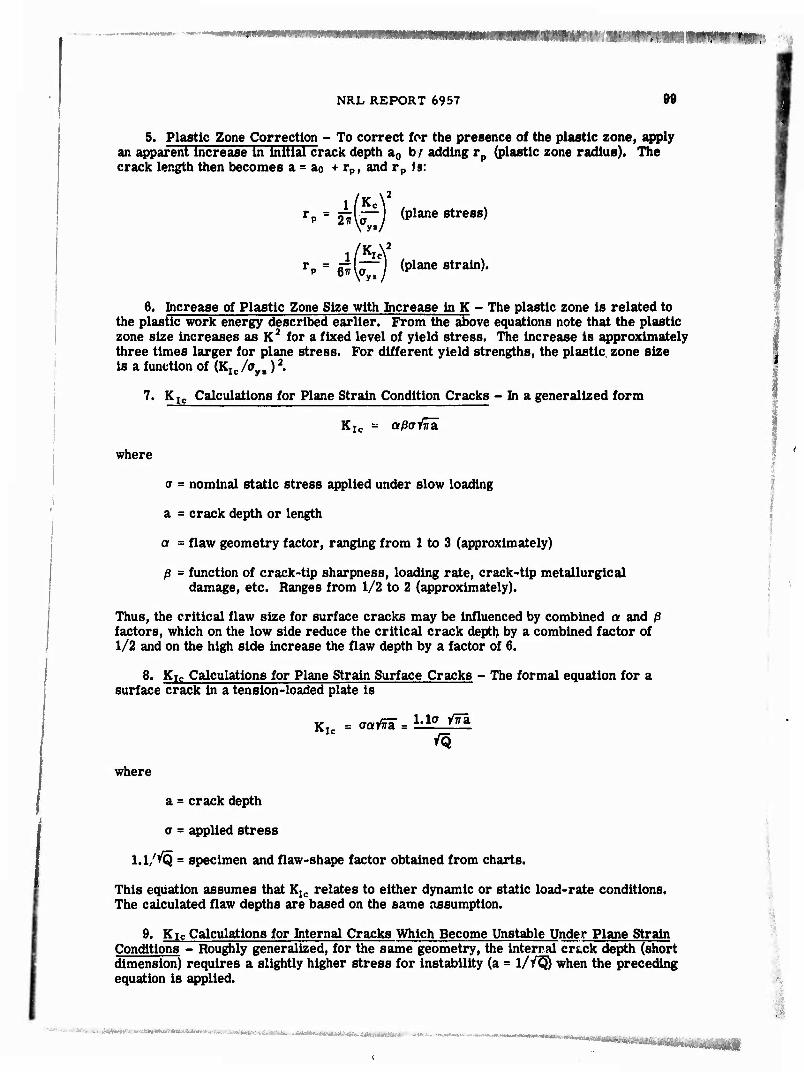
«^wnr^mr^: ^^ÜIIMiMiWWÜW.'-
NRL REPORT 6957 99
5. Plastic Zone Correction - To correct for the presence of the plastic zone, apply an apparent Increase In Initial crack depth a0 b/ adding rp (plastic zone radius). The crack length then becomes a = ao + rp, and rp Is:
'K/2
rp = 2^\ä~ (plane 8tre8s)
rp = ei^Tj (plane 8train)-
6. Increase of Plastic Zone Size with Increase In K - The plastic zone is related to the plastic work energy described earlier. From the above equations note that the plastic zone size increases as K2 for a fixed level of yield stress. The Increase is approximately three times larger for plane stress. For different yield strengths, the plastic, zone size Is a function of (Klc /ayi)
2.
7. K Ic Calculations for Plane Strain Condition Cracks - In a generalized form
Klc = aßoivz.
where
a = nominal static stress applied under slow loading
a « crack depth or length
a = flaw geometry factor, ranging from 1 to 3 (approximately)
ß = function of crack-tip sharpness, loading rate, crack-tip metallurgical damage, etc. Ranges from 1/2 to 2 (approximately).
I Thus, the critical flaw size for surface cracks may be influenced by combined a and ß factors, which on the low side reduce the critical crack depth by a combined factor of 1/2 and on the high side increase the flaw depth by a factor of 6.
8. Kic Calculations for Plane Strain Surface Cracks - The formal equation for a surface crack in a tension-loaded plate is
where
a = crack depth
a = applied stress
l.l/^Q = specimen and flaw-shape factor obtained from charts.
This equation assumes that Klc relates to either dynamic or static load-rate conditions. The calculated flaw depths are based on the same assumption.
9. Kic Calculations for Internal Cracks Which Become Unstable Under Plane Strain Conditions - Roughly generalized, for the same geometry, the internal crack depth (short dimension) requires a slightly higher stress for instability (a = 1//Q) when the preceding equation is applied.
(

100 W.S. PELLINI
10. Calculation of Surface Crack Ihyolvlng K c (Plane Stress) - When the constraint necessary for plane strain is not present, an approximation may be made of the stress intensity factor Kc under plane stress conditions. This approximation is based on a definition of K Ic, ayl, and B for the material. The following equation may be used to estimate Kc:
Kc=KIc B2 VW J
1/2
Fron? Kc, the critical flaw size for instability under plane stress conditions for the same level of nominal stress may be calculated:
aK.
Kf'c 'Ic
where
aK * critical flaw size under plane stress
aKIe = critical flaw size under plane strain.

WtmmmmmimMm»™*^, BMwmMWMmtMnwOTiaBiiMMnMe ■jmim WIUII—.
I
Serurity CUisificition
DOCUMENT CONTROL DATA -R&D jSeeurity clmMtlllcmlion ot f/f/>, body o/ tbttrmet and indmxinj mnnolmtton muwl bt 9nfrmd whtt lh» ovmrail fport la clmaallM)
i. ORIGINATING ACTIVITY (Corponit mulhor)
Naval Research Laboratory Washington, D.C. 20390
2«. REPORT (ECUKITV C LAltl FIC * TION
Unclassified 2b. CROUP
3. REPORT TITLE
EVOLUTION OF ENGINEERING PRINCIPLES FOR FRACTURE-SAFE DESIGN OF STEEL STRUCTURES . 4. DESCRIPTIVE NOTt* (Typt ol Mpotl ltd In
Special siunmary and interpretive report. 9. *UTHOR(Slfnr,«lnam, IIW<MI« MUal, lm»l nmm»)
W. S. Pellini
«. REPORT DATE
September 23, 1969 •a. CONTRACT OR GRANT NO.
NRL Problems M01-25, M01-24, and b. PROJECT NO. F01-17
SF 51-541-001-12390, -002-12380, and 003-12383
RR 007 01-46-5431 and -5432 5*4607,-11894
7«. TOTAL NO. OF PAGE*
107 76. NO. OF REF1
55 M. ORIGINATOR'S REPORT NUMBERIt)
NRL Report 6957
•b. OTHER REPORT NOII) (Any otfia» Mil« nporl)
numb*» Uiml may b» ■•*l(n*<f
10. DISTRIBUTION STATEMENT
This document has been approved for public release and sale; its distribution is unlimited.
II. SUPPLEMENTARY NOTES
"^
12. SPONSORING MILITARY ACTIVITY
Dept. of the Navy (Office of Naval Research and Naval Ship Systems Com- mand), Washington, D.C. 20360
An interpretive review is presented of the development of scientific knowledge of fracture processes and of the technological application of this information to the evolution of engineering principles for fracture-safe design. The review is in the format of a chronological exposition of the successive advancements in the state of knowledge relating to both the mechanical and metallurgical aspects of the subject. The consolidation of these aspects emphasizes that fracture-safe design practices are not separable into metallurgical and mechanical aspects, but rather involve detailed engineering consideration of both factors.
The evolution of modern fracture-safe design technology has its origins in the broad-scope research activity period of the 1940*8. The results of the early re- search provided an enduring base on which more selective studies were evolved in the ensuing decades. The evolution of significant fracture toughness character- ization test methods and of procedures for their analytical interpretation, with respect 19 both metallurgical quality and mechanical aspects, paced the rate of progress during this time period. In this report a detailed description is provided of these various tests, with separation as to types which were primarily of research interest and those which emerged as suitable for general engineering usage. >
The theoretical bases for analytical translation of laboratory test data to ' -1 structural performance factors are discussed, with particular reference to the / subject of fracture mechanics. The role of metallurgical factors is described in relaticu to microfracture processes which determine the macroscopic engineering properties.
DD .FN0O"VMJ473 (PAGEn
S/N 0I0I.S07.6S0I
101 Security CUtair.catlon
mmm .mm»-tf'
Sacurity Claaslficatlon
KCV WORD!
Fracture-safe design Fracture strength Fracture tests Metallurgical engineering Mechanical tests Ductility Cleavage Micro structure Structural steels Interpretations of fracture tests Interpretations of fracture mechanics theory to
engineering design Engineering fracture mechanics
DD ,,r..l473 BACK) (PAGE- 2)
GPO S90- 479 102 Security Classification