Embed Size (px)
Citation preview

Acta Technica Jaurinensis Vol. 3. No. 1. 2010
87
Advanced Sensitivity Measurement of Low Frequency RFID Transponder Coils
P. Csurgai, M. Kuczmann
“Széchenyi István” University, Department of Telecommunication H-9026 Győr, Egyetem tér 1. [email protected]
Abstract: Problem: More and more applications use Radio Frequency Identification (RFID) technology for wireless identification or data transfer in consumer electronics, automation and automotive market nowadays. The most important component from the communication point of view is the transponder coil. There are numerous transponder coil manufacturers in the world, and even more RFID application manufacturer. For both of them it is important to recognize the differences of various transponder constructions. This paper focuses only on the measurement of the Low Frequency RFID transponder coils, which operates using the inductive coupling. Solution: The parameter which gives the most information about the performance of the transponder coil is the sensitivity. This paper explains what the sensitivity means, how it can be calculated, and gives alternatives for the measurements. Reveals the disadvantage of the widely used standard sensitivity measurement, and provides a proposal for a new kind of measurement, by changing the excitation signal and tuning the transponder coil with a capacitor. The new measurement method results two independent parameters instead of one that give more information about the transponder coil and its performance. The paper also presents the exact phenomenon that takes place in the resonant circuit, in other words the time function of the voltage and current of the circuit, during the measurement and the standard operation. Verification: There can be found in the end of this paper an example for the measurement, where different transponder constructions are compared. The evaluation of the measurement is also introduced in two different ways. Based on the measurement and on the evaluation of the different transponder constructions the impacts of the changes in the construction can be identified and proved.
Keywords: LF RFID, LF transponder, Sensitivity, Sensitivity measurement
1. Introduction More and more applications use RFID technology for wireless identification or data transfer in consumer electronics, automation and automotive market nowadays. These

Vol. 3. No. 1. 2010 Acta Technica Jaurinensis
88
RFID systems can be classified in certain groups based on their properties, requirements and operating principles. Most commonly when high privacy and thus low reading distance, but reliable connection between the transmitter and the receiver is needed together with passive operating mode low frequency RFID system is chosen. Due to the operating principle these systems have the advantage that the transmission is not disturbed very much or blocked by obstacles or bad weather conditions. The operating principle of these systems is the inductive coupling. The main components of the system from the communication point of view, which ensure the inductive coupling are the primary and secondary resonant circuits. The resonant circuits consist of at least two components, a tuning capacitor and a reader or transponder coil, depending on which side of the coupled inductors is observed. Inductive coupling means a connection between the two coils through the electromagnetic field. The mutual inductance between the transponder and Reader coil helps to forward the energy and the transmitted signals between the two coils. These two coils can be seen as a weakly coupled transformer, where the primary coil is the Reader and the secondary coil is the transponder coil. The properties of these two coils determine mostly the limits of the communication. Therefore the coils in the two side of the transformer play a major role in the energy, the signal transfer and the operating of the complete RFID system. From this point of view it is very important to be aware of the behaviour, the properties and the limitations of the reader and transponder coils. For instance the maximum reading distance of the RFID application is determined by the coils. [1]
2. Transponder coil parameters and standard sensitivity measurement The key parameters of the transponder coils – just like other inductors – are the inductance value, the DC resistance and the quality factor. As the component has to withstand only signal level load and not power level therefore values like saturation current or rated current are not required and so thus the manufacturers don’t define or state these parameters. However due to the special use of the inductor a special parameter is introduced for the transponder coils, which helps comparing different constructions and the products of different manufacturers. This parameter is the sensitivity value, which gives information about how sensitive the component to the changing external electromagnetic field is. The sensitivity is defined as the quotient of the induced voltage and the strength of the magnetic field, which induces the voltage across the inductor. [2]
HVS i= or
BVS i= , (1)
where Vi is the induced voltage across the inductor due to changing electromagnetic field, and H or B is the strength of the electromagnetic field, or the flux density.
The unit of the sensitivity is
[ ] ⎥⎦
⎤⎢⎣⎡= −1Am
mVS or
⎥⎦
⎤⎢⎣
⎡Tµ
mV
, (2)
depending what type of excitation is considered during the measurement.
Acta Technica Jaurinensis Vol. 3. No. 1. 2010
89
The measurement of the sensitivity can be performed with the help of a device, which is capable of creating uniform (nearly constant in magnitude and in orientation as well) electromagnetic field. These devices are the Helmholtz coil and the Maxwell coil. A typical sensitivity test setup consists of a signal generator, a Helmholtz coil and an oscilloscope, Figure 1. [2]
Figure 1. Typical Sensitivity test setup
This test setup is the most common and most conservative version in the variations of the sensitivity measurements. The inductor is measured as a single part and so there is not any attached component like tuning capacitor or damping resistor. The excitation signal is a sine wave, which is generated by the signal generator, and feeds the Helmholtz coil, which creates the changing electromagnetic field. The induced voltage on the transponder coil is measured by an oscilloscope, and the sensitivity can be calculated using the formula (1). This kind of measurement results one scalar parameter, which allows the comparison of different transponder coils, but does not give any further information about the reason or the background of the difference. The sensitivity measurement as single component measurement arises some questions and problems. The first problem is – which has an influence on the measured sensitivity value – the first Self Resonance Frequency (SRF) of the inductor. There is not any passive component, which behaves in the frequency domain purely resistive, capacitive, or inductive. Inductors should be considered not only as an inductive component, but as a more complex circuit where the source of the losses can be identified by capacitive and resistive components, Figure 2. [3, 4]
Figure 2. Equivalent circuit of a lossy inductor

Vol. 3. No. 1. 2010 Acta Technica Jaurinensis
90
The transponder coil during the measurement behaves not only as a purely inductive component, but as a damped resonant circuit. So the measured sensitivity value is influenced by the resonance phenomenon, which might result a higher value than the real one. The different parasitic capacitances and thus the different self resonance frequencies are determined by the different winding methods and the used components and materials. The higher the parasitic capacitance the lower the self resonance frequency is. For example an inductor, which is wound by layer winding appears to have higher sensitivity than an inductor which has the same number of turns and ferrite core, but the winding method is random winding. In resonant circuits in case of sinusoidal excitation the output voltage of an element can be calculated using the impedances instead of the differential equation of the circuit. According to this the transfer function of the inductor during the sensitivity measurement can be calculated as the quotient of the output and the input voltage, which is equal to the inductor impedance divided by the total impedance of the RLC circuit:
( )2
2 1⎟⎠⎞
⎜⎝⎛ −+
=
CωLωR
LωωH (3)
Drawing the transfer function curves of transponder coils with different parasitic (winding) capacitances the huge difference is evident, Figure 3.
Figure 3. Transfer function curves of transponder coils with different capacitances
The difference in the transfer function values between the various transponders represents the difference in the measured sensitivity value. The false measurement may lead to false conclusion and decision, because a transponder coil with lower real

Acta Technica Jaurinensis Vol. 3. No. 1. 2010
91
performance might have a higher sensitivity value in this kind of measurement. Another problem of this measurement is that the test does not simulate the real operating of the inductor. In the real RFID application the transponder is always tuned to a specific frequency, and thus the induced voltage across the inductor is many times higher due the resonance phenomenon, as can be seen in the transfer function, Figure 3.
3. Sensitivity measurement in tuned resonant circuit The above explained measurement error can be eliminated by the resonant circuit measurement, where the circumstances and the mode of the operation is almost identical to the real use of the transponder coil. In these kinds of measurements the transponder coil is tuned to the desired frequency by a tuning capacitor. The frequency of the RFID system is usually between 125 kHz and 134.2 kHz. Although this measurement approximates better the real operation, but it still has the problem that the output is only one scalar parameter, because the used evaluation method of the measurement is identical to the formula (1).
It is important to note when a resonant circuit is measured, the capacitor is qualified together with the transponder coil as well. So the capacitor influences the whole circuit and the measured values. But choosing a proper capacitor the losses of the capacitor can be neglected compared to the losses of the transponder coil. A rotary capacitor, which has air gap between its plates, has a sufficient high quality factor. The frequency of the measurement allows the using of these kinds of capacitors, because in this frequency range the dielectric loss of the capacitor can be neglected. From this point of view using tuning capacitor will not change noticeably the measured sensitivity value.
Figure 4. Ttransponder coil in tuned resonant circuit
4. Advanced Sensitivity measurement Changing the excitation signal and the evaluation of the measurement two independent parameters can be identified. Taking a deeper look in the resonant circuit (Figure 4), which is built up from the transponder coil (L), the tuning capacitor (C) and the damping resistor (R) the complete resonance phenomenon can be described as follows:
• Using the Kirchoff’s loop rule on the circuit (with the reference in Figure 4) the following equation can be identified:
0VVVV CRL =++ . (4)

Vol. 3. No. 1. 2010 Acta Technica Jaurinensis
92
• Due to the same current flows through all the components it is practical to calculate the voltages in the function of the current:
iRVR ⋅= , (5)
dtdiLVL ⋅=
, (6)
∫⋅= idt
CVC
1. (7)
• Substituting the voltages described above (5-7) to the Kirchhoff’s loop (4) the following second order differential equations will be created:
0
0
1 VidtC
RidtdiL
t
=++ ∫, (8)
dtdVi
LCdtdi
LR
dtid 02
2 1=++
. (9)
• Introducing the LC
ω 10 = parameter the differential equation can be written in
the following simpler form:
dtdViω
dtdi
LR
dtid 02
02
2
=++. (10)
• The characteristic equation of the (10) differential equation is:
202
2
2,1 42ω
LR
LRλ −±−=
. (11)
• Assuming that the damping of the resonant circuit is below the critical damping,
and introducing the L
Rδ2
= the root of the characteristic equation will be:
22
02,1 δωjδλ −⋅±−=. (12)
• Introducing the 220 δωω −= the root of the equation can be further
simplified in the following form:
ωjδλ ±−=2,1 . (13)
• The solution of the differential equation (with considering the 0=sti condition) is:
Acta Technica Jaurinensis Vol. 3. No. 1. 2010
93
tλtλ eAeAi 21
21 += . (14)
• The initial condition of the current in the resonant circuit is:
( ) 00 21 =+= AAi . (15)
• Substituting the (6) equation with the (15):
[ ] 02211
0
VλAλALdtdiL
t
=+=⎟⎠⎞
⎜⎝⎛
= . (16)
• The following results will occur for the A1 and A2 parameters from the last two equations:
( )LλλVA
21
01 −=
, (17)
( )LλλVA
21
02 −
−=. (18)
• So thus the current of the circuit in complex form will be the following:
( ) ( )tλtλ eeLλλ
Vi 21
21
0 −⋅−
=. (19)
• Using the Euler’s formula the solution for the current is:
( )tωjtωjtδ eee
LωjVi −− −⋅⋅⋅
=2
0
, (20)
⎟⎟⎠
⎞⎜⎜⎝
⎛ −⋅⋅=
−−
jeee
LωVi
tωjtωjtδ
20
, (21)
( )tωe
LωVi tδ sin0 ⋅⋅= −
. (22)
• The voltage of the coil, which shall be monitored during the measurement according to the (6) equation is:
( ) ( ) ≈⋅⋅+⋅⋅−⋅=⋅= −− )cos()sin(0 tωeωtωeδ
LωLV
dtdiLtV tδtδ
L
)cos(0 tωeV tδ ⋅⋅≈ −
. (23)

Vol. 3. No. 1. 2010 Acta Technica Jaurinensis
94
The calculated voltage and current of a resonant circuit can be seen in the Figure 5. The calculated example represents a typical LF RFID circuit, where the components have the following values: L=2.36mH, C=680pF, R=20Ω.
Figure 5. Simulated time function of the voltage and current of a RLC circuit
As can be seen from the time function of the voltage on the coil, the shape of the curve is determined by three parameters: the initial amplitude (V0), the damping constant (δ) and the resonant frequency of the circuit (ω). One of these three parameters is intentionally fixed in the measurement of different transponder coils. The fixed parameter is the resonance frequency. The frequency is defined by the application, which shall be the same during the benchmark of different transponder constructions to provide the same external circumstances for the coils. This resonance frequency can be adjusted by a tuning capacitor. The two other parameters are the amplitude and damping factor. These two parameters give more information than only the scalar sensitivity value, because both parameters are independent from each other, and have a physical meaning. The amplitude of the induced voltage gives information how sensitive really the transponder coil to the electromagnetic field is. Without any exception a more sensitive coil shall have higher induced voltage (amplitude of the first peak) regardless what the self resonance frequency of the coil is. The damping factor gives information about the quality factor of the whole resonant circuit. As the losses of the resonant circuit mostly determined by the losses of the transponder coil, the damping factor gives information only about the transponder coil. In this frequency range the losses of the inductor are the eddy current losses, the iron losses of the ferrite core and the resistive losses of the winding wire. Usually in the low frequency range skin and proximity effect doesn’t play major role. It is obvious that an inductor with higher losses has a higher damping factor too and so the swinging energy between the tuning capacitor and the transponder coil will collapse much faster. It is important to emphasize that the measurement setup is almost identical in this case than in the original measurement, only the tuning capacitor and the excitation signal is different.
Acta Technica Jaurinensis Vol. 3. No. 1. 2010
95
The excitation of the resonant circuit shall be a Dirac delta pulse. The resonant circuit is fed through the transponder coil, therefore the Dirac delta will occur on the coil due to the electromagnetic field created by the Helmholtz coil. The induced voltage which feeds the resonant circuit can be identified by the Faraday’s law of induction:
( )tδ
dtdNVL =−=Φ
. (24)
The required signal on the Helmholtz coil for getting the Dirac delta pulse on the transponder coil can be calculated according to the (24) equation. If the required signal on the coil is a Dirac delta pulse, the signal on the Helmholtz coil shall be the integral of the Dirac delta pulse, as it can be seen in the follows.
( ) ( )tdttδHelmholtz 1Φ == ∫ . (25)
So the flux of the Helmholtz coil should be a step function. As the flux and the field strength of the coil is proportional to the current, therefore the excitation current of the Helmholtz coil should be also a step function. The current of a coil can not be changed in infinite short time, therefore the only way to get the desired induced voltage on the transponder coil to apply an increasing current on the Helmholtz coil with sufficient high slope.
The evaluation of the measurement can be performed by analysing the time function of the voltage or the current of the transponder coil. The current or the voltage of the coil can be easily recorded with the help of an oscilloscope and a voltage or current probe. Based on the curves the two parameters (amplitude, damping factor) can be calculated, which reveal the background of the difference of the transponders.
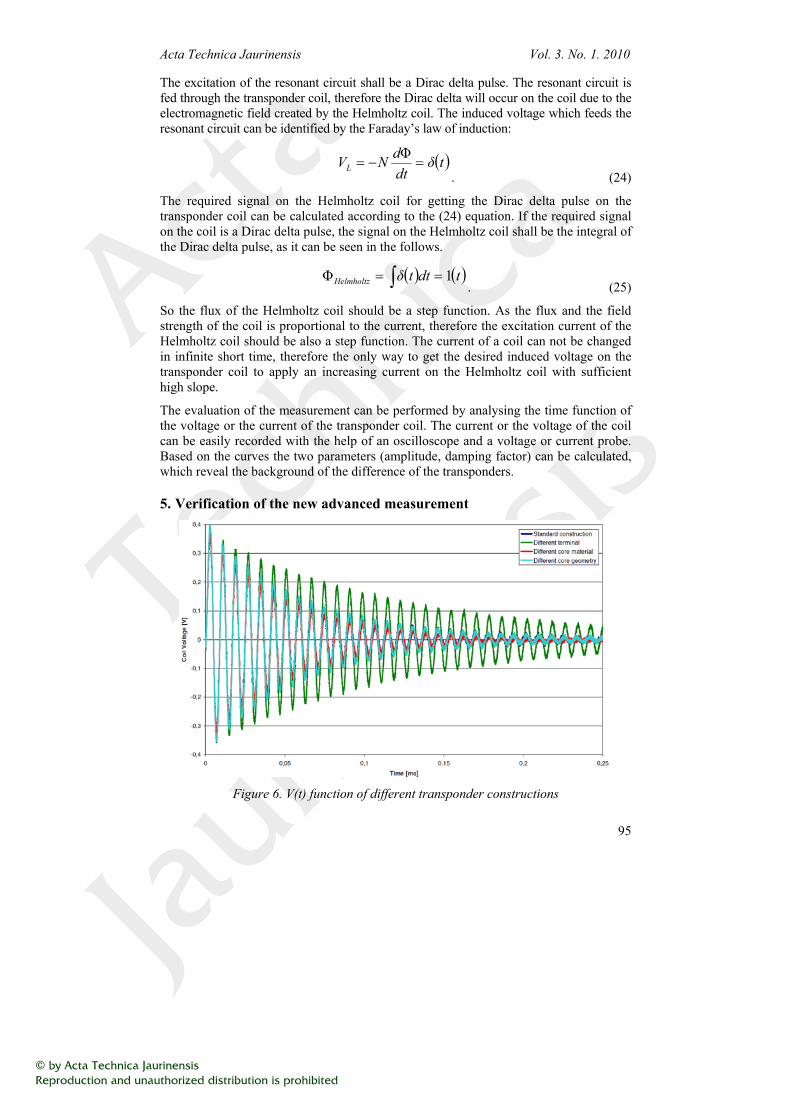
5. Verification of the new advanced measurement
Figure 6. V(t) function of different transponder constructions

Vol. 3. No. 1. 2010 Acta Technica Jaurinensis
96
A comparison of different transponders with the above mentioned new measurement can be seen in the follows.
For the verification of the measurement four different transponder constructions were tested. The first sample, which is called standard construction is available on the market from an existing manufacturer, and represents a standard transponder coil. The three other parts differs from the standard one in the ferrite core material, the ferrite core geometry and the terminal length. As it can be seen the measurement method gives information about the reason of the difference in the sensitivity value as well. So thus based on the curves of this new measurement the impacts of each change in the construction can be evaluated.
The differences can be more clearly seen, if the exponential envelopes of the different constructions are plotted only, without the disturbing sine wave, Figure 7.
Figure 7. Exponential envelopes of different transponder constructions
Comparing each sample to the standard one, conclusions about the construction changes can be made.
• Different terminal: By choosing a better terminal geometry not only the amplitude of the signal, but the damping factor of the circuit is also better than using the standard one. The reason is that there are much less eddy current losses generated in the terminal, and so the resonant circuit dissipates less energy.
• Different core material: Changing the core material from NiZn to MnZn ferrite, on one hand causes higher sensitivity amplitude, but on the other hand the damping factor is higher, therefore this change made the transponder coil worse in total. The reason of the higher sensitivity amplitude is the higher permeability, and the higher damping factor occurred due to the high conductivity of the MnZn ferrite, which leads to higher eddy current losses.

Acta Technica Jaurinensis Vol. 3. No. 1. 2010
97
• Different core geometry: The highest sensitivity amplitude value is given in this case. The reason is that the sensitivity is mostly determined by the length and the shape of the ferrite core.
Combining and using the conclusions of the tests above, the performance of the transponder coil can be increased during a development process. These conclusions would have been more difficult to find out if this new measurement had not been available.
The final result of the measurement also can be achieved by evaluating the measured data with Fourier Transform. Using the Fast Fourier Transform procedure on the measured data the spectral density of the signal (current or voltage of the resonant circuit) can be calculated. It is not possible directly to calculate the amplitude and the damping factor from the spectral density, but the peak amplitude on the resonant frequency and the bandwidth,
LH ffB −= , (26)
provides the same kind of information as the sensitivity amplitude and the damping factor in time domain.
The quality factor of the resonant circuit using the bandwidth of the signal can be calculated by the following equation:
LH fff
BfQ
−== 00
(27)
It is a bit harder to evaluate the FFT data, as can be seen on the Figure 8, but the comparison of different constructions also can be made.
Figure 8. Spectral density of the signals of the sensitivity measurement

Vol. 3. No. 1. 2010 Acta Technica Jaurinensis
98
6. Summary and field of application The design processes require accurate and reliable information about all the components and parts what the designed product contains either it is an RFID application or a transponder coil design or development. As all the engineers try to reach the highest possible efficiency and performance it is highly required to improve the available measurement methods to learn even more about the components. The presented measurement method helps to identify and understand the differences and backgrounds of different transponder constructions.
References
[1] Klaus Finkenzeller – RFID Handbook, Carl Hanser Verlag, Munich/FRG, 1999. [2] EPCOS Inductors Handbook 2009, EPCOS AG, Germany 2008. [3] Marian K. Kazimierczuk, Giuseppe Sancineto, Gabriele Grandi, Ugo Reggiani, Antonio
Massarini – High-Frequency Small-Signal Model of Ferrite Core Inductors, IEEE Transactions on Magnetics. Vol 35, No. 5, September 1999.
[4] Leslie Green, Gould-Nicolet Technologies – RF-inductor modelling for the 21st century, www.ednmag.com September/2001.