Embed Size (px)
Citation preview
Svensk Kärnbränslehantering ABSwedish Nuclear Fueland Waste Management CoBox 5864SE-102 40 Stockholm SwedenTel 08-459 84 00
+46 8 459 84 00Fax 08-661 57 19
+46 8 661 57 19
InternationalProgress Report
IPR-06-09
Äspö Hard Rock Laboratory
Iron oxides in fractures at Äspö
A feasibility study to test the possibilityof finding a geothermometer or apalaeo-redox indicator
Knud Dideriksen
Susan L.S. Stipp
NanoGeoScience Group
Geological Institute
University of Copenhagen
April 2005


Report no. No.
IPR-06-09 F123KAuthor Date
Knud Dideriksen April 2005Susan L.S. StippChecked by Date
John Smellie 2006-05-23Approved Date
Anders Sjöland 2006-06-01
Keywords: Fe-oxides, Palaeothermometry, Selective extraction, Rare-earths
This report concerns a study which was conducted for SKB. The conclusionsand viewpoints presented in the report are those of the author(s) and do notnecessarily coincide with those of the client.
Äspö Hard Rock Laboratory
Iron oxides in fractures at Äspö
A feasibility study to test the possibilityof finding a geothermometer or apalaeo-redox indicator
Knud Dideriksen
Susan L.S. Stipp
NanoGeoScience Group
Geological Institute
University of Copenhagen
April 2005

3
Summary
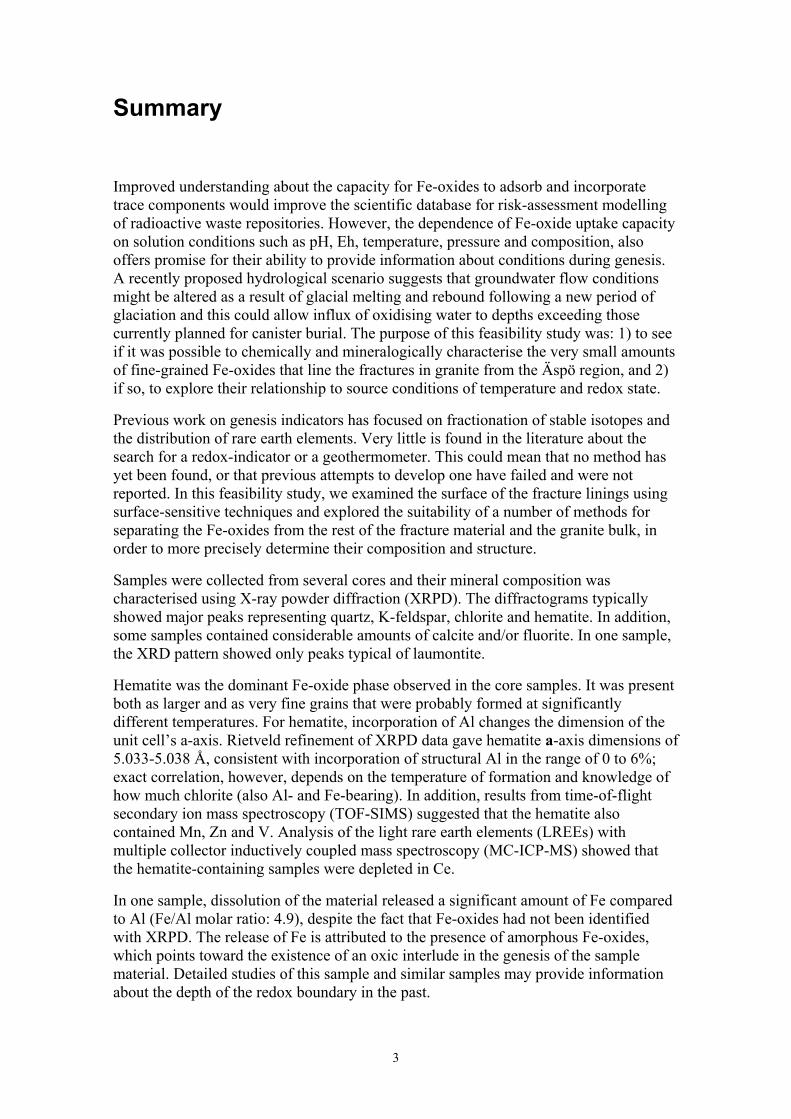
Improved understanding about the capacity for Fe-oxides to adsorb and incorporate trace components would improve the scientific database for risk-assessment modelling of radioactive waste repositories. However, the dependence of Fe-oxide uptake capacity on solution conditions such as pH, Eh, temperature, pressure and composition, also offers promise for their ability to provide information about conditions during genesis. A recently proposed hydrological scenario suggests that groundwater flow conditions might be altered as a result of glacial melting and rebound following a new period of glaciation and this could allow influx of oxidising water to depths exceeding those currently planned for canister burial. The purpose of this feasibility study was: 1) to see if it was possible to chemically and mineralogically characterise the very small amounts of fine-grained Fe-oxides that line the fractures in granite from the Äspö region, and 2) if so, to explore their relationship to source conditions of temperature and redox state.
Previous work on genesis indicators has focused on fractionation of stable isotopes and the distribution of rare earth elements. Very little is found in the literature about the search for a redox-indicator or a geothermometer. This could mean that no method has yet been found, or that previous attempts to develop one have failed and were not reported. In this feasibility study, we examined the surface of the fracture linings using surface-sensitive techniques and explored the suitability of a number of methods for separating the Fe-oxides from the rest of the fracture material and the granite bulk, in order to more precisely determine their composition and structure.
Samples were collected from several cores and their mineral composition was characterised using X-ray powder diffraction (XRPD). The diffractograms typically showed major peaks representing quartz, K-feldspar, chlorite and hematite. In addition, some samples contained considerable amounts of calcite and/or fluorite. In one sample, the XRD pattern showed only peaks typical of laumontite.
Hematite was the dominant Fe-oxide phase observed in the core samples. It was present both as larger and as very fine grains that were probably formed at significantly different temperatures. For hematite, incorporation of Al changes the dimension of the unit cell’s a-axis. Rietveld refinement of XRPD data gave hematite a-axis dimensions of 5.033-5.038 Å, consistent with incorporation of structural Al in the range of 0 to 6%; exact correlation, however, depends on the temperature of formation and knowledge of how much chlorite (also Al- and Fe-bearing). In addition, results from time-of-flight secondary ion mass spectroscopy (TOF-SIMS) suggested that the hematite also contained Mn, Zn and V. Analysis of the light rare earth elements (LREEs) with multiple collector inductively coupled mass spectroscopy (MC-ICP-MS) showed that the hematite-containing samples were depleted in Ce.
In one sample, dissolution of the material released a significant amount of Fe compared to Al (Fe/Al molar ratio: 4.9), despite the fact that Fe-oxides had not been identified with XRPD. The release of Fe is attributed to the presence of amorphous Fe-oxides, which points toward the existence of an oxic interlude in the genesis of the sample material. Detailed studies of this sample and similar samples may provide information about the depth of the redox boundary in the past.

4
In summary, the possibility of establishing an indicator of redox or temperature conditions for the formation of Fe-oxides was examined. A range of feasible methods was investigated and dismissed. In particular, the possibility of determining the temperature of formation for hematite through comparison of the hematite a-axis dimension and the Al-content was pursued. However, the dissolution of other minerals in the Fe-oxide containing samples, especially chlorite, complicated the establishment of a redox or temperature indicator.
5
Sammanfattning
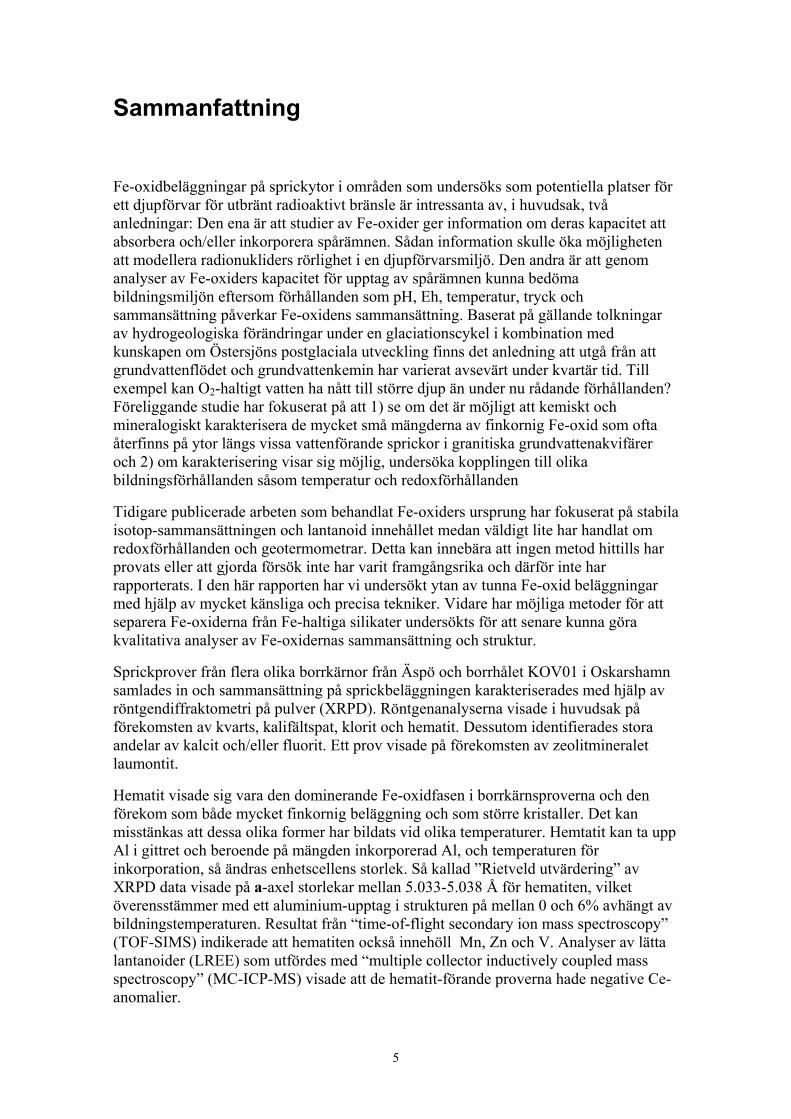
Fe-oxidbeläggningar på sprickytor i områden som undersöks som potentiella platser för ett djupförvar för utbränt radioaktivt bränsle är intressanta av, i huvudsak, två anledningar: Den ena är att studier av Fe-oxider ger information om deras kapacitet att absorbera och/eller inkorporera spårämnen. Sådan information skulle öka möjligheten att modellera radionukliders rörlighet i en djupförvarsmiljö. Den andra är att genom analyser av Fe-oxiders kapacitet för upptag av spårämnen kunna bedöma bildningsmiljön eftersom förhållanden som pH, Eh, temperatur, tryck och sammansättning påverkar Fe-oxidens sammansättning. Baserat på gällande tolkningar av hydrogeologiska förändringar under en glaciationscykel i kombination med kunskapen om Östersjöns postglaciala utveckling finns det anledning att utgå från att grundvattenflödet och grundvattenkemin har varierat avsevärt under kvartär tid. Till exempel kan O2-haltigt vatten ha nått till större djup än under nu rådande förhållanden? Föreliggande studie har fokuserat på att 1) se om det är möjligt att kemiskt och mineralogiskt karakterisera de mycket små mängderna av finkornig Fe-oxid som ofta återfinns på ytor längs vissa vattenförande sprickor i granitiska grundvattenakvifärer och 2) om karakterisering visar sig möjlig, undersöka kopplingen till olika bildningsförhållanden såsom temperatur och redoxförhållanden
Tidigare publicerade arbeten som behandlat Fe-oxiders ursprung har fokuserat på stabila isotop-sammansättningen och lantanoid innehållet medan väldigt lite har handlat om redoxförhållanden och geotermometrar. Detta kan innebära att ingen metod hittills har provats eller att gjorda försök inte har varit framgångsrika och därför inte har rapporterats. I den här rapporten har vi undersökt ytan av tunna Fe-oxid beläggningar med hjälp av mycket känsliga och precisa tekniker. Vidare har möjliga metoder för att separera Fe-oxiderna från Fe-haltiga silikater undersökts för att senare kunna göra kvalitativa analyser av Fe-oxidernas sammansättning och struktur.
Sprickprover från flera olika borrkärnor från Äspö och borrhålet KOV01 i Oskarshamn samlades in och sammansättning på sprickbeläggningen karakteriserades med hjälp av röntgendiffraktometri på pulver (XRPD). Röntgenanalyserna visade i huvudsak på förekomsten av kvarts, kalifältspat, klorit och hematit. Dessutom identifierades stora andelar av kalcit och/eller fluorit. Ett prov visade på förekomsten av zeolitmineralet laumontit.
Hematit visade sig vara den dominerande Fe-oxidfasen i borrkärnsproverna och den förekom som både mycket finkornig beläggning och som större kristaller. Det kan misstänkas att dessa olika former har bildats vid olika temperaturer. Hemtatit kan ta upp Al i gittret och beroende på mängden inkorporerad Al, och temperaturen för inkorporation, så ändras enhetscellens storlek. Så kallad ”Rietveld utvärdering” av XRPD data visade på a-axel storlekar mellan 5.033-5.038 Å för hematiten, vilket överensstämmer med ett aluminium-upptag i strukturen på mellan 0 och 6% avhängt av bildningstemperaturen. Resultat från “time-of-flight secondary ion mass spectroscopy” (TOF-SIMS) indikerade att hematiten också innehöll Mn, Zn och V. Analyser av lätta lantanoider (LREE) som utfördes med “multiple collector inductively coupled mass spectroscopy” (MC-ICP-MS) visade att de hematit-förande proverna hade negative Ce-anomalier.
6
Upplösning av ett av de prover där kristallin Fe-oxid inte hade varit möjlig att identifiera med hjälp av XRPD visade på signifikant lakning av Fe jämfört med Al (Fe/Al molar ratio: 4.9). Detta kan förklaras med att provet istället innehöll amorf Fe-oxid, vilket i sin tur skulle peka mot en potentiellt recent oxidation. Detaljerade studier av dessa och liknande prover kan ge information om djupet till den nuvarande redoxfronten i de vattenförande sprickorna i berget.
Sammanfattningsvis visar studien på möjligheter och svårigheter med detaljerade analyser av Fe-oxider för att bestämma redox- och temperaturförhållanden. Ett antal möjliga metoder var testade och en del bedömdes därefter som mindre användbara. Stora ansträngningar gjordes för att testa möjligheterna att bestämma bildningstemperaturer genom jämförelser av a-axel storlekar och Al-innehållet på hemtitprover. Ett stort problem visade sig vara upplösning av andra Fe-rika mineral (i synnerhet klorit) som komplicerade tolkningen av resultaten avsevärt.
7
Contents
1 Introduction 9
2 Background 11 2.1 Geochemical indicators 11
2.1.1 Indicators of redox conditions 11 2.1.2 Geothermometers 12
2.2 Separation of Fe-oxides 13
3 Geological setting and samples 15
4 Methods 17
5 Materials 21
6 Results and discussion 23 6.1 Characteristics of bulk samples 23 6.2 Investigating selective dissolution 30
6.2.1 Ligand-promoted dissolution on pure phases 30 6.3 Dissolution rates using selected agents 32 6.4 Chemical characterisation of the Fe-oxides 35
6.4.1 Characterisation of Fe, Al and Mn composition of Äspö samples 35 6.4.2 Characterisation of LREE composition of Äspö samples. 37
7 Conclusions 43
8 Acknowledgements 45
9 References 47

8
9
1 Introduction
Iron(III)-(oxy-hydr)oxides, henceforth termed Fe-oxides, are common in rocks and sediments, especially as secondary minerals that form when less stable Fe-bearing phases such as silicate or sulphide minerals are weathered. Fe-oxides are most usually fine-grained and often form as coatings on other minerals or as linings in fractures. They are known to adsorb and incorporate trace components from solution and thus, they may present an important sink for radioactive elements released to the environment. The extent of uptake depends on the component's own properties and its fit into the Fe-oxide mineral structure as well as temperature, pH, Eh and the presence of other species in the solution (Cornell and Schwertmann, 1996) but there are many gaps in our understanding of the degree of permanence of radionuclide immobilisation. Because of their similarity in bahaviour, improved understanding of the lanthanides (rare earth elements, REE's) provides a reasonable framework for modelling the behaviour of the actinides. Furthermore, because of the dependence of uptake on formation conditions, trace element composition of an Fe-oxide mineral could serve as an indicator of the temperature or redox conditions during time of formation.
Although there has been very little published in the literature about the use of trace components as an indicator of genesis, this is a field that has many possibilities. Examination and comparison of the trace composition of Fe-oxides with synthetic counterparts could lead to interpretation of the conditions that existed during their formation. Information about previous conditions is especially important if the goal is to determine the broadest range of possible geological-setting scenarios for risk assessment modelling. At Äspö, radioactive waste is to be stored in steel-lined copper canisters that are highly stable under reductive conditions. However, if groundwater flow patterns are dramatically altered, such as during melting of a future glacier as has been proposed (Glynn et al., 1999; King-Clayton et al., 1995), then dilute oxidising water could reach the level of the repository. Before consideration of this possibility in repository design and risk assessment, the hypothesis could be tested, if a reliable geothermometer or redox indicator could be developed. The material from fracture linings might be used to this end.
The purpose of this study was to characterise the minerals in the red- and brown-stained fractures in granite from the Oskarshamn bore core KOV 01 and the Äspö tunnel and to examine their trace element composition and their relative REE content. Groundwater flowing into fractures from the surface would be expected to decrease temperature and increase oxidation potential, facilitating precipitation of Fe-oxides with a different chemical signature than those produced from hydrothermal solutions. The particular goal of this preliminary study was to investigate the possibilities for establishing a redox indicator or geothermometer for the iron oxides.

10
11
2 Background
Fe(II)/Fe(III) (hydr)oxides are common and widespread compounds. They may form in a variety of environments and a multitude of phases exist that may readily recrystallise or transform in response to a change in the environmental conditions, such as pH, Eh or fluid composition. The subject is complex; further information can be found in Cornell and Schwertmann (1996) and references therein. Below is a very brief overview.
In lower temperature (0-120º C), oxic environments, poorly crystalline ferrihydrite (Fe5HO8· 4H2O) quickly precipitates and often ages to hematite (α-Fe2O3) or goethite (α-FeOOH), depending on solution pH and the presence of other elements, such as Si or Cu. At higher temperatures, ferrihydrite transforms primarily to hematite and above 250º C, all Fe-oxyhydroxides are converted to hematite through thermal dehydration. Under reducing conditions, Fe(II) is highly soluble, but when it reaches saturation, Fe(OH)2 forms. In the vicinity of the redox boundary, mixed Fe(II)/Fe(III) phases are formed, where Fe(OH)2 transforms rapidly to green rust, a layered Fe-hydroxide in which anions fill the interlayers. Magnetite (Fe3O4) forms in more oxic environments. Further oxidation induces recrystallisation of green rust, leading to the formation of goethite (α-FeOOH) and/or lepidocrocite (δ-FeOOH). The latter phase has also been observed to form on stalks of Gallionella ferrugina (unpublished work in our group), a bacteria known to live exactly at the redox boundary where it uses the transition of Fe(II) to Fe(III) for providing energy.
2.1 Geochemical indicators The possibility of determining geological environments by chemical and mineralogical composition has been extensively studied in the scientific community throughout the years but the focus mostly has been on the lighter stable isotopes or REE content. Only a few studies have tested the possibility of establishing more specific indicators for redox conditions or temperature of Fe-oxide genesis.
2.1.1 Indicators of redox conditions It is well known that oxidation of Ce(III) to Ce(IV) decreases the element's solubility, thus its mobility. This phenomena is often associated with the mid-oceanic ridges, where Ce(III) from emerging hydrothermal fluids becomes oxidised at the surface of Mn-oxides, leading to incorporation of Ce(IV) in marine Fe-Mn nodules (McLennan, 1989; Goldberg et al. 1963). Similarly, Palumbo et al. (2001) have observed enrichment of Ce in terrestrial Fe-Mn nodules that were sampled in the oxic zone and in the zone of fluctuating groundwater. Laboratory-based experiments have, however, proven that Ce(III) adsorbs predominantly on Mn-oxides, leading to significant enrichment (Ohta and Kawabe, 2001). For Fe-oxides, adsorption of Ce(III) was only slightly preferred over adsorption of the other REE’s. It is, thus, very possible that a change from reducing to oxidising conditions in the fractures could lead to formation of highly Ce-enriched Mn-oxides and only slightly Ce-enriched Fe-oxides. We determined the REE distribution of some selected samples and particularly examined them for Ce.

12
The presence of V as a trace component has been suggested as a redox indicator in sepiolite and in lateritic goethite and hematite (Gehring et al. 1994; Schwertmann and Pfab, 1996). The latter study demonstrated that structural V(III) is present in goethite that originates from oxidation of Fe2+ in the zone of fluctuating groundwater. Similarly, glaciation-induced changes in the redox conditions in fractures may very well lead to formation of Fe-oxides with structural V(III), if it is present in the water. The structural V(III) in Fe-oxides has been determined indirectly after sample dissolution. In acidic solutions, dissolved V(III) quickly oxidises to V(IV) via reduction of Fe(III), so the amount of V(III) is determined by determining concentrations of Fe(II) after dissolution. This method requires that Fe(II)-bearing phases are not dissolved together with the Fe(III)-oxides.
2.1.2 Geothermometers The establishment of a geothermometer, based on several major elements that are certainly present during formation of natural Fe-oxides, shows promise:
• Groundwater percolating through the fractured granite becomes saturated with respect to quartz. The solubility of Si is temperature dependent so increased levels of structural Si in Fe-oxides could result from higher temperatures. The extent of incorporation of Si in Fe-oxides and its dependence on mineralogy and temperature is, however, not fully understood. Further studies on well-characterised systems under controlled conditions are required to establish a Si-based geothermometer for Fe-oxides. The use of Si as an indicator also requires absolute control over the portion of the sample that is analysed; that is, quartz, feldspar and clay must be separated from the sample or remain unaffected during Fe-oxide dissolution.
• Al substitutes readily into Fe-oxide mineral structures. The length of the a-axis in the unit cell of hematite decreases with increasing structural incorporation of Al (Schwertmann et al., 2000). The rate of decrease is temperature dependent, allowing estimation of genesis temperature. Determination of the content of structural Al in the hematite, coupled with XRD determination of its a-axis dimension, should thus allow estimation of the hematite formation temperature. It is, however, a prerequisite that aluminosilicates can be separated from the sample or that they remain intact during Fe-oxide dissolution.
• The most exciting of the possibilities still to be explored is the use of Fe-isotope fractionation. Fractionation among the various stable isotopes of Fe is a very new topic. It has been shown to occur through biological processes (Beard et al., 1999) and evidence also exists for abiotic fractionation, which is temperature dependent (Polyakov and Mineev, 2000). The advantage of this method is that release of Fe from slight dissolution of other Fe-bearing minerals during extraction should present only a minor problem. An investigation of Fe-fractionation is not trivial because of the need for method development and testing on a host of samples, so it is beyond the time-frame of this feasibility project. However the method holds promise and may, with time, reward us with a useful indicator.
13
2.2 Separation of Fe-oxides It is evident that most of the described methods for determining redox conditions or temperature of formation require that the Fe-oxide chemical composition be studied separately. Thus, the establishment of an indicator depends largely on successful development of a method for separating the Fe-oxides from the aluminosilicates that are almost always present in the fractures.
If the Fe-oxide precipitate is present as large grains or cohesive aggregates, they may simply be picked out of the sample and dissolved, enabling determination of their trace element and REE composition through Atomic Absorption Spectroscopy (AAS) and Inductively Coupled Plasma – Mass Spectroscopy (ICP-MS).
If the Fe-oxides are present as minute grains, they may be separated mechanically in high-density fluids or chemically, through selective dissolution by agents that preferentially dissolve the Fe-oxides. The selectivity of such agents is, however, only partly known and had to be tested on the relevant pure minerals before application to the Äspö samples.

14
15
3 Geological setting and samples
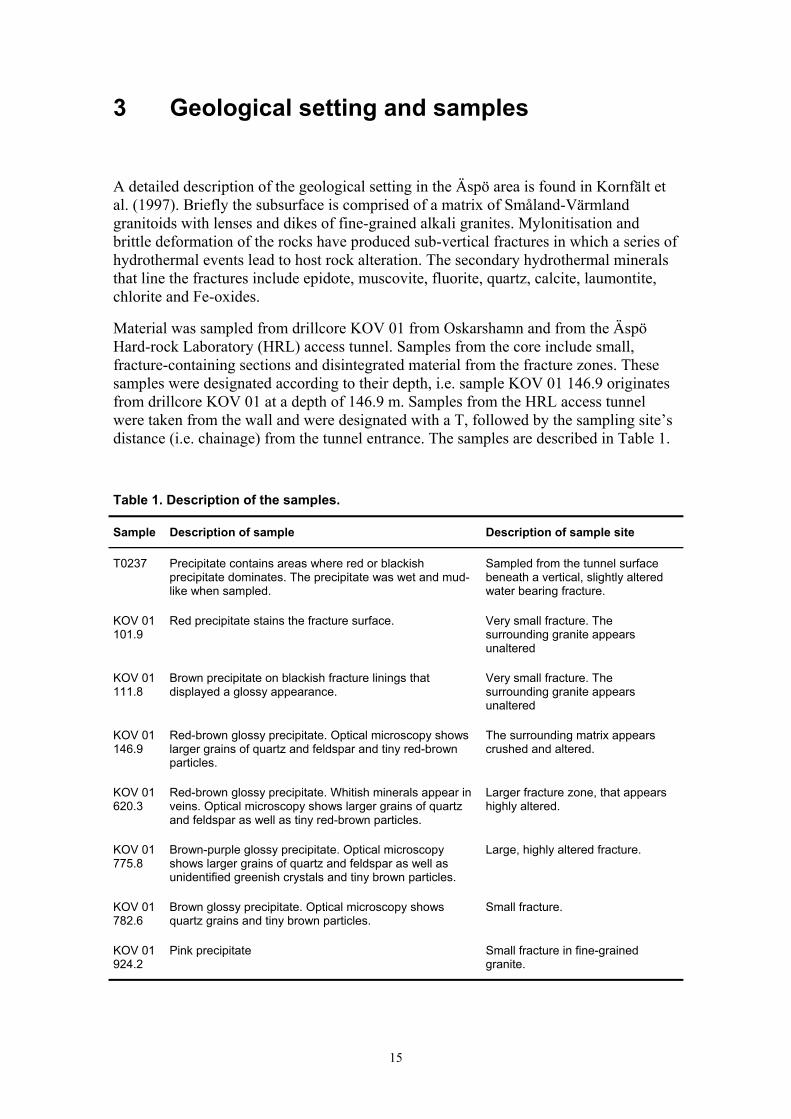
A detailed description of the geological setting in the Äspö area is found in Kornfält et al. (1997). Briefly the subsurface is comprised of a matrix of Småland-Värmland granitoids with lenses and dikes of fine-grained alkali granites. Mylonitisation and brittle deformation of the rocks have produced sub-vertical fractures in which a series of hydrothermal events lead to host rock alteration. The secondary hydrothermal minerals that line the fractures include epidote, muscovite, fluorite, quartz, calcite, laumontite, chlorite and Fe-oxides.
Material was sampled from drillcore KOV 01 from Oskarshamn and from the Äspö Hard-rock Laboratory (HRL) access tunnel. Samples from the core include small, fracture-containing sections and disintegrated material from the fracture zones. These samples were designated according to their depth, i.e. sample KOV 01 146.9 originates from drillcore KOV 01 at a depth of 146.9 m. Samples from the HRL access tunnel were taken from the wall and were designated with a T, followed by the sampling site’s distance (i.e. chainage) from the tunnel entrance. The samples are described in Table 1.
Table 1. Description of the samples.
Sample Description of sample Description of sample site
T0237 Precipitate contains areas where red or blackish precipitate dominates. The precipitate was wet and mud-like when sampled.
Sampled from the tunnel surface beneath a vertical, slightly altered water bearing fracture.
KOV 01 101.9
Red precipitate stains the fracture surface. Very small fracture. The surrounding granite appears unaltered
KOV 01 111.8
Brown precipitate on blackish fracture linings that displayed a glossy appearance.
Very small fracture. The surrounding granite appears unaltered
KOV 01 146.9
Red-brown glossy precipitate. Optical microscopy shows larger grains of quartz and feldspar and tiny red-brown particles.
The surrounding matrix appears crushed and altered.
KOV 01 620.3
Red-brown glossy precipitate. Whitish minerals appear in veins. Optical microscopy shows larger grains of quartz and feldspar as well as tiny red-brown particles.
Larger fracture zone, that appears highly altered.
KOV 01 775.8
Brown-purple glossy precipitate. Optical microscopy shows larger grains of quartz and feldspar as well as unidentified greenish crystals and tiny brown particles.
Large, highly altered fracture.
KOV 01 782.6
Brown glossy precipitate. Optical microscopy shows quartz grains and tiny brown particles.
Small fracture.
KOV 01 924.2
Pink precipitate Small fracture in fine-grained granite.

16
17
4 Methods
Several bulk and surface-sensitive analytical techniques were used on the samples to determine mineral identity and chemical composition of the fracture material. Selected X-ray powder diffraction (XRPD) data were treated with Rietveld refinement to determine crystal lattice parameters and atomic force microscopy (AFM) was used to observe particle morphology on bulk samples.
The possibility of separating the Fe-oxides mechanically was investigated. Approximately 200 mg of sample was gently crushed in a weighing paper to separate weakly cemented grains. The material was then put into a centrifuge flask containing methylene iodine (ρ=3.31 g/cm3) and centrifuged. The material was separated into three fractions: A heavy, a light and a fraction whose surface tension was so high that it could not break the solution meniscus and remained floating on top. The mineral identity of the fractions was identified with XRPD.
The possibility of chemically separating the Fe-oxides was also examined. The selectivity of a range of dissolving agents was tested on pure crushed specimens of hematite, chlorite and microcline. The dissolution experiments were performed in agitated screw-capped glass containers, with temperatures ranging from 55º C to 80º C. After exposure for the decided time interval, the solutions were centrifuged and the supernatants were analysed for Fe and Al with Atomic Absorption Spectroscopy (AAS). All glassware used for the experiments was soaked in 10% HNO3 overnight and rinsed by standard washing procedures.
Using the most promising of the tested dissolving agents, the Fe, trace element and light rare earth elements (LREEs, La-Eu) composition of the Äspö Fe-oxides was examined by analysing the supernatant with atomic absorption spectroscopy (AAS) and multi-collector inductively coupled plasma mass spectroscopy (MC-ICP-MS). We chose to analyse only the LREEs because of the limited time available and because a preliminary analysis for all REEs of sample KOV 01 146.9 and KOV 01 620.3 showed that variations in LREEs were greatest. The dissolution experiments were performed on bulk samples and on sample fractions that had been mechanically separated by heavy liquid separation. The extent of dissolution was monitored with XRPD.
X-ray powder diffraction (XRPD) was used to determine mineral structure. The technique relies on the scattering that results when incident X-rays accelerate orbital electrons in the sample. When electrons in a structured material are accelerated, the lattice planes lead to positive interference, if the conditions of Bragg's Law:
nλd
= 2sinθ
are met. Bragg's Law specifies that the production of diffracted beams of significant intensities (reflections) depends on the angle between the incident beam and the surface (θ), the separation of the lattice planes (d), the wave length of the incident beam (λ) and the reflection order (n). XRD data are often presented as patterns showing the intensity
18
of the reflection as a function of d. Plotting d as the x-axis value and intensity on the y-axis produces patterns that can be compared directly, even when the data have been obtained with X-ray sources of different wavelengths.
XRPD was performed on a Philips PW 3710 using CuKα radiation and a graphite monochromator. Based on the Bragg-Bretano principle, the Philips PW 3710 radiation is highly focused, ensuring a minimum of peak broadening. For XRPD where sufficient amounts of material were available (~ 50 mg), the samples were crushed to ensure fairly homogeneous crystallite size and mounted on quartz plates with silicon grease. For XRPD of minute amounts of sample (~ 2 mg), the crushed material was suspended in ethanol and drops of the suspension were put on the quartz plates and allowed to dry. This procedure often leads to preferred orientation of platy grains, giving patterns where relative peak intensity does not match the standard index sample, but where plane spacing (d) can be useful for mineral identification. For one sample, filter paper containing fine-grained material was also mounted on a quartz plate using double-sided tape.
Very small quantities of sample were analysed on a Bruker AXS Smart 1K CCD using MoKα radiation and a graphite monochromator. The crushed material was transferred to capillary tubes, which were mounted for XRPD employing a four-circle goniometer. The naturally present quartz in the samples was used as an internal standard to calibrate the X-ray diffractograms. Using capillary tubes, XRPD could be performed on samples containing as little as ~ 0.5 mg of material. By this method, however, the peaks of the X-ray diffractogram are considerably broadened in comparison to the patterns of the Philips PW 3710. Compared to the quartz-plate method, the capillary method also produces patterns where the intensities of high d-value peaks are larger relative to low value peaks.
Rietveld refinement finds a fit of an X-ray diffractogram using pure phase models. It was used to precisely determine the a-axis dimension in the hematite unit cell. In the process, a range of parameters of the model phases, such as crystallite size and unit cell dimensions, are adjusted to provide the best agreement with the data. As is the case for all modelling, it is imperative to evaluate the fitted parameters carefully to ensure that the modelling does not produce nonsense. The refinements of the X-ray diffractograms were performed using the TOPAS, version 2 software, and patterns for pure phases were taken from the Inorganic Crystal Structure Database, Fachsinformationzentrum, Karlsruhe.
X-ray photoelectron spectroscopy (XPS) is a near-surface sensitive technique that uses an X-ray beam to eject electrons from a sample and measures their escape energy. Escape energy depends on the elemental and orbital origin of the ejected electron and information comes from a depth of less than the top 10 nm. The absolute intensity of the peaks on spectra (y-axis) does not reflect element surface concentrations directly, because photoelectron-escape probability is related the original binding energy and the nature of the element's bonds within the solid. However, the relative intensities of peaks of one sample can be compared to the relative intensities of another. XPS was conducted on a Kratos instrument using an AlKα1 source. Chips of fracture material were mounted whole on the sample holder in order to determine relative concentrations of trace components in the top few atomic layers of the fracture linings.
19
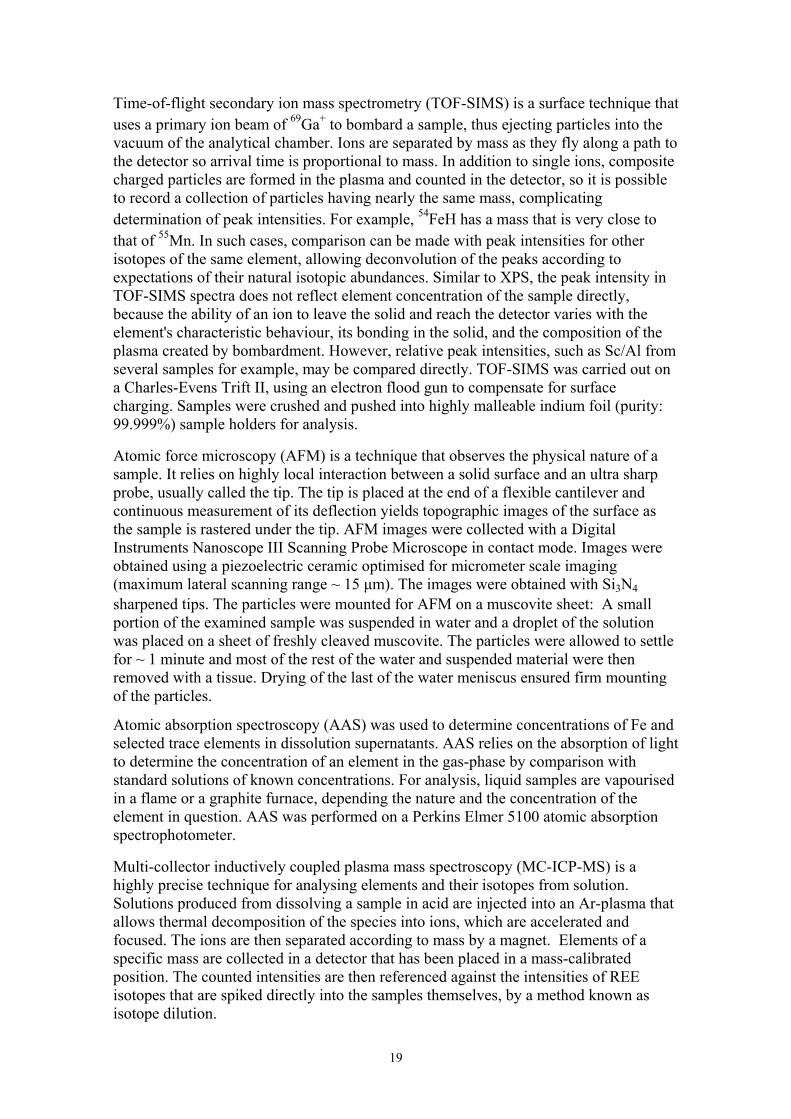
Time-of-flight secondary ion mass spectrometry (TOF-SIMS) is a surface technique that uses a primary ion beam of 69Ga+ to bombard a sample, thus ejecting particles into the vacuum of the analytical chamber. Ions are separated by mass as they fly along a path to the detector so arrival time is proportional to mass. In addition to single ions, composite charged particles are formed in the plasma and counted in the detector, so it is possible to record a collection of particles having nearly the same mass, complicating determination of peak intensities. For example, 54FeH has a mass that is very close to that of 55Mn. In such cases, comparison can be made with peak intensities for other isotopes of the same element, allowing deconvolution of the peaks according to expectations of their natural isotopic abundances. Similar to XPS, the peak intensity in TOF-SIMS spectra does not reflect element concentration of the sample directly, because the ability of an ion to leave the solid and reach the detector varies with the element's characteristic behaviour, its bonding in the solid, and the composition of the plasma created by bombardment. However, relative peak intensities, such as Sc/Al from several samples for example, may be compared directly. TOF-SIMS was carried out on a Charles-Evens Trift II, using an electron flood gun to compensate for surface charging. Samples were crushed and pushed into highly malleable indium foil (purity: 99.999%) sample holders for analysis.
Atomic force microscopy (AFM) is a technique that observes the physical nature of a sample. It relies on highly local interaction between a solid surface and an ultra sharp probe, usually called the tip. The tip is placed at the end of a flexible cantilever and continuous measurement of its deflection yields topographic images of the surface as the sample is rastered under the tip. AFM images were collected with a Digital Instruments Nanoscope III Scanning Probe Microscope in contact mode. Images were obtained using a piezoelectric ceramic optimised for micrometer scale imaging (maximum lateral scanning range ~ 15 μm). The images were obtained with Si3N4 sharpened tips. The particles were mounted for AFM on a muscovite sheet: A small portion of the examined sample was suspended in water and a droplet of the solution was placed on a sheet of freshly cleaved muscovite. The particles were allowed to settle for ~ 1 minute and most of the rest of the water and suspended material were then removed with a tissue. Drying of the last of the water meniscus ensured firm mounting of the particles.
Atomic absorption spectroscopy (AAS) was used to determine concentrations of Fe and selected trace elements in dissolution supernatants. AAS relies on the absorption of light to determine the concentration of an element in the gas-phase by comparison with standard solutions of known concentrations. For analysis, liquid samples are vapourised in a flame or a graphite furnace, depending the nature and the concentration of the element in question. AAS was performed on a Perkins Elmer 5100 atomic absorption spectrophotometer.
Multi-collector inductively coupled plasma mass spectroscopy (MC-ICP-MS) is a highly precise technique for analysing elements and their isotopes from solution. Solutions produced from dissolving a sample in acid are injected into an Ar-plasma that allows thermal decomposition of the species into ions, which are accelerated and focused. The ions are then separated according to mass by a magnet. Elements of a specific mass are collected in a detector that has been placed in a mass-calibrated position. The counted intensities are then referenced against the intensities of REE isotopes that are spiked directly into the samples themselves, by a method known as isotope dilution.

20
To ensure spike equilibration, the spiked aliquots are evaporated to dryness and converted from Cl-salts into NO3-salts by dissolution of the evaporated residues first in 6 M HCl/concentrated HNO3 and then concentrated HNO3. The NO3-salts are converted back to Cl salts by dissolution in 6 M HCl. Finally the Cl-salts are dissolved in 2 M HCl. To minimise isobaric interferences of matrix elements on the analyte signals, cation exchange was performed before analysis using 100-200 mesh AG50W-x8 resin.
MC-ICP-MS was performed on a Thermoelemental AXIOM. All dissolution preparation steps prior to analysis were carried out in a clean laboratory in carefully cleaned teflon vessels. More details about MC-ICP-MS, spiking procedure and chemical separation can be found in Baker et al. (2002).
21
5 Materials
The hematite and chlorite pure mineral specimens used for evaluation of the selective dissolution procedure were obtained from the Geological Museum, Copenhagen University; microcline was received as a gift from Tonci Zunic-Balic, Geological Institute. X-ray diffractograms of the chlorite and microcline showed the expected reflections. In the X-ray diffractogram of hematite, the major reflections were typical of hematite but very small peaks, representing goethite and magnetite, were also present. The amount of goethite and magnetite was deemed to be insignificant for the dissolution experiments.
Experiments to test the selective dissolution procedure were performed with a range of agents. Tamm’s reagent (Tamm, 1922) is often used to dissolve crystalline Fe-oxides in selective dissolution procedures for soil material (e.g. Trolard et al., 1995). Tamm’s reagent is composed of 0.175 M ammonium oxalate and 0.1 M oxalic acid (pH=3.5). In addition, the dissolution selectivity of 0.175 M ammonium oxalate alone (pH=6.7) was tested.
The siderophore, Desferrioxamine B (DFOB), is released by bacteria to enhance dissolution of Fe(III)-bearing minerals. Laboratory experiments have shown that DFOB concentrations as low as 250 μM accelerate the dissolution of Fe-oxides (Cervina-Silva and Sposito, 2002). Solutions with DFOB concentrations of 16 and 32 mM were used in the experiments and pH was adjusted to 7 or 9 with 1 M NaOH. In one set of experiments, the DFOB solutions were bubbled with N2 to minimise Fe(II) oxidation both before and after the addition of the solids.
Ascorbic acid is known to reductively dissolve hematite at a rate that exceeds that of oxalate (Banwart et al., 1989). Because ascorbic acid is a reducing agent, the dissolution of Fe(III)-bearing phases is expected to be favoured over Fe(II)-bearing phases, such as chlorite. Although ascorbic acid looses its reductive potential after prolonged exposure to oxygen in open air and light, the decrease in potency during the 18-hour experiment in closed bottles is considered negligible. The dissolution experiments were carried out with 0.1 M ascorbic acid (pH=2.8).
Acetyl acetone forms very stable complexes with Fe(III) and the ligand may thus be able to selectively extract Fe. A concentration of 0.1 M acetyl acetone was used in the dissolution experiments (pH=6.5).
Selective dissolution was also tested using 6 M HCl, which is often used to dissolve crystalline Fe-oxides.
Except for DFOB, all reagents used to test dissolution selectivity were of analytical quality. The DFOB was obtained from Ciba-Geigy (Desferal). The 6 M HCl, 2 M HCl and concentrated HNO3 used in dissolution of material for MC-ICP-MS REE analysis and in the spiking preparation steps were ultra-pure, commercially available products, ensuring a minimum of contamination of the samples. Deionised water with a resistivity less than 0.1 µS/cm was used for making all solutions.

22
23
6 Results and discussion
6.1 Characteristics of bulk samples Sample T0237 XRPD was performed on freshly precipitated material sampled from the Äspö underground laboratory access tunnel from near an active flowing fracture. The diffractogram showed two weak and very broad reflections at 2θ ~ 37º and 2θ ~ 66º (Fig. 1a), characteristic for 2-line ferrihydrite. This phase is near-amorphous, meaning that the very small particles are atomically ordered only over distances near or below the X-ray wavelength. Ferrihydrite is the Fe-phase that usually forms rapidly when Fe2+ bearing fluid meets an oxic environment.
Sample KOV 01 101.9 The tiny amount of material that could be scraped from the red-stained areas on sample KOV 01 101.9 allowed only XRPD with a capillary tube. The X-ray diffractogram shows major peaks representing quartz, K-feldspar and Fe-bearing clay, as well as minor peaks that may represent hematite (Fig. 1b). The broad peaks in the capillary tube diffractogram do not allow exact identification of the clay minerals. They may represent chlorite or nontronite, an Fe-Si clay, with no or little Al. Considering that the material was precipitated directly on feldspar, it is difficult to understand how an Al-poor clay could result. However, further analysis on a larger sample would be needed to define it with confidence.
Sample KOV 01 111.8 Material scraped from the fracture was suspended in ethanol and mounted on a quartz plate for XRPD. The diffractogram displays peaks typical of chlorite, calcite and quartz, in addition to peaks and background stemming from the sample holder (Fig. 1c).
Because the peaks and background originating from the sample holder may conceal reflections, material was also analysed using XRPD in capillary tubes, where the intensities of reflections with high d-values are enhanced. Fig. 1d shows peaks representing chlorite, calcite and quartz, in addition to minor peaks that may originate from lepidocrocite (δ-FeOOH). However, lepidocrocite peaks are not visible in the quartz plate diffractogram, indicating that the phase is present in amounts ≤ 2%. The sample is brownish, so we expect some form of Fe-oxide. An alternative explanation is that the Fe is present as X-ray amorphous Fe-oxides such as ferrihydrite.
The presence of lepidocrocite or X-ray amorphous Fe-oxide is particularly interesting because these minerals often form during low-temperature oxidation. Thus the possibility that lepidocrocite or X-ray amorphous Fe-oxide is present in the sample should be investigated further. It may indicate oxic conditions at a depth of 111.8 m for a period of time.

24
a
b
c
d
Figure 1. XRPD data from: a) sample T0237, b) KOV 01 101.9, obtained in capillary tube, c) sample KOV 01 111.8, on quartz plate, and d) sample KOV 01 111.8, capillary tubes. Q: quartz; H: hematite; F: feldspar; C: Fe-clay, probably chlorite; Ca: calcite; L: lepidocrocite; SH: peaks from the samples holder.
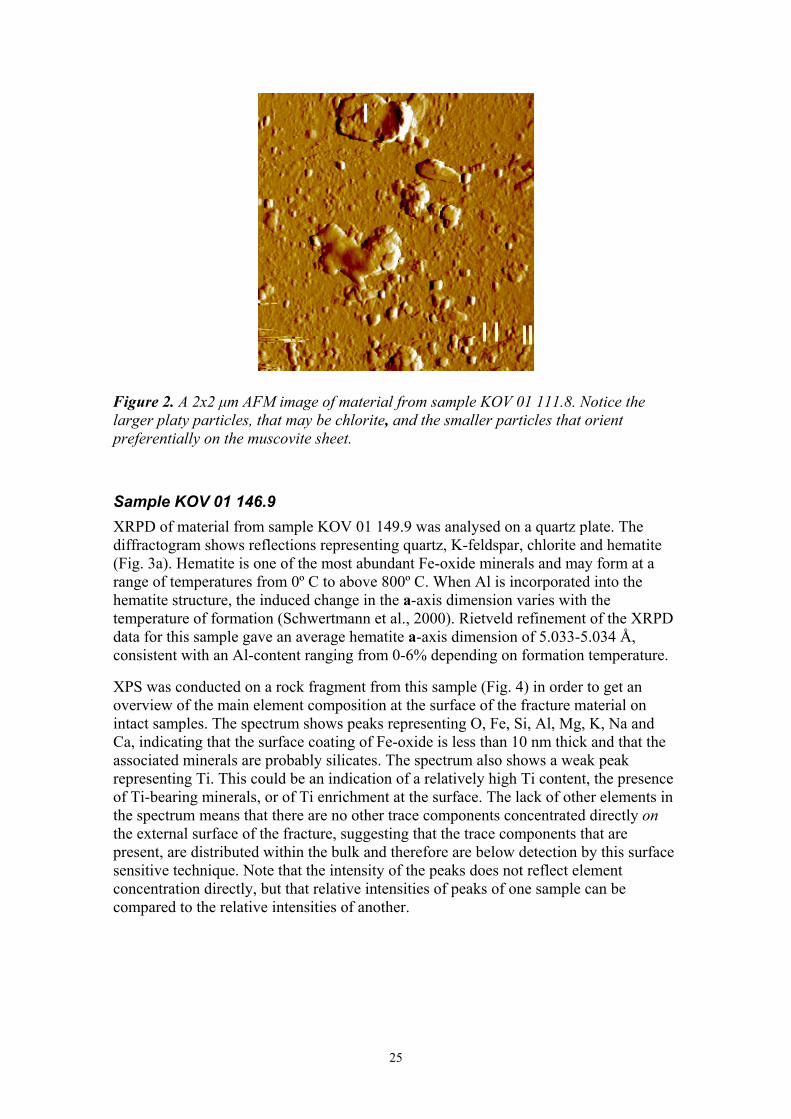
An AFM sample was prepared by suspending a bit of dust from the fracture into water, and then putting a droplet onto a muscovite plate. AFM images show particles with sizes ranging from ~ 30 nm to ~ 600 nm (Fig. 2). The larger particles clearly exhibit a plate-like crystalline form (I), consistent with the morphology of chlorite. The smaller particles display a very simple prismatic form (II) and a preferred orientation on the muscovite sheet. This is a feature that is often observed for crystalline material deposited on muscovite. As the particles settle, they orient themselves so that their crystal lattice fits best over that of the muscovite.
d - Scale210 345
CC
F F
CQ
F
Q
FC F H
QF
HQ Q Q
LL
LL LL
L L
C+F
SH
SH
Ca
Ca
Ca
25
Figure 2. A 2x2 μm AFM image of material from sample KOV 01 111.8. Notice the larger platy particles, that may be chlorite, and the smaller particles that orient preferentially on the muscovite sheet.
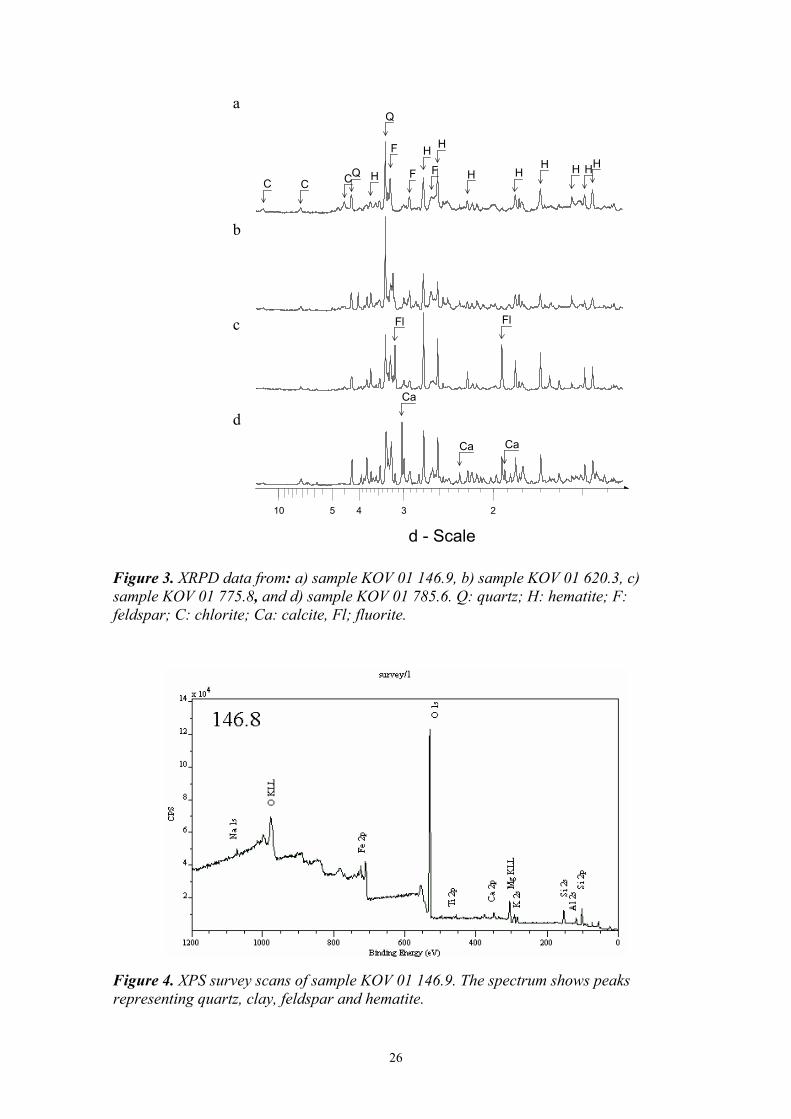
Sample KOV 01 146.9 XRPD of material from sample KOV 01 149.9 was analysed on a quartz plate. The diffractogram shows reflections representing quartz, K-feldspar, chlorite and hematite (Fig. 3a). Hematite is one of the most abundant Fe-oxide minerals and may form at a range of temperatures from 0º C to above 800º C. When Al is incorporated into the hematite structure, the induced change in the a-axis dimension varies with the temperature of formation (Schwertmann et al., 2000). Rietveld refinement of the XRPD data for this sample gave an average hematite a-axis dimension of 5.033-5.034 Å, consistent with an Al-content ranging from 0-6% depending on formation temperature.
XPS was conducted on a rock fragment from this sample (Fig. 4) in order to get an overview of the main element composition at the surface of the fracture material on intact samples. The spectrum shows peaks representing O, Fe, Si, Al, Mg, K, Na and Ca, indicating that the surface coating of Fe-oxide is less than 10 nm thick and that the associated minerals are probably silicates. The spectrum also shows a weak peak representing Ti. This could be an indication of a relatively high Ti content, the presence of Ti-bearing minerals, or of Ti enrichment at the surface. The lack of other elements in the spectrum means that there are no other trace components concentrated directly on the external surface of the fracture, suggesting that the trace components that are present, are distributed within the bulk and therefore are below detection by this surface sensitive technique. Note that the intensity of the peaks does not reflect element concentration directly, but that relative intensities of peaks of one sample can be compared to the relative intensities of another.
26
a
b
c
d
Figure 3. XRPD data from: a) sample KOV 01 146.9, b) sample KOV 01 620.3, c) sample KOV 01 775.8, and d) sample KOV 01 785.6. Q: quartz; H: hematite; F: feldspar; C: chlorite; Ca: calcite, Fl; fluorite.
Figure 4. XPS survey scans of sample KOV 01 146.9. The spectrum shows peaks representing quartz, clay, feldspar and hematite.
d - Scale210 345
Ca
Fl
C C
Q
CQ H
HF
F F
H
HHHH
Fl
H
Ca
H
Ca

27
TOF-SIMS analysis was carried out on crushed material from sample KOV 01 146.9 to characterise the main and trace element content. Crushing leads to partial disintegration of the mineral grains, decreasing surface sensitivity but enhancing the collection of information representing the fracture material’s bulk. Figure 5 shows a positive mass spectrum for peaks representing the main elements. Similar to XPS, the peak intensity in the TOF-SIMS spectra does not reflect element concentration directly. However, relative peak intensities (i.e. peak intensity ratios of two masses) from different samples may be compared. The intensity of peaks representing trace elements is small relative to the major elements, so that they are not visible on the intensity scale used for printing Figure 5, but enlargement allows determination of peak intensities for V, Mn, Ti and Zn to be seen (Fig. 6).
Figure 5. TOF-SIMS overview spectrum of sample KOV 01 146.9, showing the main element peaks.
Figure 6. TOF-SIMS higher resolution spectrum of sample KOV 01 146.9 showing the trace elements in the 48-55 mass region. The peaks with a value slightly higher than the integer value for atomic mass (such as at 51, 54 and 55) represent fragments of organic molecules.

28
Although 54FeH clusters are formed in the plasma and are counted in the detector at a mass very close to that of 55Mn, the signal at mass 55 can be assigned with confidence by comparison to peaks for the other Fe stable isotopes. The intensity of the peak at mass 56, which almost entirely represents 56Fe, and that at mass 57, which represents both 57Fe and 56Fe + H, have a ratio of ~ 5:1, suggesting that the FeH cluster is of minor importance to the intensity in the mass region where Mn is found. Thus, Mn is present at the surface of the fracture.
Crushed material from sample KOV 01 146.9 was also exposed to heavy-liquid separation. The separation yielded a light and a heavy fraction, as well as a very fine-grained fraction whose surface tension and density caused it to remain on top of the capillary fringe. The individual grains in the light and heavy fractions were observable with a binocular microscope; both fractions were composed of anhedral single-phase grains and granite rock-fragments. XRPD (Fig. 7) of the three fractions showed that: 1) The very fine-grained fraction contained quartz, feldspar, chlorite and minor amounts of hematite. The chlorite was clearly enriched in this fraction compared to the bulk samples. 2) The light fraction consisted of quartz and minor amounts of K-feldspar and chlorite. 3) The heavy fraction consisted of hematite and a small quantity of titanite (CaTiO(SiO4)) that is probably responsible for the observed Ti-peaks in both XPS and TOF-SIMS.
a
b
c
Figure 7. XPRD from a) the heavy fraction, b) the light fraction and c) the fine-grained fraction of sample KOV 01 146.9. Notice that the fine-grained fraction was mounted on paper, yielding a significant background. Q: quartz; H: hematite; F: feldspar; C: chlorite; T: titanite; SH: peaks resulting from the sample holder; PB: background resulting from the filter paper.
d - Scale210 345
T
TT
T
SHSH
Q
QQQ
PB
HH
H
H
H
H
HH
H
F
F
FFC C
?F
QH
29
It is interesting that hematite is present as larger grains as well as fine grains. Higher temperature favours formation of larger crystals. It is likely that the larger crystals formed at higher temperature, whereas the smaller crystals formed later, at lower temperature.
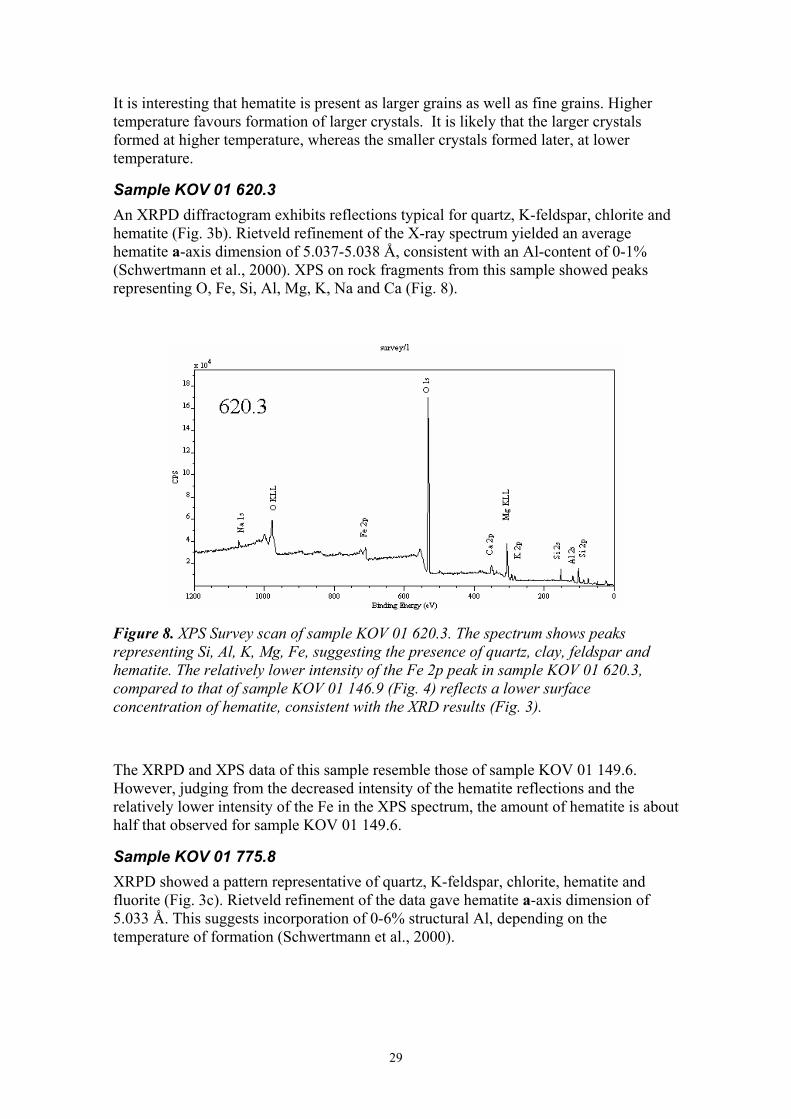
Sample KOV 01 620.3 An XRPD diffractogram exhibits reflections typical for quartz, K-feldspar, chlorite and hematite (Fig. 3b). Rietveld refinement of the X-ray spectrum yielded an average hematite a-axis dimension of 5.037-5.038 Å, consistent with an Al-content of 0-1% (Schwertmann et al., 2000). XPS on rock fragments from this sample showed peaks representing O, Fe, Si, Al, Mg, K, Na and Ca (Fig. 8).
Figure 8. XPS Survey scan of sample KOV 01 620.3. The spectrum shows peaks representing Si, Al, K, Mg, Fe, suggesting the presence of quartz, clay, feldspar and hematite. The relatively lower intensity of the Fe 2p peak in sample KOV 01 620.3, compared to that of sample KOV 01 146.9 (Fig. 4) reflects a lower surface concentration of hematite, consistent with the XRD results (Fig. 3).
The XRPD and XPS data of this sample resemble those of sample KOV 01 149.6. However, judging from the decreased intensity of the hematite reflections and the relatively lower intensity of the Fe in the XPS spectrum, the amount of hematite is about half that observed for sample KOV 01 149.6.
Sample KOV 01 775.8 XRPD showed a pattern representative of quartz, K-feldspar, chlorite, hematite and fluorite (Fig. 3c). Rietveld refinement of the data gave hematite a-axis dimension of 5.033 Å. This suggests incorporation of 0-6% structural Al, depending on the temperature of formation (Schwertmann et al., 2000).
30
Sample KOV 01 782.6 The mineral assemblage was determined with XRPD (Fig. 3d). The diffraction data show reflections representing quartz, K-feldspar, chlorite, hematite, fluorite and calcite. Rietveld refinement of the XRPD-spectrum yielded an average hematite a-axis dimension of ~ 5.034 Å, which suggests that the hematite structure contains 0-6% Al, depending on the genesis temperature (Schwertmann et al., 2000).
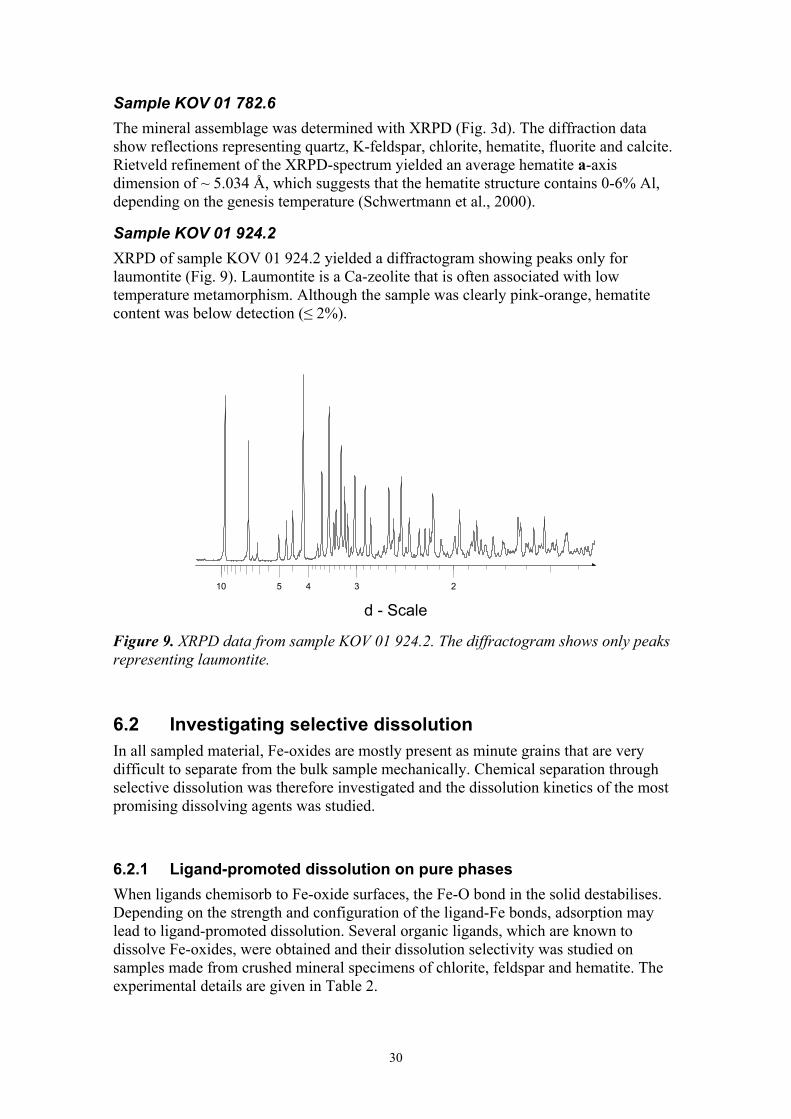
Sample KOV 01 924.2 XRPD of sample KOV 01 924.2 yielded a diffractogram showing peaks only for laumontite (Fig. 9). Laumontite is a Ca-zeolite that is often associated with low temperature metamorphism. Although the sample was clearly pink-orange, hematite content was below detection (≤ 2%).
d - Scale210 345
Figure 9. XRPD data from sample KOV 01 924.2. The diffractogram shows only peaks representing laumontite.
6.2 Investigating selective dissolution In all sampled material, Fe-oxides are mostly present as minute grains that are very difficult to separate from the bulk sample mechanically. Chemical separation through selective dissolution was therefore investigated and the dissolution kinetics of the most promising dissolving agents was studied.
6.2.1 Ligand-promoted dissolution on pure phases When ligands chemisorb to Fe-oxide surfaces, the Fe-O bond in the solid destabilises. Depending on the strength and configuration of the ligand-Fe bonds, adsorption may lead to ligand-promoted dissolution. Several organic ligands, which are known to dissolve Fe-oxides, were obtained and their dissolution selectivity was studied on samples made from crushed mineral specimens of chlorite, feldspar and hematite. The experimental details are given in Table 2.

31
Table 2. Conditions for agents used in selective dissolution experiments.
Agent Concentration Solid/solution ratio
Temperature Exposure time
DFOB, pH 9 32 mM 25 mg/5 mL 55º C 22 h
DFOB, pH 7, N2-bubbled 16 mM 15 mg/5 mL 55º C 21 h
Ammonium oxalate + oxalic acid (Tamm’s reagent)
0.175 M ammonium oxalate + 0.1 M oxalic acid
25 mg/ 5mL 55º C 20 h
Ammonium oxalate 0.1 M 25 mg/ 5mL 55º C 20 h
Acetyl acetone 0.1 M 25 mg/ 15 mL 55º C 18 h
Ascorbic acid 0.1 M 25 mg/ 15 mL 55º C 18 h
The supernatants from the dissolution experiments were analysed for Fe and Al with AAS. To give an impression of the relative selectivity of each ligand during dissolution, the Fe-concentrations measured in hematite dissolution batches are shown in Figure 10 as ratios with the Al-concentrations measured in chlorite and microcline dissolution batches.
b)
0
1
2
3
4
5
6
7
8
Acetylacetone
Ammoniumoxalate
Tammsreagent
DFOB, pH 9 DFOB, pH 7,N2
AscorbicAcid
Fe-H
em/A
l-Fsp
ar
Figure 10. Fe-concentrations measured in hematite dissolution batches shown as ratios with the Al-concentrations measured in a) chlorite and b) microcline dissolution batches.
Higher ratios suggest less dissolution of the unwanted phases. It is evident that the investigated ligands are not particularly selective in their dissolution of Fe-oxides. Although a significant amount of hematite was dissolved, the dissolution especially of chlorite was very extensive. Only ascorbic acid shows some preference for dissolving Fe-oxides over chlorite and microcline.
The DFOB promoted dissolution of chlorite is higher in the experiment performed at pH 9, than in the experiment performed at pH 7 using N2 bubbled solutions. Knowing that DFOB complexes preferentially with Fe(III) over Fe(II) (Anderegg et al., 1963), this may suggest that the dissolution of chlorite by DFOB is preceded by oxidation of surface Fe(II) to Fe(III).
a)
00,20,40,60,8
11,21,41,6
Acetyl acetone Ammoniumoxalate
Tamms reagent DFOB, pH 9 DFOB, pH 7, N2 Ascorbic Acid
Fe-H
em/A
l-Chl
32
A pH drop from 6.5 to 2.9 was observed in the solution with acetyl acetone and chlorite just after addition of solid. This indicates a very rapid reaction of the ligand with the surface. The pH drop may be associated with two reactions:
1. The adsorption of acetyl acetone (C5O2H8) to cation surface sites (≡ MeOH):
≡MeOH + C5O2H8 ≡MeO- C5O2H8 + H+
2. The formation of solution complexes with cations, following the general reaction:
Me + C5O2H8 Me-C5O2H8 + H+
6.3 Dissolution rates using selected agents The dissolution kinetics of 6 M HCl and the most promising of the organic ligands, ascorbic acid, was investigated on samples of hematite, chlorite and microcline, as well as on sample KOV 01 146.9, to see if the dissolution rate of the phases would allow discrimination of the Fe-oxide chemical composition, such as for example, if dissolution of hematite initially dominates the leaching. The aim was to test for the most effective period for exposure.
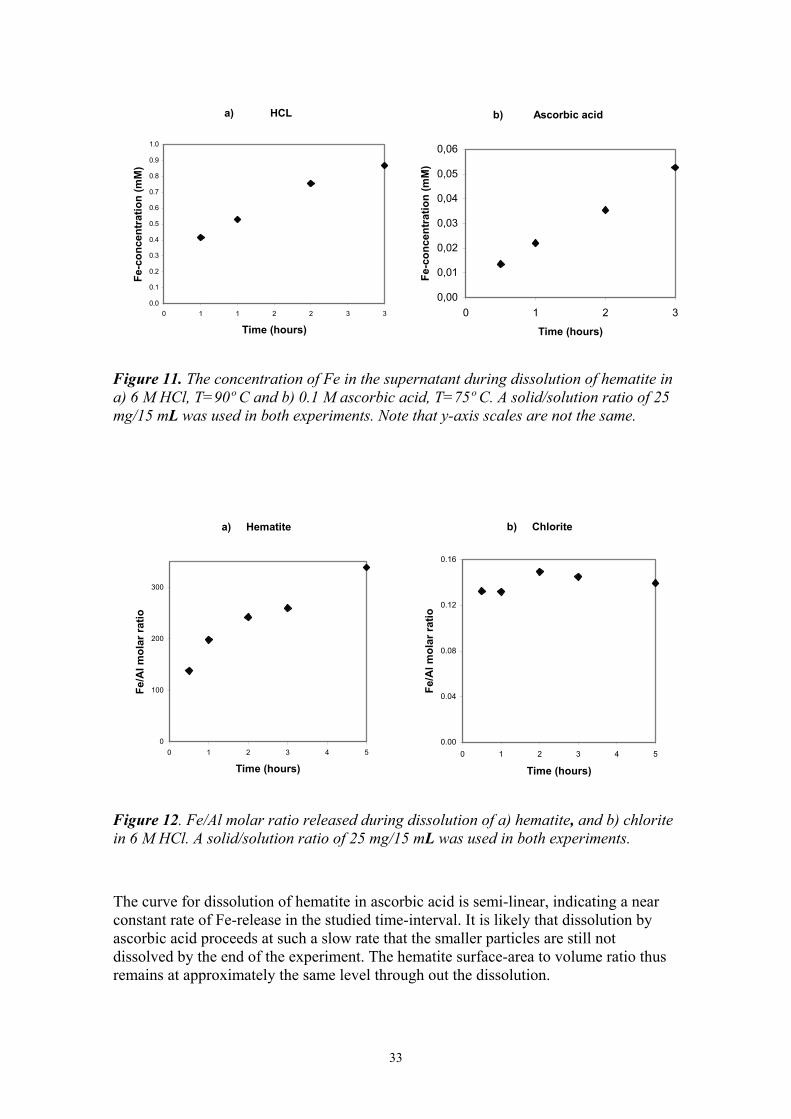
The Fe-concentration of the supernatant in batch experiments with hematite was tested to probe the extent of dissolution (Fig. 11). It is evident that the dissolution rate of hematite in the HCl solution is significantly higher than that in the ascorbic acid solution.
The trend for the dissolution of hematite in the HCl solution is slightly curved, indicating a higher Fe-release rate in the beginning of the experiment. The uncertainty of the analytical procedure (~ 20%) does not explain the observed trend. The decrease in Fe-release towards the end of the experiment may be caused by increased saturation with respect to hematite in the solution. However, thermodynamic calculations, using the geochemical modelling code PHREEQC (Parkhurst and Appelo, 1999) show that hematite is greatly undersaturated at the solution conditions at the end of the experiments. The large initial Fe release probably originates from size variations in the dissolving hematite particles. Dissolution is a surface process and depends on particle size and morphology. Smaller hematite particles, with larger surface area to volume ratio, thus dissolve more rapidly, yielding a high initial Fe-release rate. As the smaller particles become digested, the hematite surface-area to volume ratio decreases and the Fe-release rates also decrease.
33
a) HCL
0.0
0.1
0.2
0.3
0.4
0.5
0.6
0.7
0.8
0.9
1.0
0 1 1 2 2 3 3
Time (hours)
Fe-c
once
ntra
tion
(mM
)
Figure 11. The concentration of Fe in the supernatant during dissolution of hematite in a) 6 M HCl, T=90º C and b) 0.1 M ascorbic acid, T=75º C. A solid/solution ratio of 25 mg/15 mL was used in both experiments. Note that y-axis scales are not the same.
a) Hematite
0
100
200
300
0 1 2 3 4 5
Time (hours)
Fe/A
l mol
ar ra
tio
b) Chlorite
0.00
0.04
0.08
0.12
0.16
0 1 2 3 4 5
Time (hours)
Fe/A
l mol
ar ra
tio
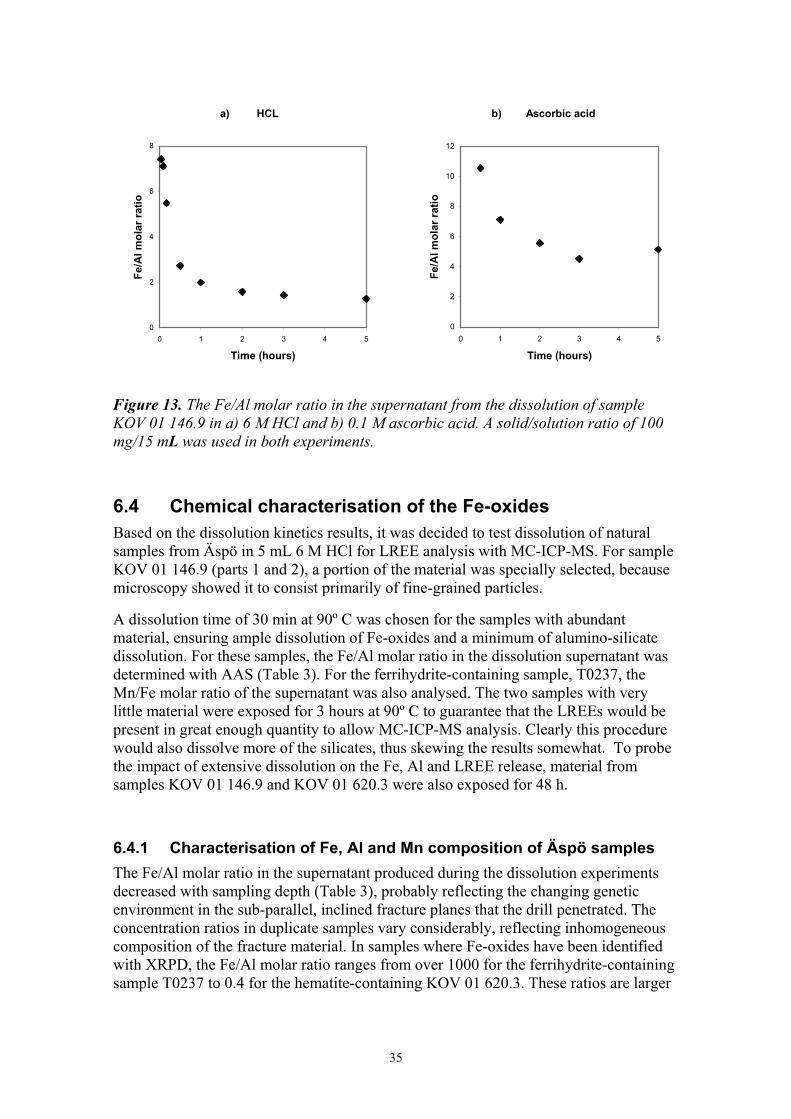
Figure 12. Fe/Al molar ratio released during dissolution of a) hematite, and b) chlorite in 6 M HCl. A solid/solution ratio of 25 mg/15 mL was used in both experiments.
The curve for dissolution of hematite in ascorbic acid is semi-linear, indicating a near constant rate of Fe-release in the studied time-interval. It is likely that dissolution by ascorbic acid proceeds at such a slow rate that the smaller particles are still not dissolved by the end of the experiment. The hematite surface-area to volume ratio thus remains at approximately the same level through out the dissolution.
b) Ascorbic acid
0,00
0,01
0,02
0,03
0,04
0,05
0,06
0 1 2 3
Time (hours)
Fe-c
once
ntra
tion
(mM
)

34
During dissolution of hematite in both 6 M HCl and 0.1 M ascorbic acid, the Fe/Al molar ratio in the supernatant increases throughout the studied interval (Fig. 12a; data only shown for HCl-experiments). The initial release of Al may result from:
• Dissolution of Al-(hydr)oxides present in tiny amounts that are not detectable by XRD.
• Release of adsorbed Al.
• Preferential dissolution of Al-containing hematite. This trend is opposite to what has been observed in goethite, where dissolution of Al-substituted goethite proceeds at a lower rate than that of pure goethite (Schwertmann, 1984).
This means that the Fe/Al molar ratio determined in the natural samples may not represent the average Al-content in hematite, but rather, the content of the most substituted of the crystals. At the same time, dissolution of chlorite and Al-(hydr)oxides and release of adsorbed Al also contribute to the determined ratio.
In the dissolution of chlorite in HCl (Fig. 12b) and ascorbic acid, the released Fe/Al molar ratio remains close to 0.14 in the studied interval. In the dissolution of natural samples, supernatant Fe/Al ratios that are significantly larger than 0.14 should thus indicate dissolution of Fe-oxides in addition to chlorite.
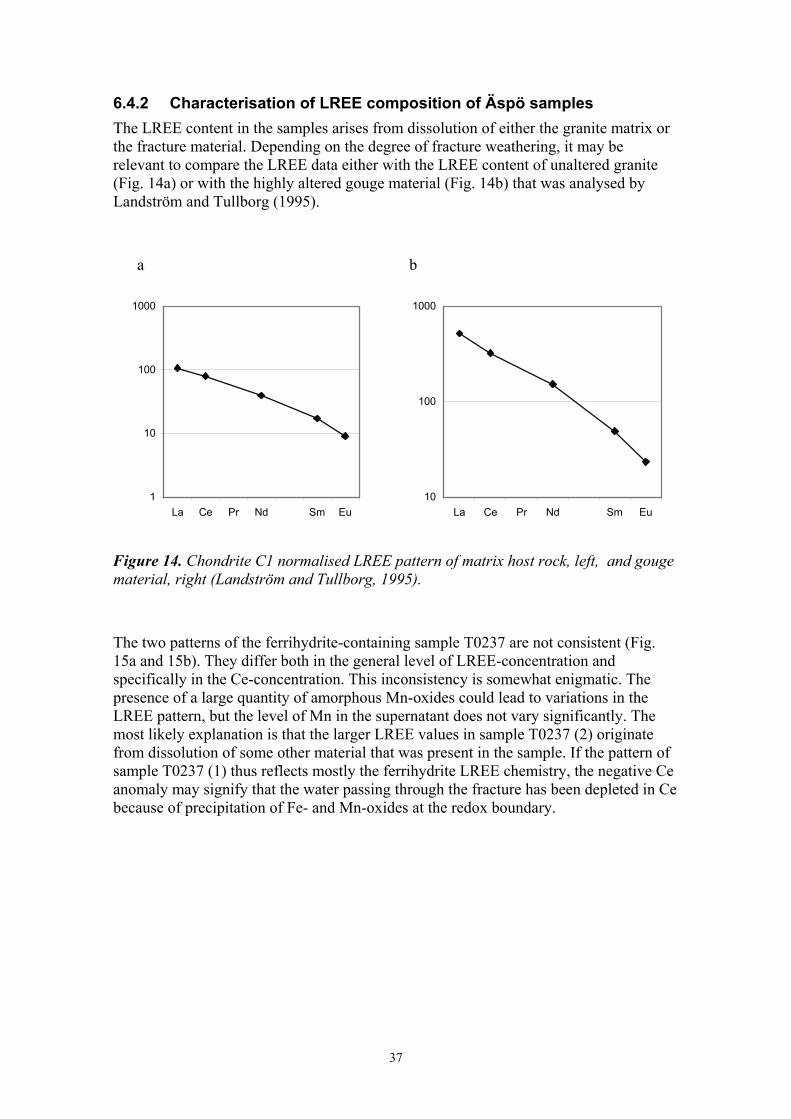
The dissolution kinetics of the two reagents was also tested on uncrushed samples from Äspö to get an indication of the behaviour of the fracture material. In the dissolution of sample KOV 01 146.9, Fe is preferentially released in the initial stages of the experiments, yielding Fe/Al molar ratios of ~8:1 for dissolution in HCl and ~11:1 for dissolution in ascorbic acid (Fig. 13). It must be noted that through out the experiment, the calculated Fe/Al molar ratio for HCl dissolution is based on Fe-concentrations that are ~ 20 times higher than those calculated for ascorbic acid. The dissolution in HCl, thus proceeds far more rapidly than in ascorbic acid. The large initial Fe release may have several causes: 1) Very tiny hematite particles, with large surface area to volume ratio, dissolve rapidly and their presence yields a high initial Fe-release rate. 2) Fe-oxides often exist as very thin coatings on larger particles. Superposition over a crystalling host with a different lattice spacing would result in a coating with an increased defect density, facilitating more rapid dissolution. 3) Finally, the presence of easily soluble ferrihydrite, undetectable to XRD, may explain the observed Fe/Al molar ratio.
35
a) HCL
0
2
4
6
8
0 1 2 3 4 5
Time (hours)
Fe/A
l mol
ar ra
tio
b) Ascorbic acid
0
2
4
6
8
10
12
0 1 2 3 4 5
Time (hours)
Fe/A
l mol
ar ra
tio
Figure 13. The Fe/Al molar ratio in the supernatant from the dissolution of sample KOV 01 146.9 in a) 6 M HCl and b) 0.1 M ascorbic acid. A solid/solution ratio of 100 mg/15 mL was used in both experiments.
6.4 Chemical characterisation of the Fe-oxides Based on the dissolution kinetics results, it was decided to test dissolution of natural samples from Äspö in 5 mL 6 M HCl for LREE analysis with MC-ICP-MS. For sample KOV 01 146.9 (parts 1 and 2), a portion of the material was specially selected, because microscopy showed it to consist primarily of fine-grained particles.
A dissolution time of 30 min at 90º C was chosen for the samples with abundant material, ensuring ample dissolution of Fe-oxides and a minimum of alumino-silicate dissolution. For these samples, the Fe/Al molar ratio in the dissolution supernatant was determined with AAS (Table 3). For the ferrihydrite-containing sample, T0237, the Mn/Fe molar ratio of the supernatant was also analysed. The two samples with very little material were exposed for 3 hours at 90º C to guarantee that the LREEs would be present in great enough quantity to allow MC-ICP-MS analysis. Clearly this procedure would also dissolve more of the silicates, thus skewing the results somewhat. To probe the impact of extensive dissolution on the Fe, Al and LREE release, material from samples KOV 01 146.9 and KOV 01 620.3 were also exposed for 48 h.
6.4.1 Characterisation of Fe, Al and Mn composition of Äspö samples The Fe/Al molar ratio in the supernatant produced during the dissolution experiments decreased with sampling depth (Table 3), probably reflecting the changing genetic environment in the sub-parallel, inclined fracture planes that the drill penetrated. The concentration ratios in duplicate samples vary considerably, reflecting inhomogeneous composition of the fracture material. In samples where Fe-oxides have been identified with XRPD, the Fe/Al molar ratio ranges from over 1000 for the ferrihydrite-containing sample T0237 to 0.4 for the hematite-containing KOV 01 620.3. These ratios are larger

36
than anticipated from dissolution of only chlorite (Fe/Al molar ratio ~ 0.14), indicating that Fe-oxides must have preferentially dissolved during acid exposure. In the light fraction of sample KOV 01 146.9, where no Fe-oxides were identified with XRPD, the Fe/Al molar ratio of 1.0 also demonstrates a significant dissolution of Fe-oxides.
Table 3. The mineral composition, acid exposure time and supernatant Fe/Al molar ratio of samples analysed for LREEs with MC-ICP-MS. A very fine-grained portion of sample KOV 01 146.9 was especially selected for the dissolution experiments.
Sample Phases detected with XRPD Fe/Al molar ratio Exposure time T0237 (1) Ferrihydrite 1992 30 min T0237 (2) Ferrihydrite 1139 30 min KOV 01 111.8 Lepidocrocite, chlorite, feldspar, quartz 4.9 3 hours KOV 01 146.9 (1) Hematite, chlorite, quartz and feldspar 9.5 30 min KOV 01 146.9 (2) Hematite, chlorite, quartz and feldspar 3.0 30 min KOV 01 146.9; light fraction
Chlorite, quartz and feldspar 1.0 30 min
KOV 01 146.9; fine grained fraction
Hematite, chlorite, quartz and feldspar 0.6 3 hours
KOV 01 146.9; extensive dissolution
Hematite, chlorite, quartz and feldspar 0.8 48 h
KOV 01 620.3 (1) Hematite, chlorite, quartz and feldspar 1.2 30 min KOV 01 620.3 (2) Hematite, chlorite, quartz and feldspar 0.40 30 min KOV 01 620.3; extensive dissolution
Hematite, chlorite, quartz and feldspar 0.9 48 h
KOV 01 924.2 (1) Laumontite 0.001 30 min KOV 01 924.2 (2) Laumontite 0.001 30 min
The Fe-concentration in the supernatant indicated that ~ 0.7 mg Fe had been released from this sample. This represents approximately 0.7% of the total sample material, suggesting that the released Fe must have originated mainly from dissolution of a solid phase and only to a minor extent from desorption. It is noteworthy, that sample KOV 01 146.9 has a very high Fe/Al molar ratio, probably reflecting the high content of fine-grained hematite. Dissolution of material from sample KOV 01 111.8 released a significant amount of Fe (Fe/Al molar ratio: 4.9), despite the fact that large amounts of Fe-oxides had not been identified with XRPD. The release of Fe can be attributed to the presence of amorphous ferrihydrite, which also points towards the existence of an oxic interlude in the genesis of the sample material. In addition, a Mn/Fe molar ratio of ~ 0.16 was determined for sample T0237, suggesting the presence of significant amounts of X-ray amorphous Mn-oxide.
XRPD of samples KOV 01 146.9 and KOV 01 620.3 after short dissolution showed only very minor peaks representing chlorite, indicating that most chlorite had dissolved. The diffractogram did, however, show significant peaks from hematite, demonstrating that this phase had only dissolved partly, and suggesting that the released Fe stems primarily from dissolution of easily soluble Fe-oxides present as coatings or tiny particles and possibly from ferrihydrite rather than from extensive dissolution of the larger hematite crystals.
XRD of the residue remaining after prolonged dissolution of sample KOV 01 146.9 and KOV 01 620.3 shows only peaks representing quartz and feldspar. The intensity of the feldspar peaks decreased relative to the peaks from quartz, so HCl digested not only the Fe-oxides, but also chlorite and to some extent, feldspar.
37
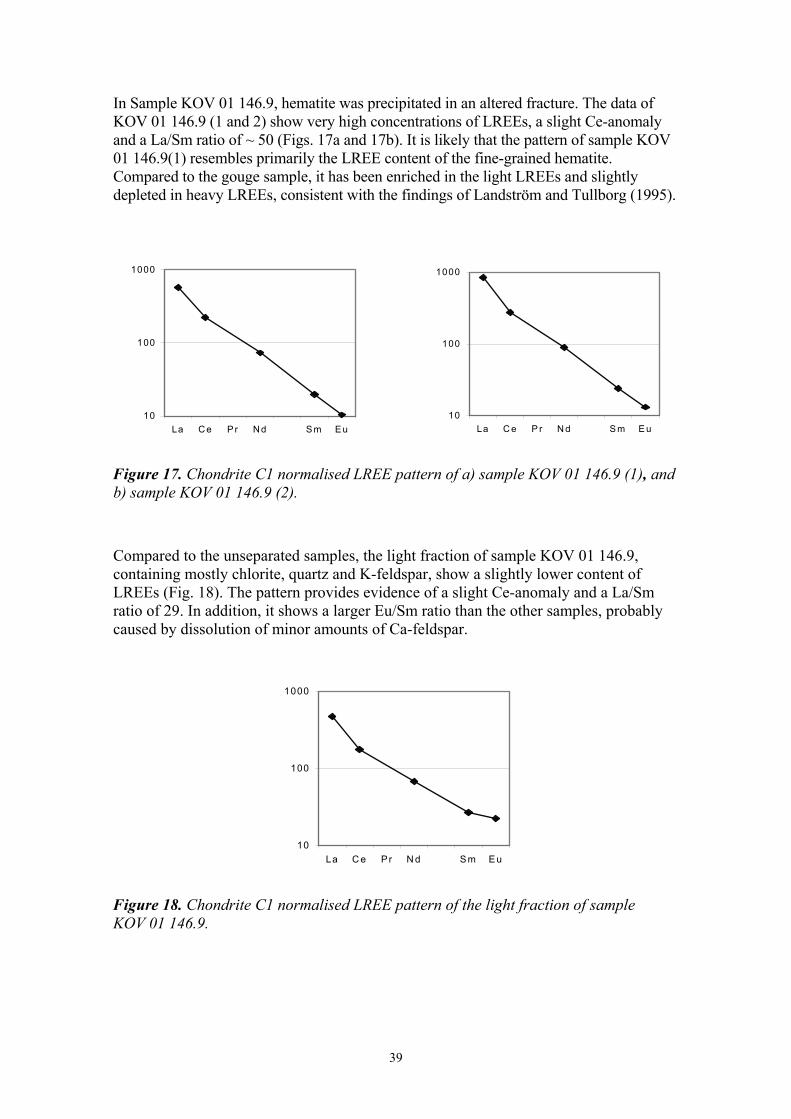
6.4.2 Characterisation of LREE composition of Äspö samples The LREE content in the samples arises from dissolution of either the granite matrix or the fracture material. Depending on the degree of fracture weathering, it may be relevant to compare the LREE data either with the LREE content of unaltered granite (Fig. 14a) or with the highly altered gouge material (Fig. 14b) that was analysed by Landström and Tullborg (1995).
a b
1
10
100
1000
La Ce Pr Nd Sm Eu
10
100
1000
La Ce Pr Nd Sm Eu
Figure 14. Chondrite C1 normalised LREE pattern of matrix host rock, left, and gouge material, right (Landström and Tullborg, 1995).
The two patterns of the ferrihydrite-containing sample T0237 are not consistent (Fig. 15a and 15b). They differ both in the general level of LREE-concentration and specifically in the Ce-concentration. This inconsistency is somewhat enigmatic. The presence of a large quantity of amorphous Mn-oxides could lead to variations in the LREE pattern, but the level of Mn in the supernatant does not vary significantly. The most likely explanation is that the larger LREE values in sample T0237 (2) originate from dissolution of some other material that was present in the sample. If the pattern of sample T0237 (1) thus reflects mostly the ferrihydrite LREE chemistry, the negative Ce anomaly may signify that the water passing through the fracture has been depleted in Ce because of precipitation of Fe- and Mn-oxides at the redox boundary.

38
0.1
1.0
10.0
La Ce Pr Nd Sm Eu
1.0
10.0
100.0
La Ce Pr Nd Sm Eu
Figure 15. Chondrite C1 normalised LREE pattern of: a) sample T0237(1), and b) sample T0237(2).
The ferrihydrite samples were precipitated from fluids that emerged from a slightly altered fracture. The samples are significantly depleted in LREEs compared to both host rock and gouge material from Äspö. The La/Sm ratio of 10 in the T0237 samples is, however, identical to that in the host rock, suggesting that the LREEs do not fractionate when ferrihydrite precipitates quickly after oxidation of Fe(II). These results are consistent with the negligible fractionation of REE(III)s during adsorption to Fe-oxides determined by Ohta and Kawabe (2002) and they are in contrast to the large positive fractionation of Nd, Sm and Eu that was determined by Bau (1999) in experiments where ferrihydrite precipitation was mediated by pH increase only.
In sample KOV 01 111.8, the scarcity of material made it impossible to determine dissolved mass, so absolute concentrations of LREEs could not be established. The material of sample KOV 01 111.8 was precipitated in a small fracture on a thin blackish fracture lining. Assuming a LREE source that resembles the matrix host rock, the relative pattern (Fig. 16) shows a La/Sm ratio of 22.0 and no Ce-anomaly, similar to that of the gouge material and suggesting that if the Fe-oxide present is lepidocrocite, formation of it or its possible green rust precursor did not lead to significant fractionation of LREEs.
10
100
1000
La Ce Pr Nd Sm Eu
Figure 16. Chondrite C1 normalised LREE pattern of sample KOV 01 111.8.
39
In Sample KOV 01 146.9, hematite was precipitated in an altered fracture. The data of KOV 01 146.9 (1 and 2) show very high concentrations of LREEs, a slight Ce-anomaly and a La/Sm ratio of ~ 50 (Figs. 17a and 17b). It is likely that the pattern of sample KOV 01 146.9(1) resembles primarily the LREE content of the fine-grained hematite. Compared to the gouge sample, it has been enriched in the light LREEs and slightly depleted in heavy LREEs, consistent with the findings of Landström and Tullborg (1995).
10
100
1000
La Ce Pr Nd Sm Eu
10
100
1000
La C e P r N d S m E u
Figure 17. Chondrite C1 normalised LREE pattern of a) sample KOV 01 146.9 (1), and b) sample KOV 01 146.9 (2).
Compared to the unseparated samples, the light fraction of sample KOV 01 146.9, containing mostly chlorite, quartz and K-feldspar, show a slightly lower content of LREEs (Fig. 18). The pattern provides evidence of a slight Ce-anomaly and a La/Sm ratio of 29. In addition, it shows a larger Eu/Sm ratio than the other samples, probably caused by dissolution of minor amounts of Ca-feldspar.
10
100
1000
La C e Pr N d S m E u
Figure 18. Chondrite C1 normalised LREE pattern of the light fraction of sample KOV 01 146.9.
40
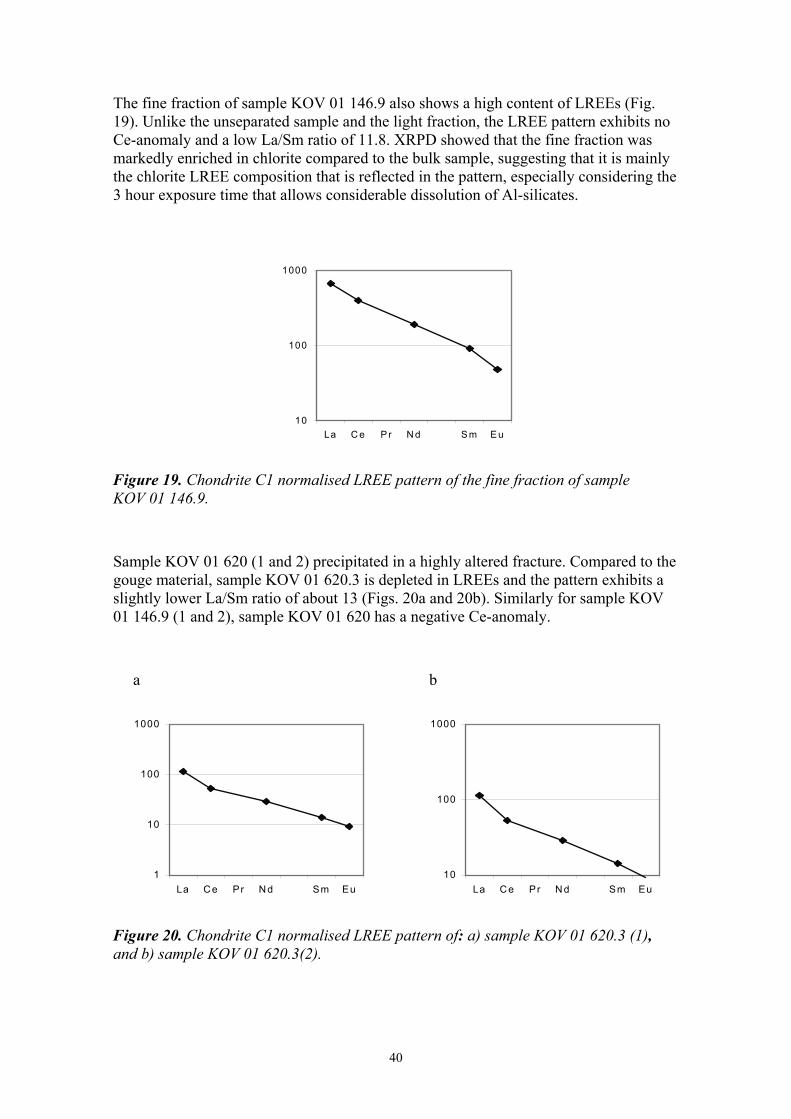
The fine fraction of sample KOV 01 146.9 also shows a high content of LREEs (Fig. 19). Unlike the unseparated sample and the light fraction, the LREE pattern exhibits no Ce-anomaly and a low La/Sm ratio of 11.8. XRPD showed that the fine fraction was markedly enriched in chlorite compared to the bulk sample, suggesting that it is mainly the chlorite LREE composition that is reflected in the pattern, especially considering the 3 hour exposure time that allows considerable dissolution of Al-silicates.
10
100
1000
La C e Pr N d S m E u
Figure 19. Chondrite C1 normalised LREE pattern of the fine fraction of sample KOV 01 146.9.
Sample KOV 01 620 (1 and 2) precipitated in a highly altered fracture. Compared to the gouge material, sample KOV 01 620.3 is depleted in LREEs and the pattern exhibits a slightly lower La/Sm ratio of about 13 (Figs. 20a and 20b). Similarly for sample KOV 01 146.9 (1 and 2), sample KOV 01 620 has a negative Ce-anomaly.
a b
1
10
100
1000
La Ce Pr N d Sm Eu
10
100
1000
La C e Pr N d Sm Eu
Figure 20. Chondrite C1 normalised LREE pattern of: a) sample KOV 01 620.3 (1), and b) sample KOV 01 620.3(2).
41
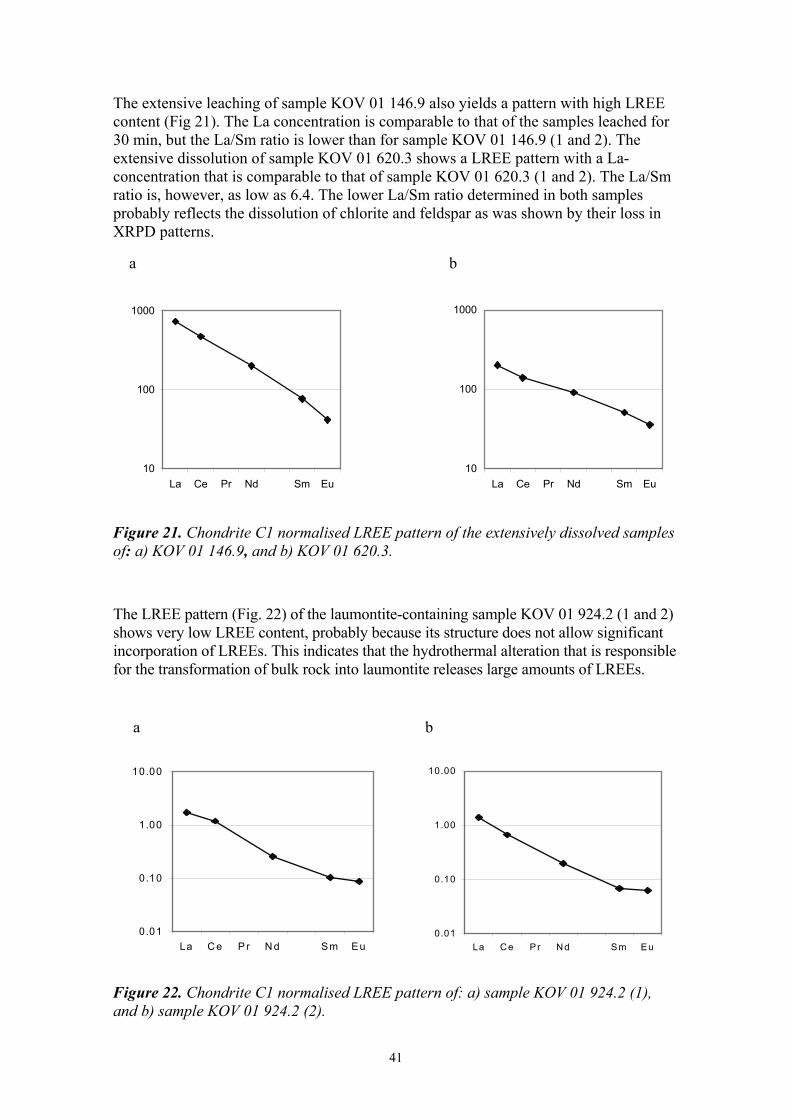
The extensive leaching of sample KOV 01 146.9 also yields a pattern with high LREE content (Fig 21). The La concentration is comparable to that of the samples leached for 30 min, but the La/Sm ratio is lower than for sample KOV 01 146.9 (1 and 2). The extensive dissolution of sample KOV 01 620.3 shows a LREE pattern with a La-concentration that is comparable to that of sample KOV 01 620.3 (1 and 2). The La/Sm ratio is, however, as low as 6.4. The lower La/Sm ratio determined in both samples probably reflects the dissolution of chlorite and feldspar as was shown by their loss in XRPD patterns.
a b
10
100
1000
La Ce Pr Nd Sm Eu
10
100
1000
La Ce Pr Nd Sm Eu
Figure 21. Chondrite C1 normalised LREE pattern of the extensively dissolved samples of: a) KOV 01 146.9, and b) KOV 01 620.3.
The LREE pattern (Fig. 22) of the laumontite-containing sample KOV 01 924.2 (1 and 2) shows very low LREE content, probably because its structure does not allow significant incorporation of LREEs. This indicates that the hydrothermal alteration that is responsible for the transformation of bulk rock into laumontite releases large amounts of LREEs.
a b
0.01
0.10
1.00
10.00
La C e Pr N d Sm Eu
0.01
0.10
1.00
10.00
La Ce Pr Nd Sm Eu
Figure 22. Chondrite C1 normalised LREE pattern of: a) sample KOV 01 924.2 (1), and b) sample KOV 01 924.2 (2).

42
43
7 Conclusions
Hematite is the dominant Fe-oxide in the studied core samples. The mechanical separation indicates that the phase is present as very fine grains and as larger grains that are identifiable with an optical microscope. It is likely that the larger-grained hematite formed in a higher temperature hydrothermal environment, whereas the fine-grained hematite probably precipitated in a lower temperature environment.
Rietveld refinement performed on X-ray diffractograms of bulk samples indicates an average hematite a-axis dimension of 5.033- 5.038, suggesting a content of structural Al of 0-6%. The results from TOF-SIMS also indicate the presence of V, Mn and Zn, all of which have been reported to incorporate readily in Fe-oxide structures. Especially Mn may, however, be present as Mn-oxides, amorphous to XRPD. Further TOF-SIMS analysis of material that was subjected to mechanical separation and/or selective dissolution may provide us with more detailed information about the incorporation and allow us to separately determine the trace element content of the larger-grained and fine-grained hematite.
The Ce-anomaly in samples KOV 01 146.9 and KOV 01 620.3 differs from the results of the selective extraction performed by Landström and Tullborg (1995). The difference may reflect variation in sample LREE-chemistry or it may be caused by a difference in the extraction procedure used. The anomaly suggests that the Fe-oxides have not been precipitated under oxic conditions. The variation in the LREE content and the different a-axis dimensions in hematite from samples KOV 01 146.9 and KOV 01 620.3 suggest that the two samples are genetically different. The variation may originate from variations in fracture composition, leading to different species concentrations in the fracture fluids, and/or from differences in the genesis temperature.
It has not been possible to establish the temperature of formation for the hematite through comparison of a-axis dimensions and the structural Al-content. Two issues complicate the determination of genesis temperature:
1. The selectivity of the tested and applied dissolution procedures did not allow precise determination of the content of structural Al in hematite because chlorite and feldspar dissolved, releasing Al from both and also Fe from chlorite.
2. The presence of two types of hematite that are genetically different requires separate determination of hematite a-axis dimensions. This may be accomplished with Rietveld refinement of XRPD data from mechanically separated fractions.
The lack of a selective dissolution procedure is the biggest problem we found for the development of a genesis indicator. However, the siderophore, enterobactin, which is released by the bacteria streptomyces (Fiedler et al., 2001), has been shown to dissolve only negligible amounts of Al from hornblende (Liermann et al., 2000), suggesting that it may selectively dissolve Fe-oxides, while leaving chlorite and feldspar virtually untouched. To evaluate the effectiveness of enterobactin in selective dissolution, further studies of dissolution rates and mechanism would have to be carried out in simple, controlled systems on well-characterised minerals relevant to the fracture mineralogy.

44
If a highly selective dissolution procedure cannot be established, other techniques, such as Mössbauer spectroscopy, provide detailed information of Al- or Fe(II)-incorporation and the presence of ferrihydrite. The most promising lead, however, in the hunt for a geothermometer may lie in the possibility of Fe isotope fractionation.
The possible presence of X-ray amorphous Fe-oxides or lepidocrocite in sample KOV 01 111.8 is very interesting because this phase may be an indicator of changes in redox conditions. Detailed studies of sample KOV 01 111.8 and similar samples could provide information about the position of a redox boundary at some time in the past. It is not out of the question that stable oxygen isotope data might provide some additional information. These last mentioned possibilities will be addressed in the next stage of the project.

45
Acknowledgements
We kindly thank: Birgit Damgaard for AAS analysis and general lab assistance; Tonci Balic-Zunic and Helene Almind for help with XRPD; The Danish Lithosphere Centre and Joel Baker for MC-ICP-MS analysis; Hans Jörg Mathieu and Nicolas Xanthopoulos for access to XPS and TOF-SIMS; and members of the NanoGeoScience group, in particular Jakob Lund and Bo Christiansen. We are grateful for valuable discussions with Eva-Lena Tullborg, Ignasi Puigdomenech, John Smellie and Peter Wikberg from the Swedish Nuclear Waste Management Company (SKB).
The research was funded by the Swedish Nuclear Waste Management Company (SKB).

46
47
References
Anderegg, G.; L’Eplattenier, F.; Schwarzenbach, G. (1963) Hydroxamatkomplexe: 2. Die anwendung der pH-metode. Helvetica Chimica Acta. Vol. 46 (4).
Baker, J.; Waight, T.; Ulfbeck, D. (2002) Rapid and highly reproducible analysis of rare earth elements by multiple collector inductively coupled plasma mass spectroscopy. In: Geochimica et Cosmochimica Acta. Vo. 66. In press.
Banwart, S.; Davies, S.; Stumm, W. (1989) The role of oxalate in accelerating the reductive dissolution of hematite (α-Fe2O3) by ascorbic acid. In: Colloids and Surfaces. Vol. 39. pp 303-309.
Beard, B. L.; Johnson, C. M.; Cox, L.; Sun, H.; Nealson, K. H.; Aguilar, C. (1999) Iron Isotope Biosignature. In: Science. Vol. 285. 1889-1892.
Cervina-Silva, J.; Sposito, G. (2002) Steady-state dissolution kinetics of aluminum-goethite in the presence of Desferrioxamine-B and Oxalate ligands. In: Environmental Science and Technology. Vol. 36. pp 337-342.
Cornell R. M. and Schwertmann U. (1996) The Iron Oxides: Structure, Properties, Reactions, Occurrences and Uses. Wiley VCH, New York.
Fiedler, H-P.; Krastel, P.; Müller, J.; Gebhart, K.; Zeeck, A. (2001) Enterobactin: The characteristic catecholate siderophore of Enterobacteriaceae is produced by streptomyces species. In: FEMS Microbiology Letters. Vol. 196. pp 147-151.
Gehring, A. U.; Fry, I. V.; Luster, J.; Sposito, G. (1994) Vanadium in sepiolite: A redox-indicator for and ancient closed brine system in the Madrid Basin, central Spain. In: Geochimica et Cosmochimica Acta. Vol. 58 (16). pp 3345-3352.
Glynn, P. D.; Voss, C. I.; Provost, A. M. (1999) Deep penetration of oxygenated meltwaters from warm based ice-sheets into the Fennoscandian Shield. Proceedings NEA/OECD Workshop on “Uses of Hydrothermal Infromation in Testing Groundwater Flow Models”. Borgholm, Sweden, Sept. 1-3, 1997.
Goldberg, E. D.; Koide, M.; Schmitt, R. A.; Smith, R. H. (1963) Rare earth distributions in the marine environment. Journal of Geophysical Research. Vol. 68. pp 4209-4217.
King-Clayton, L. M.; Chapman, N. A.; Kautsky, F.; Svensson, N-O.; Marsely, G.; Ledoux, M. (1995) The central scenario for SITE-94: A climate change scenario. Stockholm: Swedish Nuclear Power Inspectorate (SKI) (SKI report; no. 95:42).
Kornfält, K. A.; Persson, P. O.; Wikman, H. (1997) Granitoids from the Aspo area, southeastern Sweden: Geochemical and geochronological data. In: GFF. Vol. 119 (2).
48
Landström, O.; Tullborg, E-L. (1995) Interaction of trace elements with fracture filling minerals from the Äspö Hard Rock Laboratory: Examples on geochemical processes in natural systems from the Äspö Hard Rock Laboratory. Stockholm: Swedish Nuclear Fuel and Waste Management Company (SKB). 71 p. (Technical Report; no. 95-13).
Liermann, L. J.; Kalinowski, B. E.; Brantley, S. L.; Ferry, J. G. (2000) Role of bacterial siderophore in dissolution of hornblende. In: Geochimica et Cosmochimica Acta. Vol. 64. No. 4. pp 587-602.
McLennan, S. M. (1989) Rare Earth Elements in Sedimentary Rocks: Influence of Provenance and Sedimentary Processes. In: Lipin, B. R.; McKay, C. A. - Geochemistry and Mineralogy of Rare Earth Elements. Washington, D. C.: The Mineralogical Society of America. pp 169-196. (Reviews in Mineralogy; Vol. 21).
Ohta, A.; Kawabe, I. (2001) REE(III) adsorption onto Mn dioxide (δ-MnO2) and Fe oxyhydroxide: Ce(III) oxidation by MnO2. In Geochimica et Cosmochimica Acta. Vol. 65. No. 5. pp 695-703.
Palumbo, B.; Bellanca, A.; Neri, R.; Roe, M. J. (2001) Trace metal partitioning in Fe-Mn nodules from Sicilian soils, Italy. In: Chemical Geology. Vol. 173. pp 257-269.
Polyakov, V. B.; Mineev, S. D. (2000) The use of Mössbauer spectroscopy in stable isotope geochemistry. In: Geochimica et Cosmochimica Acta. Vol. 64. pp 849-865.
Schwertmann, U. (1984) The influence of aluminum on iron oxides: IX Dissolution of Al-goethites in 6 M HCl. Clay minerals. Vol. 19. pp 9-19.
Schwertmann, U.; Pfab, G. (1996) Structural vanadium and chromium in lateritic iron oxides: Genetic implications. In: Geochimica et Cosmochimica Acta. Vol. 60. pp 4279-4283.
Schwertmann, U.; Friedl, J.; Stanjek, H.; Schulze, D. G. (2000) The effect of Al on Fe Oxides. XIX. Formation of Al-substituted hematite from ferrihydrite at 25ºC and pH 4 to 7. In: Clays and Clay Minerals. Vol 48 (2). pp 159-172.
Tamm, O. (1922) Eine methode zur bestimmung der organischen komponenten des gelkomplexes im Boden. Meddelanden från Statens Skogforsök. Vol. 19. pp 385-404.
Trolard, F.; Bourrie, G.; Jeanroy, E.; Herbillon, A. J.; Martin, H. (1995) Trace metals in natural iron oxides from laterites: A study using selective kinetic extraction. In: Geochimica et Cosmochimica Acta. Vol. 59 (7). pp 1285-1297.