Embed Size (px)
Citation preview

Svensk Kärnbränslehantering ABSwedish Nuclear Fueland Waste Management CoBox 5864SE-102 40 Stockholm SwedenTel +46 8 459 84 00Fax +46 8 661 57 19
InternationalProgress Report
IPR-00-20
Äspö Hard Rock Laboratory
Prototype Repository
Hydrogeology – injection test campaign 1
Torbjörn Forsmark
Ingvar Rhén
VBB VIAK
September 2000

Report no. No.
IPR-00-20 F63KAuthor Date
T Forsmark, I Rhén 2000-09-07Checked by Date
L-O Dahlström, C Svemar 2000-09-07Approved Date
Olle Olsson 2000-10-23
Keywords: Prototype Repository, hydrogeological investigations, injection tests
This report concerns a study which was conducted for SKB. The conclusionsand viewpoints presented in the report are those of the author(s) and do notnecessarily coincide with those of the client.
Äspö Hard Rock Laboratory
Prototype Repository
Hydrogeology – injection test campaign 1
Torbjörn Forsmark
Ingvar Rhén
VBB VIAK
September 2000

i
Abstract
The Prototype Repository Test is focused on testing and demonstrating the function of the SKB deep repository system. Activities aimed at contributing to development and testing of the practical, engineering measures required to rationally perform the steps of a deposition sequence are also included in the project but are also part of other projects.
The characterisation will be made in three stages. Each stage is intended to contribute to more details useful for the determination of the localisation of the deposition holes and the boundary and rock conditions needed for the interpretation of the experimental data.
This report describes the injection test campaign 1 made before the drilling of the repository boreholes. A second test campaign will be made after the drilling of those boreholes.
During the test campaign, 39 injection tests in 13 different boreholes were made. In each of the boreholes, three tests were made in the uppermost part of the borehole.
The results from the tests show that the tested borehole sections, with the exception of one section, are very low conductive. The range, of the hydraulic conductivity of these sections, is within the range 4 · 10-12 – 1.6 · 10-9 m/s.
The one section differing from the rest, is the top section of KA3554G01, 0.25-0.75 m . This section has an estimated hydraulic conductivity of 4.6 · 10-8 m/s. No mapped fracture, however, exist in this section.
The initial pressure for the test sections was within the interval 110 kPa – 160 kPa. One section differed from this, KA3542G02, 1.25 – 1.75 m. This section had an initial pressure of 3056 kPa. A constant outflow test methodology was used in this section instead, resulting in a hydraulic conductivity value of 7.0 · 10-10 m/s.
ii
Sammanfattning
Huvudsyftet med prototypförvaret är att testa och demonstrera funktionen av en del av SKB’s djupförvars system. Aktiviteter som syftar till utveckling och försök av praktiska och ingenjörsmässiga lösningar, som krävs för att på ett rationellt sätt kunna stegvis utföra deponeringen av kapslar med kärnbränsle, är inkluderade i projektet för prototyp förvaret men även i andra projekt.
Karakteriseringen av bergmassan genomförs i tre steg. Varje steg syftar till att bidra med mer detaljer som skall vara användbara för att kunna lokalisera deposition hål och för att också kunna bestämma randvillkor och bergegenskaper som behövs för att kunna tolka experimentella data.
Denna rapport behandlar de injektionstester som genomförts innan dess att de sex depositionshålen i prototypförvaret borrats. En andra testomgång är planerad efter att borrningarna genomförts.
Under testperioden genomfördes 39 injektionstester i 13 olika borrhål. I vart och ett av borrhålen genomfördes 3 tester i den översta delen av hålet.
Resultaten från testerna visar att de undersökta borrhålssektionerna, med undantag för en sektion är mycket låg-konduktiva. Den hydrauliska konduktiviteten för dessa sektioner ligger i intervallet 4 · 10-12 – 1.6 · 10-9 m/s.
Den sektion som avviker från detta mönster är den översta sektionen i KA3554G01. Den hydrauliska konduktiviteten för denna sektion är 4.6 · 10-8 m/s. Ingen öppen spricka förekommer inom detta intervall.
Det ostörda bakgrundstrycket för sektionerna innan teststart låg inom intervallet 110 kPa – 160 kPa. En sektion avvek från detta mönster, KA3542G02, 1.25 – 1.75 m. Det ostörda bakgrundstrycket i denna sektion var 3056 kPa. Istället för en injektionstest utfördes ett konstant utflödestest i denna sektion istället. Den hydrauliska konduktiviteten i denna sektion är 7.0 · 10-10 m/s.
iii
TABLE OF CONTENTS
ABSTRACT i
SAMMANFATTNING ii
TABLE OF CONTENTS iii
TABLE OF FIGURES iv
LIST OF TABLES iv
1 BACKGROUND 1
1.1 Äspö Hard Rock Laboratory 1
1.2 Prototype repository 2 1.2.1 General objectives 2 1.2.2 Characterisation stages 3
2 OBJECTIVE 4
3 SCOPE 5
4 RESULTS 8
5 SUMMARY OF RESULTS 12
REFERENCES 16
iv
TABLE OF FIGURES
Figure 1-1 Äspö Hard Rock Laboratory 1
Figure 3-1 Plan ov the Prototype Repository Test Area 7
Figure 3-2 Section of the Prototype Repository Area 7
LIST OF TABLES
Table 3-1 Drilling data and borehole data of the 13 boreholes. 5
Table 3-2 A list of injection tests conducted in exploratory boreholes in January 1999. 6
Table 4–1 Result of the injection tests 9 Table 4–2 Estimated transmissivity and hydraulic conductivityaccording to equation 4–1 11
APPENDIX 1 Equipment used APPENDIX 2 Performance of injection tests
APPENDIX 3 Details and diagrams from transient injection tests in 39 borehole sections
1
1 BACKGROUND
1.1 Äspö Hard Rock Laboratory
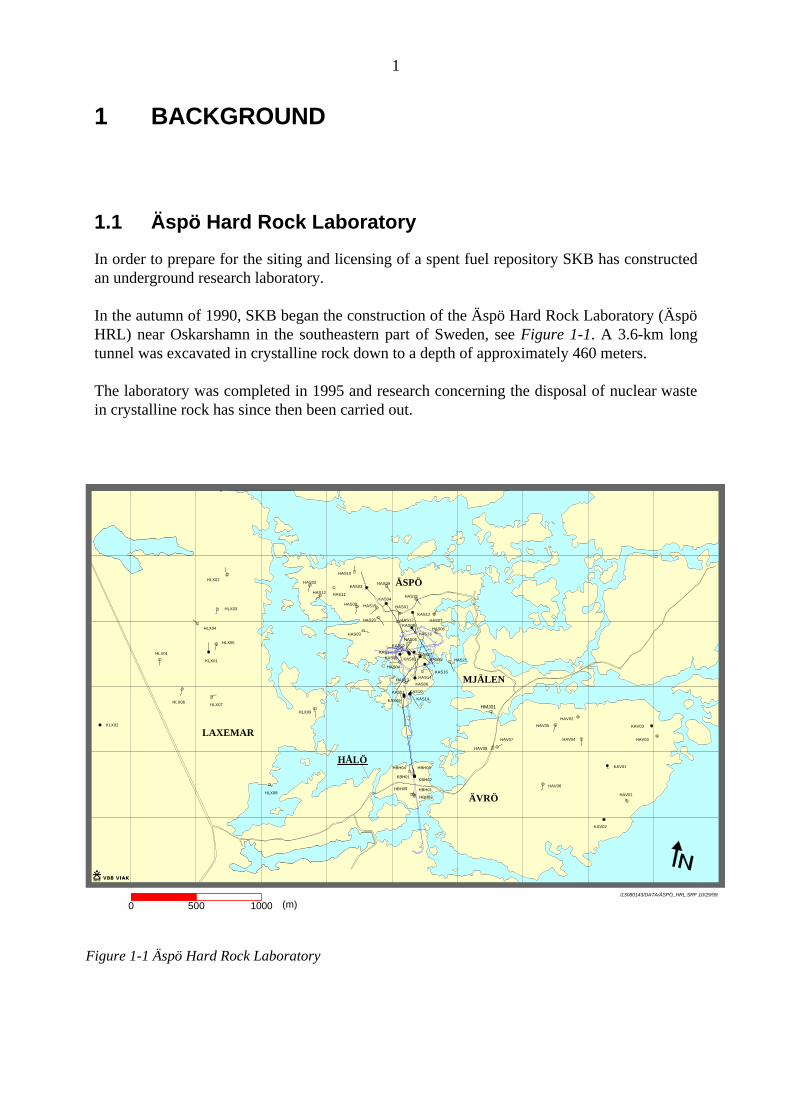
In order to prepare for the siting and licensing of a spent fuel repository SKB has constructed an underground research laboratory. In the autumn of 1990, SKB began the construction of the Äspö Hard Rock Laboratory (Äspö HRL) near Oskarshamn in the southeastern part of Sweden, see Figure 1-1. A 3.6-km long tunnel was excavated in crystalline rock down to a depth of approximately 460 meters. The laboratory was completed in 1995 and research concerning the disposal of nuclear waste in crystalline rock has since then been carried out.
0 500 1000
HAV01
HAV02
HAV03HAV04
HAV05
HAV06
HAV07
HAV08
KAV01
KAV02
KAV03
KLX01
KLX02
HLX01
HLX02
HLX03
HLX04
HLX05
HLX06HLX07
HLX08
HLX09
KAS01
KAS02
KAS03
KAS04
KAS05
KAS06
KAS07
KAS08
KAS09
KAS10KAS11
KAS12
KAS13
KAS14
KAS16
HAS01
HAS02
HAS03
HAS04
HAS05
HAS06
HAS07
HAS08
HAS09
HAS10
HAS11HAS12
HAS13HAS14
HAS15
HAS16
HAS17
HAS18
HAS19
HAS20
HAS21
HMJ01
KBH01KBH02
HBH01
HBH02
HBH03HBH04
HBH05
2/570
LAXEMAR
ÄVRÖ
ÄSPÖ
MJÄLEN
HÅLÖ
/13080143/DATA/ÄSPÖ_HRL.SRF 10/29/99
(m)
Figure 1-1 Äspö Hard Rock Laboratory
2
1.2 Prototype repository
The Äspö Hard Rock Laboratory is an essential part of the research, development, and demonstration work performed by SKB in preparation for construction and operation of the deep repository for spent fuel. Within the scope of the SKB program for RD&D 1995, SKB has decided to carry out a project with the designation “Prototype Repository Test“. The aim of the project is to test important components in the SKB deep repository system in full scale and in a realistic environment.
The Prototype Repository Test is focused on testing and demonstrating the function of the SKB deep repository system. Activities aimed at contributing to development and testing of the practical, engineering measures required to rationally perform the steps of a deposition sequence are also included. However, efforts in this direction are limited, since these matters are addressed in the Demonstration of Repository Technology project and to some extent in the Backfill and Plug Test.
1.2.1 General objectives
The Prototype Repository should simulate as many aspects as possible a real repository, for example regarding geometry, materials, and rock environment. The Prototype Repository is a demonstration of the integrated function of the repository components. Results will be compared with models and assumptions to their validity.
The major objectives for the Prototype Repository are:
• To test and demonstrate the integrated function of the repository components
under realistic conditions in full scale and to compare results with models and assumptions.
• To develop, test and demonstrate appropriate engineering standards and quality
assurance methods. • To simulate appropriate parts of the repository design and construction process.
The objectives for the characterisation program are:
• To provide a basis for determination of localisation of the deposition holes • To provide data on boundary and rock conditions to enable interpretation of the
experimental data
3
1.2.2 Characterisation stages
The characterisation will be made in three stages. Each stage is intended to contribute to more details useful for the determination of the localisation of the deposition holes and the boundary and rock conditions needed for the interpretation of the experimental data. The three stages are:
1. Mapping of the tunnel 2. Pilot and exploratory holes 3. Deposition holes
Stage 1 is completed and stage 2 has been divided into three drilling campaigns:
1. Drilling of pilot holes 2. Drilling of exploratory holes - short bore holes 3. Drilling of exploratory holes - long bore holes
This report describes the results of 39 injection tests in 13 of the exploratory boreholes. The report is to be regarded as a result report. No conclusions are made in this report.
4
2 OBJECTIVE
The objectives of the exploratory bore holes is to obtain data for prediction of the characteristics in the deposition holes, data for modelling and to quantify the criteria needed for validation of the suitability of the position for canister deposition. Acceptance of a canister position is based on scrutinization of characterisation data such as fracturing, permeability and stability of the bore hole wall.
The main objectives for the injection tests in the exploratory boreholes are: • The hydraulic tests in the exploratory holes shall provide hydrogeological data useful for
setting up a hydrogeological model, of the rock volume around the TBM tunnel. • Data shall constitute together with the geological and other investigations a basis for
interpretation of changes, of the rock characteristics, around the upper part of the rock volume due to drilling of the deposition holes.
5
3 SCOPE
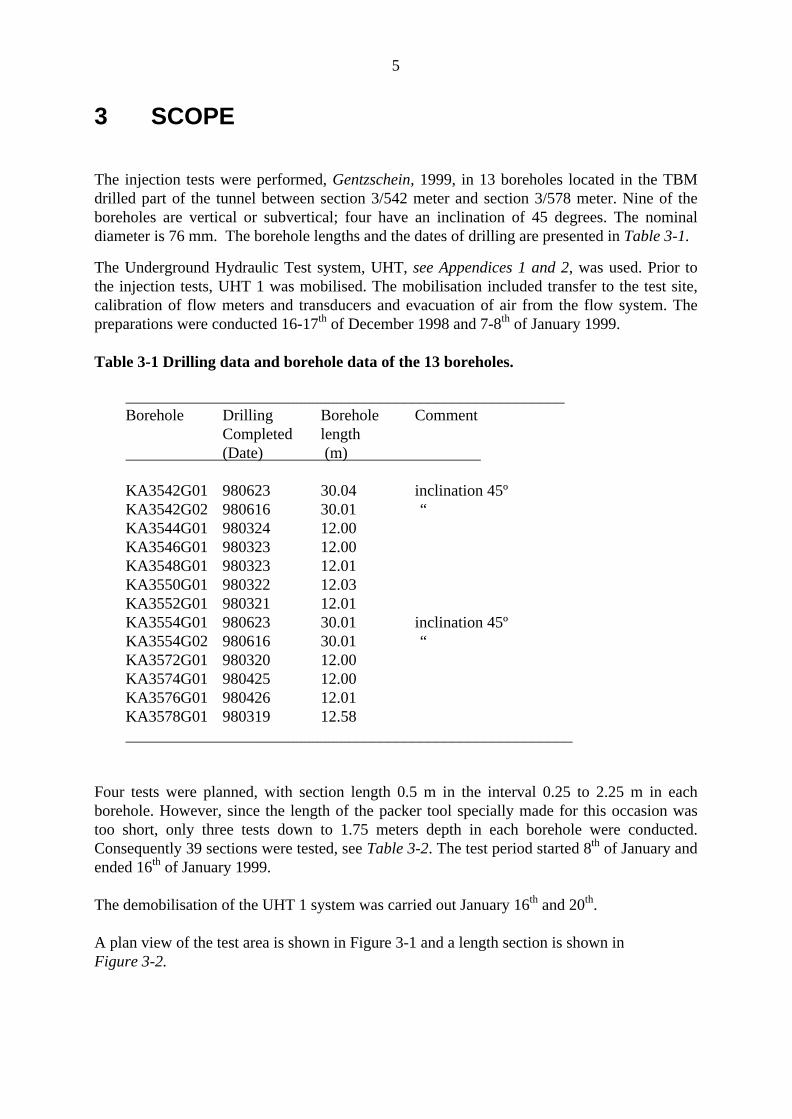
The injection tests were performed, Gentzschein, 1999, in 13 boreholes located in the TBM drilled part of the tunnel between section 3/542 meter and section 3/578 meter. Nine of the boreholes are vertical or subvertical; four have an inclination of 45 degrees. The nominal diameter is 76 mm. The borehole lengths and the dates of drilling are presented in Table 3-1.
The Underground Hydraulic Test system, UHT, see Appendices 1 and 2, was used. Prior to the injection tests, UHT 1 was mobilised. The mobilisation included transfer to the test site, calibration of flow meters and transducers and evacuation of air from the flow system. The preparations were conducted 16-17th of December 1998 and 7-8th of January 1999. Table 3-1 Drilling data and borehole data of the 13 boreholes.
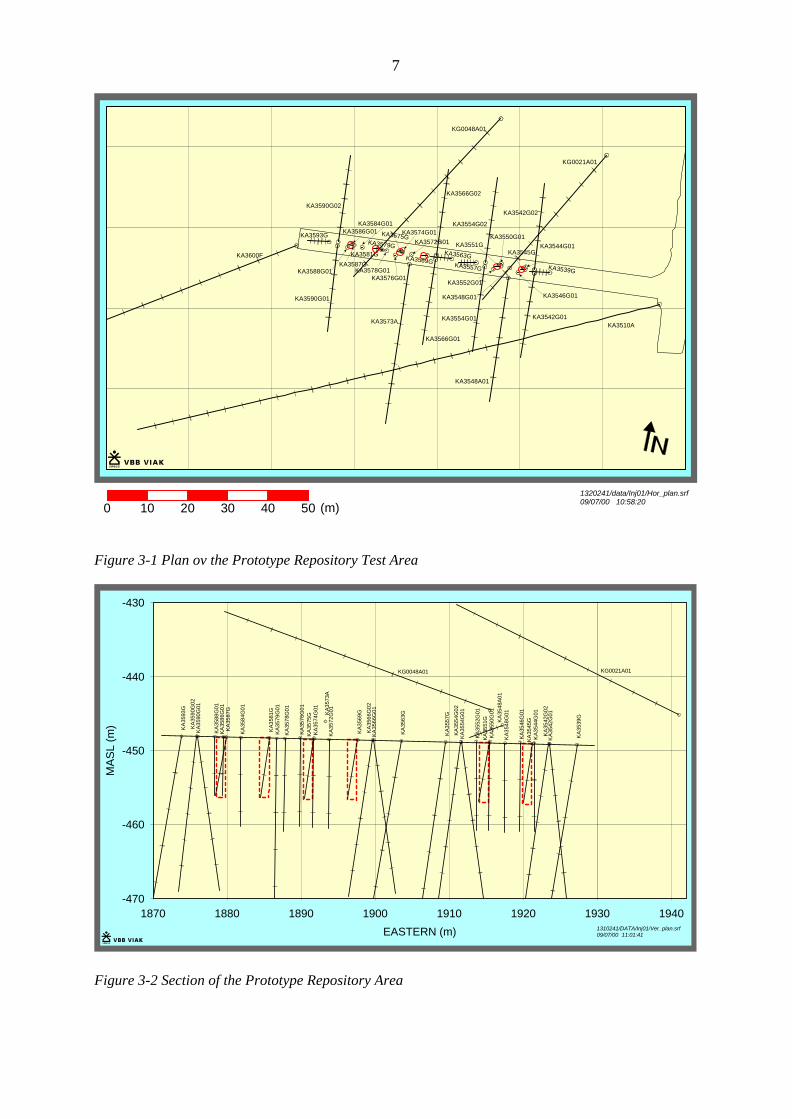
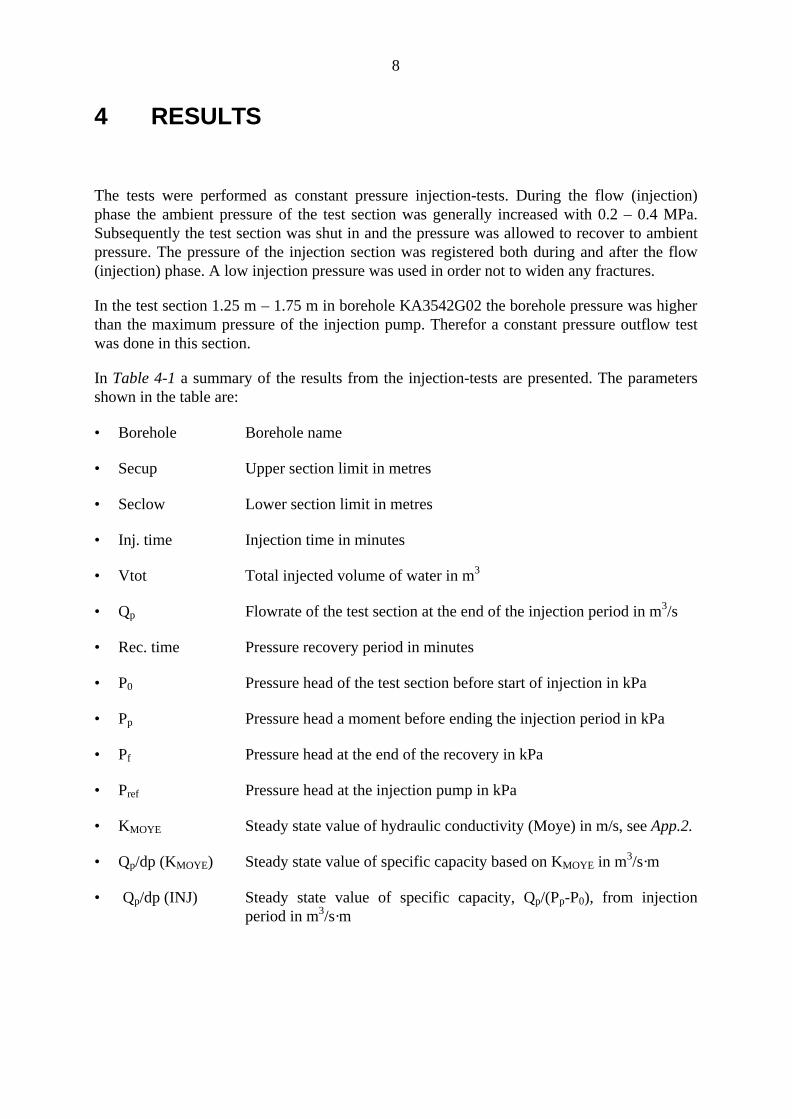
_______________________________________________________ Borehole Drilling Borehole Comment Completed length (Date) (m) KA3542G01 980623 30.04 inclination 45º KA3542G02 980616 30.01 “ KA3544G01 980324 12.00 KA3546G01 980323 12.00 KA3548G01 980323 12.01 KA3550G01 980322 12.03 KA3552G01 980321 12.01 KA3554G01 980623 30.01 inclination 45º KA3554G02 980616 30.01 “ KA3572G01 980320 12.00 KA3574G01 980425 12.00 KA3576G01 980426 12.01 KA3578G01 980319 12.58 ________________________________________________________ Four tests were planned, with section length 0.5 m in the interval 0.25 to 2.25 m in each borehole. However, since the length of the packer tool specially made for this occasion was too short, only three tests down to 1.75 meters depth in each borehole were conducted. Consequently 39 sections were tested, see Table 3-2. The test period started 8th of January and ended 16th of January 1999. The demobilisation of the UHT 1 system was carried out January 16th and 20th. A plan view of the test area is shown in Figure 3-1 and a length section is shown in Figure 3-2.
6
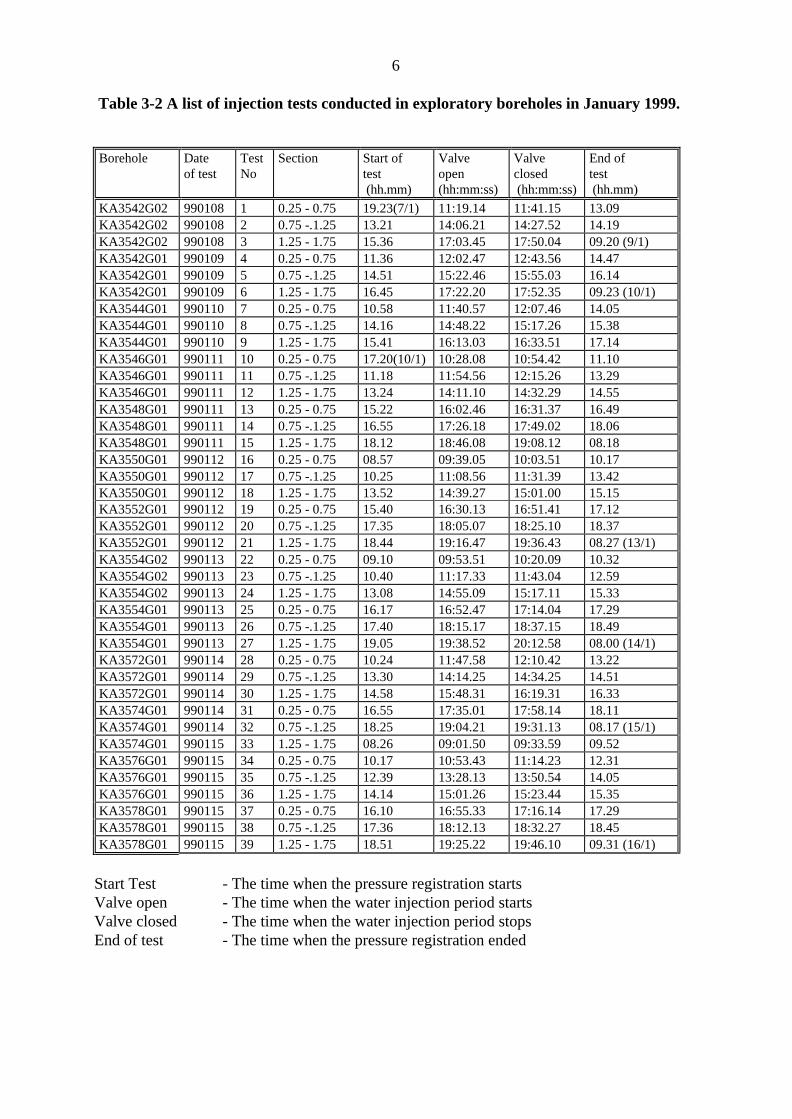
Table 3-2 A list of injection tests conducted in exploratory boreholes in January 1999.
Borehole
Date of test
Test No
Section
Start of test (hh.mm)
Valve open (hh:mm:ss)
Valve closed (hh:mm:ss)
End of test (hh.mm)
KA3542G02 990108 1 0.25 - 0.75 19.23(7/1) 11:19.14 11:41.15 13.09 KA3542G02 990108 2 0.75 -.1.25 13.21 14:06.21 14:27.52 14.19 KA3542G02 990108 3 1.25 - 1.75 15.36 17:03.45 17:50.04 09.20 (9/1) KA3542G01 990109 4 0.25 - 0.75 11.36 12:02.47 12:43.56 14.47 KA3542G01 990109 5 0.75 -.1.25 14.51 15:22.46 15:55.03 16.14 KA3542G01 990109 6 1.25 - 1.75 16.45 17:22.20 17:52.35 09.23 (10/1) KA3544G01 990110 7 0.25 - 0.75 10.58 11:40.57 12:07.46 14.05 KA3544G01 990110 8 0.75 -.1.25 14.16 14:48.22 15:17.26 15.38 KA3544G01 990110 9 1.25 - 1.75 15.41 16:13.03 16:33.51 17.14 KA3546G01 990111 10 0.25 - 0.75 17.20(10/1) 10:28.08 10:54.42 11.10 KA3546G01 990111 11 0.75 -.1.25 11.18 11:54.56 12:15.26 13.29 KA3546G01 990111 12 1.25 - 1.75 13.24 14:11.10 14:32.29 14.55 KA3548G01 990111 13 0.25 - 0.75 15.22 16:02.46 16:31.37 16.49 KA3548G01 990111 14 0.75 -.1.25 16.55 17:26.18 17:49.02 18.06 KA3548G01 990111 15 1.25 - 1.75 18.12 18:46.08 19:08.12 08.18 KA3550G01 990112 16 0.25 - 0.75 08.57 09:39.05 10:03.51 10.17 KA3550G01 990112 17 0.75 -.1.25 10.25 11:08.56 11:31.39 13.42 KA3550G01 990112 18 1.25 - 1.75 13.52 14:39.27 15:01.00 15.15 KA3552G01 990112 19 0.25 - 0.75 15.40 16:30.13 16:51.41 17.12 KA3552G01 990112 20 0.75 -.1.25 17.35 18:05.07 18:25.10 18.37 KA3552G01 990112 21 1.25 - 1.75 18.44 19:16.47 19:36.43 08.27 (13/1) KA3554G02 990113 22 0.25 - 0.75 09.10 09:53.51 10:20.09 10.32 KA3554G02 990113 23 0.75 -.1.25 10.40 11:17.33 11:43.04 12.59 KA3554G02 990113 24 1.25 - 1.75 13.08 14:55.09 15:17.11 15.33 KA3554G01 990113 25 0.25 - 0.75 16.17 16:52.47 17:14.04 17.29 KA3554G01 990113 26 0.75 -.1.25 17.40 18:15.17 18:37.15 18.49 KA3554G01 990113 27 1.25 - 1.75 19.05 19:38.52 20:12.58 08.00 (14/1) KA3572G01 990114 28 0.25 - 0.75 10.24 11:47.58 12:10.42 13.22 KA3572G01 990114 29 0.75 -.1.25 13.30 14:14.25 14:34.25 14.51 KA3572G01 990114 30 1.25 - 1.75 14.58 15:48.31 16:19.31 16.33 KA3574G01 990114 31 0.25 - 0.75 16.55 17:35.01 17:58.14 18.11 KA3574G01 990114 32 0.75 -.1.25 18.25 19:04.21 19:31.13 08.17 (15/1) KA3574G01 990115 33 1.25 - 1.75 08.26 09:01.50 09:33.59 09.52 KA3576G01 990115 34 0.25 - 0.75 10.17 10:53.43 11:14.23 12.31 KA3576G01 990115 35 0.75 -.1.25 12.39 13:28.13 13:50.54 14.05 KA3576G01 990115 36 1.25 - 1.75 14.14 15:01.26 15:23.44 15.35 KA3578G01 990115 37 0.25 - 0.75 16.10 16:55.33 17:16.14 17.29 KA3578G01 990115 38 0.75 -.1.25 17.36 18:12.13 18:32.27 18.45 KA3578G01 990115 39 1.25 - 1.75 18.51 19:25.22 19:46.10 09.31 (16/1)
Start Test - The time when the pressure registration starts Valve open - The time when the water injection period starts Valve closed - The time when the water injection period stops End of test - The time when the pressure registration ended
7
1320241/data/Inj01/Hor_plan.srf09/07/00 10:58:20(m)
KA3510A
KA3600F
KA3588G01
KA3593G KA3586G01
0 10 20 30 40 50
KA3587G
KA3584G01
KA3581G
KA3578G01
KA3575GKA3572G01
KA3573A
KA3569GKA3563G
KA3557G
KA3552G01
KA3550G01KA3551G
KA3548G01 KA3546G01
KA3539G
KA3544G01
KA3590G02
KA3590G01
KA3574G01
KA3576G01
KA3566G02
KA3566G01
KA3554G02
KA3554G01
KA3545G
KA3542G02
KA3542G01
KA3579G
KA3548A01
KG0021A01
KG0048A01
Figure 3-1 Plan ov the Prototype Repository Test Area
KA
3539
G
KA
3542
G01
KA
3544
G01
KA
3546
G01
KA
3548
G01
KA
3550
G01
KA
3552
G01
KA
3554
G01
KA
3557
G
KA
3563
G
KA
3566
G01
KA
3569
G
KA
3572
G01KA
3573
A
KA
3574
G01
KA
3576
G01
KA
3578
G01
KA
3581
G
KA
3584
G01
KA
3587
G
KA
3588
G01
KA
3590
G01
KA
3593
G
1870 1880 1890 1900 1910 1920 1930 1940
EASTERN (m)
-470
-460
-450
-440
-430
MA
SL
(m)
KA
3586
G01
KA
3551
G
KA
3545
G
1310241/DATA/Inj01/Ver_plan.srf09/07/00 11:01:41
KA
3542
G02
KA
3554
G02
KA
3566
G02
KA
3575
G
KA
3590
G02
KA
3579
G01
KG0048A01 KG0021A01
KA
3548
A01
Figure 3-2 Section of the Prototype Repository Area
8
4 RESULTS
The tests were performed as constant pressure injection-tests. During the flow (injection) phase the ambient pressure of the test section was generally increased with 0.2 – 0.4 MPa. Subsequently the test section was shut in and the pressure was allowed to recover to ambient pressure. The pressure of the injection section was registered both during and after the flow (injection) phase. A low injection pressure was used in order not to widen any fractures.
In the test section 1.25 m – 1.75 m in borehole KA3542G02 the borehole pressure was higher than the maximum pressure of the injection pump. Therefor a constant pressure outflow test was done in this section.
In Table 4-1 a summary of the results from the injection-tests are presented. The parameters shown in the table are:
• Borehole Borehole name
• Secup Upper section limit in metres
• Seclow Lower section limit in metres
• Inj. time Injection time in minutes
• Vtot Total injected volume of water in m3
• Qp Flowrate of the test section at the end of the injection period in m3/s
• Rec. time Pressure recovery period in minutes
• P0 Pressure head of the test section before start of injection in kPa
• Pp Pressure head a moment before ending the injection period in kPa
• Pf Pressure head at the end of the recovery in kPa
• Pref Pressure head at the injection pump in kPa
• KMOYE Steady state value of hydraulic conductivity (Moye) in m/s, see App.2.
• Qp/dp (KMOYE) Steady state value of specific capacity based on KMOYE in m3/s·m
• Qp/dp (INJ) Steady state value of specific capacity, Qp/(Pp-P0), from injection period in m3/s·m
9
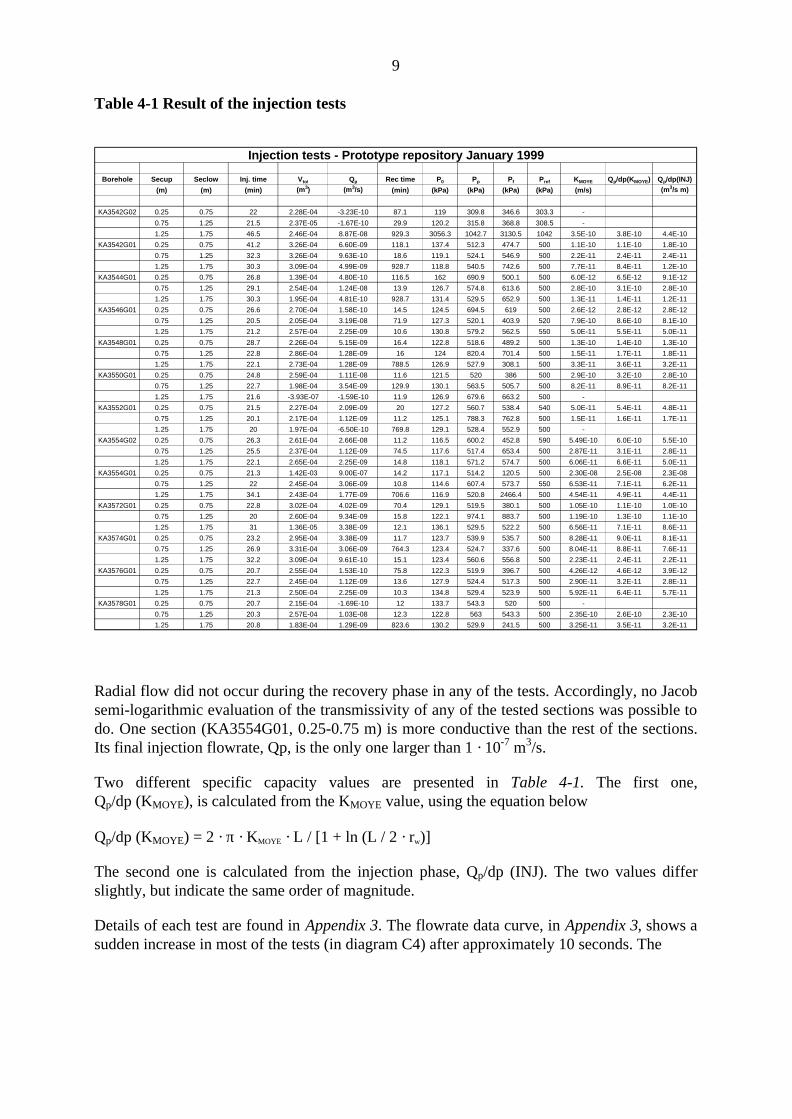
Table 4-1 Result of the injection tests
Borehole Secup Seclow Inj. time Vtot Qp Rec time P0 Pp Pf Pref KMOYE Qp/dp(KMOYE) Qp/dp(INJ)
(m) (m) (min) (m3) (m3/s) (min) (kPa) (kPa) (kPa) (kPa) (m/s) (m3/s m)
KA3542G02 0.25 0.75 22 2.28E-04 -3.23E-10 87.1 119 309.8 346.6 303.3 -
0.75 1.25 21.5 2.37E-05 -1.67E-10 29.9 120.2 315.8 368.8 308.5 -
1.25 1.75 46.5 2.46E-04 8.87E-08 929.3 3056.3 1042.7 3130.5 1042 3.5E-10 3.8E-10 4.4E-10
KA3542G01 0.25 0.75 41.2 3.26E-04 6.60E-09 118.1 137.4 512.3 474.7 500 1.1E-10 1.1E-10 1.8E-10
0.75 1.25 32.3 3.26E-04 9.63E-10 18.6 119.1 524.1 546.9 500 2.2E-11 2.4E-11 2.4E-11
1.25 1.75 30.3 3.09E-04 4.99E-09 928.7 118.8 540.5 742.6 500 7.7E-11 8.4E-11 1.2E-10
KA3544G01 0.25 0.75 26.8 1.39E-04 4.80E-10 116.5 162 690.9 500.1 500 6.0E-12 6.5E-12 9.1E-12
0.75 1.25 29.1 2.54E-04 1.24E-08 13.9 126.7 574.8 613.6 500 2.8E-10 3.1E-10 2.8E-10
1.25 1.75 30.3 1.95E-04 4.81E-10 928.7 131.4 529.5 652.9 500 1.3E-11 1.4E-11 1.2E-11
KA3546G01 0.25 0.75 26.6 2.70E-04 1.58E-10 14.5 124.5 694.5 619 500 2.6E-12 2.8E-12 2.8E-12
0.75 1.25 20.5 2.05E-04 3.19E-08 71.9 127.3 520.1 403.9 520 7.9E-10 8.6E-10 8.1E-10
1.25 1.75 21.2 2.57E-04 2.25E-09 10.6 130.8 579.2 562.5 550 5.0E-11 5.5E-11 5.0E-11
KA3548G01 0.25 0.75 28.7 2.26E-04 5.15E-09 16.4 122.8 518.6 489.2 500 1.3E-10 1.4E-10 1.3E-10
0.75 1.25 22.8 2.86E-04 1.28E-09 16 124 820.4 701.4 500 1.5E-11 1.7E-11 1.8E-11
1.25 1.75 22.1 2.73E-04 1.28E-09 788.5 126.9 527.9 308.1 500 3.3E-11 3.6E-11 3.2E-11
KA3550G01 0.25 0.75 24.8 2.59E-04 1.11E-08 11.6 121.5 520 386 500 2.9E-10 3.2E-10 2.8E-10
0.75 1.25 22.7 1.98E-04 3.54E-09 129.9 130.1 563.5 505.7 500 8.2E-11 8.9E-11 8.2E-11
1.25 1.75 21.6 -3.93E-07 -1.59E-10 11.9 126.9 679.6 663.2 500 -
KA3552G01 0.25 0.75 21.5 2.27E-04 2.09E-09 20 127.2 560.7 538.4 540 5.0E-11 5.4E-11 4.8E-11
0.75 1.25 20.1 2.17E-04 1.12E-09 11.2 125.1 788.3 762.8 500 1.5E-11 1.6E-11 1.7E-11
1.25 1.75 20 1.97E-04 -6.50E-10 769.8 129.1 528.4 552.9 500 -
KA3554G02 0.25 0.75 26.3 2.61E-04 2.66E-08 11.2 116.5 600.2 452.8 590 5.49E-10 6.0E-10 5.5E-10
0.75 1.25 25.5 2.37E-04 1.12E-09 74.5 117.6 517.4 653.4 500 2.87E-11 3.1E-11 2.8E-11
1.25 1.75 22.1 2.65E-04 2.25E-09 14.8 118.1 571.2 574.7 500 6.06E-11 6.6E-11 5.0E-11
KA3554G01 0.25 0.75 21.3 1.42E-03 9.00E-07 14.2 117.1 514.2 120.5 500 2.30E-08 2.5E-08 2.3E-08
0.75 1.25 22 2.45E-04 3.06E-09 10.8 114.6 607.4 573.7 550 6.53E-11 7.1E-11 6.2E-11
1.25 1.75 34.1 2.43E-04 1.77E-09 706.6 116.9 520.8 2466.4 500 4.54E-11 4.9E-11 4.4E-11
KA3572G01 0.25 0.75 22.8 3.02E-04 4.02E-09 70.4 129.1 519.5 380.1 500 1.05E-10 1.1E-10 1.0E-10
0.75 1.25 20 2.60E-04 9.34E-09 15.8 122.1 974.1 883.7 500 1.19E-10 1.3E-10 1.1E-10
1.25 1.75 31 1.36E-05 3.38E-09 12.1 136.1 529.5 522.2 500 6.56E-11 7.1E-11 8.6E-11
KA3574G01 0.25 0.75 23.2 2.95E-04 3.38E-09 11.7 123.7 539.9 535.7 500 8.28E-11 9.0E-11 8.1E-11
0.75 1.25 26.9 3.31E-04 3.06E-09 764.3 123.4 524.7 337.6 500 8.04E-11 8.8E-11 7.6E-11
1.25 1.75 32.2 3.09E-04 9.61E-10 15.1 123.4 560.6 556.8 500 2.23E-11 2.4E-11 2.2E-11
KA3576G01 0.25 0.75 20.7 2.55E-04 1.53E-10 75.8 122.3 519.9 396.7 500 4.26E-12 4.6E-12 3.9E-12
0.75 1.25 22.7 2.45E-04 1.12E-09 13.6 127.9 524.4 517.3 500 2.90E-11 3.2E-11 2.8E-11
1.25 1.75 21.3 2.50E-04 2.25E-09 10.3 134.8 529.4 523.9 500 5.92E-11 6.4E-11 5.7E-11
KA3578G01 0.25 0.75 20.7 2.15E-04 -1.69E-10 12 133.7 543.3 520 500 -
0.75 1.25 20.3 2.57E-04 1.03E-08 12.3 122.8 563 543.3 500 2.35E-10 2.6E-10 2.3E-10
1.25 1.75 20.8 1.83E-04 1.29E-09 823.6 130.2 529.9 241.5 500 3.25E-11 3.5E-11 3.2E-11
Injection tests - Prototype repository January 1999
Radial flow did not occur during the recovery phase in any of the tests. Accordingly, no Jacob semi-logarithmic evaluation of the transmissivity of any of the tested sections was possible to do. One section (KA3554G01, 0.25-0.75 m) is more conductive than the rest of the sections. Its final injection flowrate, Qp, is the only one larger than 1 · 10-7 m3/s.
Two different specific capacity values are presented in Table 4-1. The first one, Qp/dp (KMOYE), is calculated from the KMOYE value, using the equation below
Qp/dp (KMOYE) = 2 · π · KMOYE · L / [1 + ln (L / 2 · rw)]
The second one is calculated from the injection phase, Qp/dp (INJ). The two values differ slightly, but indicate the same order of magnitude.
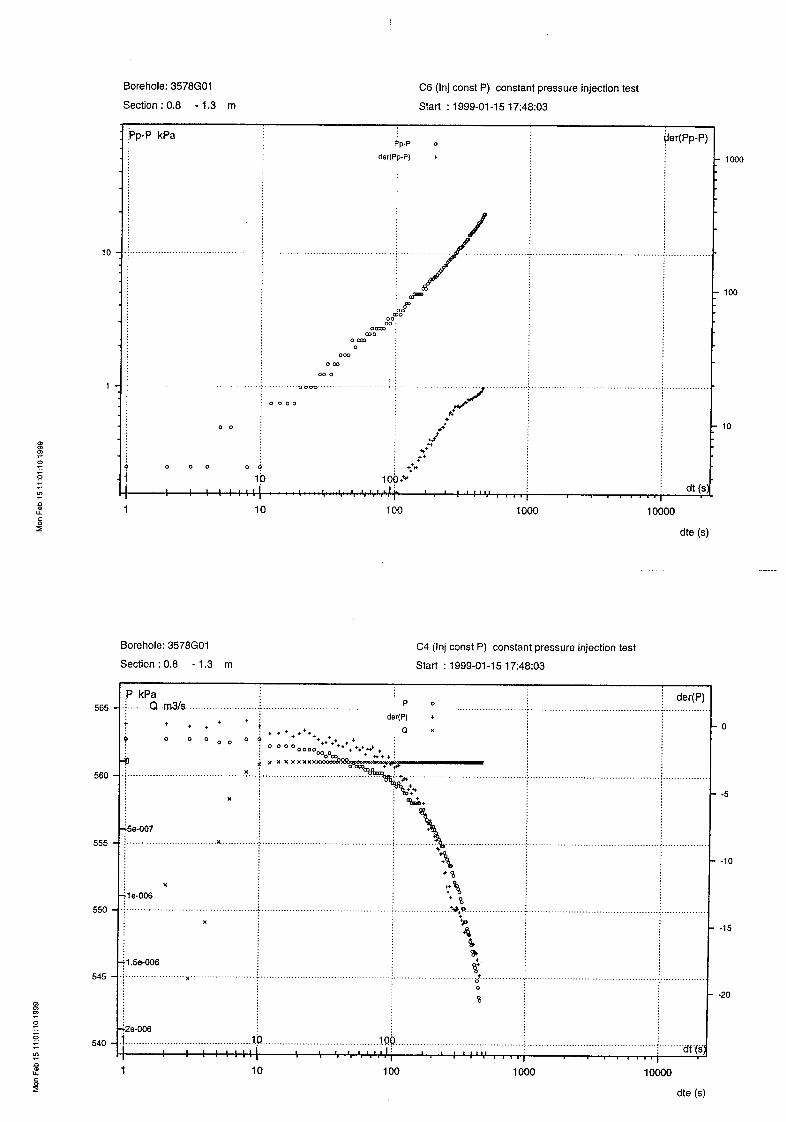
Details of each test are found in Appendix 3. The flowrate data curve, in Appendix 3, shows a sudden increase in most of the tests (in diagram C4) after approximately 10 seconds. The

10
reason for this is unknown; the most probable reason is that it is generated by the test equipment. The Qp value in Table 4-1 is the best estimate of the injection flow rate.
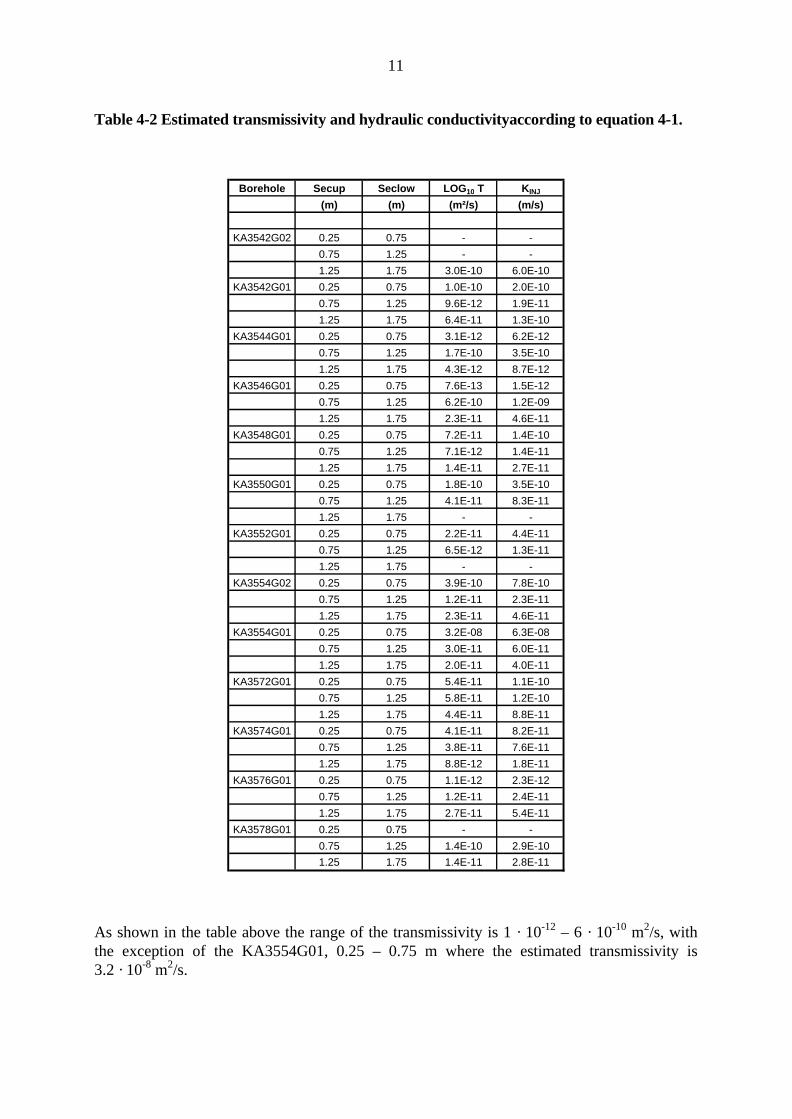
The transmissivity have been estimated from the specific capacity calculated from the injection phase. The following relationship have been used, Rhén et al /1997/:
3 meter injection tests : Log10 T = 1.52 + 1.18 · Log10 (Qp/dp (INJ)) (4-1)
In this series of injection tests the packer distance have been 0.5 m. Still it is believed that the relationship above will give a good estimation of the actual transmissivity of the tested sections. In Table 4-2 the estimated transmissivity of the sections are detailed.
11
Table 4-2 Estimated transmissivity and hydraulic conductivityaccording to equation 4-1.
Borehole Secup Seclow LOG10 T KINJ
(m) (m) (m²/s) (m/s)
KA3542G02 0.25 0.75 - -
0.75 1.25 - -
1.25 1.75 3.0E-10 6.0E-10
KA3542G01 0.25 0.75 1.0E-10 2.0E-10
0.75 1.25 9.6E-12 1.9E-11
1.25 1.75 6.4E-11 1.3E-10
KA3544G01 0.25 0.75 3.1E-12 6.2E-12
0.75 1.25 1.7E-10 3.5E-10
1.25 1.75 4.3E-12 8.7E-12
KA3546G01 0.25 0.75 7.6E-13 1.5E-12
0.75 1.25 6.2E-10 1.2E-09
1.25 1.75 2.3E-11 4.6E-11
KA3548G01 0.25 0.75 7.2E-11 1.4E-10
0.75 1.25 7.1E-12 1.4E-11
1.25 1.75 1.4E-11 2.7E-11
KA3550G01 0.25 0.75 1.8E-10 3.5E-10
0.75 1.25 4.1E-11 8.3E-11
1.25 1.75 - -
KA3552G01 0.25 0.75 2.2E-11 4.4E-11
0.75 1.25 6.5E-12 1.3E-11
1.25 1.75 - -
KA3554G02 0.25 0.75 3.9E-10 7.8E-10
0.75 1.25 1.2E-11 2.3E-11
1.25 1.75 2.3E-11 4.6E-11
KA3554G01 0.25 0.75 3.2E-08 6.3E-08
0.75 1.25 3.0E-11 6.0E-11
1.25 1.75 2.0E-11 4.0E-11
KA3572G01 0.25 0.75 5.4E-11 1.1E-10
0.75 1.25 5.8E-11 1.2E-10
1.25 1.75 4.4E-11 8.8E-11
KA3574G01 0.25 0.75 4.1E-11 8.2E-11
0.75 1.25 3.8E-11 7.6E-11
1.25 1.75 8.8E-12 1.8E-11
KA3576G01 0.25 0.75 1.1E-12 2.3E-12
0.75 1.25 1.2E-11 2.4E-11
1.25 1.75 2.7E-11 5.4E-11
KA3578G01 0.25 0.75 - -
0.75 1.25 1.4E-10 2.9E-101.25 1.75 1.4E-11 2.8E-11
As shown in the table above the range of the transmissivity is 1 · 10-12 – 6 · 10-10 m2/s, with the exception of the KA3554G01, 0.25 – 0.75 m where the estimated transmissivity is 3.2 · 10-8 m2/s.
12
5 SUMMARY OF RESULTS
A total of 39 injection tests were made during the test campaign. The results from the tests show that the tested borehole sections, with the exception of one section, are very low conductive. The range, of the hydraulic conductivity of these sections, is within the range 4 · 10-12 – 1.6 · 10-9 m/s.
The one section differing from the rest, is the top section of KA3554G01. This section has an estimated hydraulic conductivity of 4.6 · 10-8 m/s. No mapped open fracture exist in this section.
The initial pressure for the test sections was within the interval 110 kPa – 160 kPa. One section differed from this, KA3542G02, 1.25 – 1.75 m. This section had an initial pressure of 3056 kPa. A constant outflow test methodology was used in this section instead, resulting in a hydraulic conductivity value of 7.0 · 10-10 m/s.

13
REFERENCES
Gentzschein B, 1999. Äspö Hard Rock Laboratory. Prototype repository. Hydraulic tests in exploratory holes. Injection tests. SKB Technical Document, SKB TD 99-56, May 1999.
Rhén I, Gustafson G, Stanfors R, Wikberg P, 1997. Äspö HRL – Geoscientific evaluation 1997/5. Models based on site characterisation 1986 – 1995. SKB TR 97-06.


APPENDIX 1
Equipment used

Parts of the underground hydraulic test system (UHT 1) were used for the injection tests. This was the first occasion when injection tests were performed using the UHT 1 equipment.
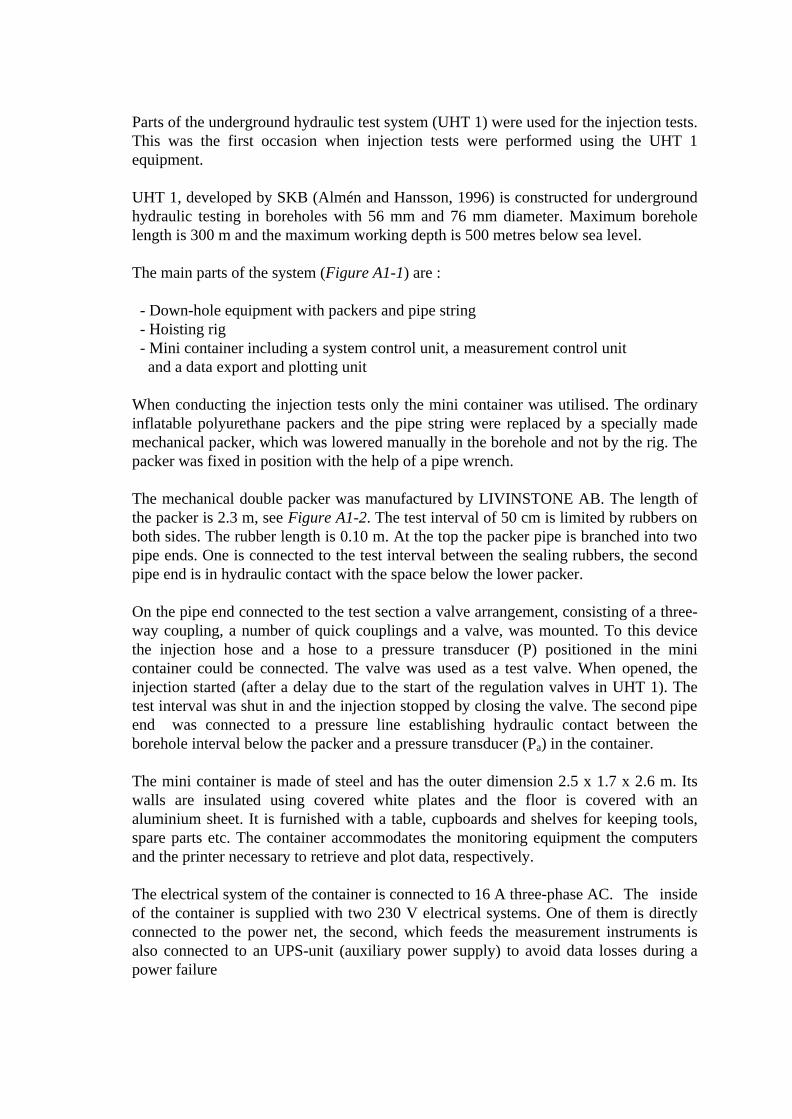
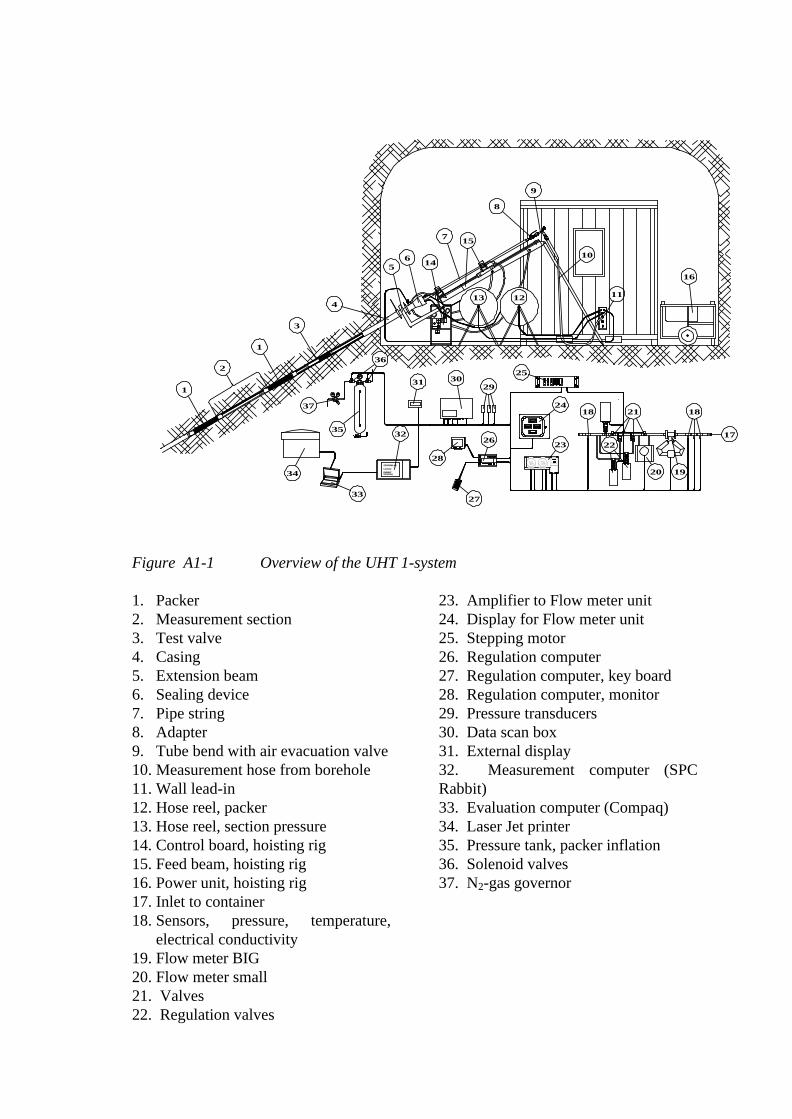
UHT 1, developed by SKB (Almén and Hansson, 1996) is constructed for underground hydraulic testing in boreholes with 56 mm and 76 mm diameter. Maximum borehole length is 300 m and the maximum working depth is 500 metres below sea level. The main parts of the system (Figure A1-1) are : - Down-hole equipment with packers and pipe string - Hoisting rig - Mini container including a system control unit, a measurement control unit and a data export and plotting unit When conducting the injection tests only the mini container was utilised. The ordinary inflatable polyurethane packers and the pipe string were replaced by a specially made mechanical packer, which was lowered manually in the borehole and not by the rig. The packer was fixed in position with the help of a pipe wrench. The mechanical double packer was manufactured by LIVINSTONE AB. The length of the packer is 2.3 m, see Figure A1-2. The test interval of 50 cm is limited by rubbers on both sides. The rubber length is 0.10 m. At the top the packer pipe is branched into two pipe ends. One is connected to the test interval between the sealing rubbers, the second pipe end is in hydraulic contact with the space below the lower packer. On the pipe end connected to the test section a valve arrangement, consisting of a three- way coupling, a number of quick couplings and a valve, was mounted. To this device the injection hose and a hose to a pressure transducer (P) positioned in the mini container could be connected. The valve was used as a test valve. When opened, the injection started (after a delay due to the start of the regulation valves in UHT 1). The test interval was shut in and the injection stopped by closing the valve. The second pipe end was connected to a pressure line establishing hydraulic contact between the borehole interval below the packer and a pressure transducer (Pa) in the container. The mini container is made of steel and has the outer dimension 2.5 x 1.7 x 2.6 m. Its walls are insulated using covered white plates and the floor is covered with an aluminium sheet. It is furnished with a table, cupboards and shelves for keeping tools, spare parts etc. The container accommodates the monitoring equipment the computers and the printer necessary to retrieve and plot data, respectively. The electrical system of the container is connected to 16 A three-phase AC. The inside of the container is supplied with two 230 V electrical systems. One of them is directly connected to the power net, the second, which feeds the measurement instruments is also connected to an UPS-unit (auxiliary power supply) to avoid data losses during a power failure
GEOSIGMA AB
Levererar
EMINENTUtrustning
SK1
SK2
SK3
614
7 15
8
9
11
16
13
10
4
3
1
2
5
12
1
18
1920
21
22
18
23
24
25
29
26
30
28
31
32 17
37
35
36
34
3327
Figure A1-1 Overview of the UHT 1-system 1. Packer 2. Measurement section 3. Test valve 4. Casing 5. Extension beam 6. Sealing device 7. Pipe string 8. Adapter 9. Tube bend with air evacuation valve 10. Measurement hose from borehole 11. Wall lead-in 12. Hose reel, packer 13. Hose reel, section pressure 14. Control board, hoisting rig 15. Feed beam, hoisting rig 16. Power unit, hoisting rig 17. Inlet to container 18. Sensors, pressure, temperature,
electrical conductivity 19. Flow meter BIG 20. Flow meter small 21. Valves 22. Regulation valves
23. Amplifier to Flow meter unit 24. Display for Flow meter unit 25. Stepping motor 26. Regulation computer 27. Regulation computer, key board 28. Regulation computer, monitor 29. Pressure transducers 30. Data scan box 31. External display 32. Measurement computer (SPC Rabbit) 33. Evaluation computer (Compaq) 34. Laser Jet printer 35. Pressure tank, packer inflation 36. Solenoid valves 37. N2-gas governor
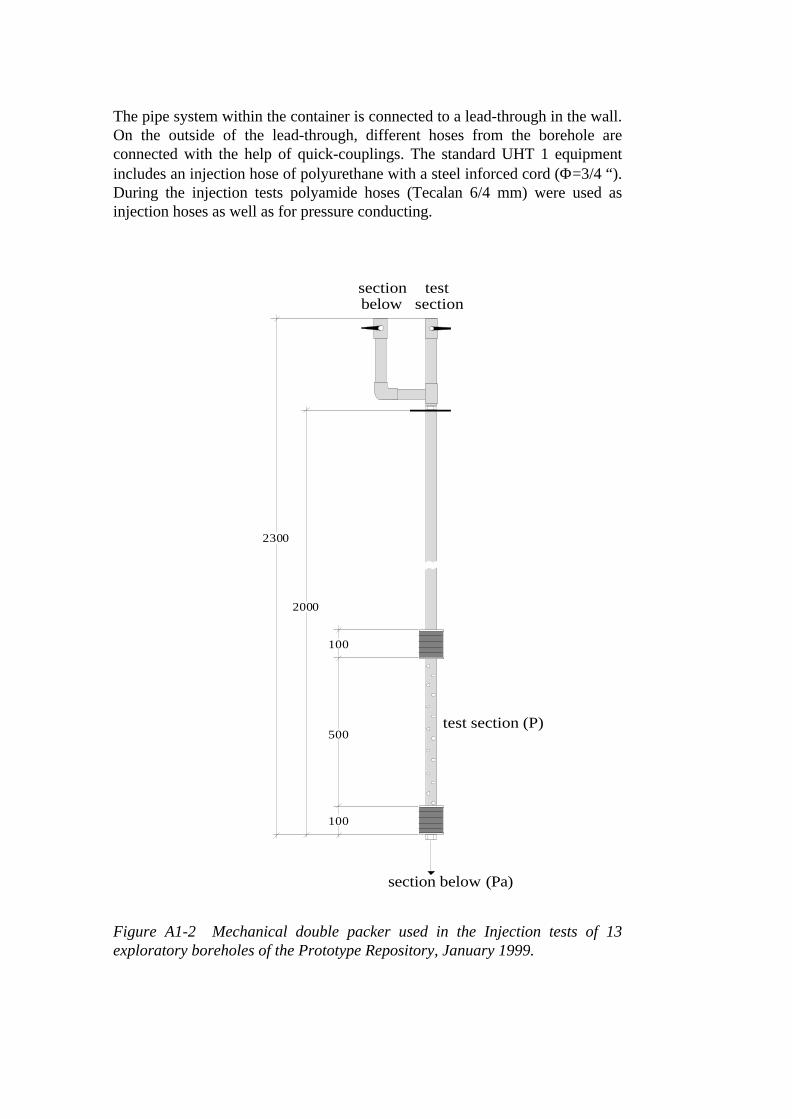
The pipe system within the container is connected to a lead-through in the wall. On the outside of the lead-through, different hoses from the borehole are connected with the help of quick-couplings. The standard UHT 1 equipment includes an injection hose of polyurethane with a steel inforced cord (Φ=3/4 “). During the injection tests polyamide hoses (Tecalan 6/4 mm) were used as injection hoses as well as for pressure conducting.
2000
2300
500
100
100
sectionbelow
test section
test section (P)
section below (Pa)
Figure A1-2 Mechanical double packer used in the Injection tests of 13 exploratory boreholes of the Prototype Repository, January 1999.
The maximum injection pressure of the UHT 1 is 10 bar. If the undisturbed ambient pressure exceeds 10 bar injection tests using UHT 1 are not possible to perform. The pressure transducers, of type Druck PTX 630, monitoring absolute pressure, are mounted on a board on one of the container walls. Two sets of transducers with different pressure ranges are operable. The standard set of pressure transducers are, Interval/packer Number Transducer id Range (alternative) Test section 2 P and Pb 6 MPa (1 MPa) Borehole 1 Pa 6 MPa (1 MPa) Packers 1 Ppack 8 MPa (2 MPa) 6 MPa transducers were used for P, Pb and Pa. Ppack was not used at all. The pressure transducers are connected to the borehole through cannula tubes, hydraulic hoses and polyamide hoses.
The technical specifications of the pressure transducers are: Type : Druck Transmitter PTX 630 abs. Supply voltage: 9 - 30 VDC Output current: 4 - 20 mA Linearity and hysteresis: ± 0.1 % of full scale
Temperature error : ± 0.3 % of full scale in the range -2 oC - +30 oC
The flow meter unit enables monitoring and regulation of the flow during constant pressure tests and constant flow tests, respectively. The flow regulation is operated and controlled using a digital computer. The main parts of the flow meter unit are: - Two mass flow meters of type Coriolis-meters, flow range: 0.001-100 l/min
- Valves to regulate the flow rate - A water filter - Two pressure transducers, measuring the pressure at the inlet and the outlet of water, respectively.
- A temperature sensor. Further components are: - A display unit with four displays - A cylinder with an electric conductivity sensor - An amplifier to the flow meter unit and the conductivity sensor.
The water flow is conducted via the large flow meter (Qbig) irrespective if the small flow meter (Qsmall) is in use or not. The measurement system selects flow data from one of the two flow meters according to the following criteria: Qsmall is selected if (Qbig <Q2L2 and Q1L1< Qsmall ≤Q1L2) or (Qbig ≤Q2L1 and Qsmall >Q1L1). Qbig is selected if (Qsmall ≤Q1L1 and Qbig >Q2L1) or (Qsmall >Q1L2 and Qbig >Q2L1) QIL1 = Low limit for Qsmall connected, set to -5.0 ∗10-7 during the injection tests. Q1L2 = Upper measure limit for Qsmall, set to 1.18∗10-5 during the injection tests. Q2L1 = Low limit for Qbig connected, set to -5.0 ∗10-5 during the injection tests. Q2L2 = Lower measure limit for Qbig, set to 1.16 ∗10-5 during the injection tests. The system changes between the two flow meters during a test, depending on the variation of the flow rate. Which one used is known only by opening the *HT2 data file. The technical data of the main components of the flow meter unit are as follows:
Flow meter Qsmall
Type : Micro Motion mass flow meter Range: 0 - 1.00 kg/minute Accuracy: ±0.4 % of current value ± zero stability (0.0001 Kg/minute) Pressure drop at max.flow: c. 500 kPa Maximum working pressure: 7 MPa Flow meter Qbig
Type : Micro Motion mass flow meter Range: 0 - 100 kg/ minute Accuracy: ± 0.15 % of current value ± zero stability (0.003 Kg/minute) Hysteresis: < 0.1 % Pressure drop at max. flow: c. 500 kPa Maximum working pressure: 5 MPa
Pressure transducers, inlet and outlet
Type : Druck Transmitter PTX 1400 Range: 0 - 6 Mpa Linearity and hysteresis: ± 0.15 % typical value ± 0.25% maximum, Best Straight Line Definition
Temperature sensors Type : GEOSIGMA BG01 Semiconductor type Range: 0 - +32 oC Accuracy: ±0.25 oC
Electrical Conductivity meter
Type : Kemotron 2911 Sensor: Kemotron 9221, 4-electrode Range: Adjustable, 14 intervals within the range 0 - 20 000 mS/m Accuracy, amplifier: ±0.25 % of current value Accuracy, cell constant: ±0.5 % Maximum working pressure: 5 MPa Temperature sensor: Pt 1000
When performing constant pressure injection tests, the constant pressure is maintained by a standard PC (Intel 486, 100 MHz, 4MB RAM and 200 MB HDD, CRT monitor). The pressure is kept constant by regulating the water flow rate. Specially designed software opens and shuts regulation valves such that a constant pressure according to a pre-set value is achieved. The program is written in TURBO-C and runs on a DOS platform. The UHT 1 measurement system is controlled by, and operated from a 120 MHz Pentium laptop computer. The software used is DM2 (Datascan Technology) , which also constitutes the platform for the Hydro Monitoring System (HMS) at the Äspö HRL. DM2 is a standard program, but has been supplemented with additional programs.
All sensors are connected to the AD-converter unit (Datascan 7320)
In addition there is a Datascan-unit for digital I/O (Datascan 7035).
The data produced by UHT 1 are evaluated in a second computer, a portable Compaq 100 MHz Pentium. The operating system is Windows 95, but the evaluation programs run on a DOS platform. Data files from the test are transferred to the evaluation computer during or after each test.
The UHT 1-system also includes a HP Laser Jet 5p, which is printing either
evaluation plots from the evaluation computer, or display images from the measurement computer.

APPENDIX 2
Performance of injection tests

A2.1 TEST PRINCIPLES The tests were performed as constant-pressure injection tests. During the flow phase the ambient pressure in the test section was generally increased with c. 0.2 MPa to 0.4 MPa. Subsequently the test section was shut in and the pressure was allowed to recover to ambient pressure. In the test section 1.25 m – 1.75 m in borehole KA2542G02 the borehole pressure was higher than the maximum pressure of the injection pump. Therefore, a constant pressure outflow test was performed in this section. The pressure was measured within the test section as well as in the borehole interval below the packers. The surrounding boreholes were packed of and closed during the test period. A2.2 TEST CYCLE AND PROCEDURES The test cycle was performed as follows: - The double packer was lowered into position and the sealing rubbers were
expanded to delimit the test interval. - The measurement section and the packer pipes were filled up with water. - The injection hose and the pressure hoses (all filled up with water) were connected
via quick-couplings. - The measurement system of UHT 1 was started. - The undisturbed pressure was measured for at least 20 minutes. - The injection was started, by opening the test valve. - Regulation of a constant injection pressure for 20 minutes. - The injection was stopped, by closing the test valve. - Pressure recovery during 10 minutes. - The UHT 1 measurement was ended and the packer released. - Transfer to next borehole section. The different stages of a test were regulated and controlled from the measurement computer in the UHT 1 container. The flow phase was started according to the following procedure: - The injection pump was started. - The data processing system was initiated to begin the flow phase - Within 45 seconds, the test valve was manually opened . The recovery period was initiated in a corresponding way. In the diagrams the start of the flow and recovery periods, respectively, are determined by pre-set criteria. During the injection, the pressure initially increased far more than the pre-set value. Since most of the test sections were low conductive or impermeable, the pressure was decreasing during the entire flow period without reaching down to the reference level.
To achieve a more constant pressure the automatic regulation was interrupted when the pressure was close to the pre-set value, and then restarted after c. 30 seconds. In some cases, if the initial pressure value did not deviate too much, the reference level was changed to be equal to the actual pressure. The constant pressure during the injection was achieved prior to the injection start by pre-setting a reference pressure on the display of the regulation computer. The display value Pref was not compensated for the vertical distance between the transducer and the test section as was the case with the pressures P, Pa and Pb. A2.3 CALIBRATION The flow meters Qsmall and Qbig were calibrated using graduated cylinders and a stopwatch. Two flow values were measured for each flow meter for the purpose of calibration, and each level was measured twice. The pressure transducers P, Pb and Pa were calibrated with the help of the reference pressure system established in the Äspö HRL tunnel. The transducers were connected to two hoses, filled with water of known density. The water column of each hose ends at a well-defined reference water level (at KK0120 and KK2850) enabling calculation of the calibration constants. The position of the pressure sensors and the barometric pressure are also used in the calibration process. The elevation of the sensors were surveyed prior to the tests and the barometric pressure was measured with a Druck DPI 700 digital pressure indicator, which have a factory-listed accuracy of 0.05% of full scale (2 bar). The temperature sensor and the electric conductivity sensor were only zero-point calibrated. The temperature sensor was compared with a high-accuracy portable spirit thermometer of good quality (the accuracy was ±0.2 °C in the range -10 °C - +50°C). The conductivity sensor was calibrated using a liquid solution with a well-determined electric conductivity. The results of the calibrations were entered into the measurement computer and the calibration constants were automatically calculated. A2.4 DATA PROCESSING The parameters, measured by the UHT-1 measurement system are: P Pressure of the test section Pa Pressure of the borehole intervals above and/or below the test section Ppack Packer pressure Tsurf Water temperature (surface) Q1 Water flow rate Qsmall Q2 Water flow rate Qbig Pb Pressure of the test section (same as P) Elcond Electrical conductivity

Since a mechanical packer was used, Ppack was not measured during the injection tests. Pa was equal to the pressure of the borehole interval below the test section, see Figure A1-2 in Appendix 1. The operative system of the measurement computer is OS9000. The measurement program is based on a program called - DM2-386 Additionally there are three modules (standard programs): - CALC-386 (for special transformation of data) - SEQ-386 (creates automatic sequences of measurements, data storing.) - MIMICMAN (creates graphical interfaces with process images) - CONTR-386 (controller for regulation of flow/pressure)
These programs are supplemented with a number of application programs. - Menu programs for entering data (calibration constants, background data) - Report generator that creates an out put file (MIO-format) - Drive routine for extra display - Calibration programs
The program ”KERMIT” is used to transfer data from the measurement computer to the evaluation computer. The program SHELL.EXE starts all the programs in the evaluation computer. SHELL.EXE is a commercial program from WordPerfect. The data file transferred from the measurement computer has an MIO-format. This file is converted to a number of files, which enables plotting of the different diagrams. The same plot program creates plots both on the screen and on the printer. The programs in the evaluation computer are:
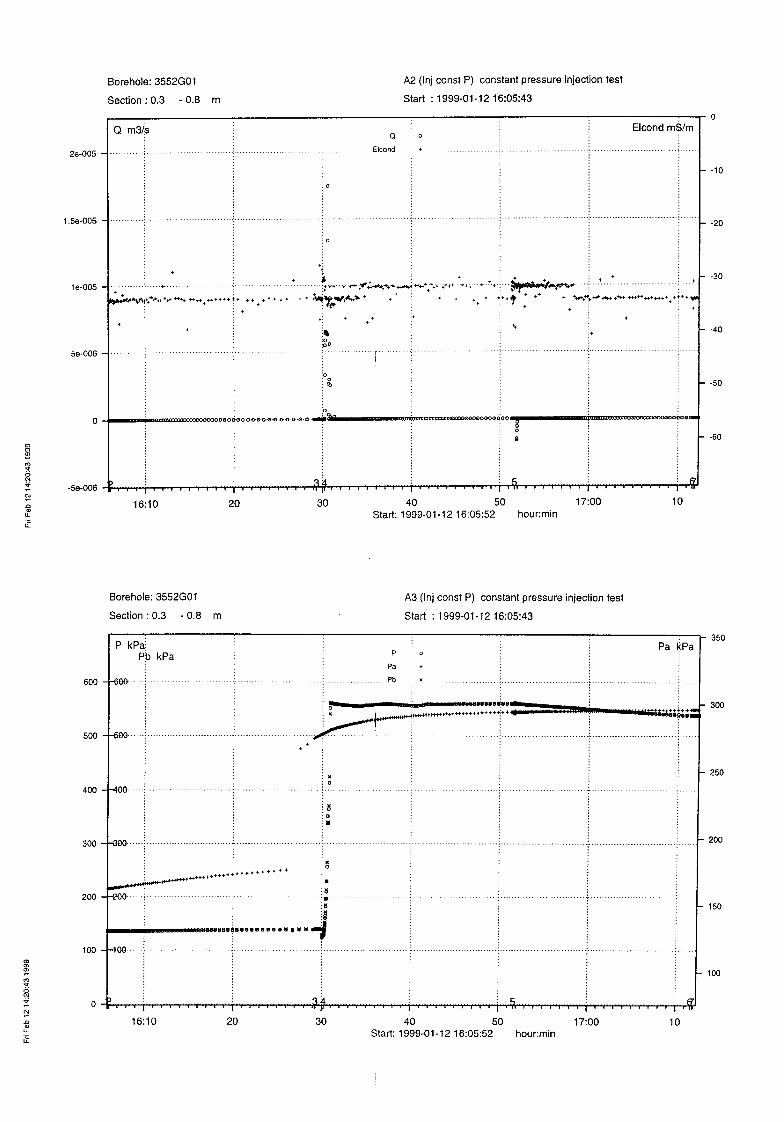
- IPPLOT.EXE Conversion program from ERGO-data (B. Johansson) - SKBPLOT.EXE Plot program from ERGO-data (B. Johansson) - PLTCNV.EXE File selection program. From GEOSIGMA (G. Nyberg) - RUNBAT.EXE File selection program and start of BATCH file. From GEOSIGMA (G. Nyberg) The plot program generates three types of diagrams : - A diagrams (A1 - A5) illustrating pressure, flow and temperature variations during
the whole test cycle. A0 is a flyleaf displaying background data as well as measured and calculated data from the test.
- B diagrams (B1 - B6) representing pressure and flow variations during the flow
phase in logarithmic and semi-logarithmic scale. In addition, other parameter transformations are plotted.
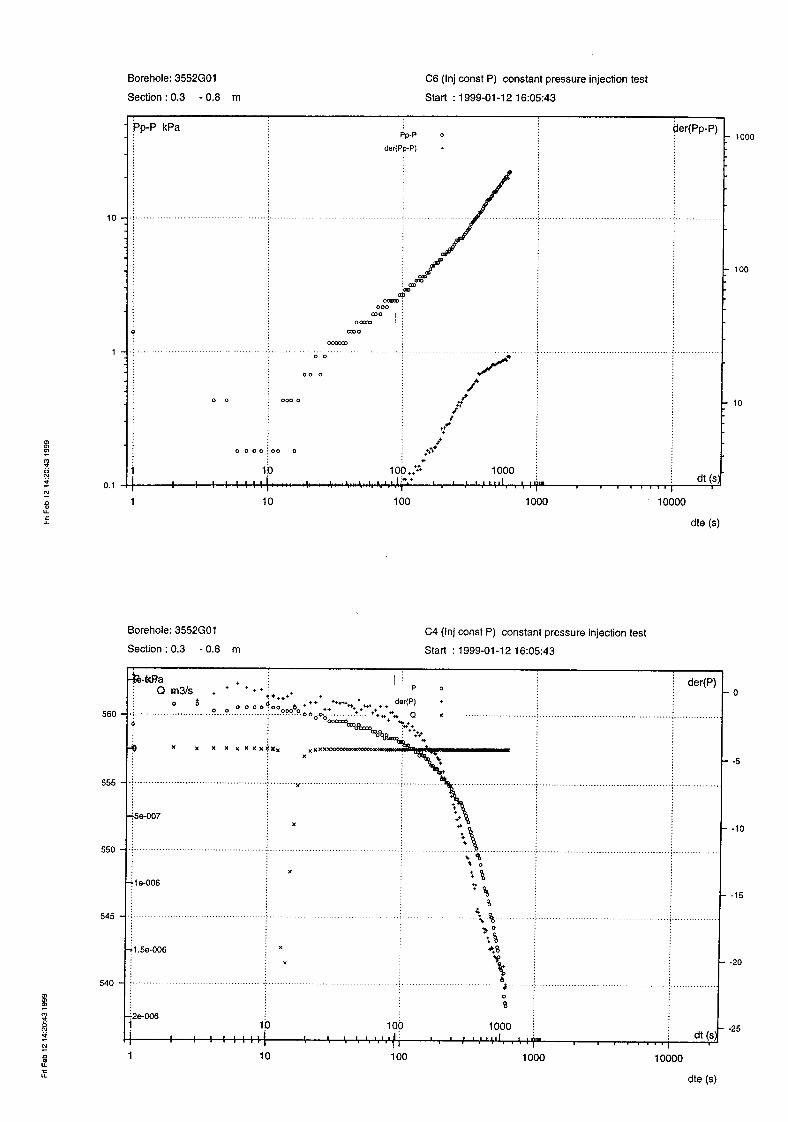
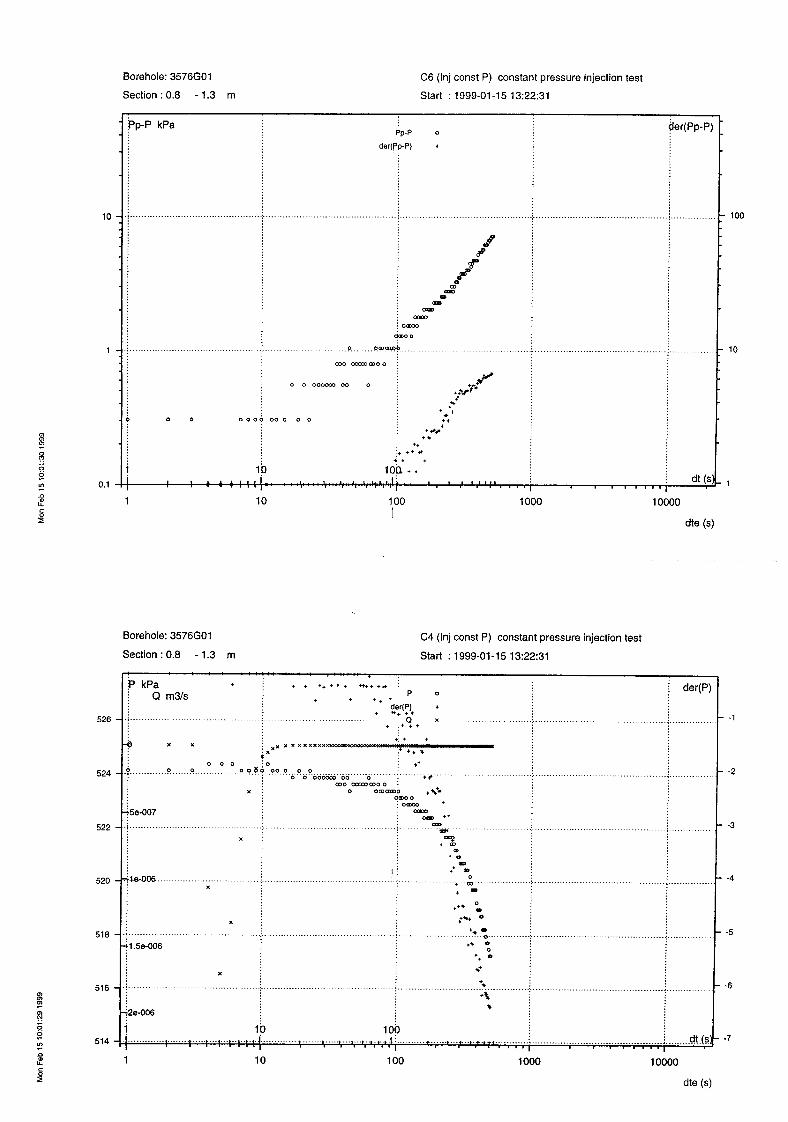
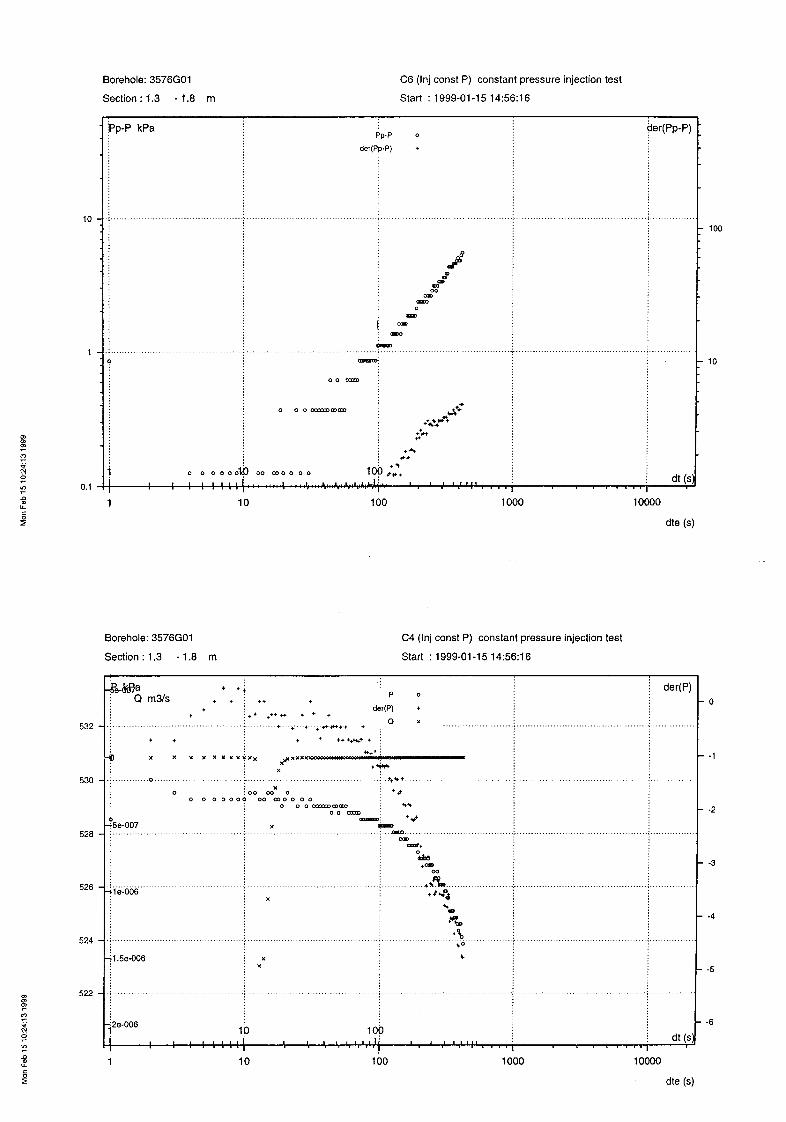
- C diagrams (C1 - C9) showing pressure and flow variations during the pressure build-up phase in logarithmic and semi-logarithmic scale. In addition, other transformations of parameters and time are plotted.
The pressure values of the diagrams are corrected for the vertical distance between the transducer and the test section (upper limit). This is achieved by entering basic data such as length to the test section, borehole inclination and the height of the transducer, into the measurement computer, before each test. The format of the section limits in the diagrams only allows one decimal, which entails that the section limits 0.25 m, 0.75 m, 1.25 m and 1.75 m are written 0.3 m, 0.8 m, 1.3 m and 1.8 m respectively A2.5 PRELIMINARY EVALUATION
The UHT 1 system automatically calculates a steady-state value of the hydraulic conductivity of the test sections using Moye´s formula (Moye 1967): Qp x 1000 x 9.81 K = _______________________ . C L x dPom where Qp = flow rate of the test section at the end of the flow phase(m3/s) dPom = Average of P - Po during the flow phase (kPa) P = hydraulic head of the test section Po = hydraulic head of the test section before flow start. C = [1 + ln(L/2rw)]/ 2π L = Length of the test section (m) rw = borehole radius (m) The steady-state hydraulic conductivity is printed on the flyleaf of each test section. In the main report it is reported as KMOYE.

A2.6 SOURCES OF ERROR The accuracy of the pressure transducers, the flow meters, the temperature sensor and the electrical conductivity sensor is described in Appendix 1. The zero stability of the “small “ flow meter is ± 1.67 ⋅ 10-9 m3/s (0.0001 kg/min), see chapter 4. In the majority of the injection tests the flow rates are close to or less than the zero stability and often negative. In most tests, the flow values are scattered around the zero flow line. This means that in many tests the flow values and the calculated conductivity values, chapter 5.5, have low accuracy. In a number of tests, the pressure increases after the injection stop. This could be an effect of a too short pressure stabilisation period or possibly, due to high pressure in the borehole interval below the packers, which influences the section pressure.

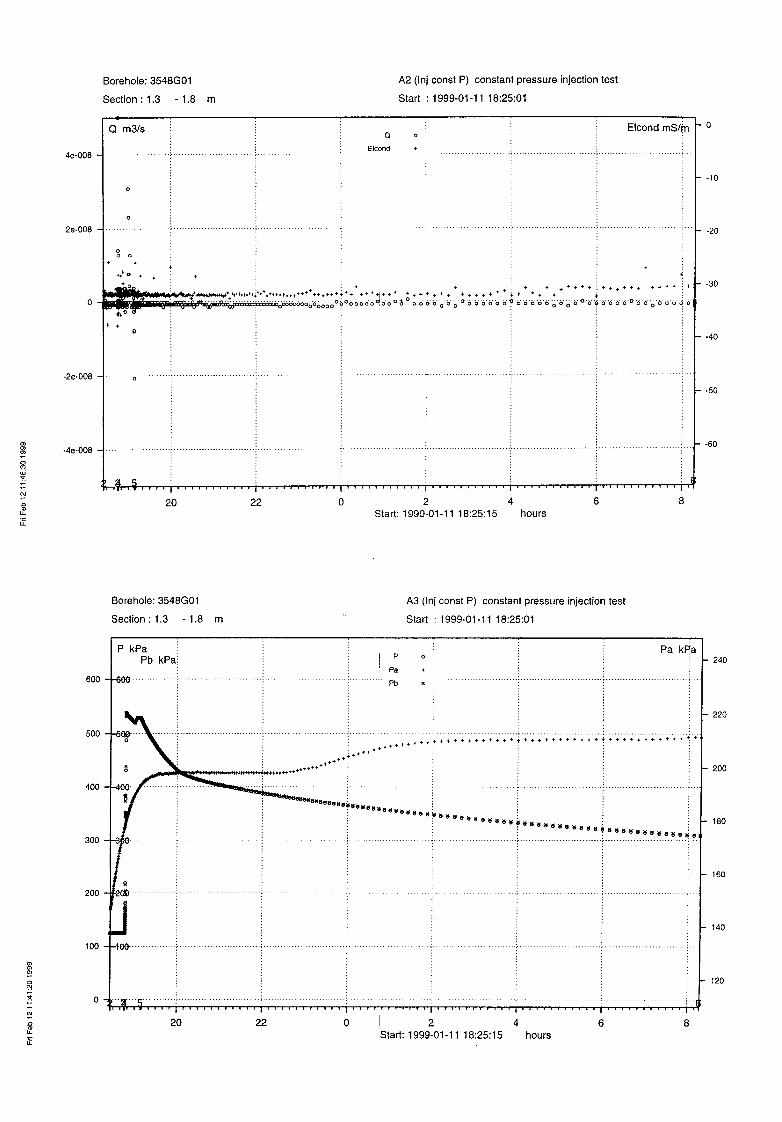
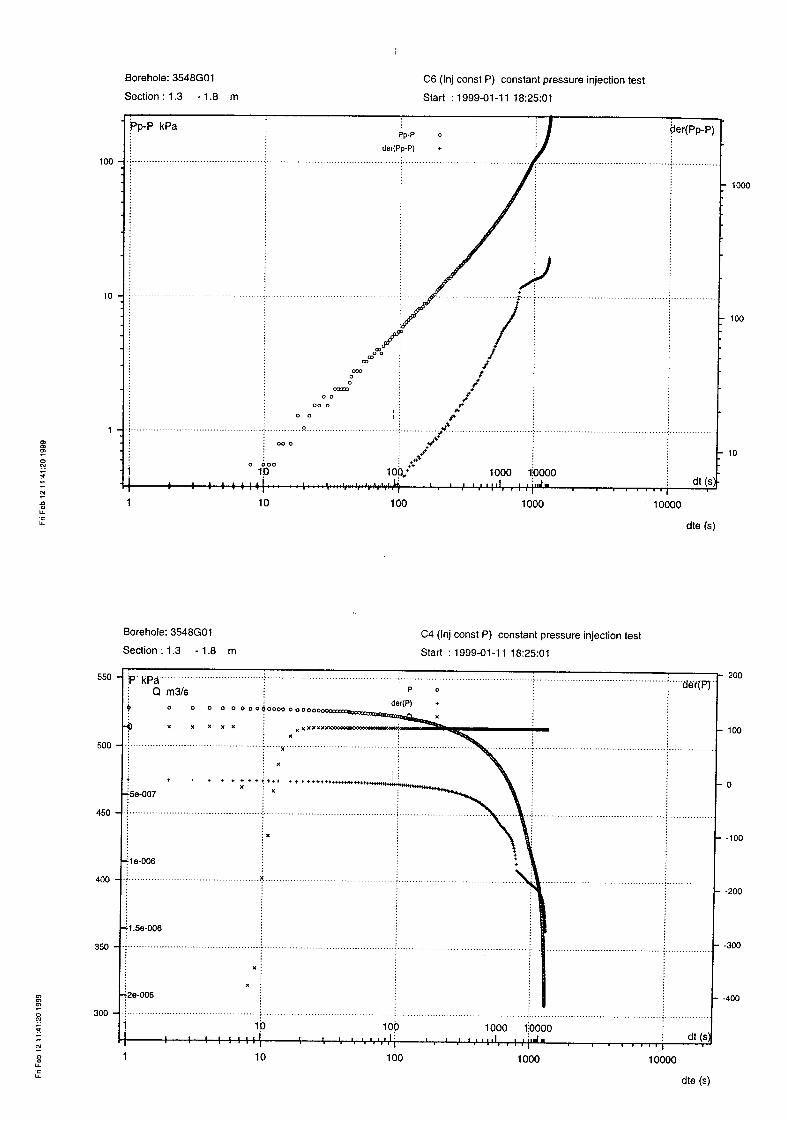
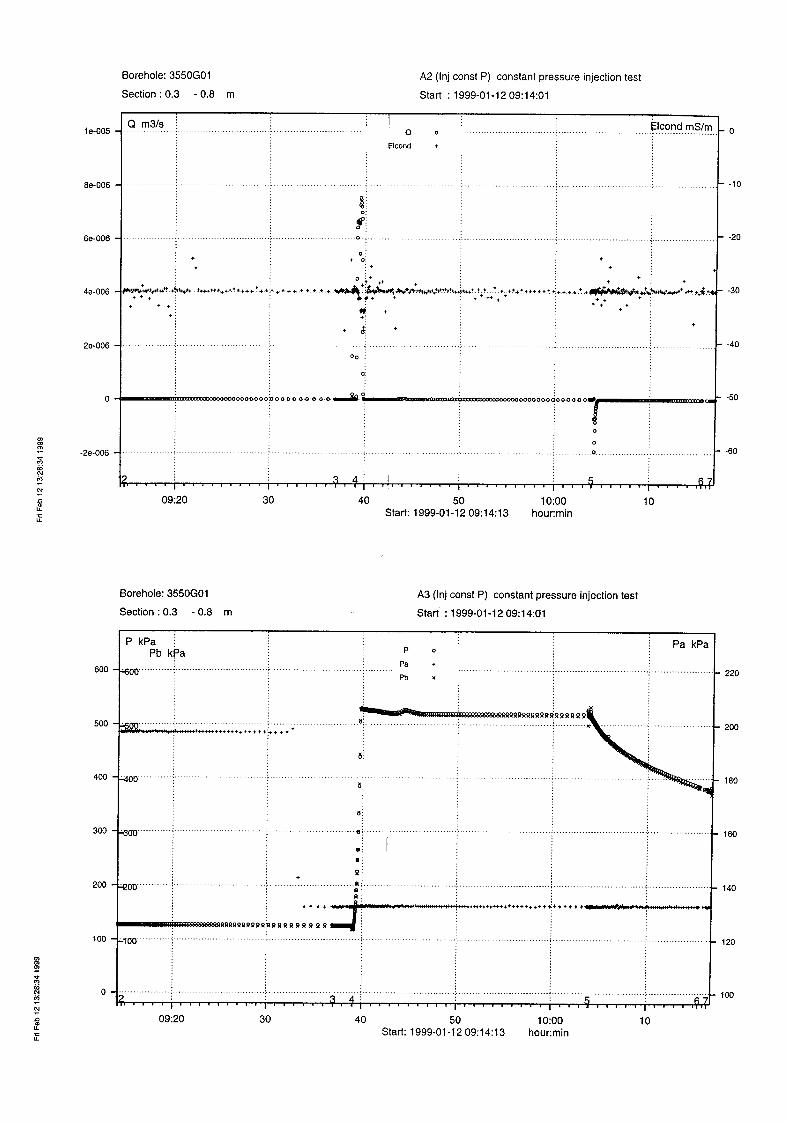
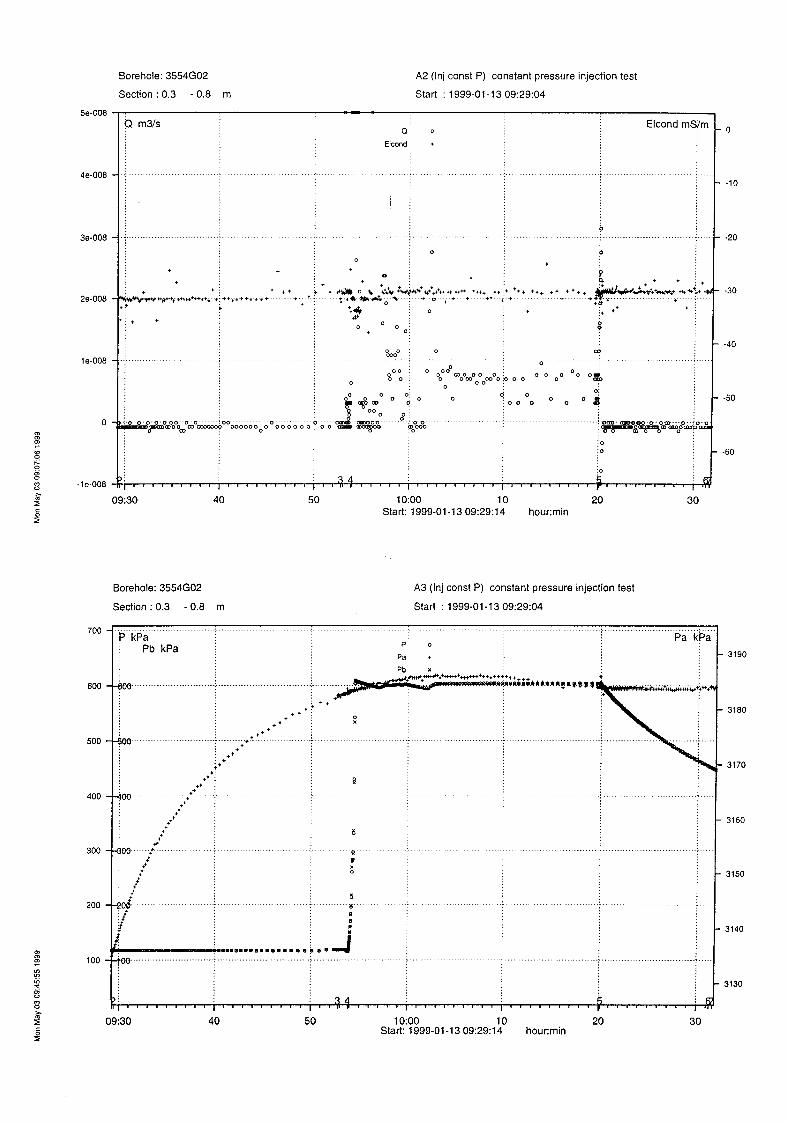
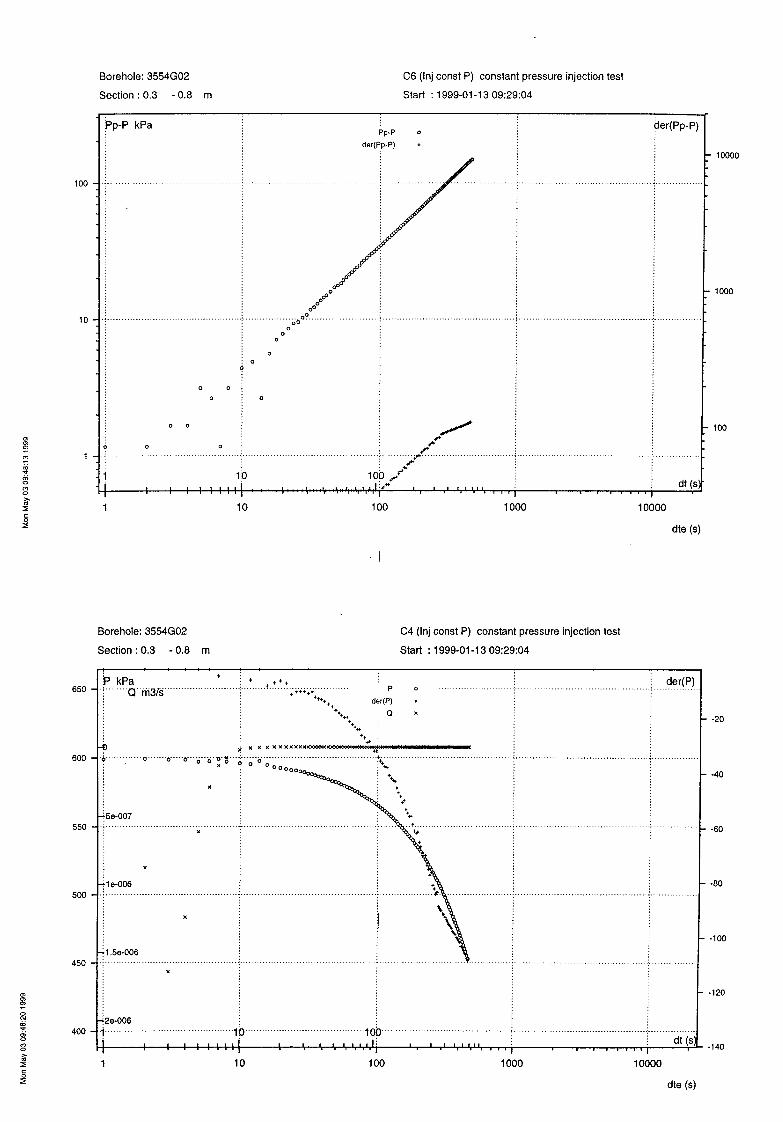
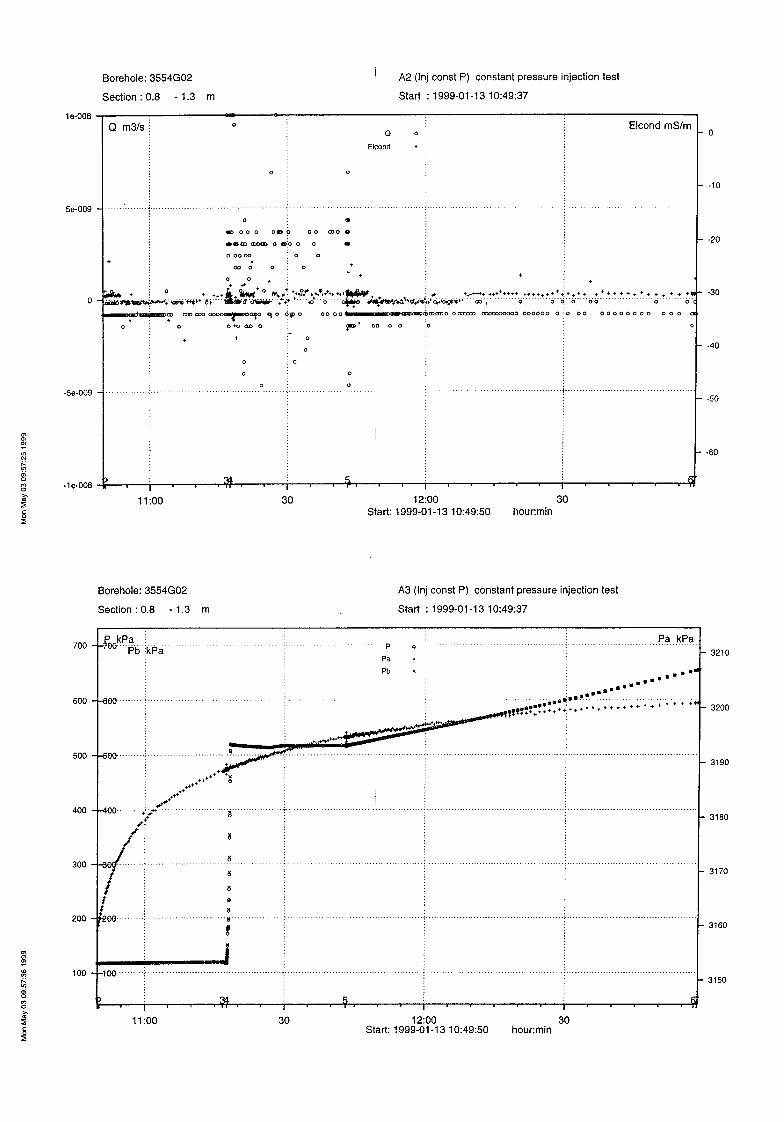
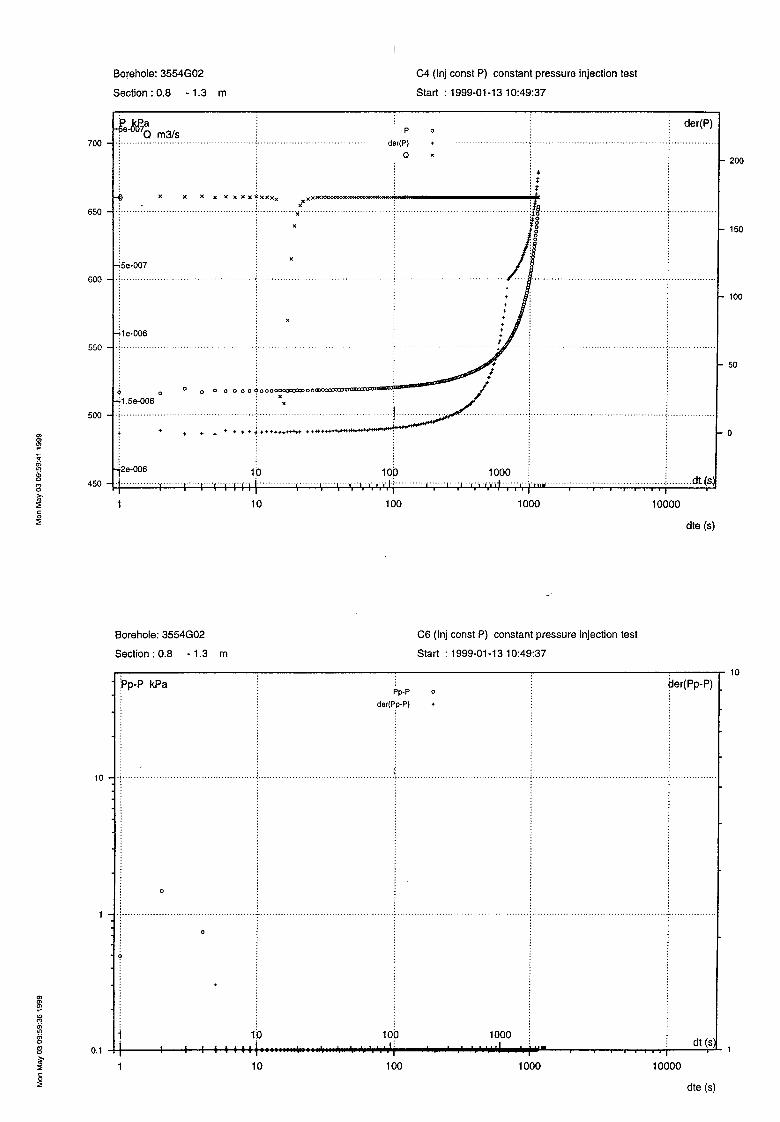
APPENDIX 3
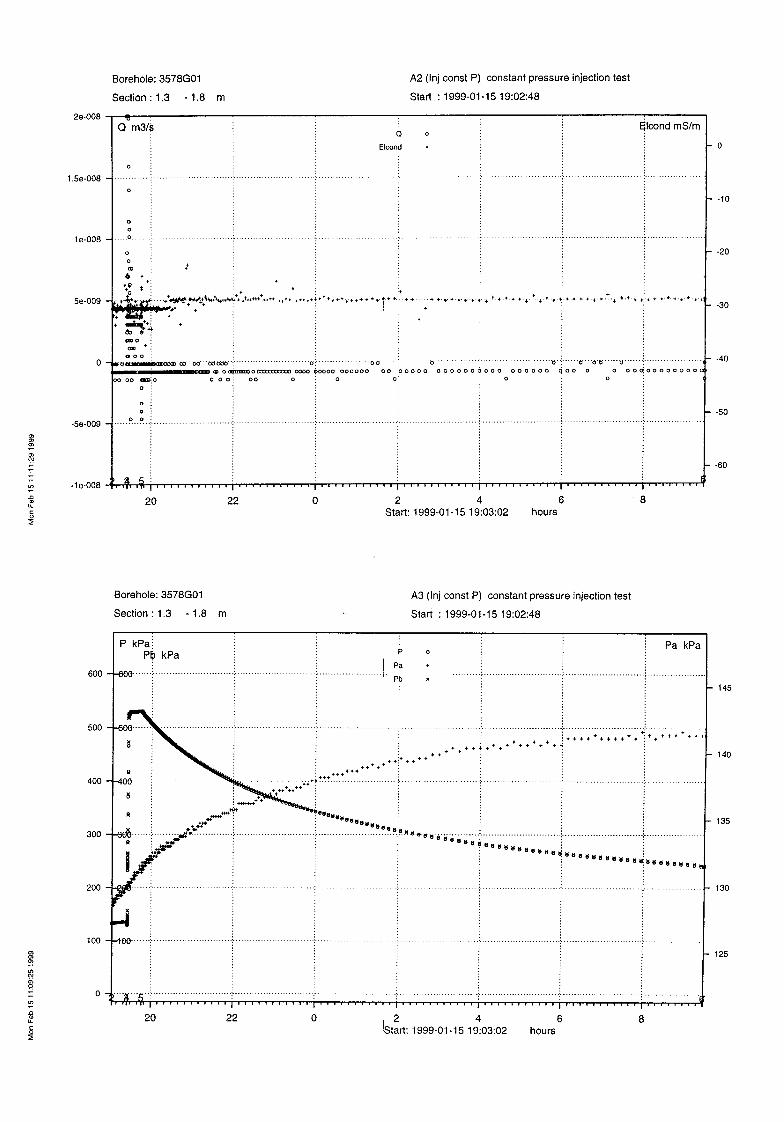
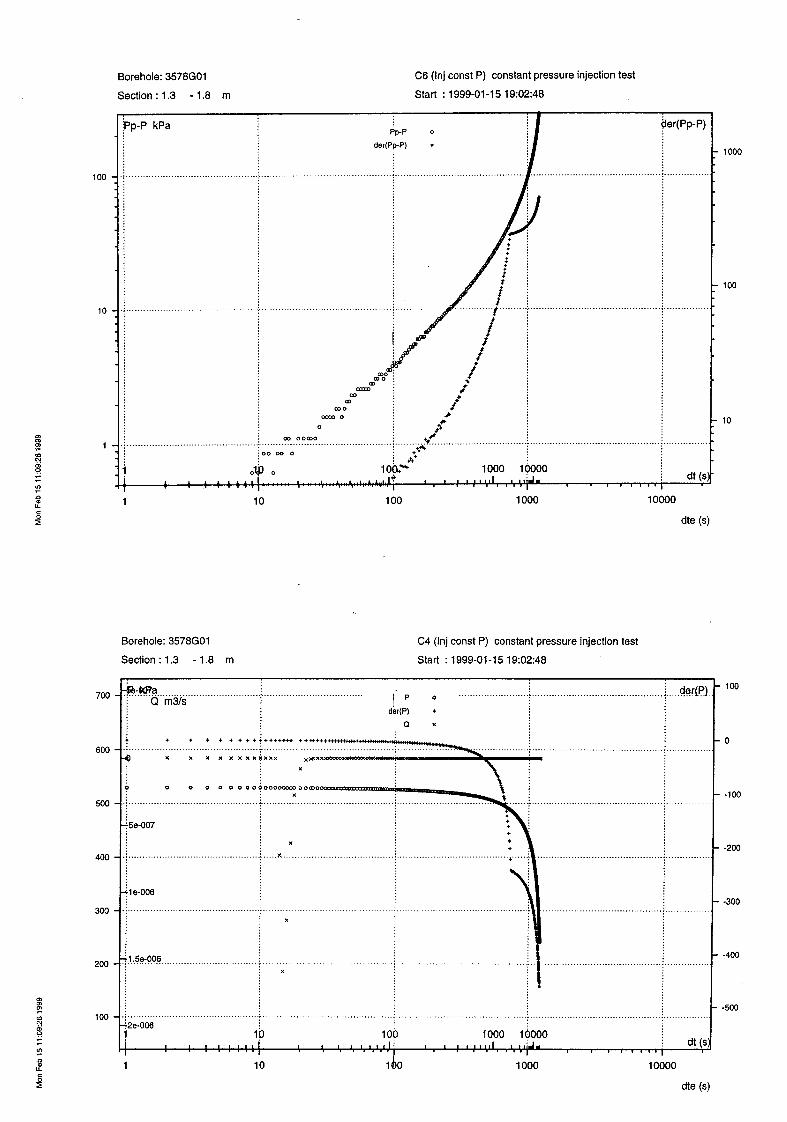
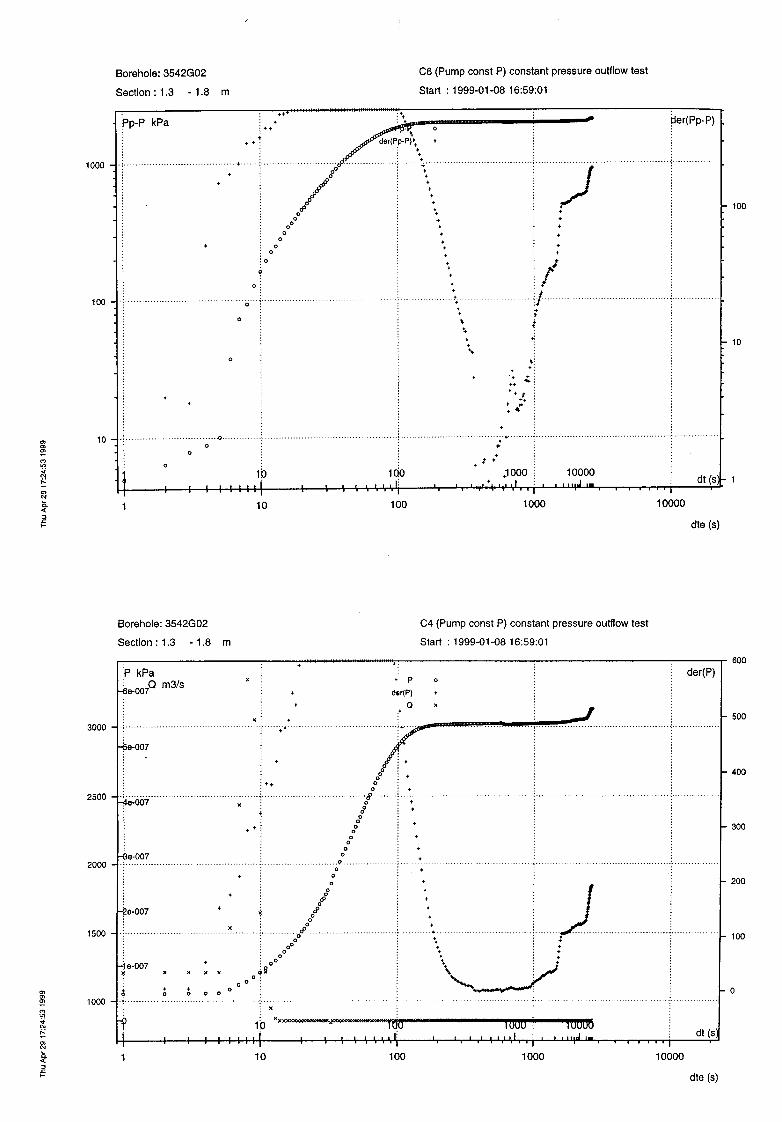
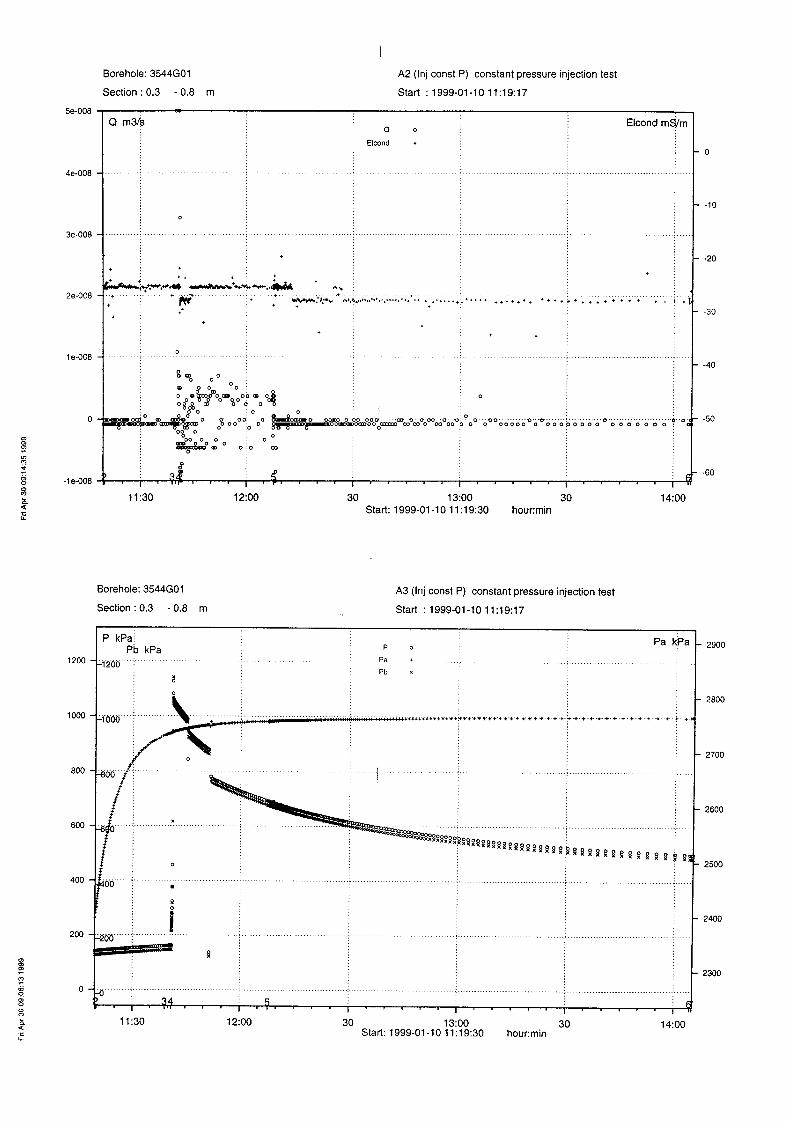
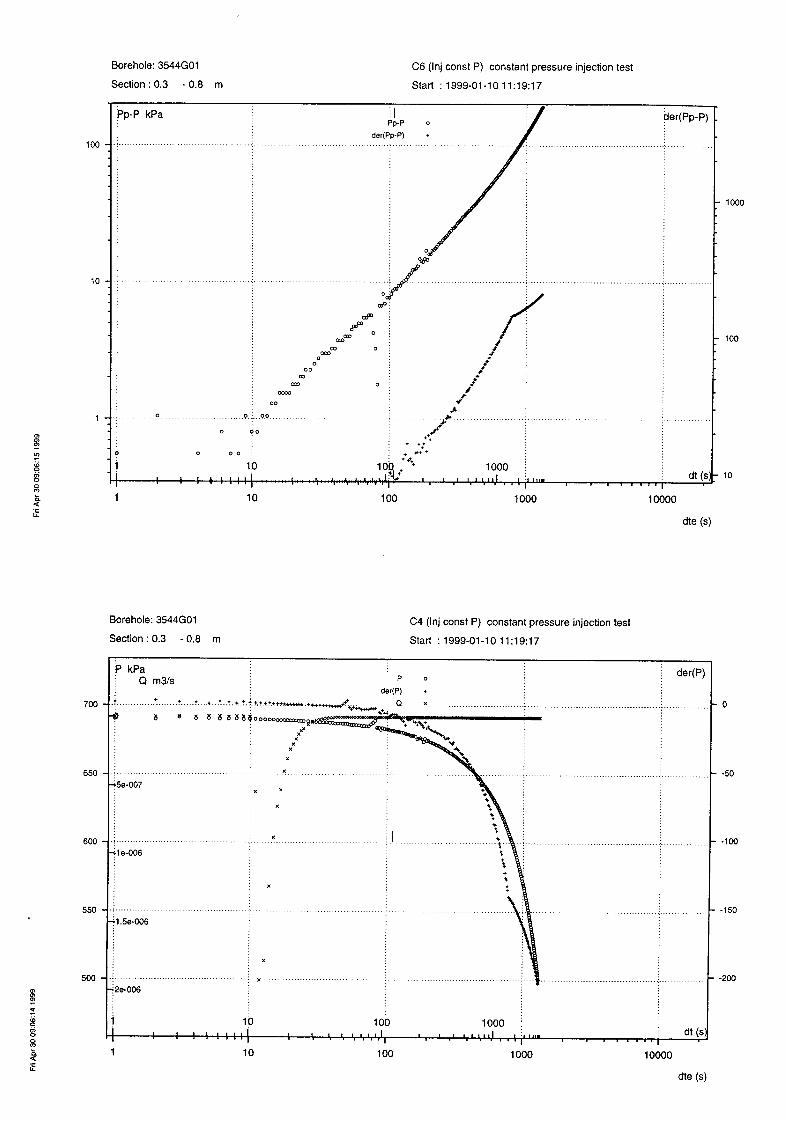
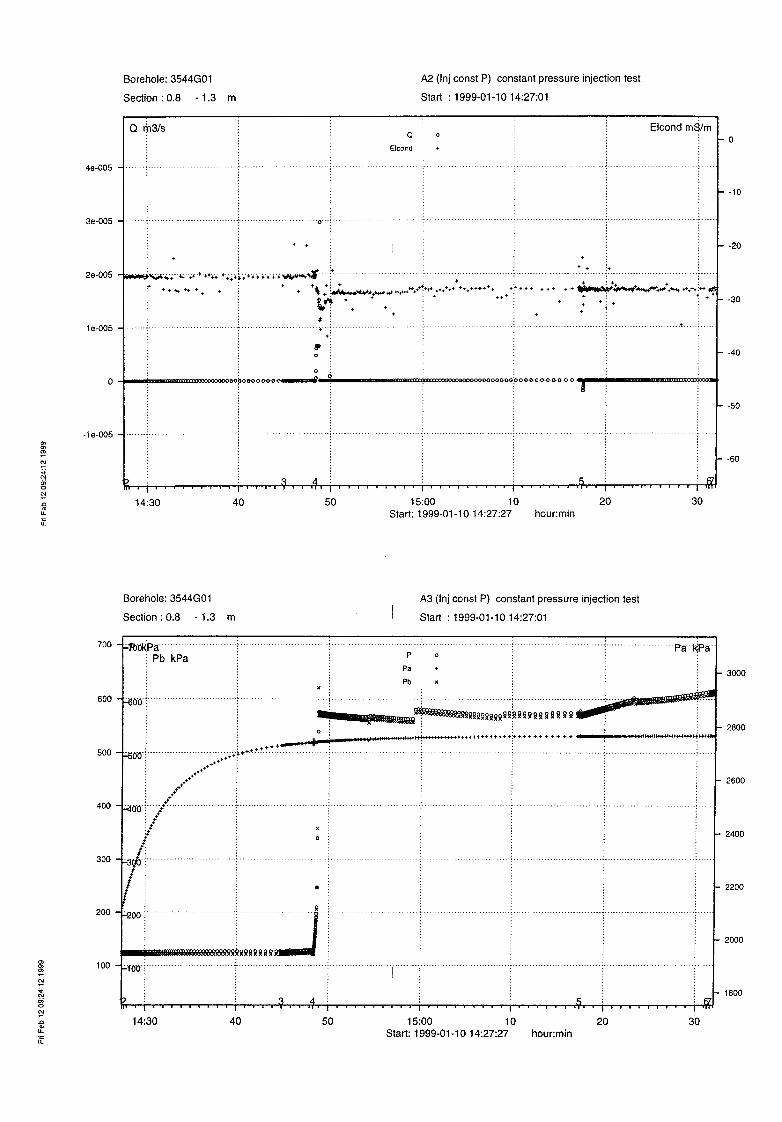
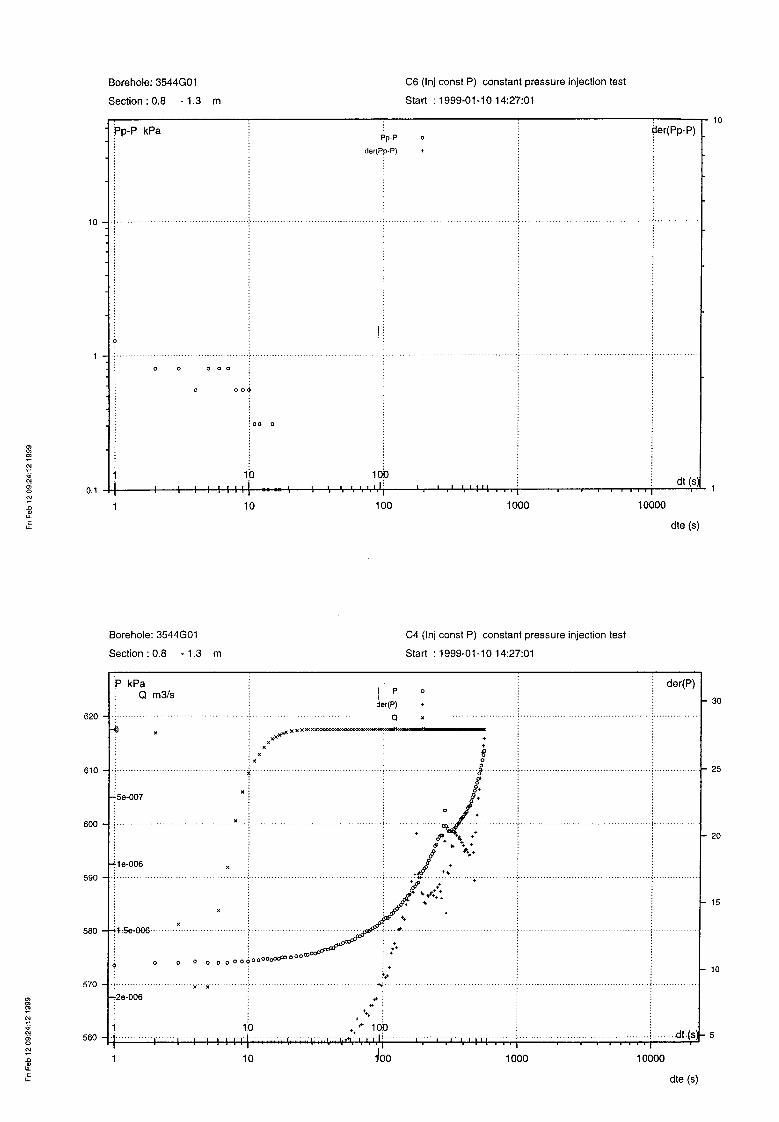
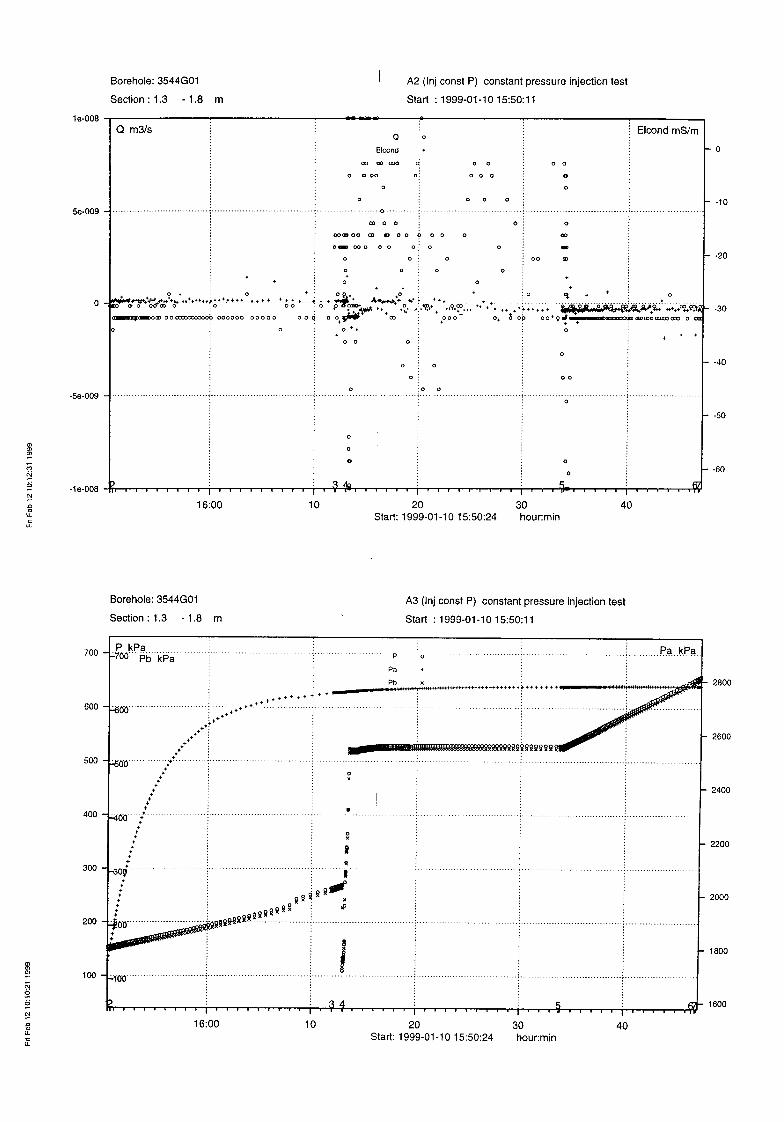
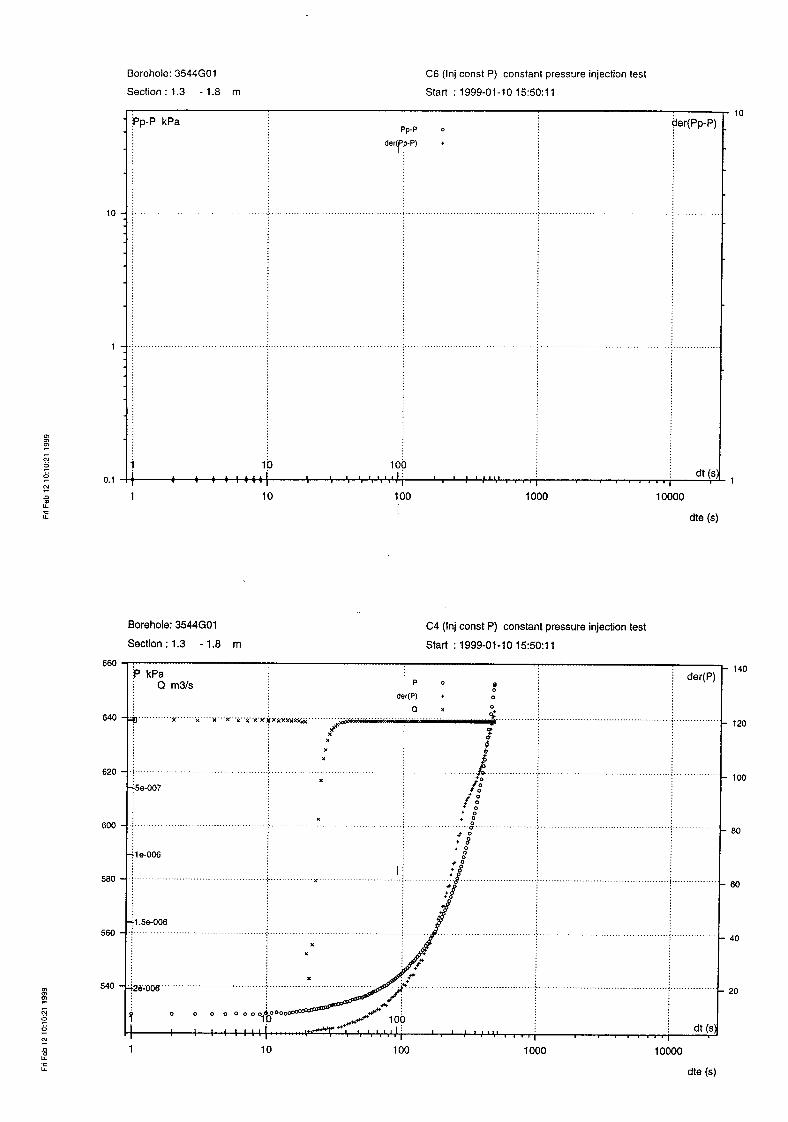
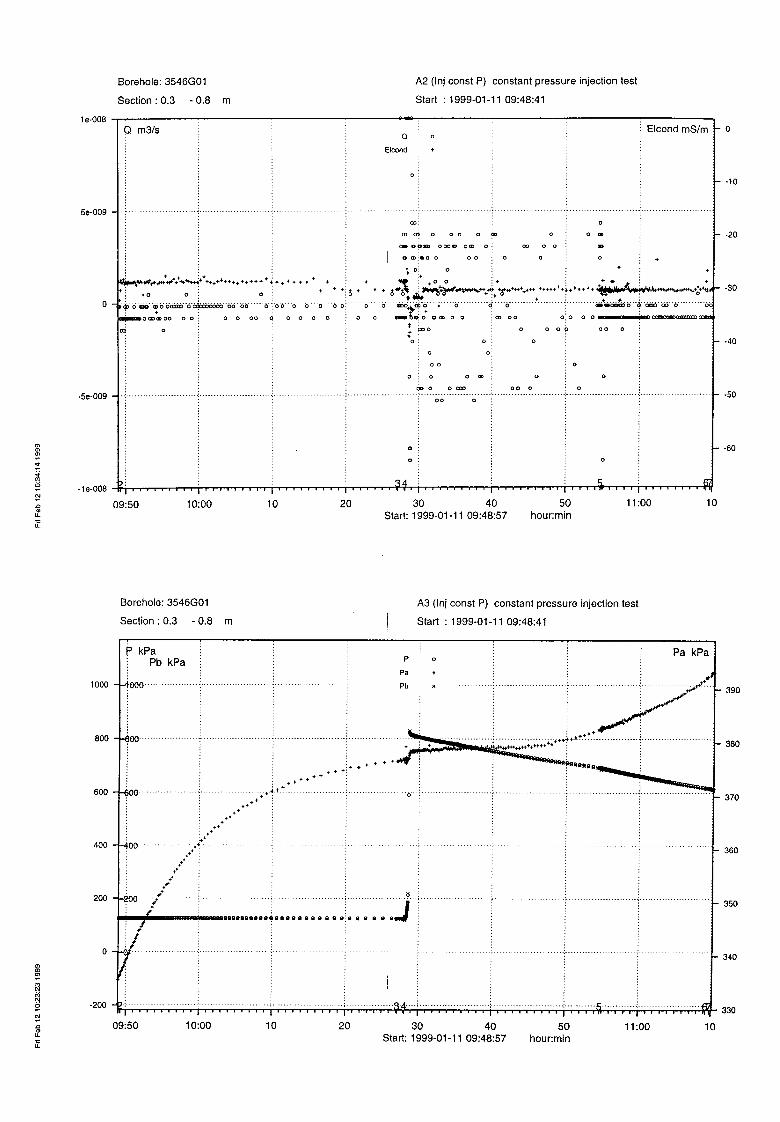
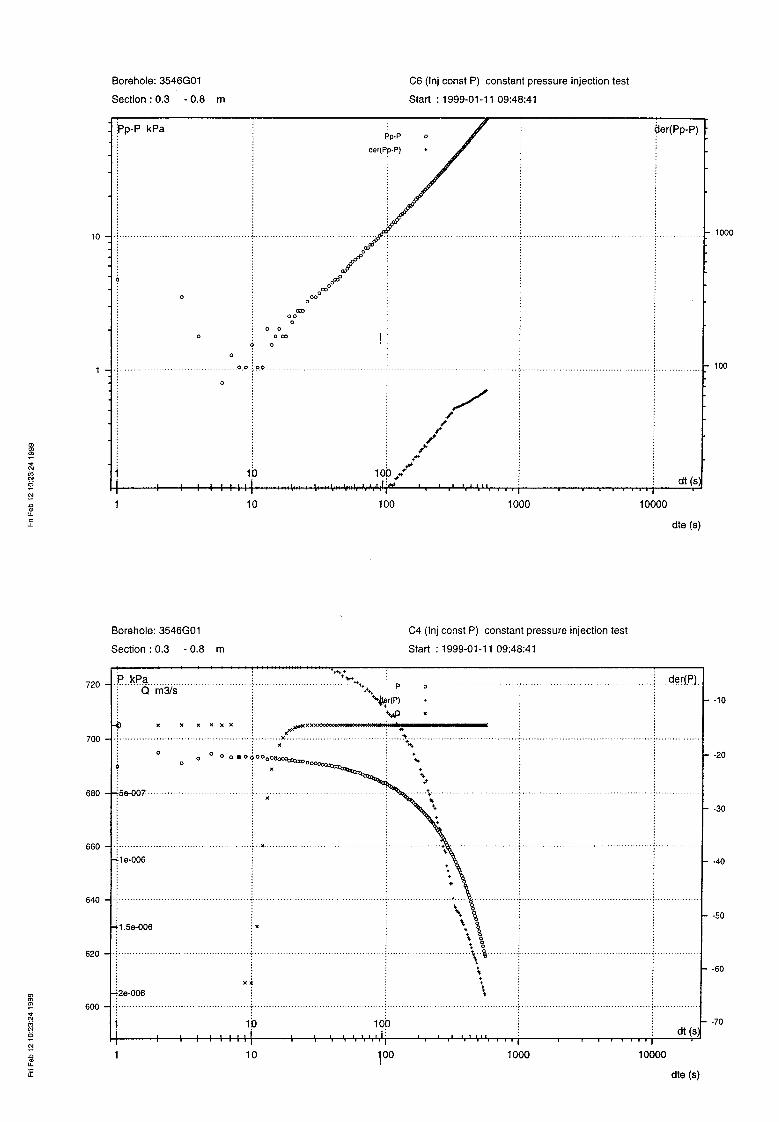
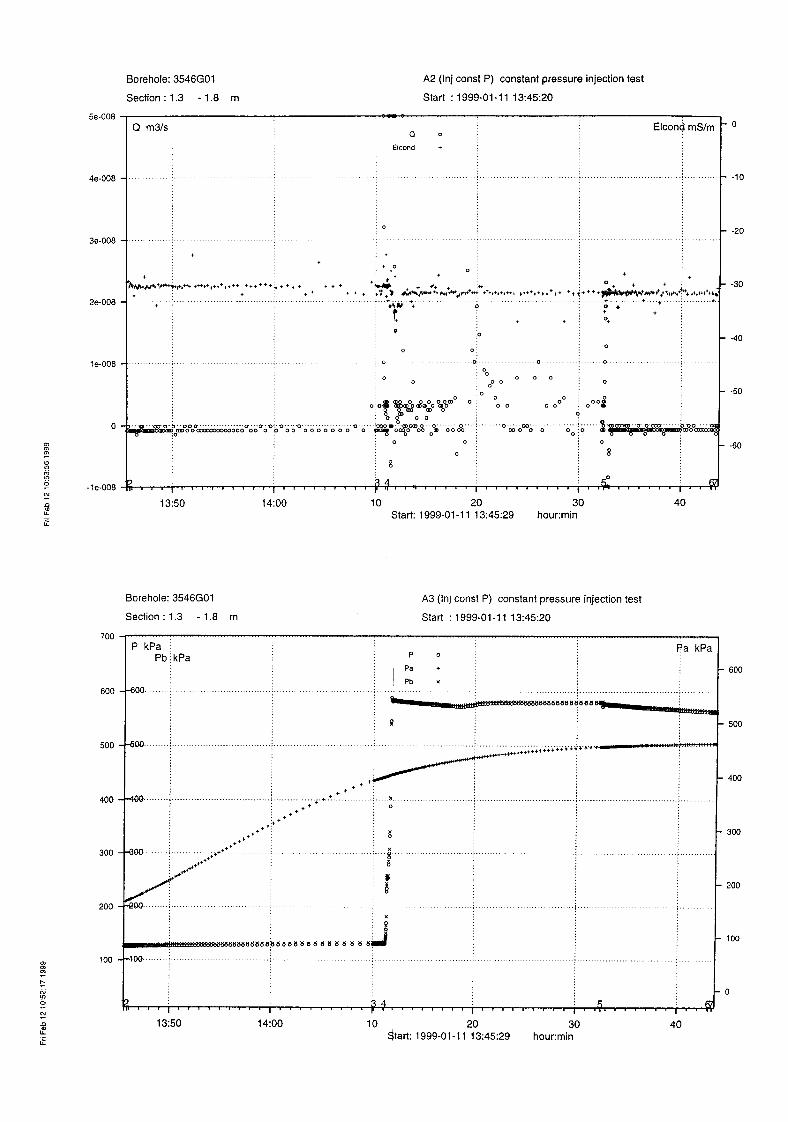
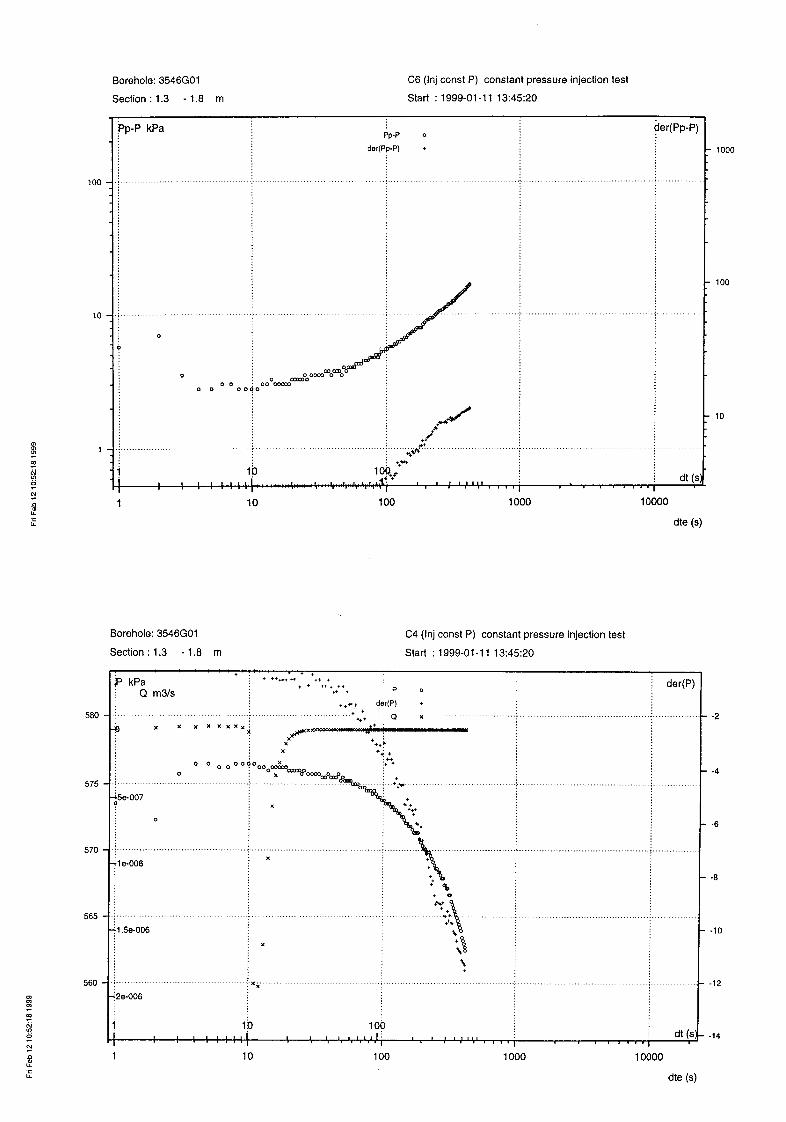
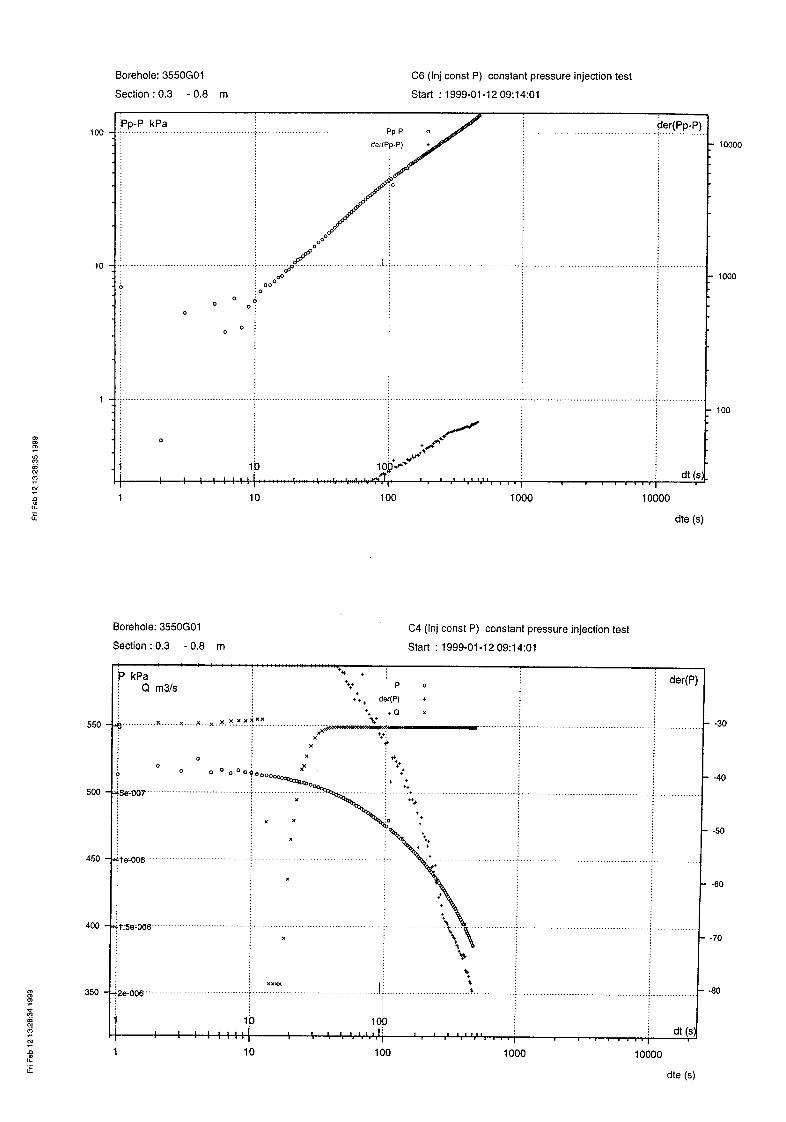
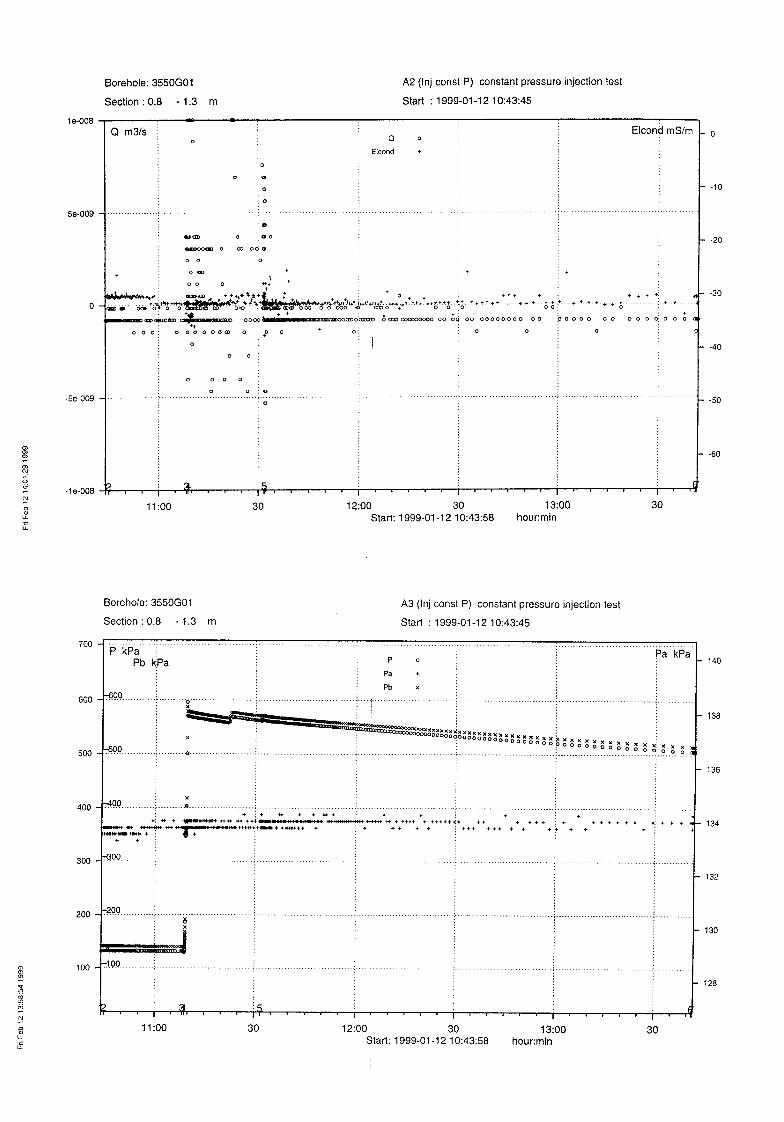
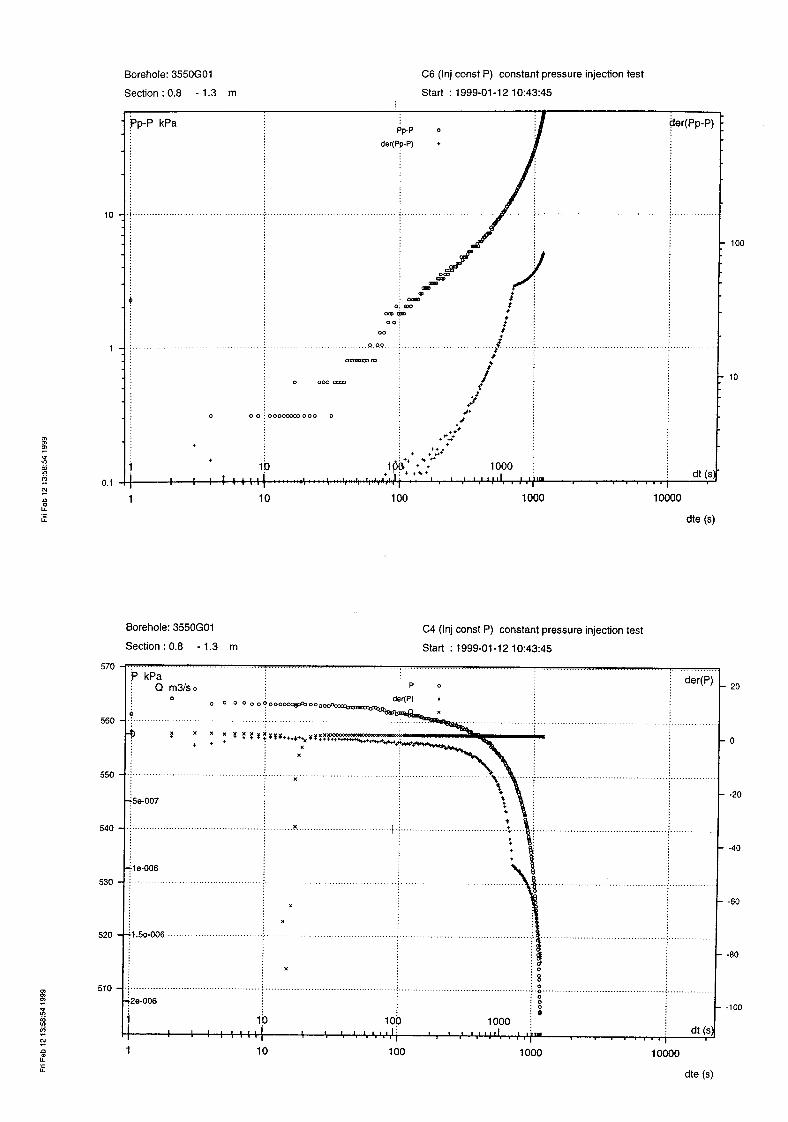
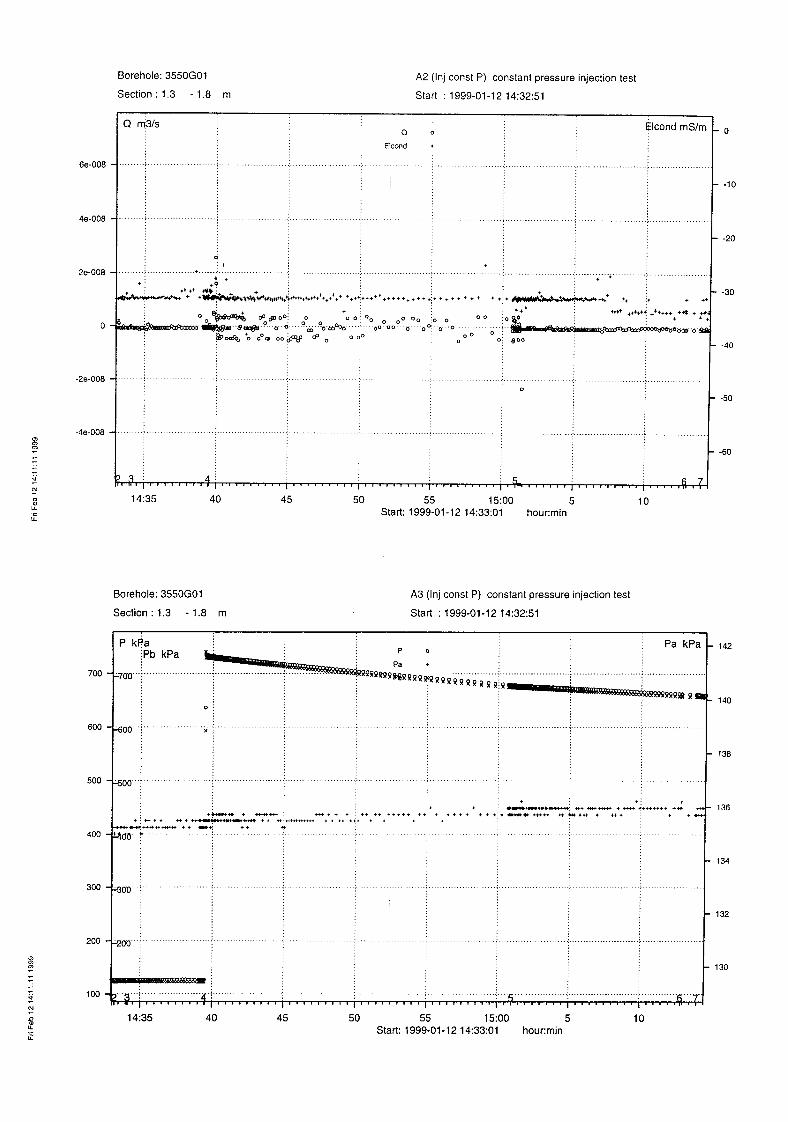
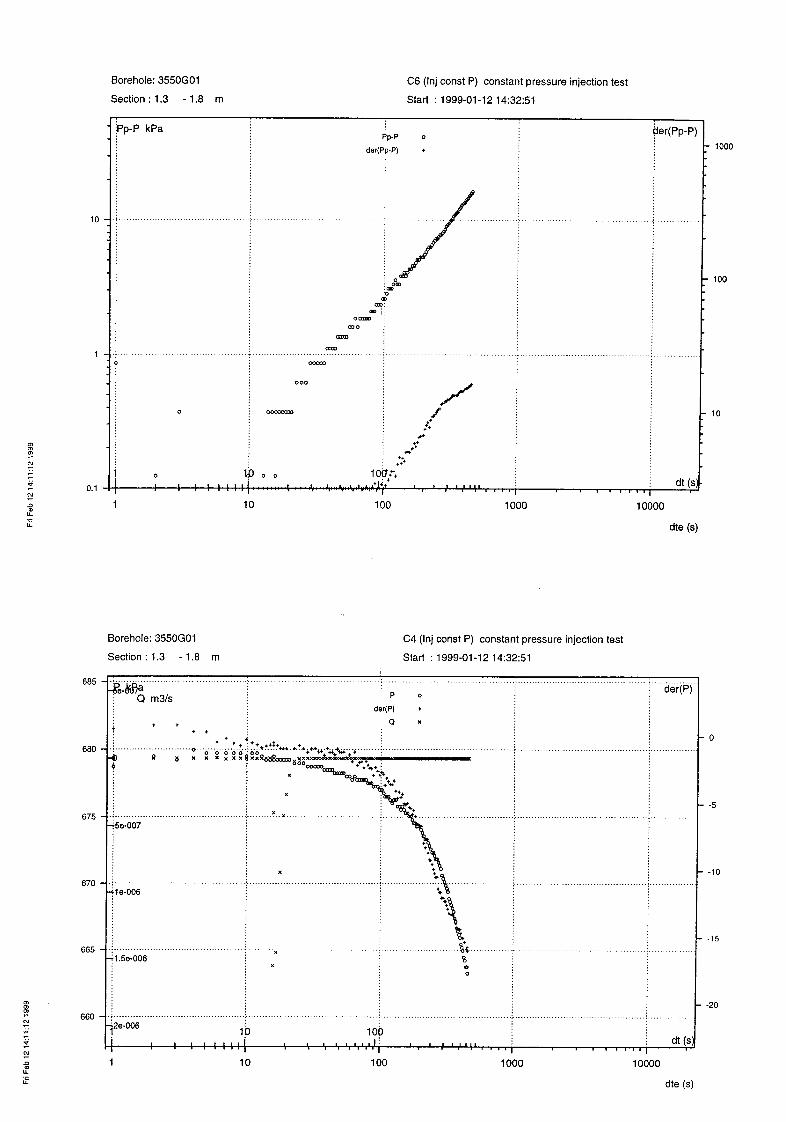
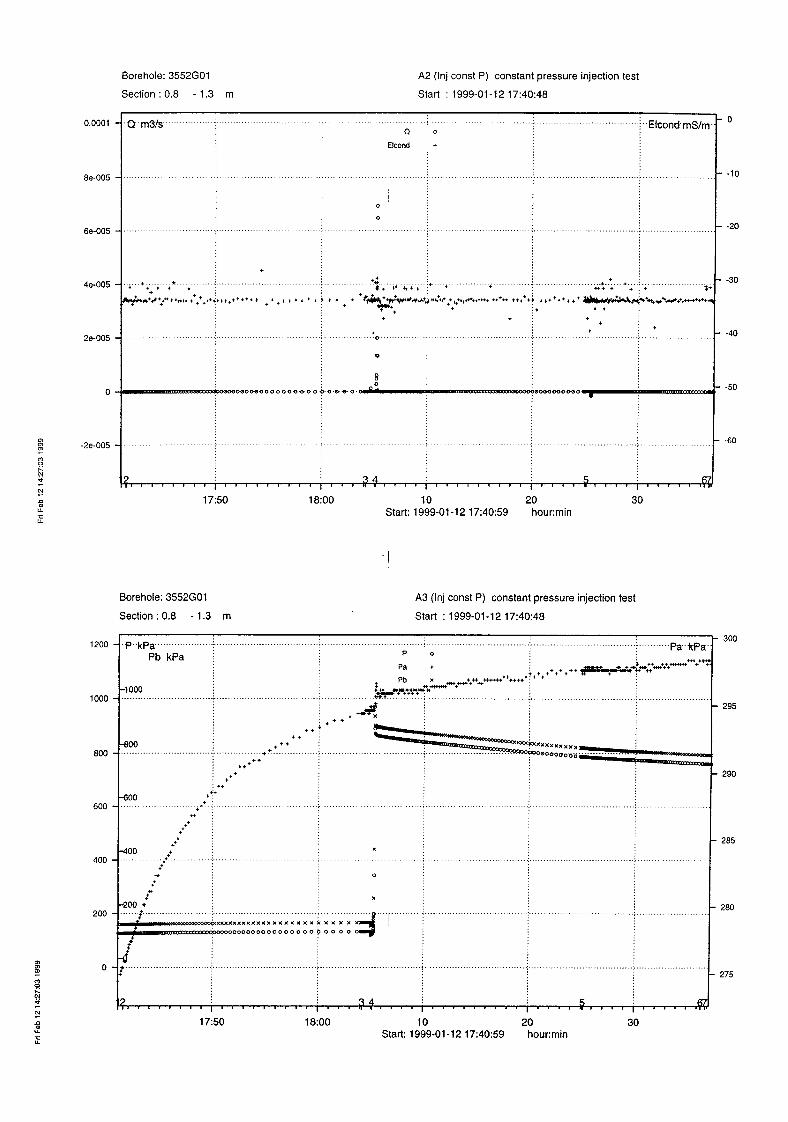
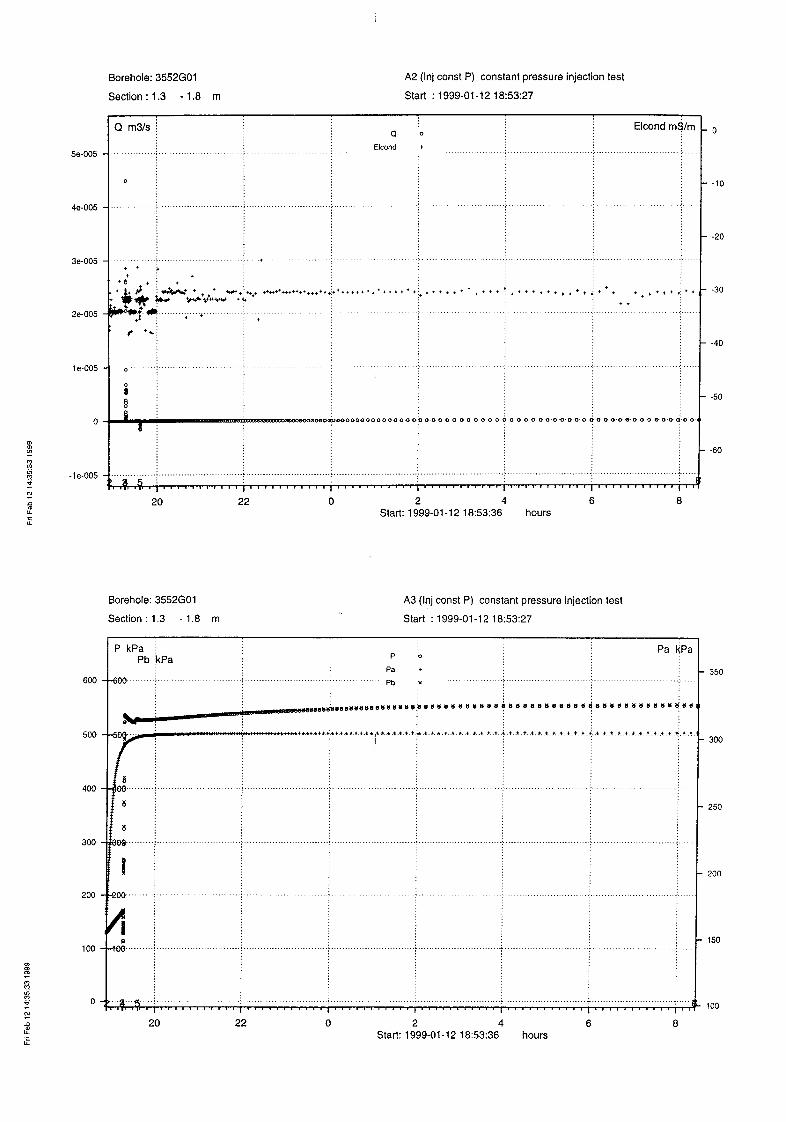
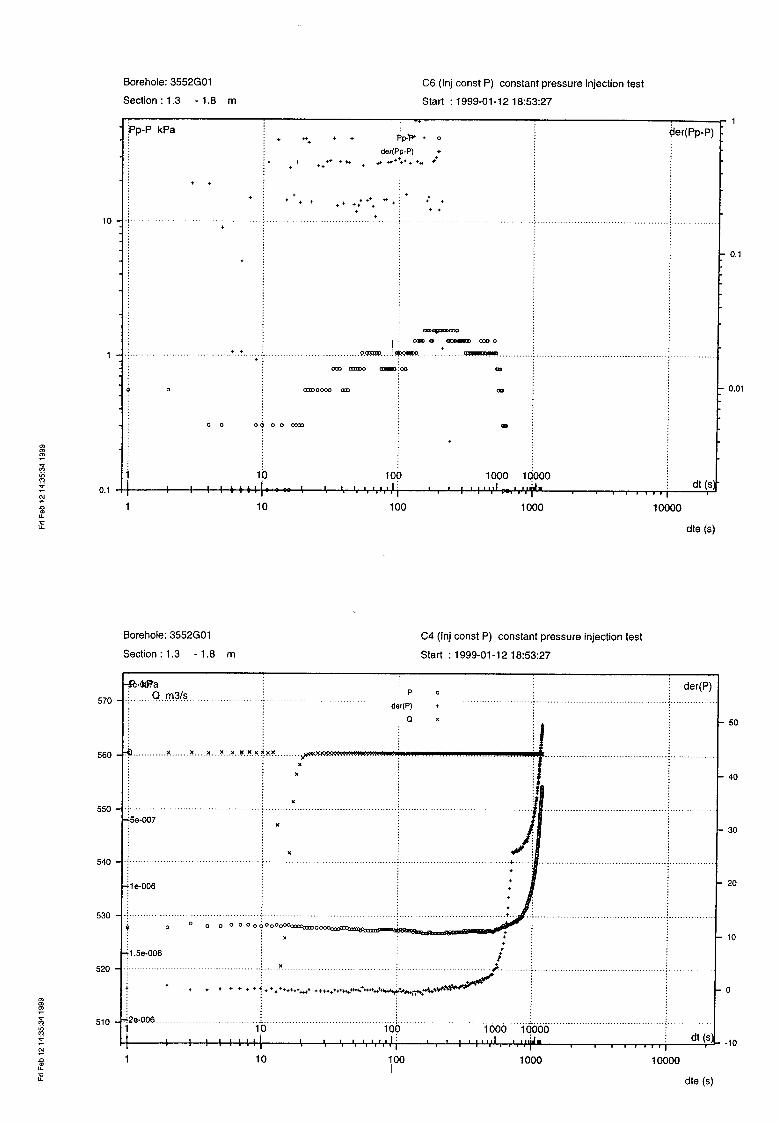
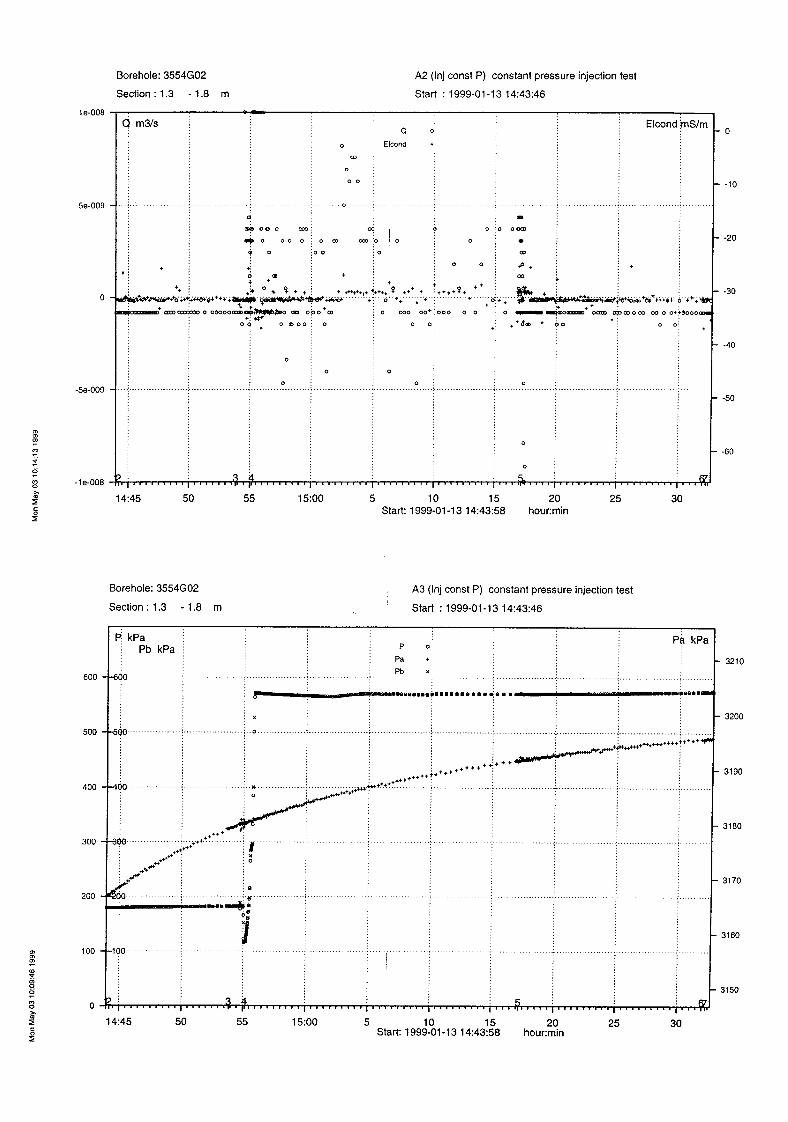
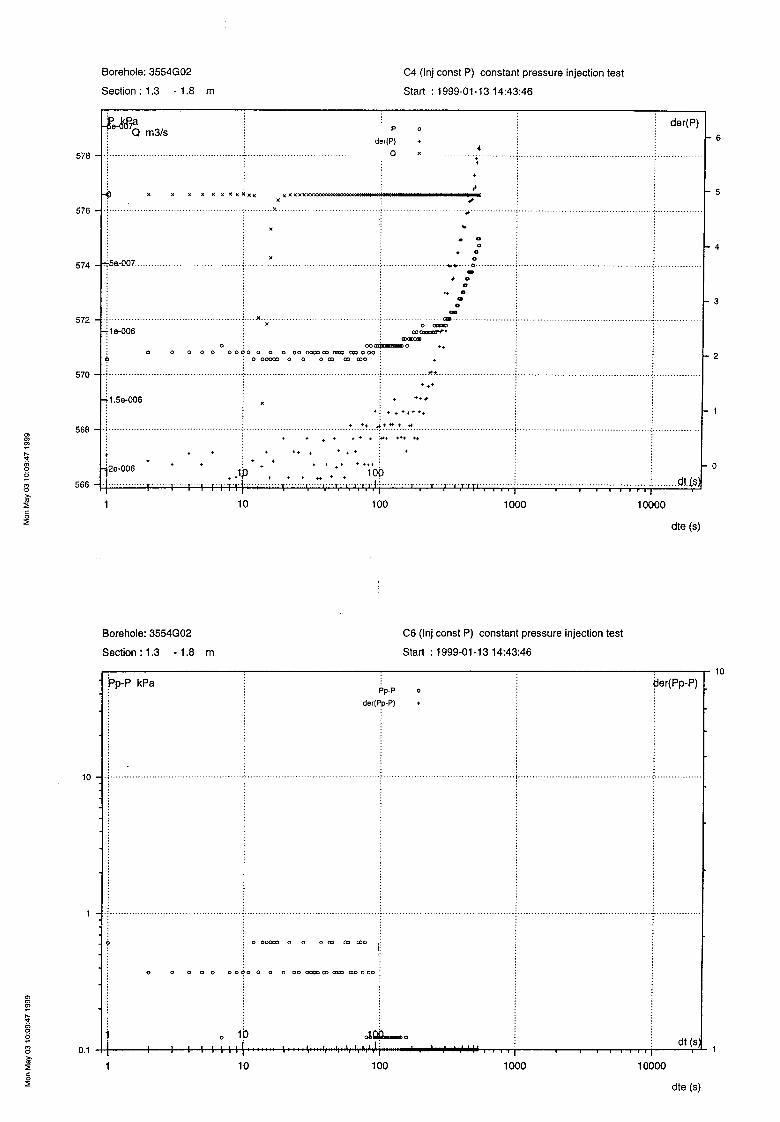
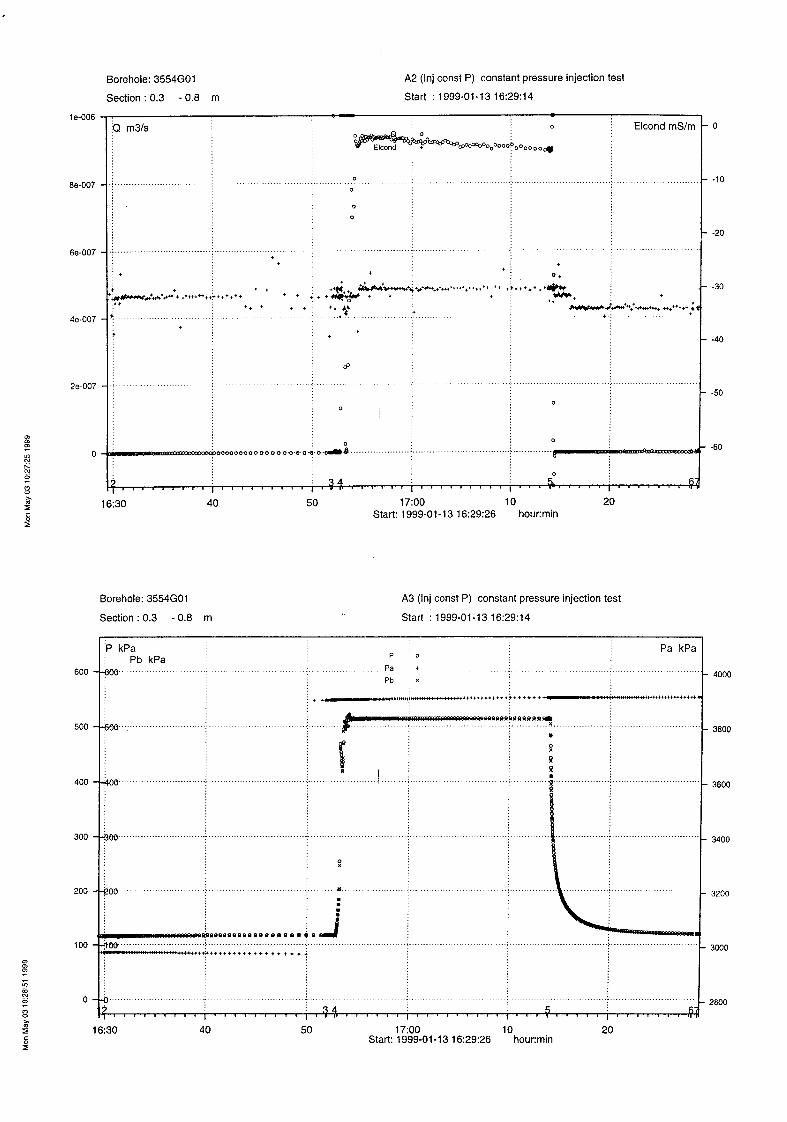
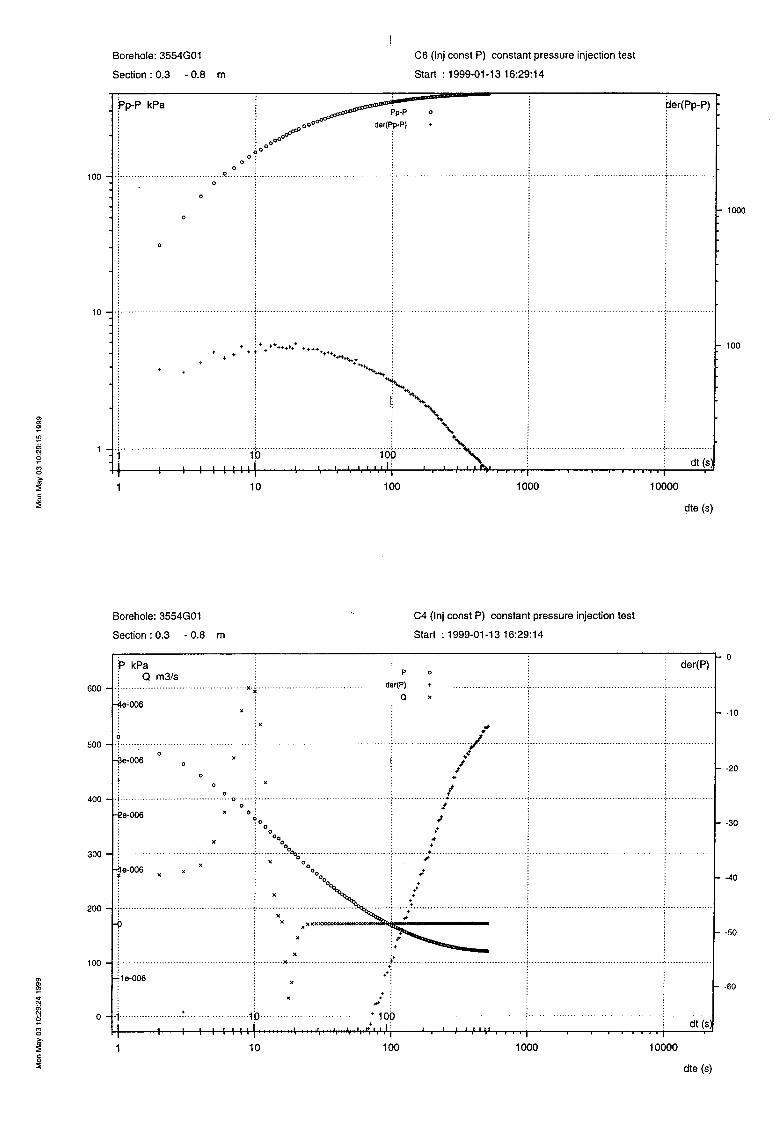
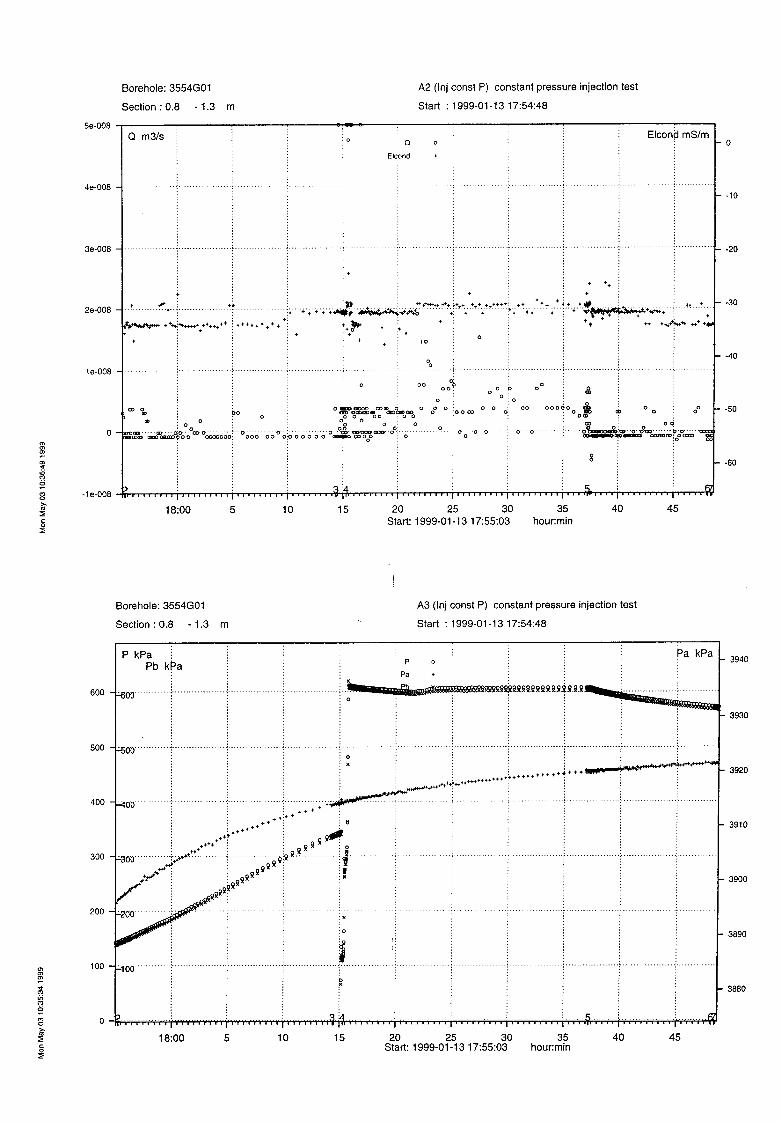
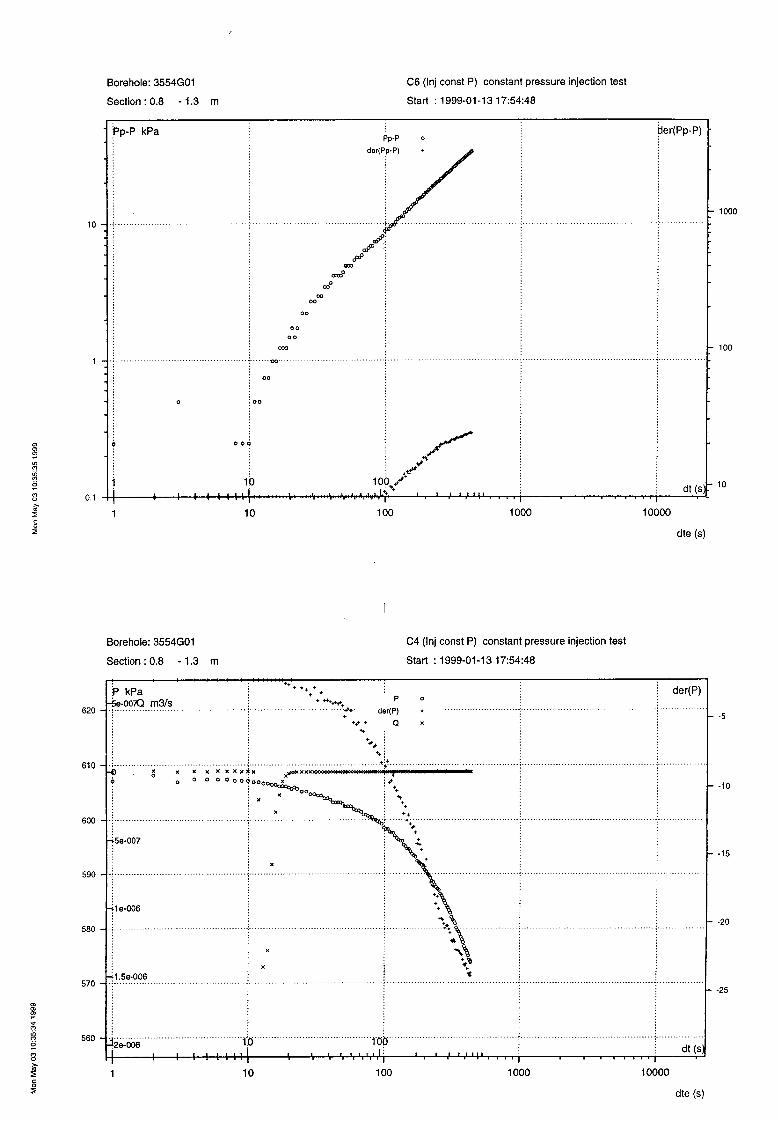
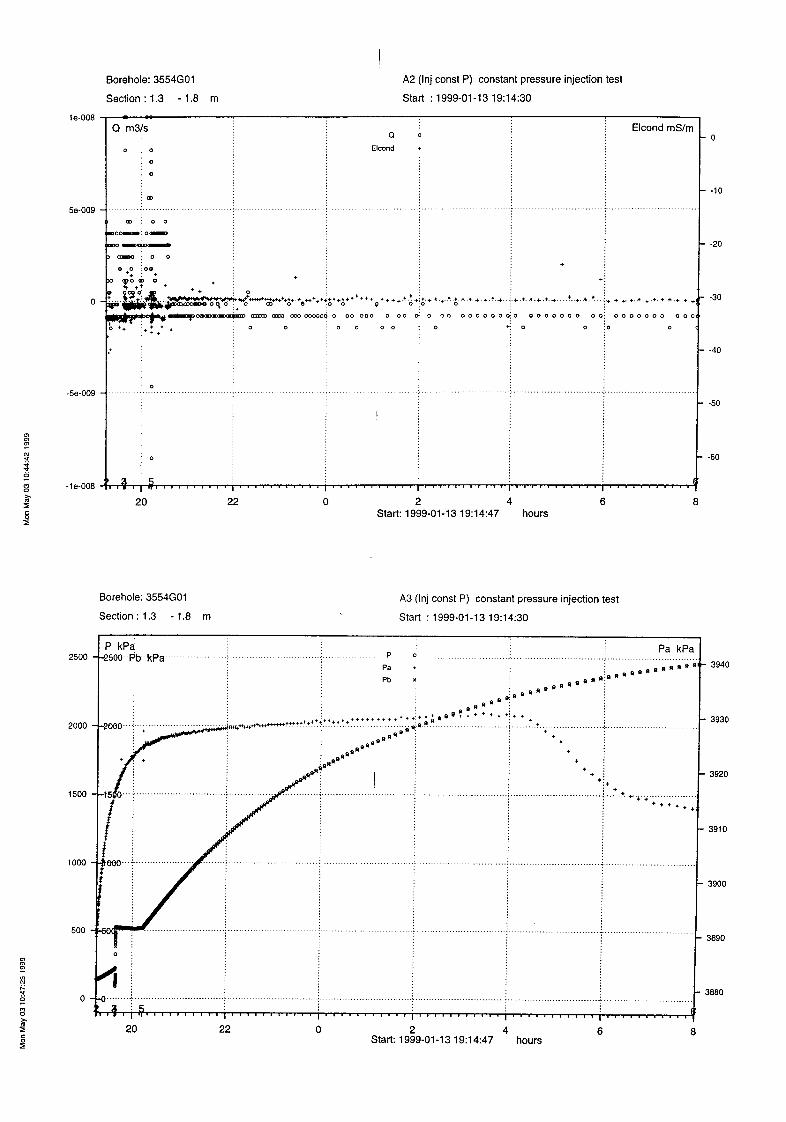
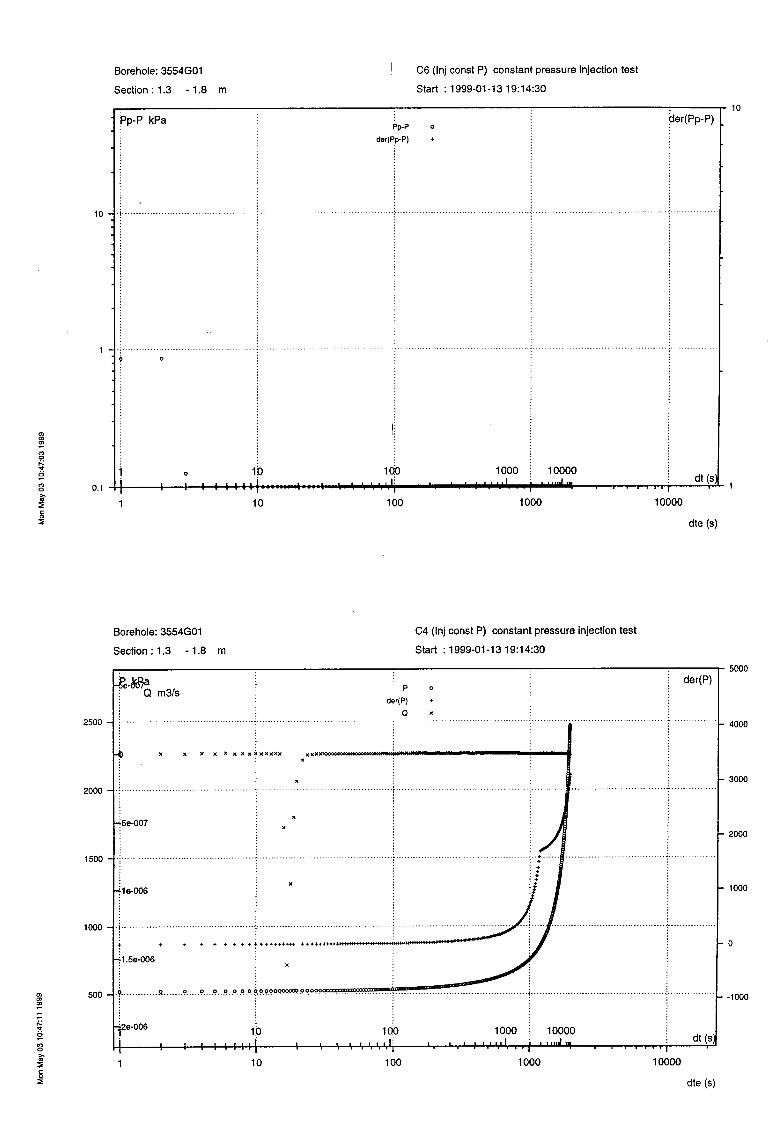
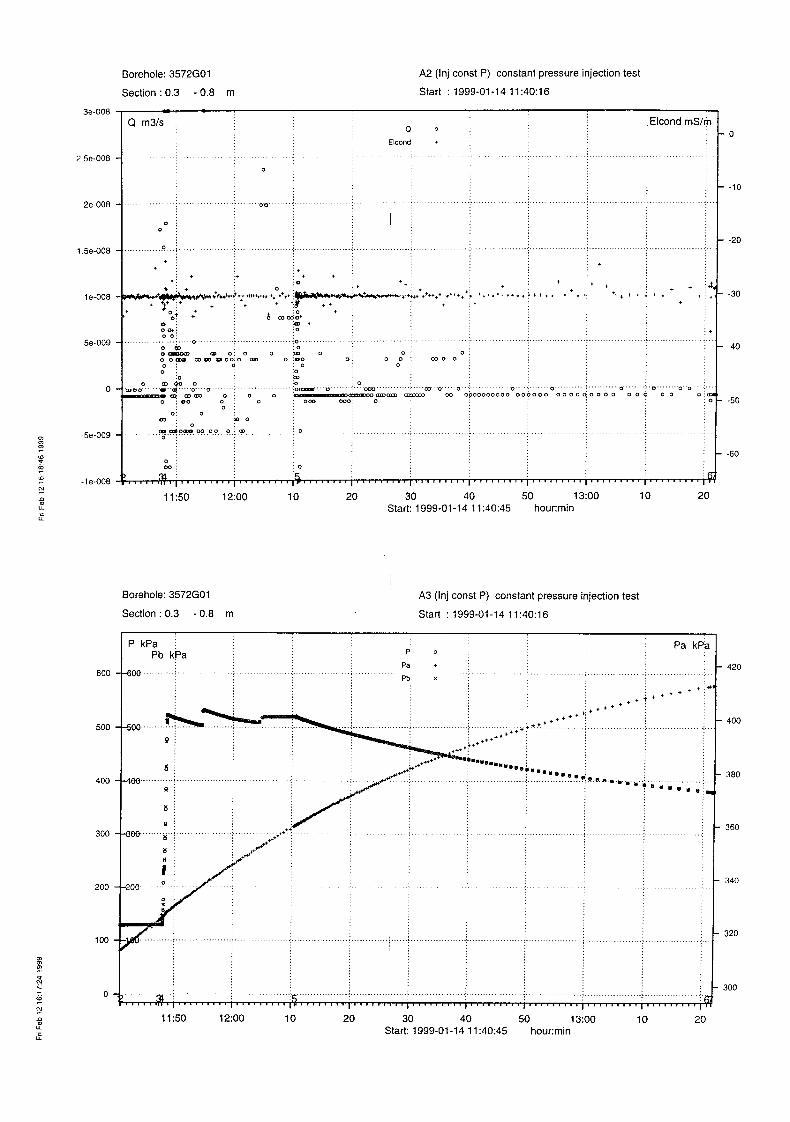
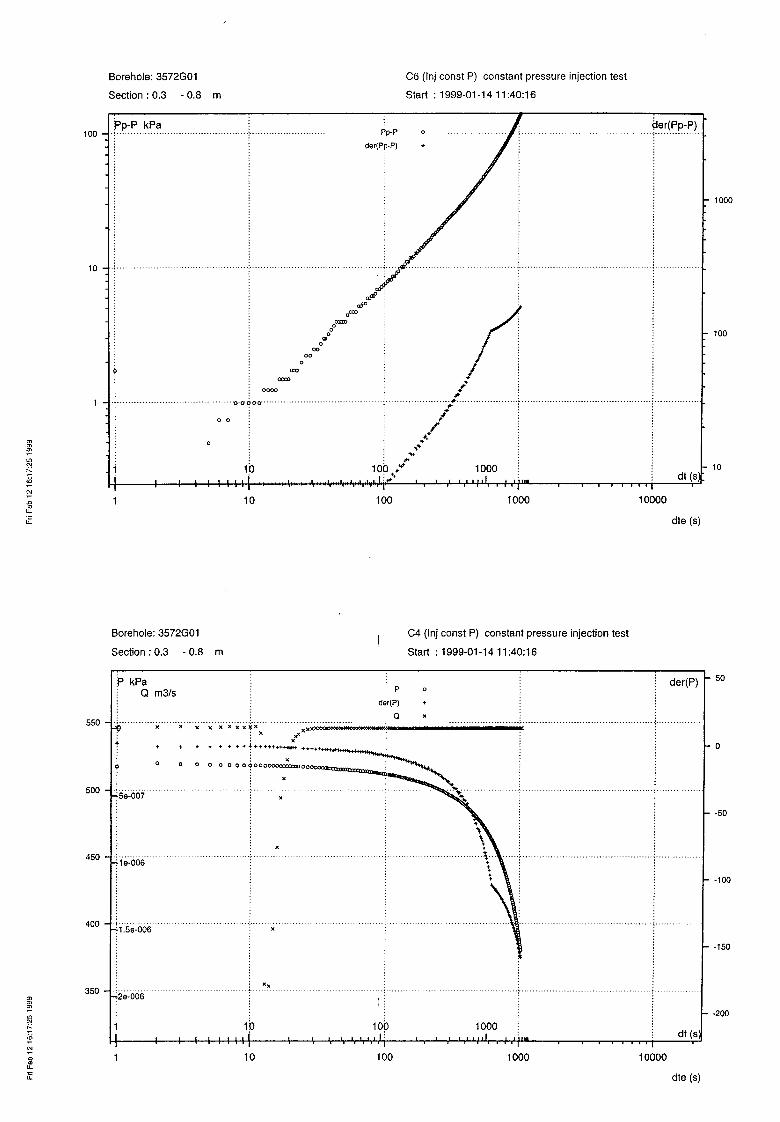
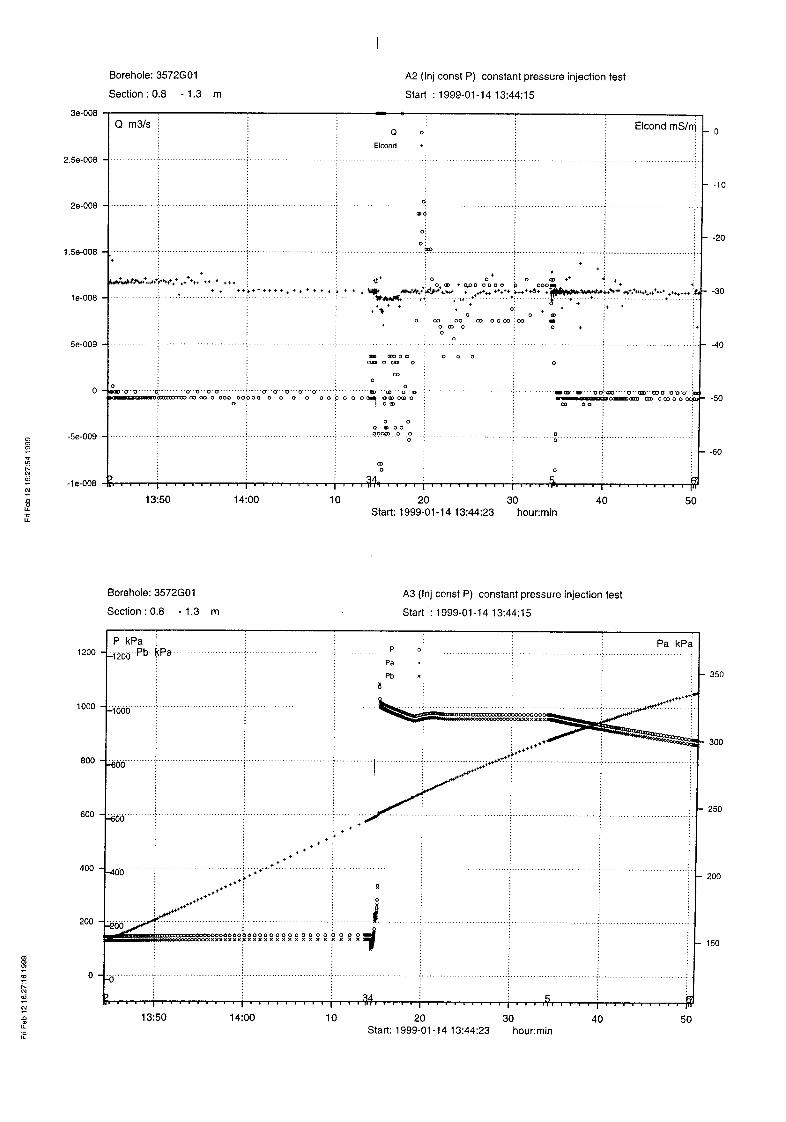
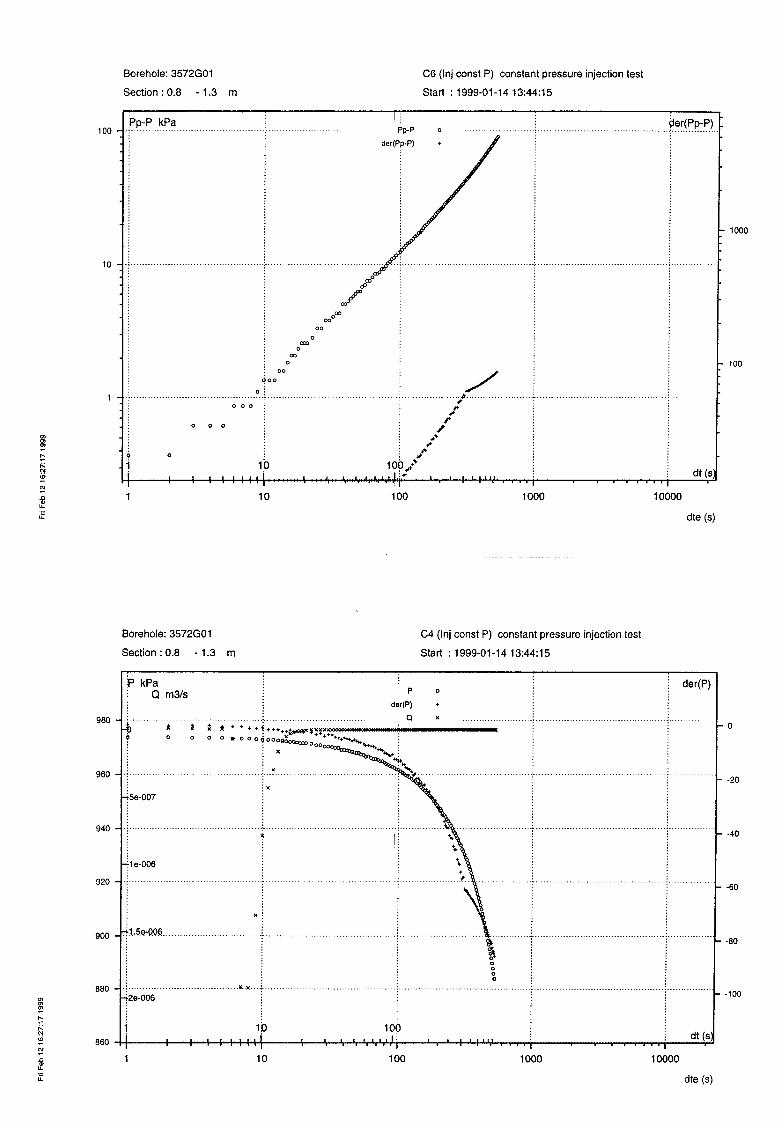
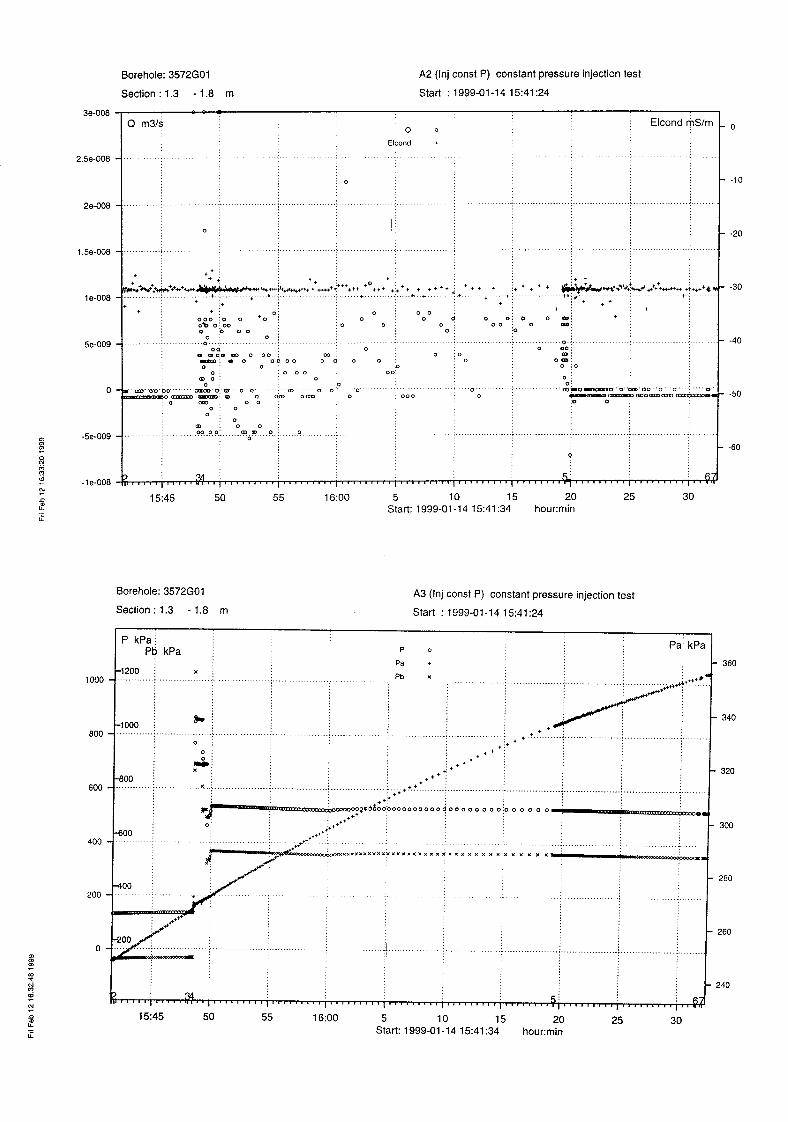
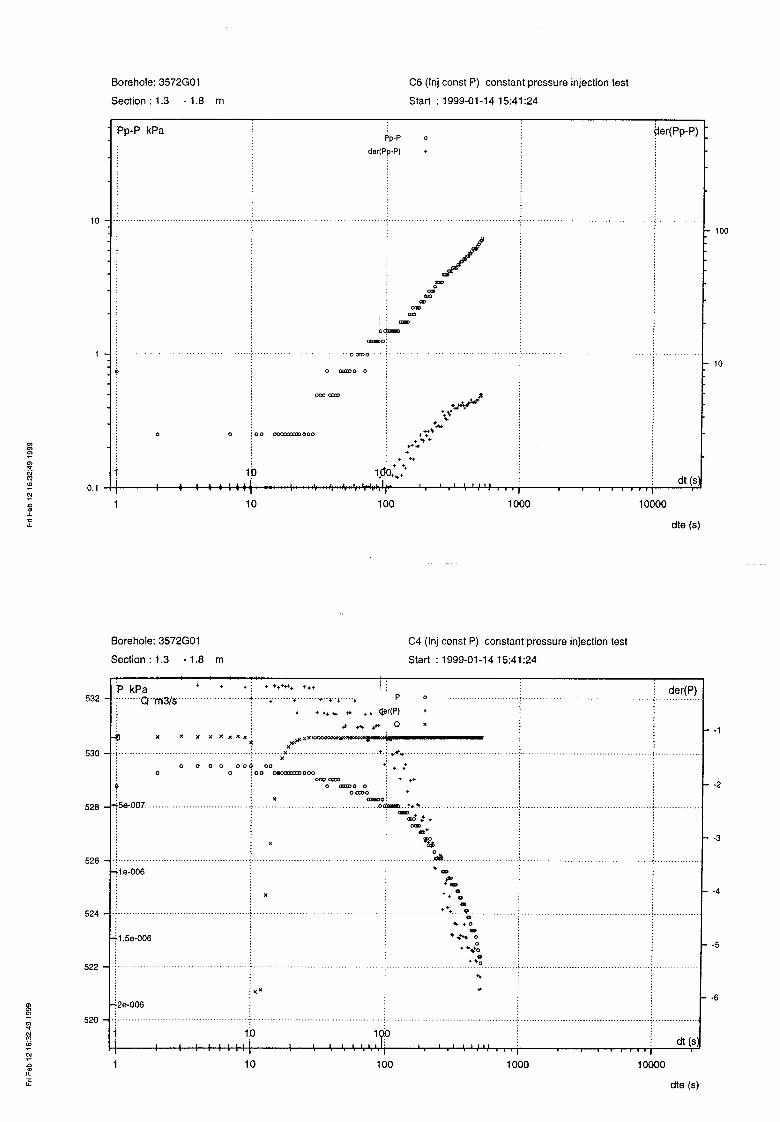
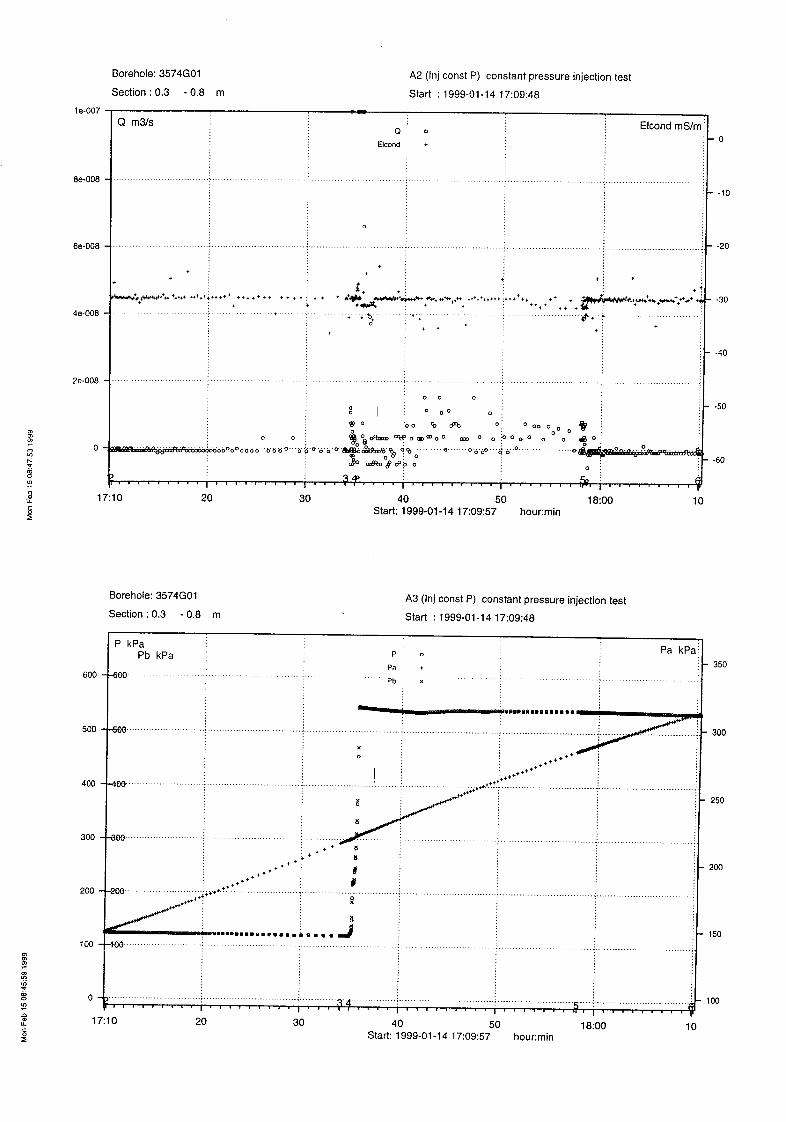
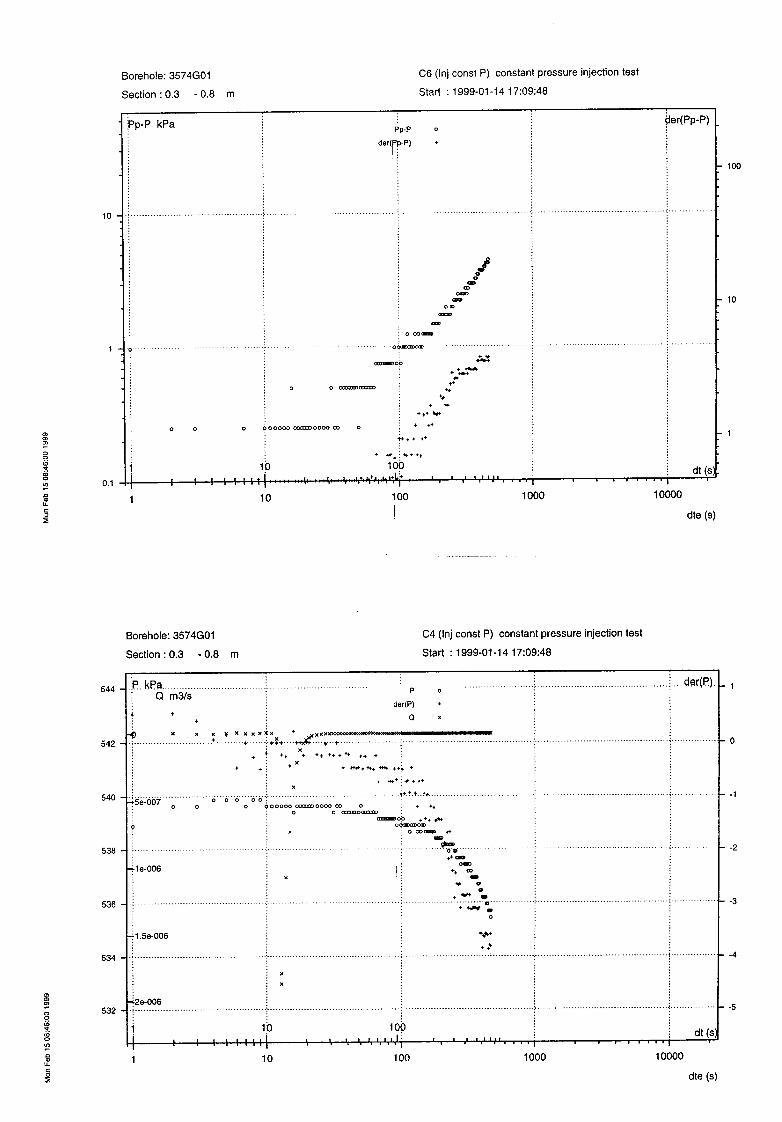
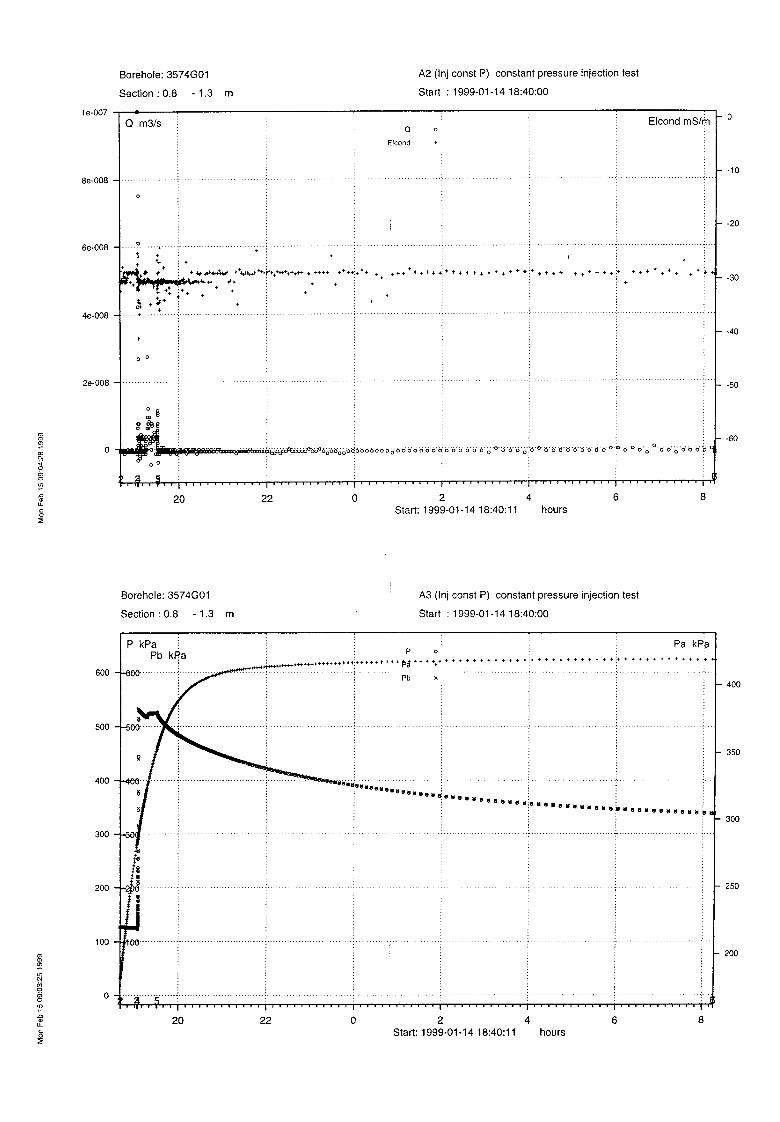
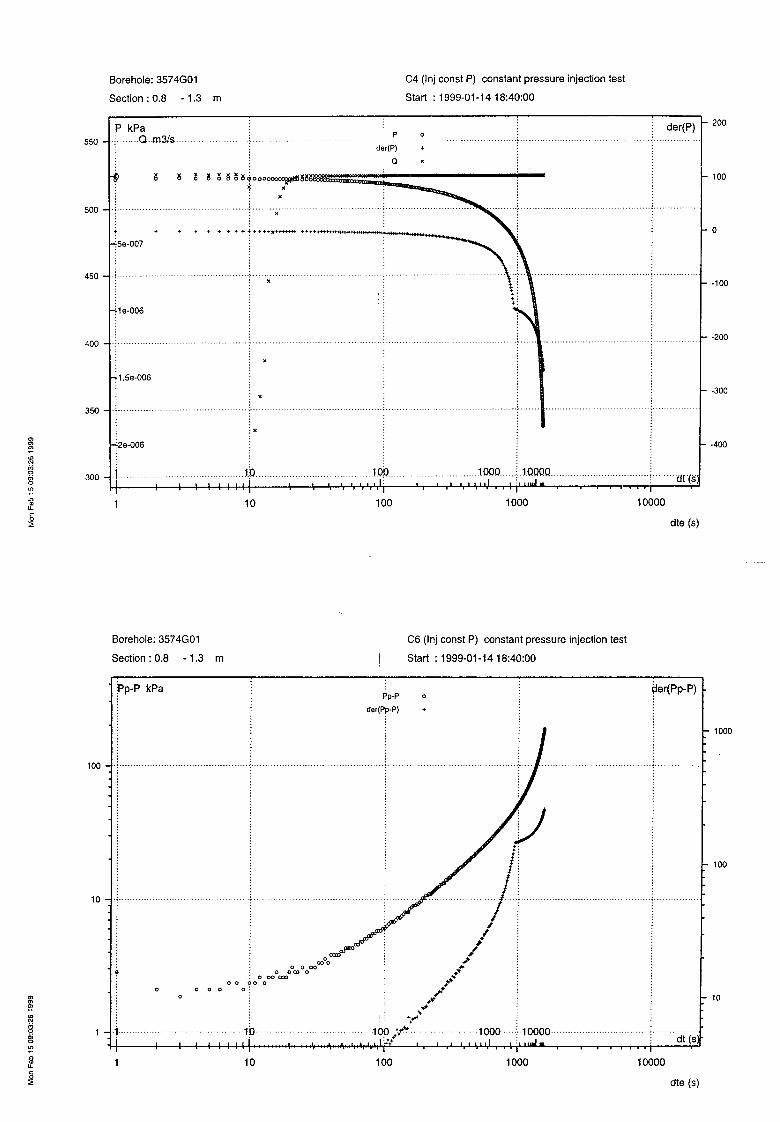
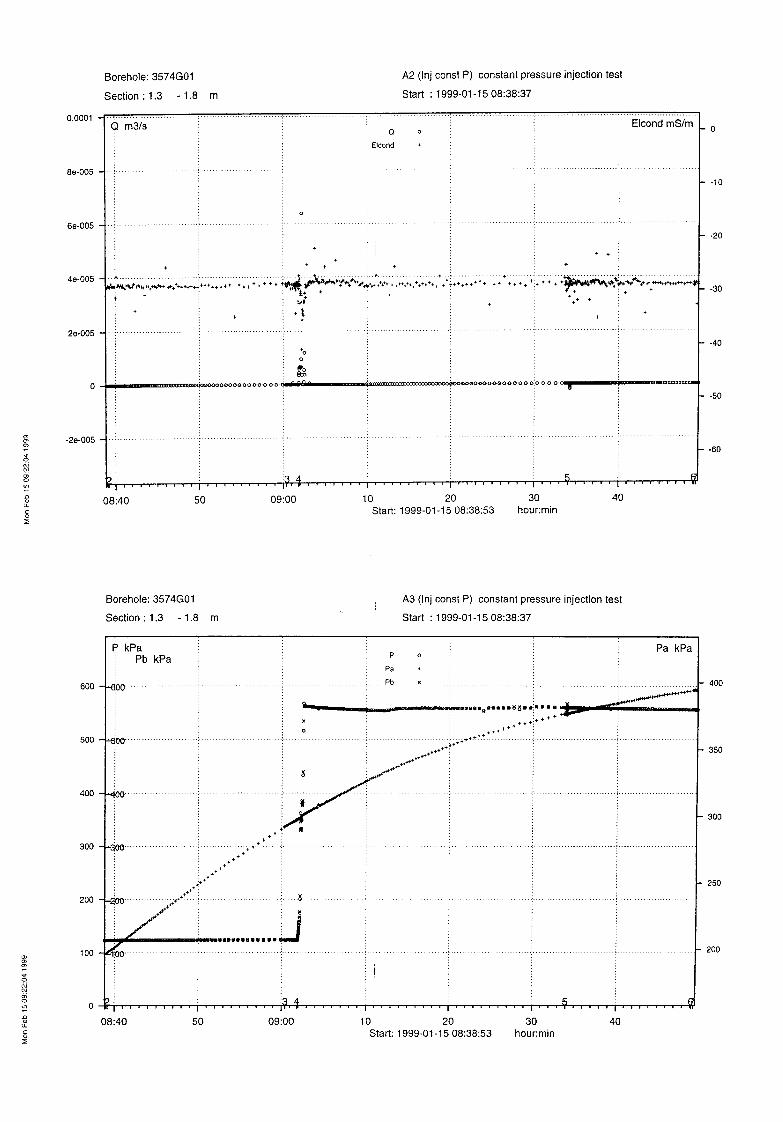
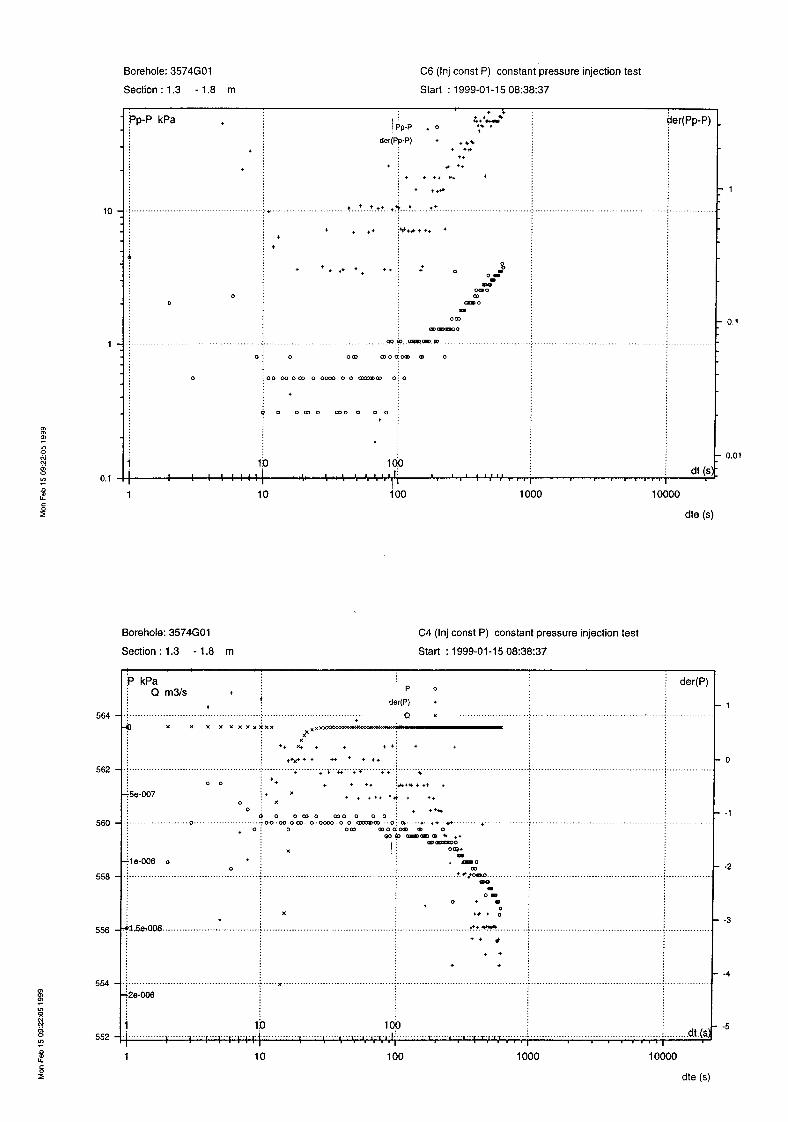
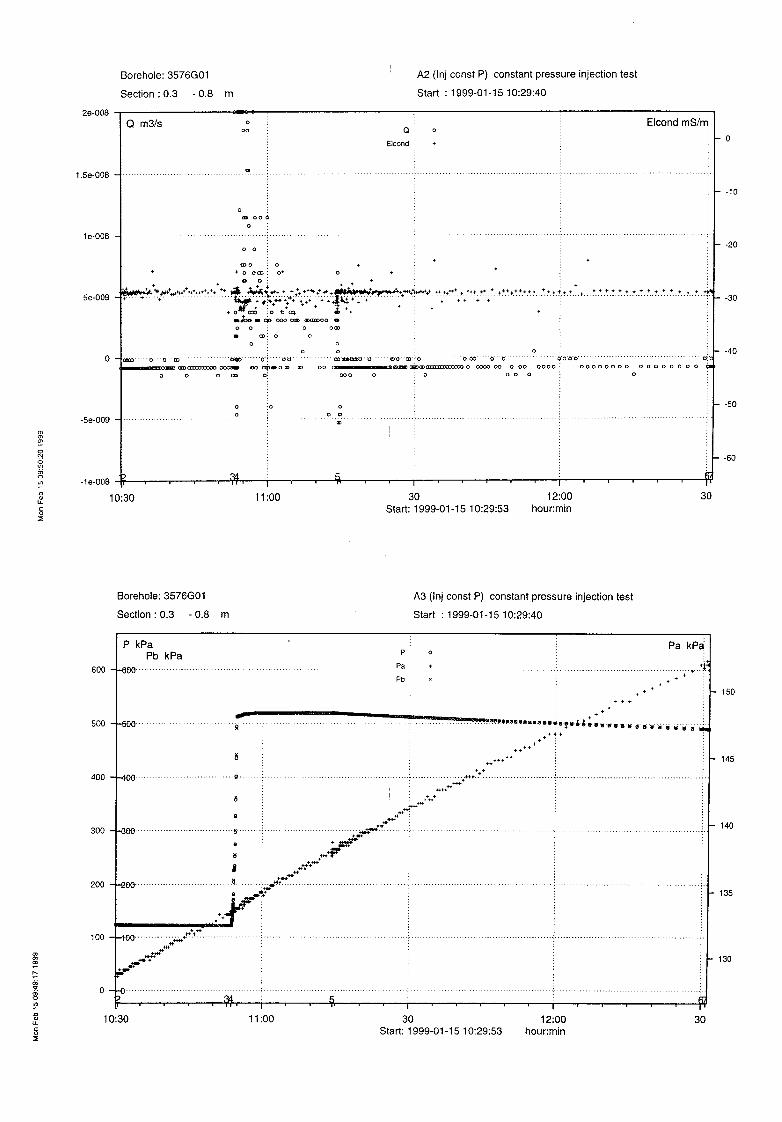
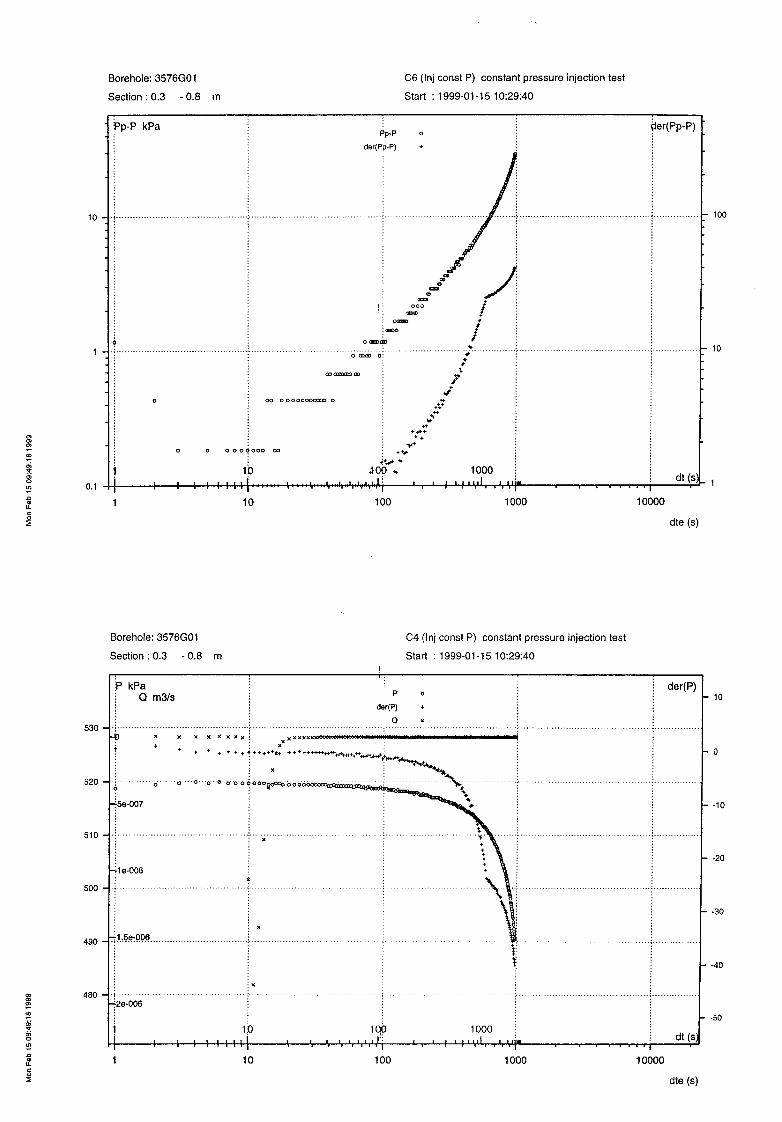
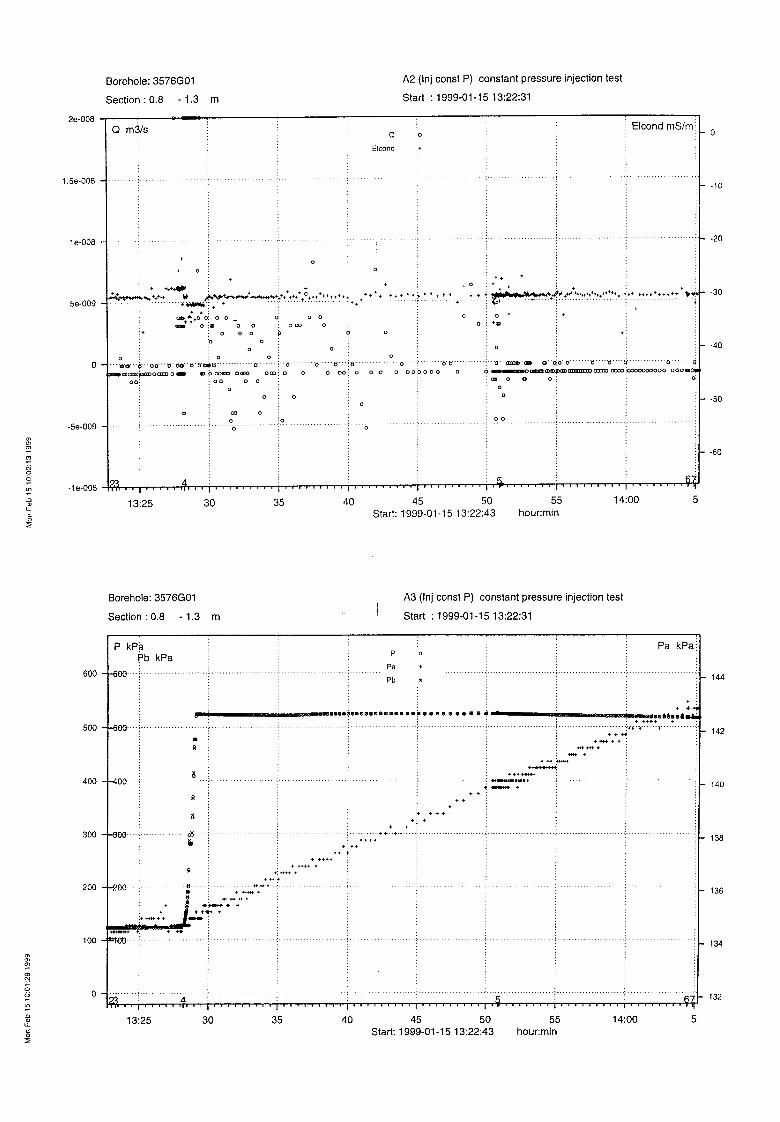
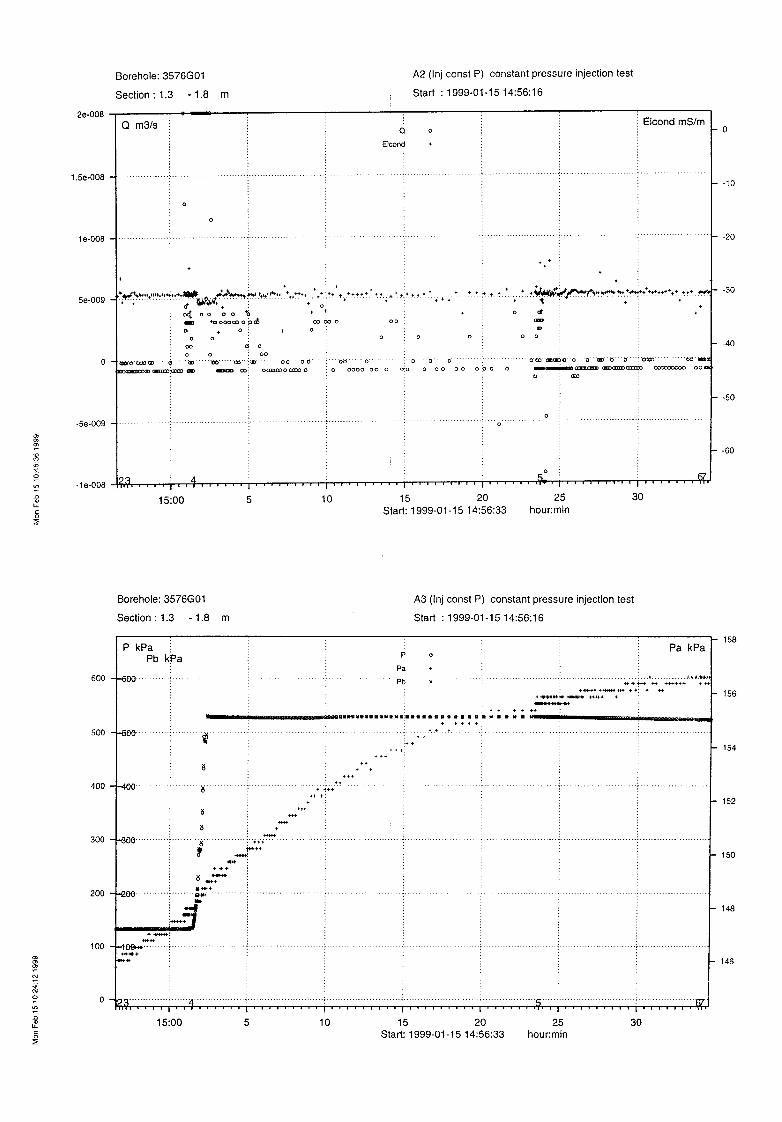
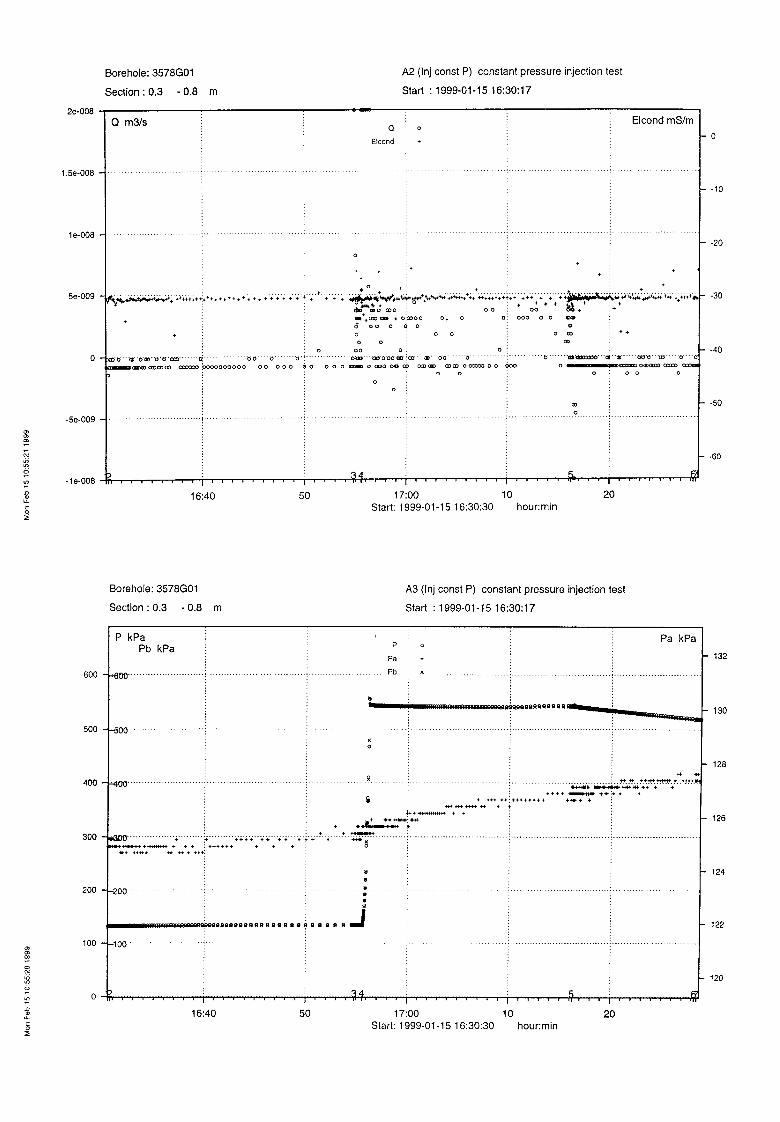
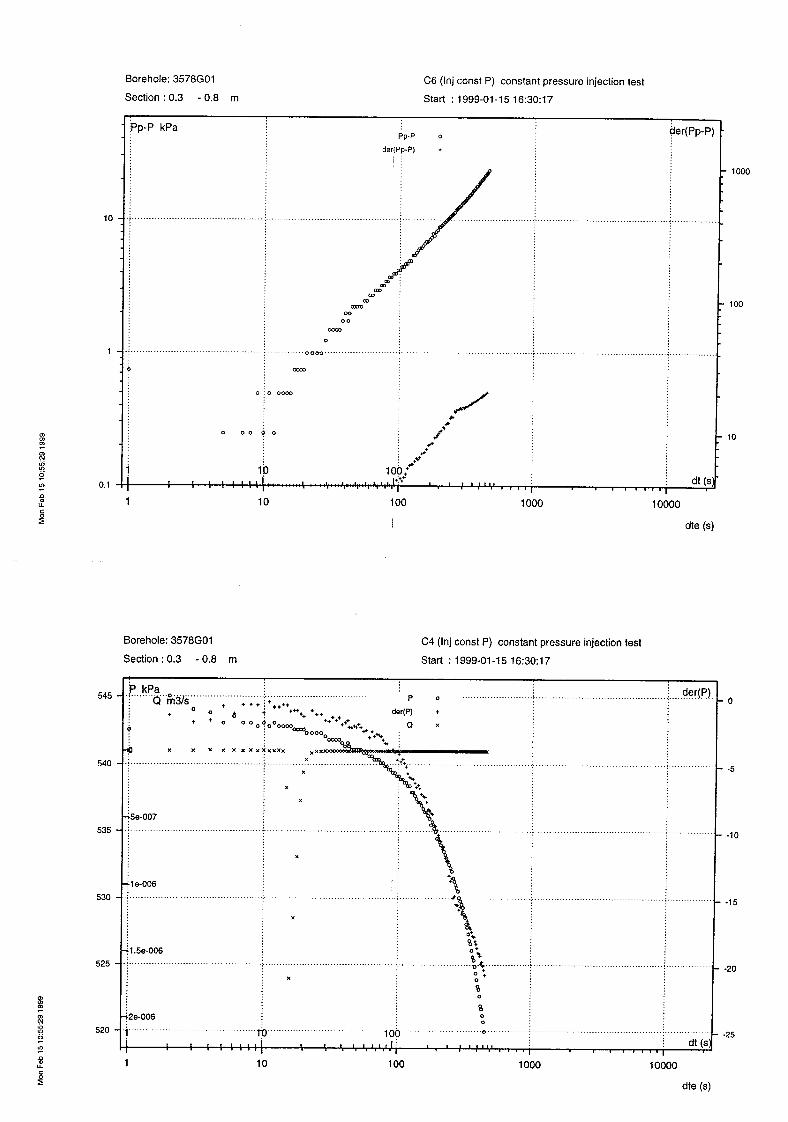
Details and diagrams from transient injection tests in 39 borehole sections Of the diagrams from each test the 1st one presents the measured flowrate, the 2nd one the groundwater pressure in the test section and the section below the test section, the 3rd and 4th ones the recovery period after the injection phase.
In the diagrams the following abbreviations are used:
P - groundwater pressure of the test section (kPa)
Pa - groundwater pressure of the borehole interval below the test section (kPa)
Pb - groundwater pressure of the test section (kPa)
Pp - groundwater pressure average of the last five values before the injection period (kPa)
Q - the flowrate (m3/s)
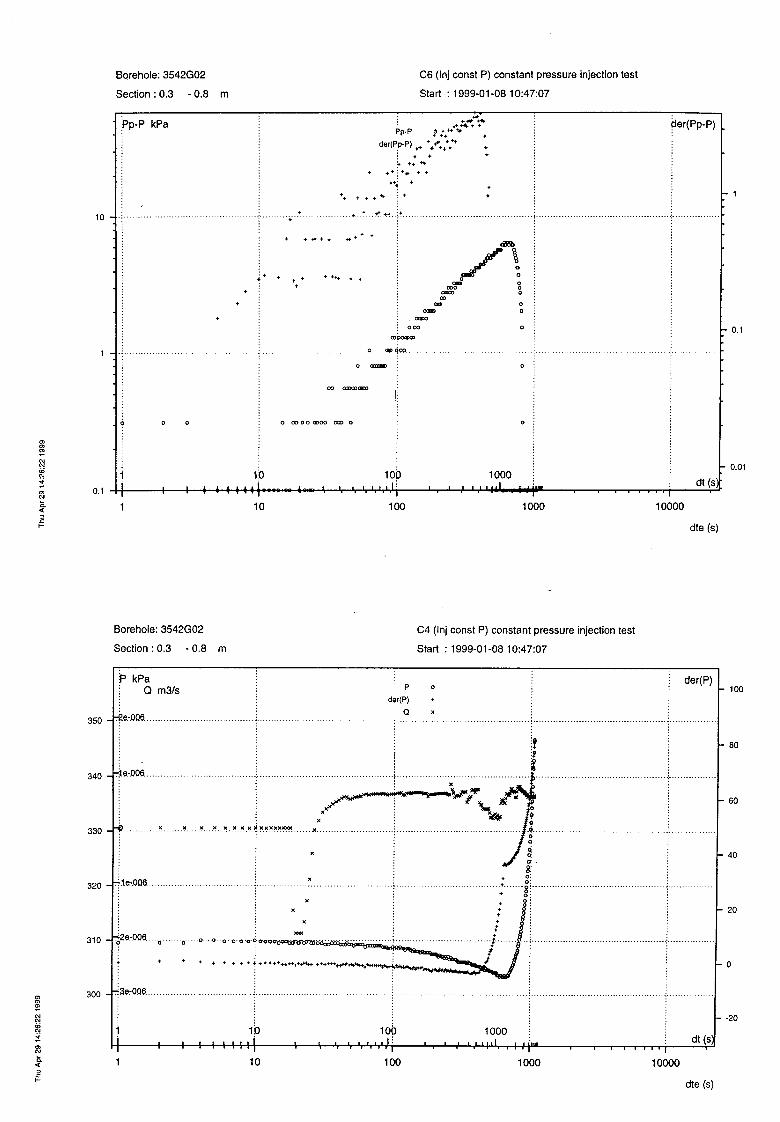
The flowrate data curve shows a sudden increase in most of the tests (in diagram C4) after approximately 10 seconds. The reason for this is unknown; the most probable reason is that it is generated by the test equipment.
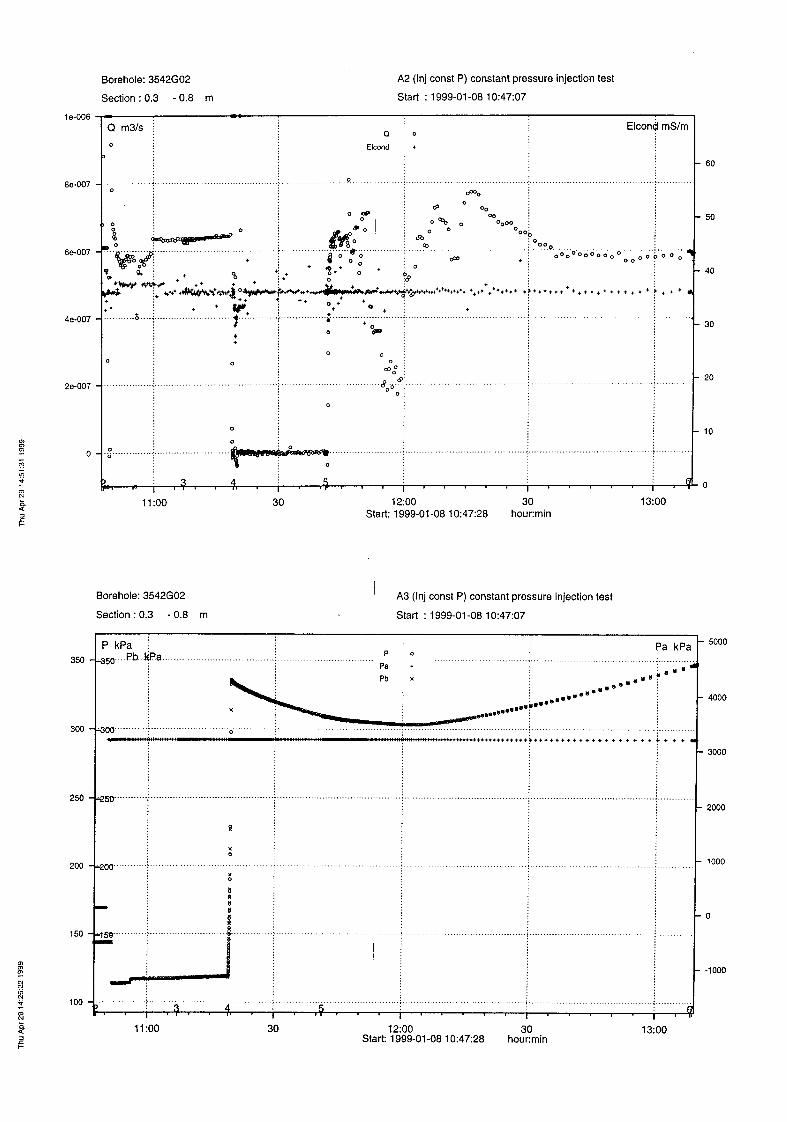
Borehole KA3542G02, section 0.25 m - 0.75 m
Date: 99-01-08 Field Crew: B. Gentzschein
Valve opened: 990108 111914 Valve closed: 990108 114115 Total flowing time: 22.0 min. Tot. Pr. Build-up time: 87.1 min. Pressure before injection start (P0, kPa) : 119.0 Pressure just before closing the valve (Pp, kPa) : 309.8 Pressure at the end of the recovery (Pf, kPa) : 346.6 Pre-set section pressure (during injection) (Pref, kPa) : 303.3 Initially the pressure increases to >320 kPa. Thereafter it decreases to a level below the pre-set value! Approximately 25 minutes after the valve closing the pressure increases, possibly due to the high pressure in the borehole interval below the packer. The measured flow rate before and after the injection phase is internal within the flow meter system and does not impact the test section (since the test valve is closed). It is probably an effect of air in the flow meter system. The flow at the end, Qp, is negative (-3.22 ⋅ 10-10 m3/s). This is within the limits of the zero stability, ± 1.67 ⋅ 10-9 m3/s (0.0001 kg/min).
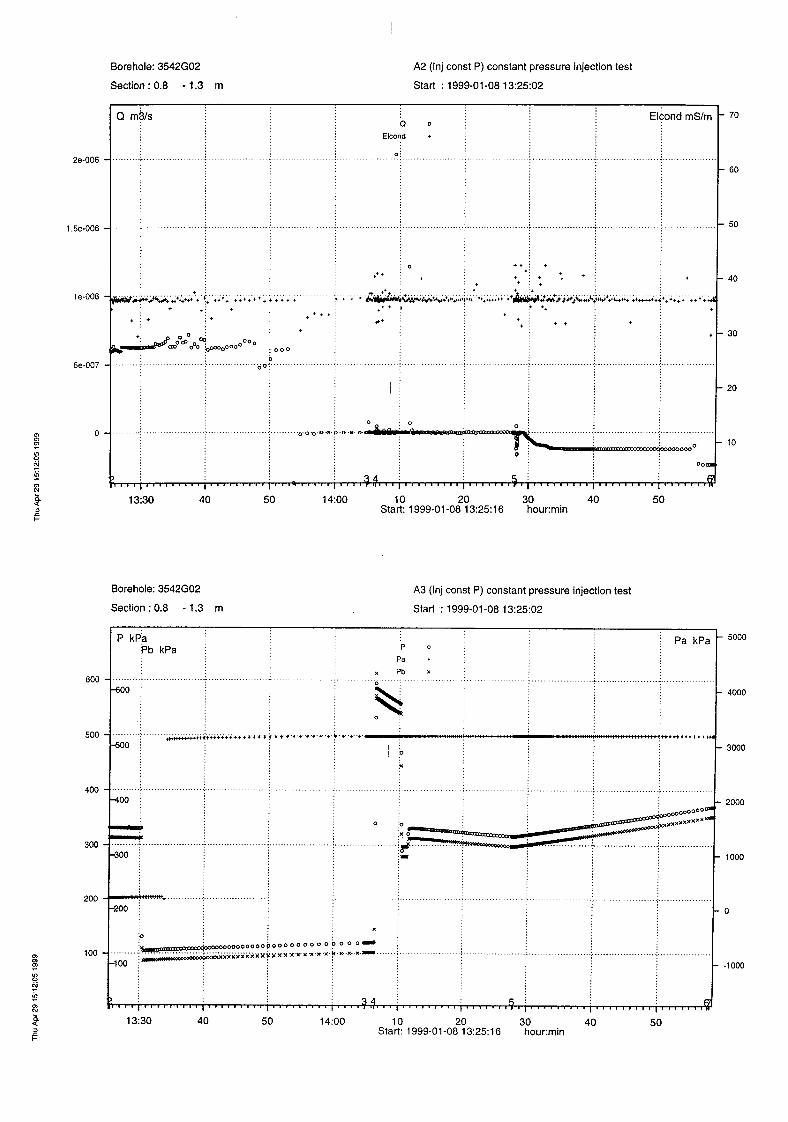
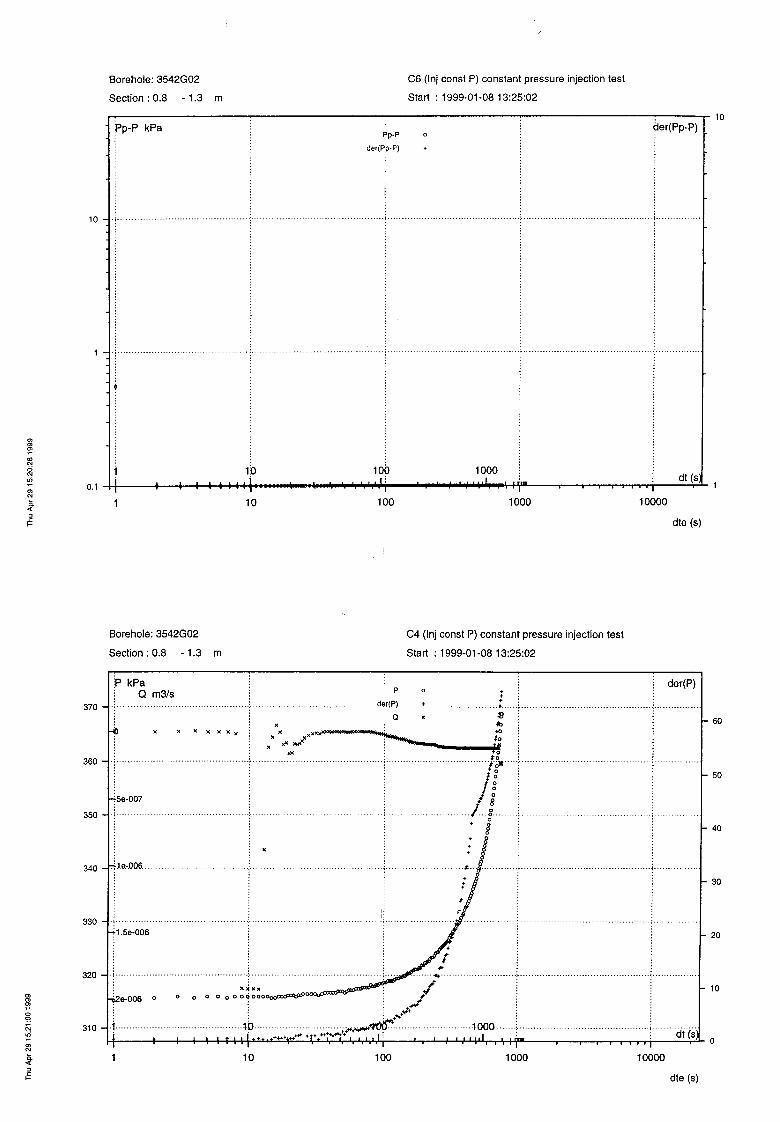
Borehole KA3542G02, section 0.75 m – 1.25 m
Date: 99-01-08 Field Crew: B. Gentzschein
Valve opened: 990108 140621 Valve closed: 990108 142752 Total flowing time: 21.5 min. Tot. Pr. Build-up time: 29.9 min. Pressure before injection start (P0, kPa) : 120.2 Pressure just before closing the valve (Pp, kPa) : 315.8 Pressure at the end of the recovery (Pf, kPa) : 368.8 Pre-set section pressure (during injection) (Pref, kPa) : 308.5 Initially the pressure increased to >570 kPa. By opening a valve, the pressure fell to a level close to the pre-set value. As in the preceding test the pressure increased after valve closing The measured flow rate before the injection phase is of internal nature, see section 0.25 – 0.75 m.
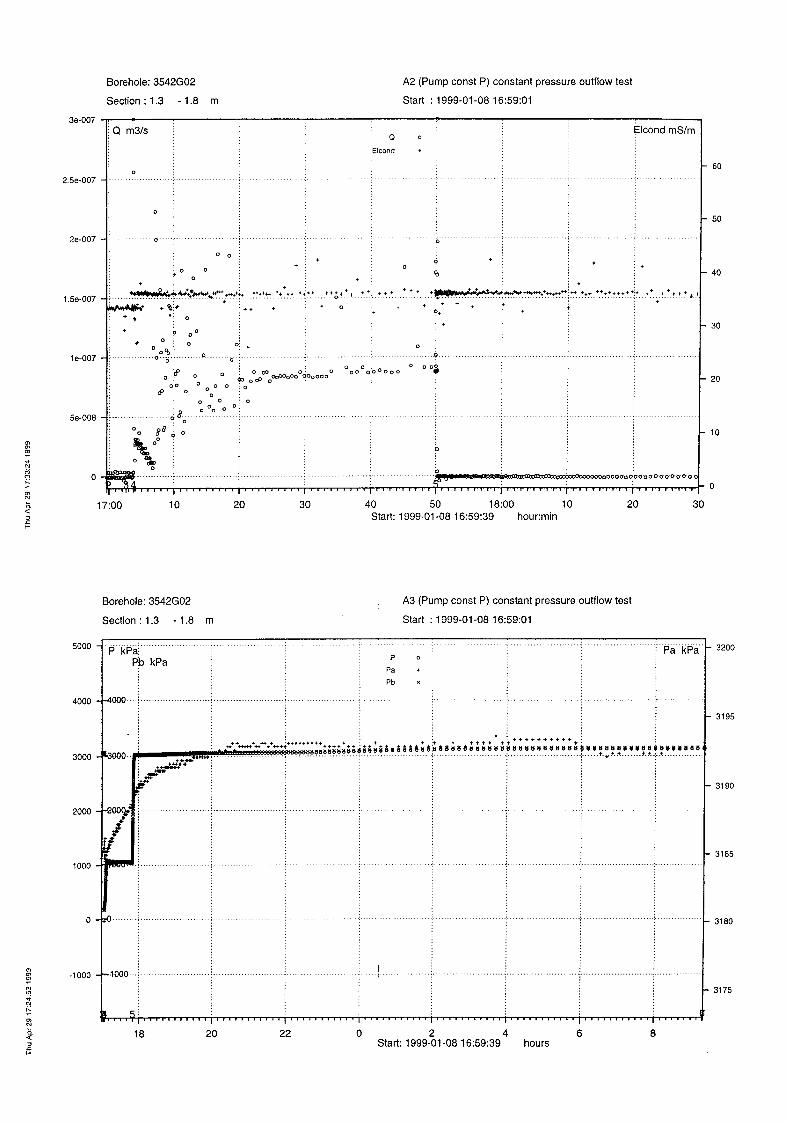
Borehole KA3542G02, section 1.25 m – 1.75 m
Date: 99-01-08 Field Crew: B. Gentzschein
Valve opened: 990108 170345 Valve closed: 990108 175004 Total flowing time: 46.5 min. Tot. Pr. Build-up time: 929.3 min. Pressure before valve opening (P0, kPa) : 3056.3 Pressure just before closing the valve (Pp, kPa) : 1045.7 Pressure at the end of the recovery (Pf, kPa) : 3130.5 Pre-set section pressure (during injection) (Pref, kPa) : 1042 Because of the high section pressure, the test was performed as a constant-pressure outflow test. The recovery lasted over night.
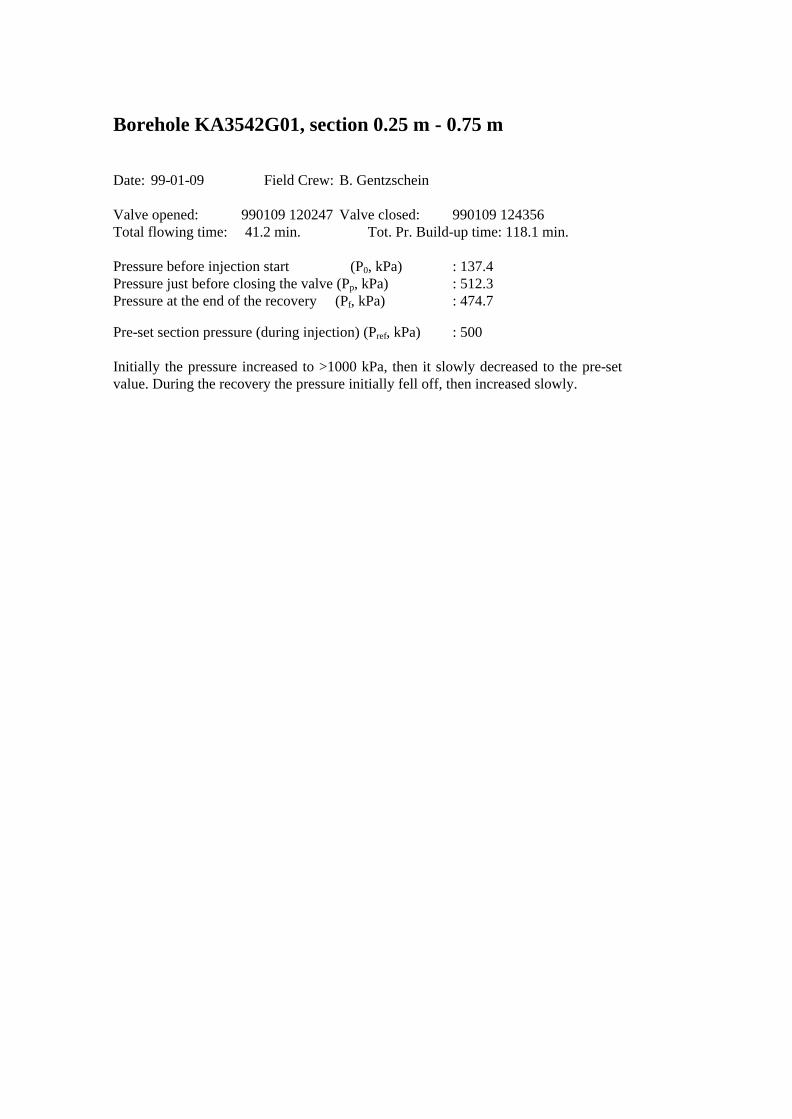
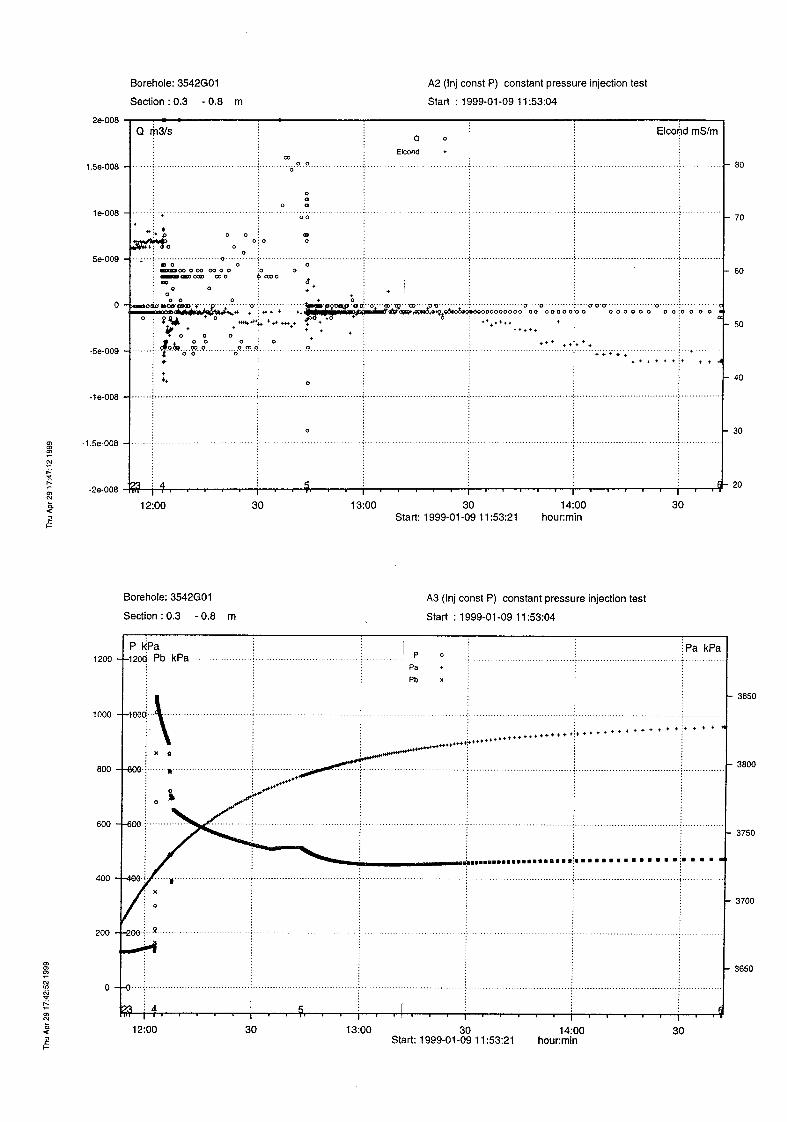
Borehole KA3542G01, section 0.25 m - 0.75 m
Date: 99-01-09 Field Crew: B. Gentzschein
Valve opened: 990109 120247 Valve closed: 990109 124356 Total flowing time: 41.2 min. Tot. Pr. Build-up time: 118.1 min. Pressure before injection start (P0, kPa) : 137.4 Pressure just before closing the valve (Pp, kPa) : 512.3 Pressure at the end of the recovery (Pf, kPa) : 474.7 Pre-set section pressure (during injection) (Pref, kPa) : 500 Initially the pressure increased to >1000 kPa, then it slowly decreased to the pre-set value. During the recovery the pressure initially fell off, then increased slowly.
Borehole KA3542G01, section 0.75 m – 1.25 m
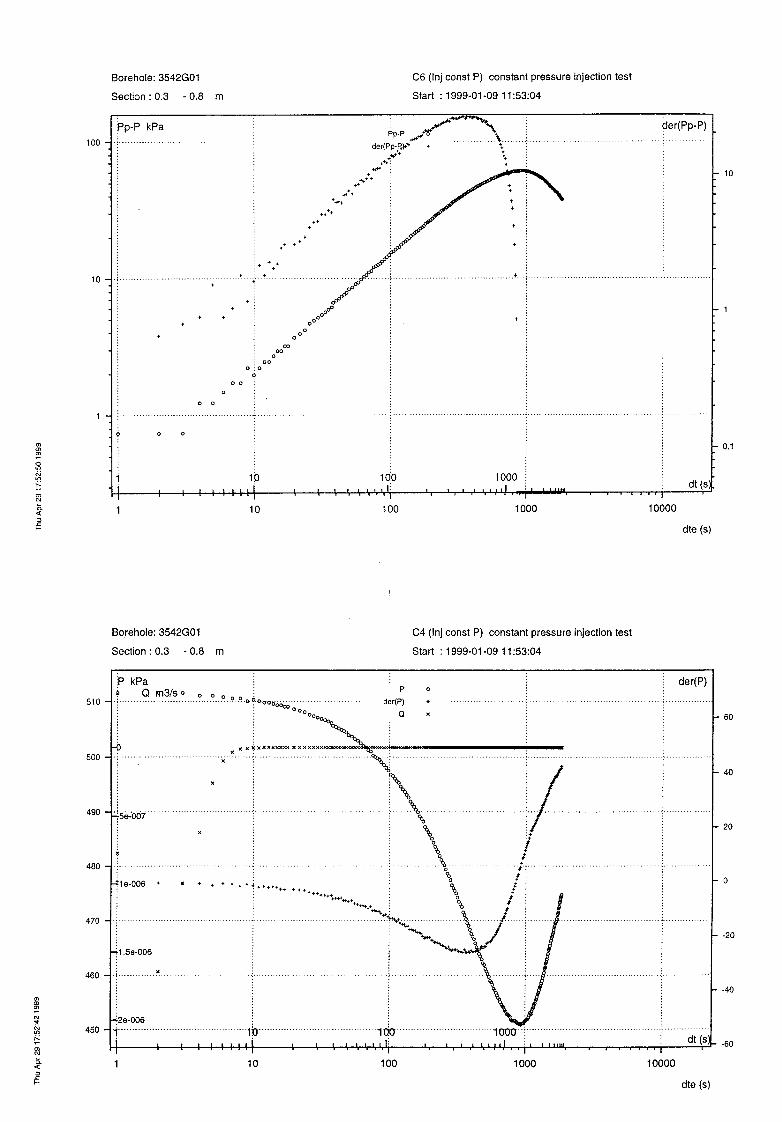
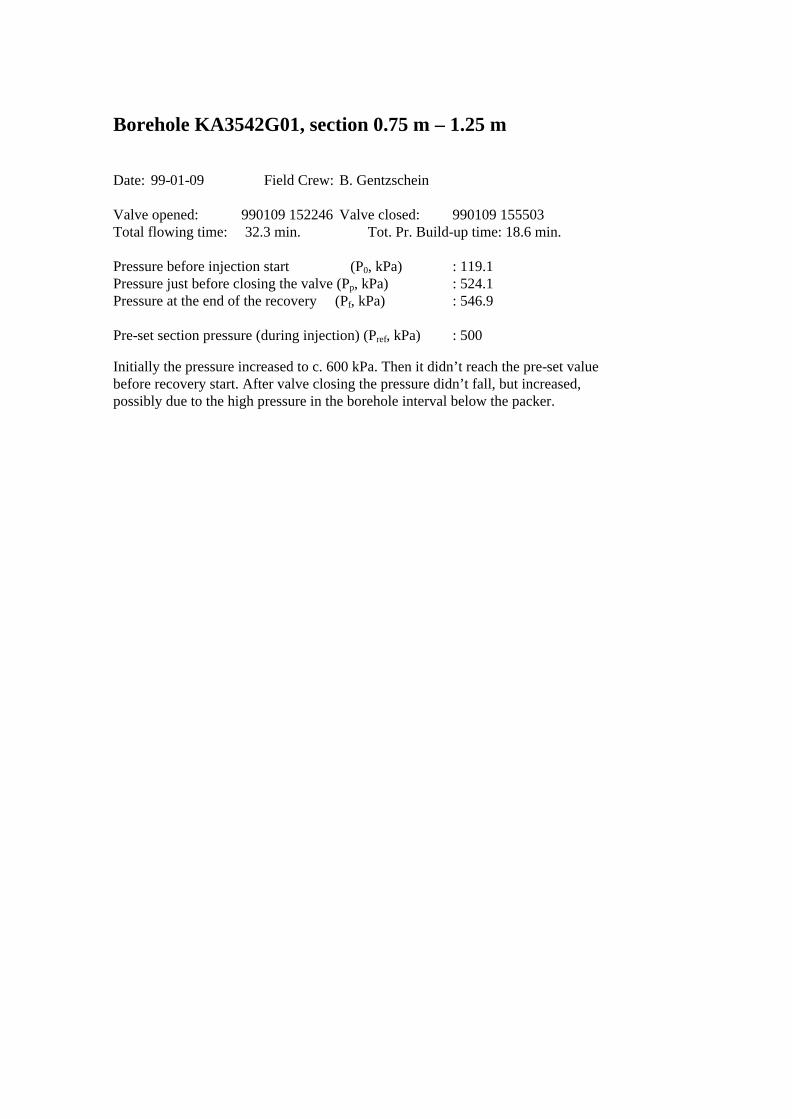
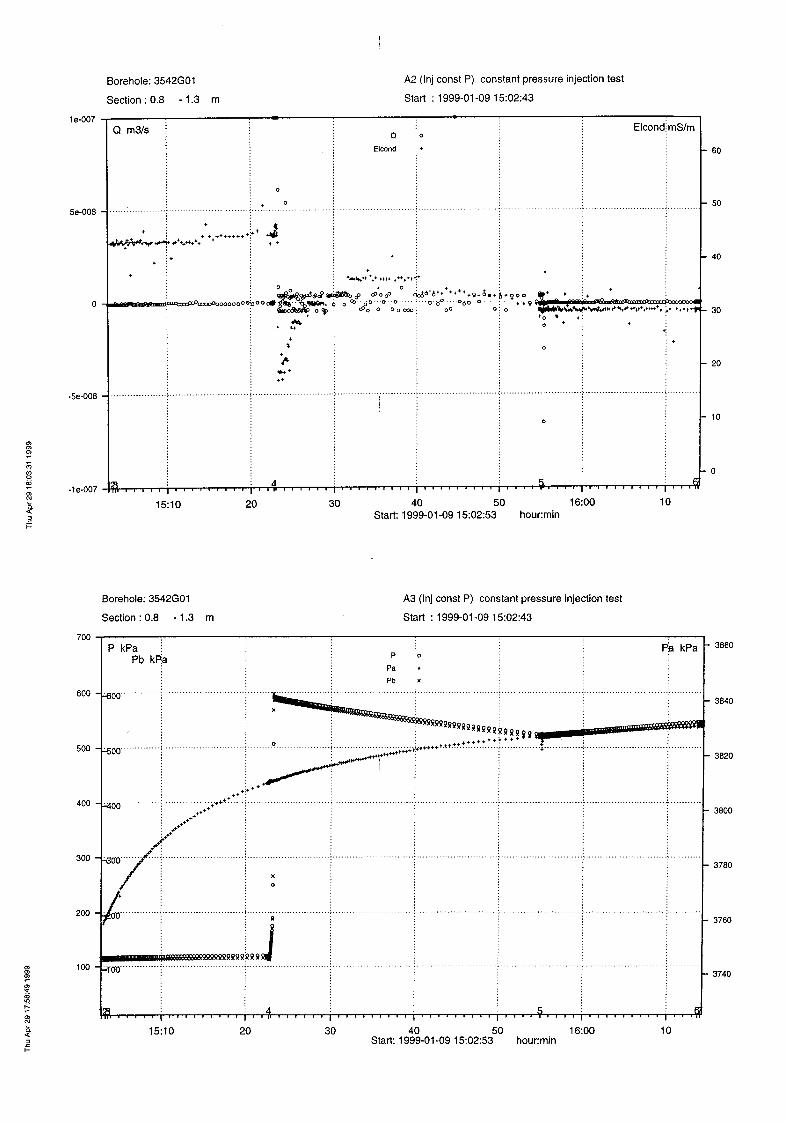
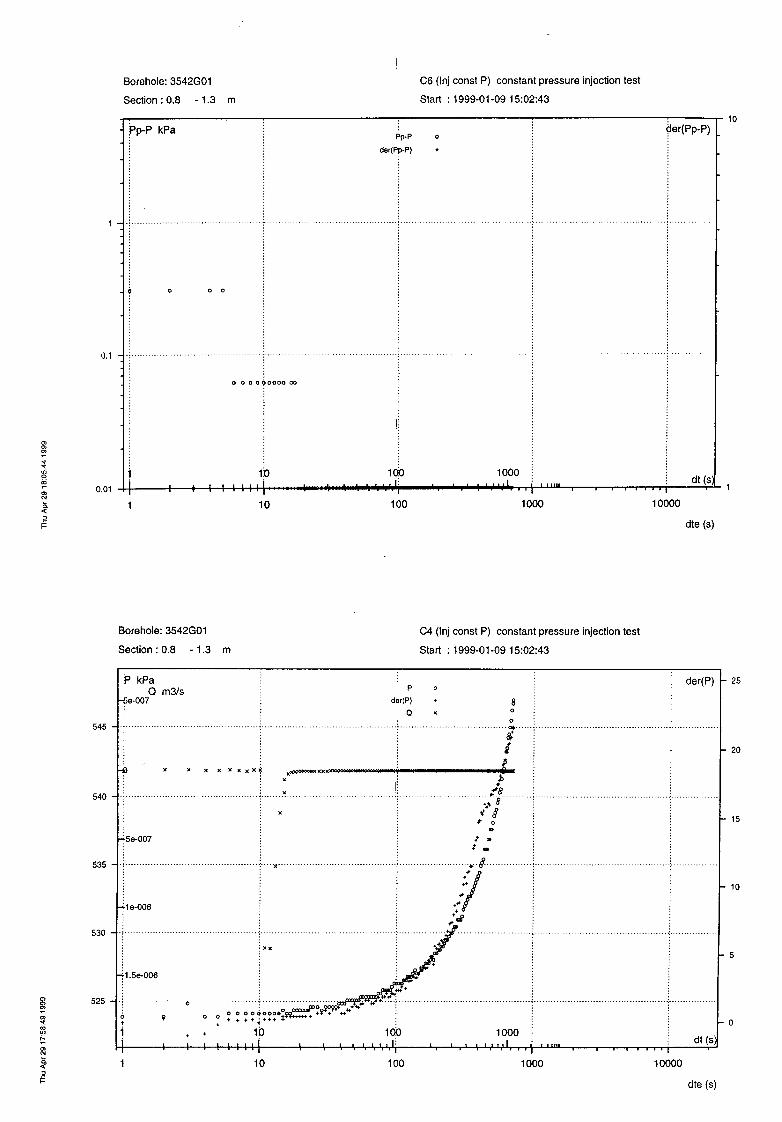
Date: 99-01-09 Field Crew: B. Gentzschein
Valve opened: 990109 152246 Valve closed: 990109 155503 Total flowing time: 32.3 min. Tot. Pr. Build-up time: 18.6 min. Pressure before injection start (P0, kPa) : 119.1 Pressure just before closing the valve (Pp, kPa) : 524.1 Pressure at the end of the recovery (Pf, kPa) : 546.9 Pre-set section pressure (during injection) (Pref, kPa) : 500 Initially the pressure increased to c. 600 kPa. Then it didn’t reach the pre-set value before recovery start. After valve closing the pressure didn’t fall, but increased, possibly due to the high pressure in the borehole interval below the packer.
Borehole KA3542G01, section 1.25 m – 1.75 m
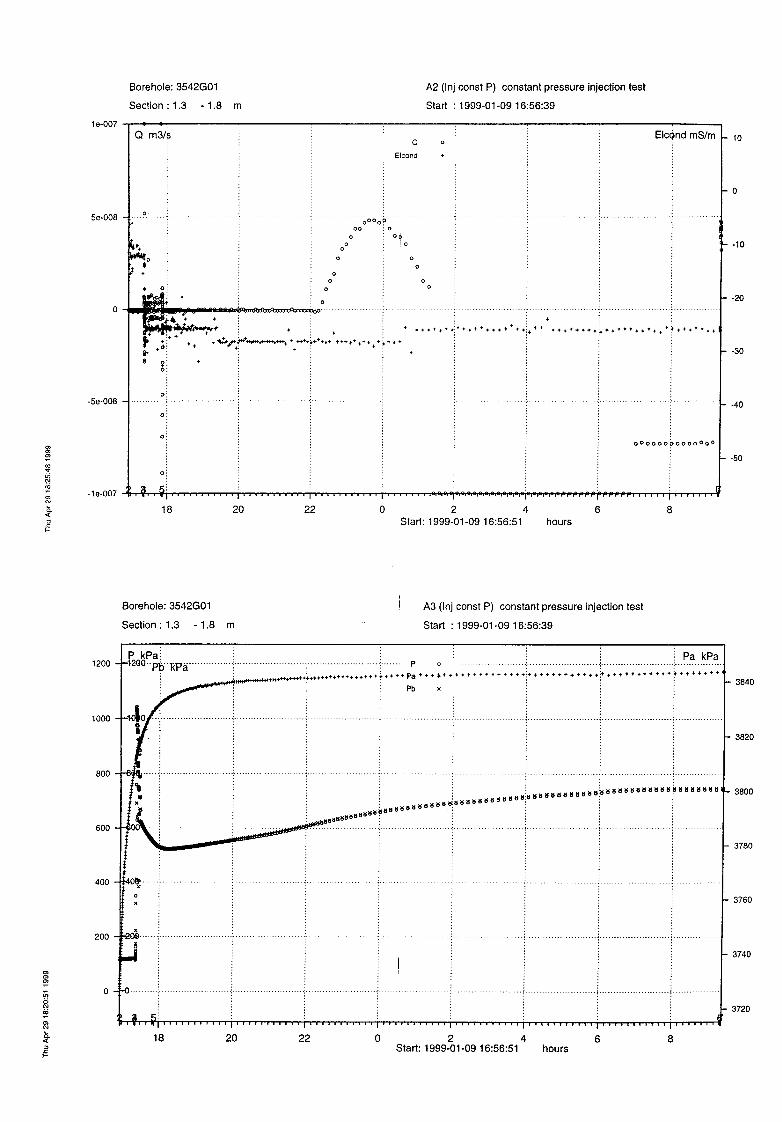
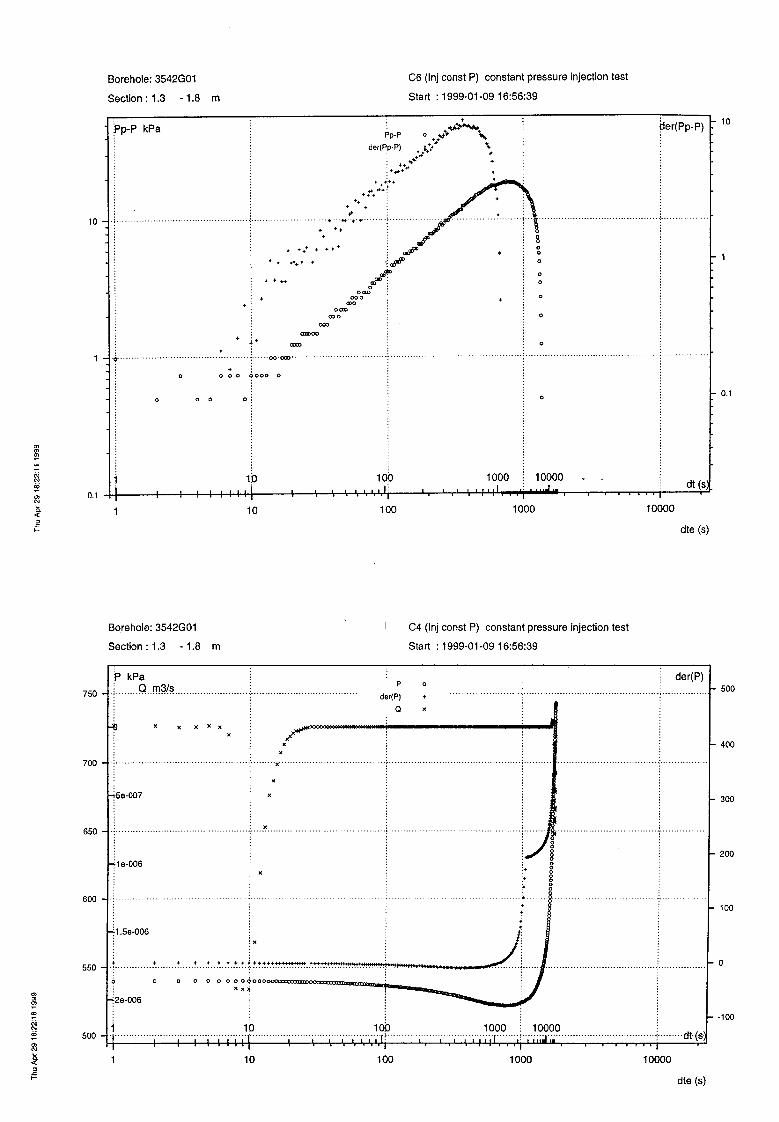
Date: 99-01-09 Field Crew: B. Gentzschein
Valve opened: 990109 172220 Valve closed: 990109 175235 Total flowing time: 30.3 min. Tot. Pr. Build-up time: 928.7 min. Pressure before injection start (P0, kPa) : 118.8 Pressure just before closing the valve (Pp, kPa) : 540.5 Pressure at the end of the recovery (Pf, kPa) : 742.6 Pre-set section pressure (during injection) (Pref, kPa) : 500 Initially the pressure increased to >1000 kPa. By opening a valve the pressure decreased. Again the pressure increased during the recovery (over night).
Borehole KA3544G01, section 0.25 m - 0.75 m
Date: 99-01-10 Field Crew: B. Gentzschein
Valve opened: 990110 114057 Valve closed: 990110 120746 Total flowing time: 26.8 min. Tot. Pr. Build-up time: 116.5 min. Pressure before injection start (P0, kPa) : 162.0 Pressure just before closing the valve (Pp, kPa) : 690.9 Pressure at the end of the recovery (Pf, kPa) : 500.1 Pre-set section pressure (during injection) (Pref, kPa) : 500
Initially the pressure increased to >1100 kPa. By opening a valve the pressure decreased.

Borehole KA3544G01, section 0.75 m – 1.25 m
Date: 99-01-10 Field Crew: B. Gentzschein
Valve opened: 990110 144822 Valve closed: 990110 151726 Total flowing time: 29.1 min. Tot. Pr. Build-up time: 13.9 min. Pressure before injection start (P0, kPa) : 126.7 Pressure just before closing the valve (Pp, kPa) : 574.8 Pressure at the end of the recovery (Pf, kPa) : 613.6 Pre-set section pressure (during injection) (Pref, kPa) : 500 Initially the pressure increased to c. 550 kPa. Shortly after the injection start, Pref was changed to 550 kPa. The pressure increased during the recovery.

Borehole KA3544G01, section 1.25 m – 1.75 m
Date: 99-01-10 Field Crew: B. Gentzschein
Valve opened: 990110 161303 Valve closed: 990110 163351 Total flowing time: 30.3 min. Tot. Pr. Build-up time: 928.7 min. Pressure before injection start (P0, kPa) : 131.4 Pressure just before closing the valve (Pp, kPa) : 529.5 Pressure at the end of the recovery (Pf, kPa) : 652.9 Pre-set section pressure (during injection) (Pref, kPa) : 500 Pressure increase during recovery!
Borehole KA3546G01, section 0.25 m - 0.75 m
Date: 99-01-11 Field Crew: B. Gentzschein
Valve opened: 990111 102808 Valve closed: 990111 105442 Total flowing time: 26.6 min. Tot. Pr. Build-up time: 14.5 min. Pressure before injection start (P0, kPa) : 124.5 Pressure just before closing the valve (Pp, kPa) : 694.5 Pressure at the end of the recovery (Pf, kPa) : 619.0 Pre-set section pressure (during injection) (Pref, kPa) : 500 Initially the pressure increased to >800 kPa. Thereafter it decreased, but the pre-set value was not reached before the end of the flowing period.

Borehole KA3546G01, section 0.75 m – 1.25 m
Date: 99-01-11 Field Crew: B. Gentzschein
Valve opened: 990111 115456 Valve closed: 990111 121526 Total flowing time: 20.5 min. Tot. Pr. Build-up time: 71.9 min. Pressure before injection start (P0, kPa) : 127.3 Pressure just before closing the valve (Pp, kPa) : 520.1 Pressure at the end of the recovery (Pf, kPa) : 403.9 Pre-set section pressure (during injection) (Pref, kPa) : 500 Shortly after the injection start Pref was changed to 520 kPa.
Borehole KA3546G01, section 1.25 m – 1.75 m
Date: 99-01-11 Field Crew: B. Gentzschein
Valve opened: 990111 141110 Valve closed: 990111 143229 Total flowing time: 21.2 min. Tot. Pr. Build-up time: 10.6 min. Pressure before injection start (P0, kPa) : 130.8 Pressure just before closing the valve (Pp, kPa) : 579.2 Pressure at the end of the recovery (Pf, kPa) : 562.5 Pre-set section pressure (during injection) (Pref, kPa) : 500
Shortly after the injection start, Pref was changed to 550 kPa.

Borehole KA3548G01, section 0.25 m - 0.75 m
Date: 99-01-11 Field Crew: B. Gentzschein
Valve opened: 990111 160246 Valve closed: 990111 163137 Total flowing time: 28.7 min. Tot. Pr. Build-up time: 16.4 min. Pressure before injection start (P0, kPa) : 122.8 Pressure just before closing the valve (Pp, kPa) : 518.6 Pressure at the end of the recovery (Pf, kPa) : 489.2 Pre-set section pressure (during injection) (Pref, kPa) : 500
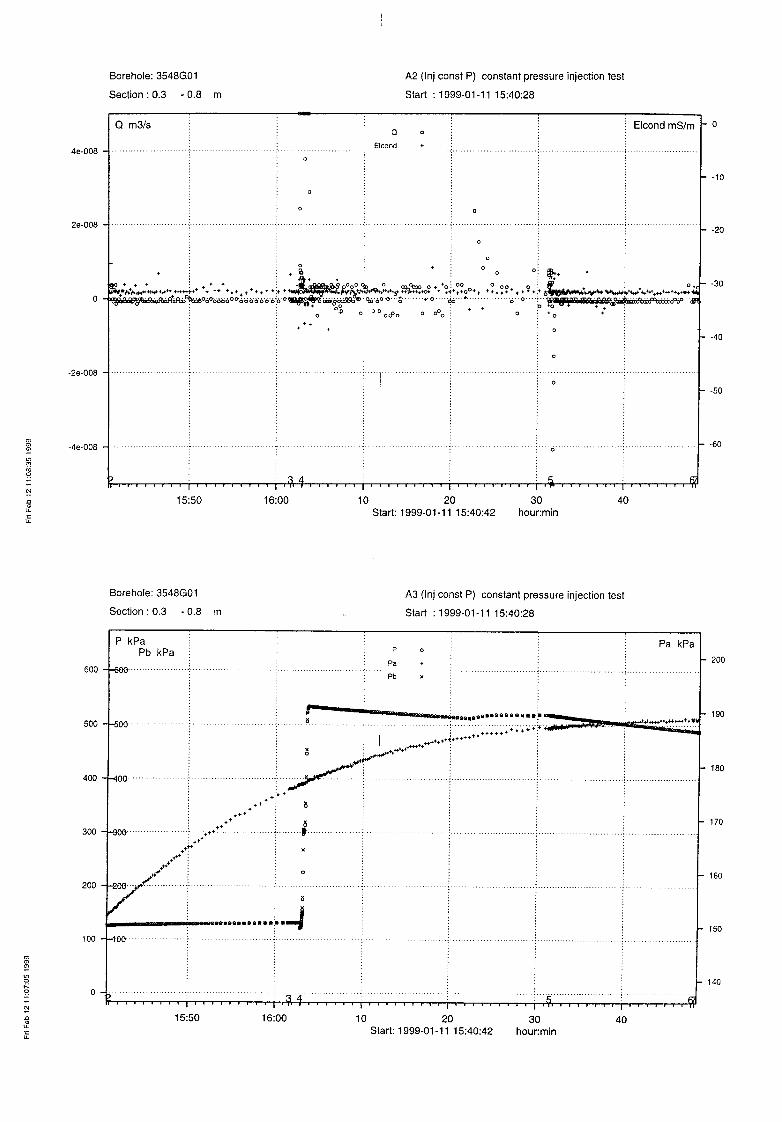
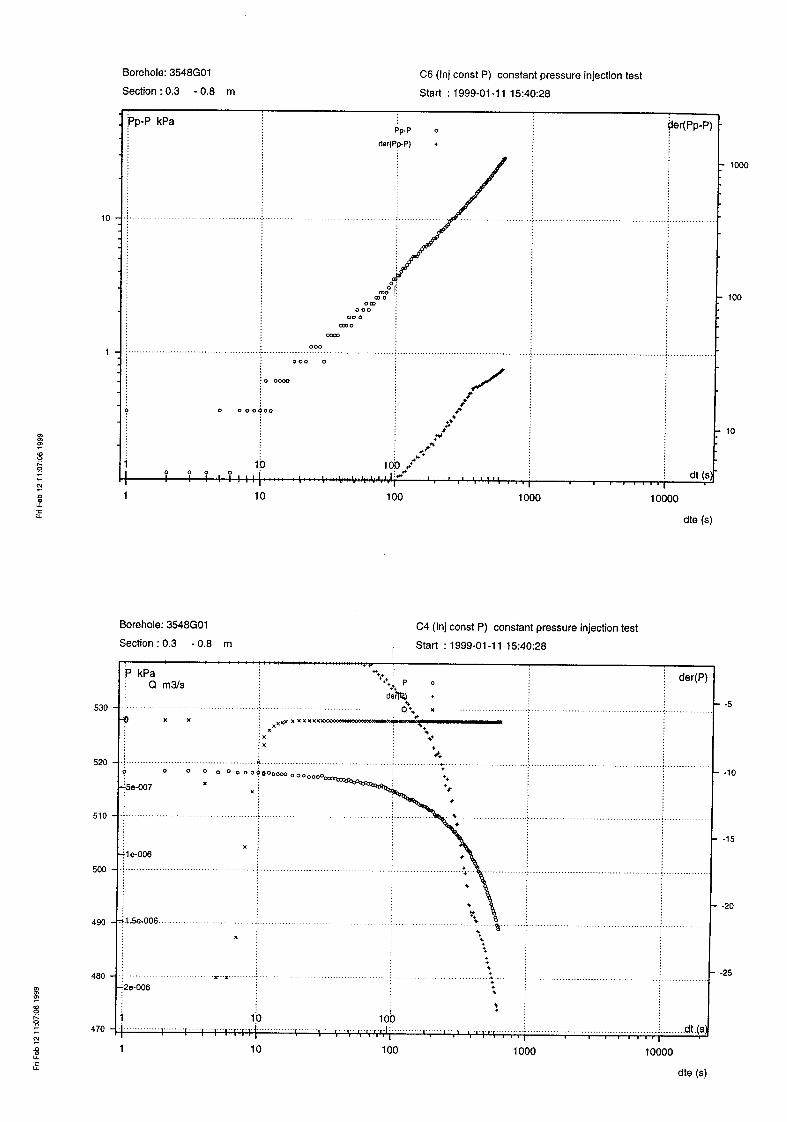
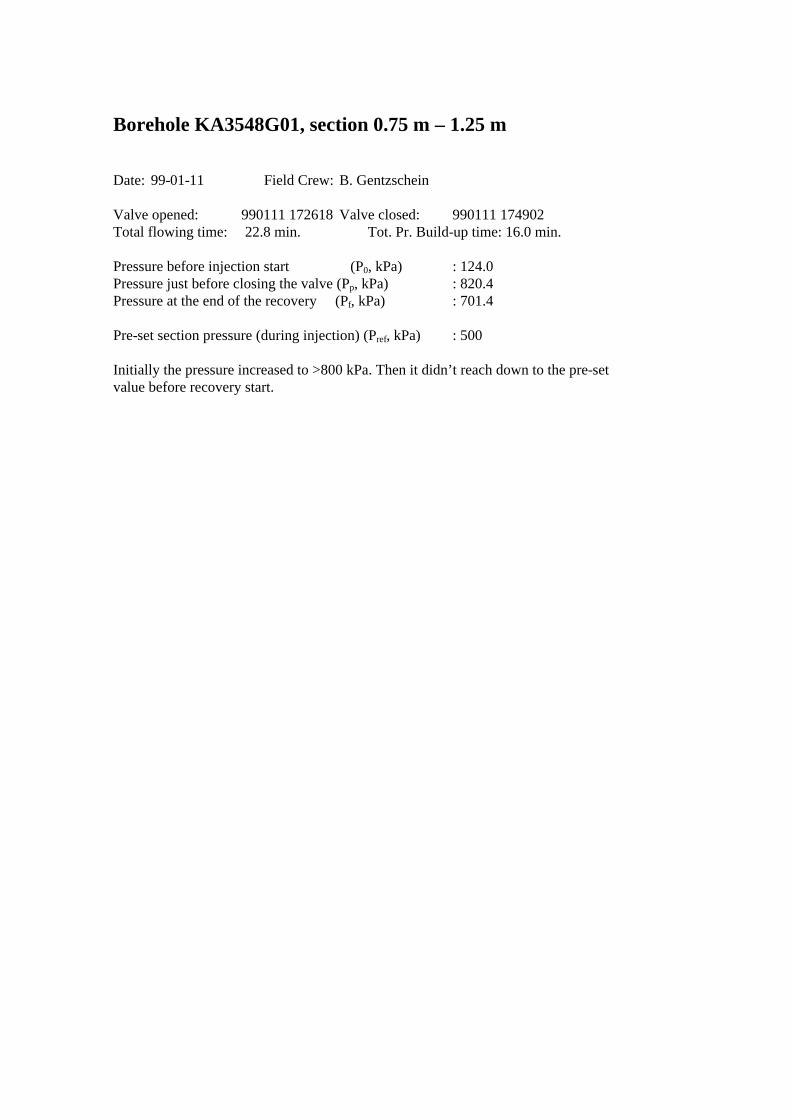
Borehole KA3548G01, section 0.75 m – 1.25 m
Date: 99-01-11 Field Crew: B. Gentzschein
Valve opened: 990111 172618 Valve closed: 990111 174902 Total flowing time: 22.8 min. Tot. Pr. Build-up time: 16.0 min. Pressure before injection start (P0, kPa) : 124.0 Pressure just before closing the valve (Pp, kPa) : 820.4 Pressure at the end of the recovery (Pf, kPa) : 701.4 Pre-set section pressure (during injection) (Pref, kPa) : 500 Initially the pressure increased to >800 kPa. Then it didn’t reach down to the pre-set value before recovery start.
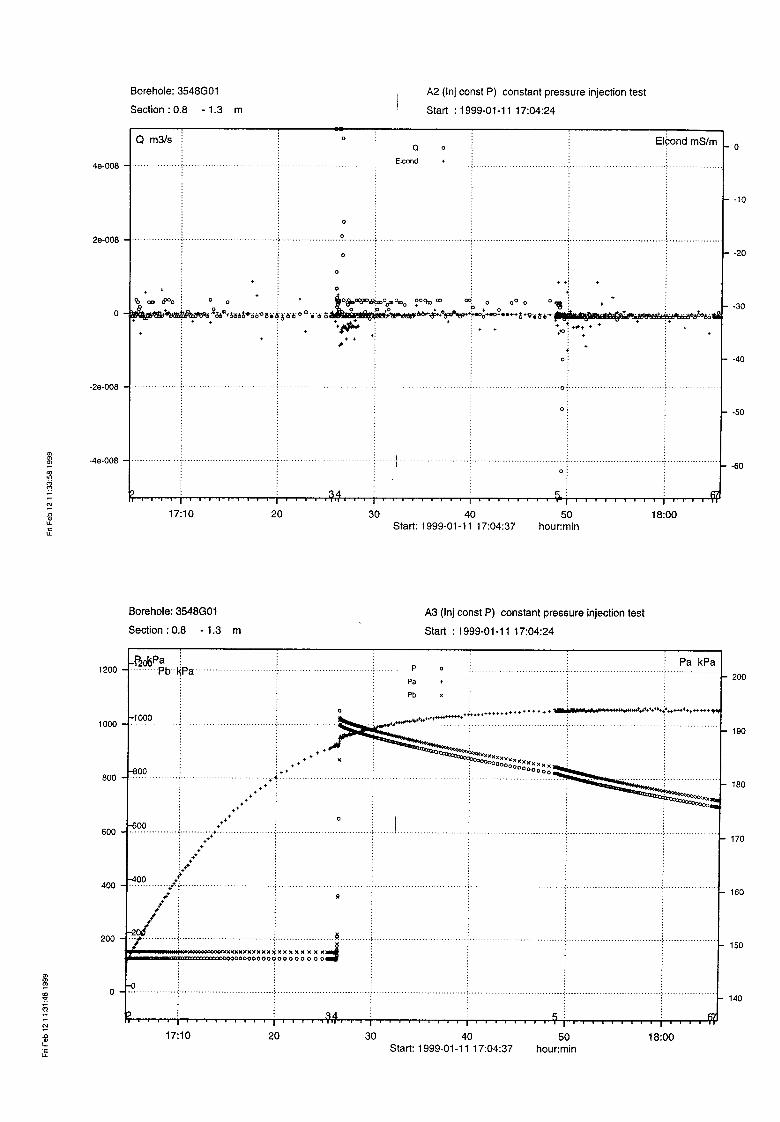
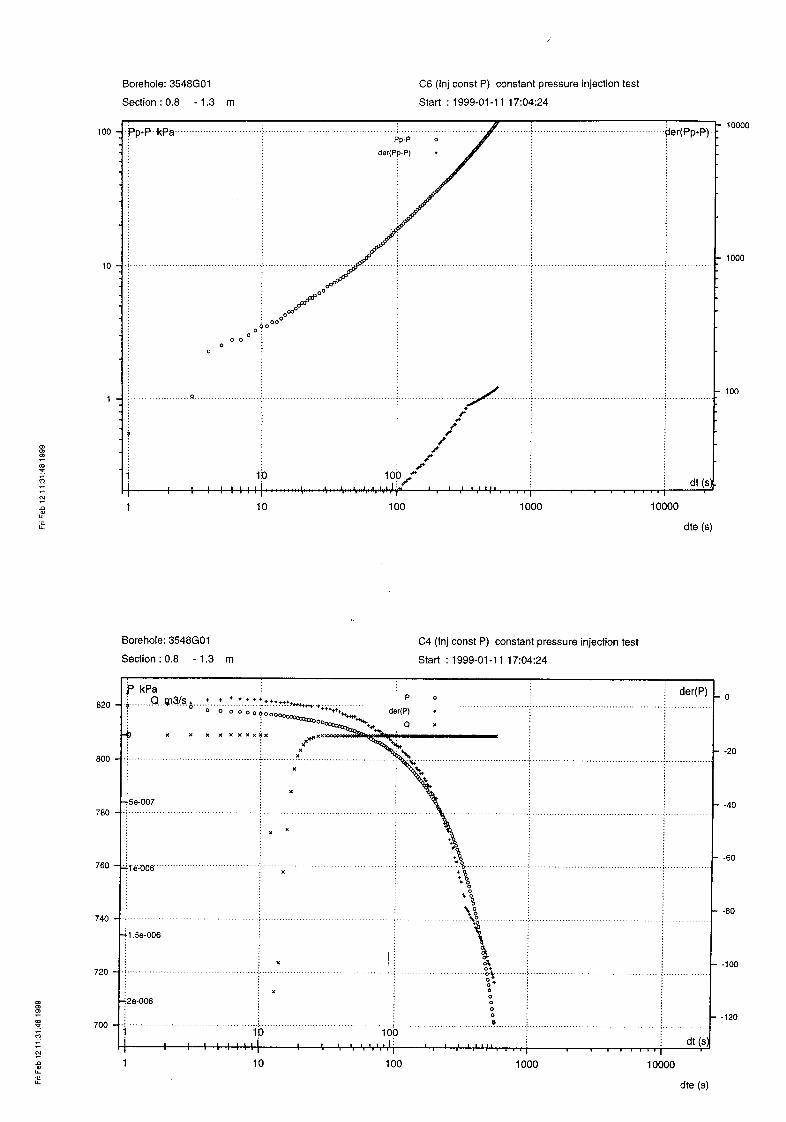

Borehole KA3548G01, section 1.25 m – 1.75 m
Date: 99-01-11 Field Crew: B. Gentzschein
Valve opened: 990111 184608 Valve closed: 990111 190812 Total flowing time: 22.1 min. Tot. Pr. Build-up time: 788.5 min. Pressure before injection start (P0, kPa) : 126.9 Pressure just before closing the valve (Pp, kPa) : 527.9 Pressure at the end of the recovery (Pf, kPa) : 308.1 Pre-set section pressure (during injection) (Pref, kPa) : 500
The recovery lasted over the night.

Borehole KA3550G01, section 0.25 m - 0.75 m
Date: 99-01-12 Field Crew: B. Gentzschein
Valve opened: 990112 093905 Valve closed: 990112 100351 Total flowing time: 24.8 min. Tot. Pr. Build-up time: 11.6 min. Pressure before injection start (P0, kPa) : 121.5 Pressure just before closing the valve (Pp, kPa) : 520.0 Pressure at the end of the recovery (Pf, kPa) : 386.0 Pre-set section pressure (during injection) (Pref, kPa) : 500 The injection pressure is relatively stable and the recovery is c. 34 %

Borehole KA3550G01, section 0.75 m – 1.25 m
Date: 99-01-12 Field Crew: B. Gentzschein
Valve opened: 990112 110856 Valve closed: 990112 113139 Total flowing time: 22.7 min. Tot. Pr. Build-up time: 129.9 min. Pressure before injection start (P0, kPa) : 130.1 Pressure just before closing the valve (Pp, kPa) : 563.5 Pressure at the end of the recovery (Pf, kPa) : 505.7 Pre-set section pressure (during injection) (Pref, kPa) : 500 Pref was changed to 540 kPa at 11:10.30:

Borehole KA3550G01, section 1.25 m – 1.75 m
Date: 99-01-12 Field Crew: B. Gentzschein
Valve opened: 990112 143927 Valve closed: 990112 150100 Total flowing time: 21.6 min. Tot. Pr. Build-up time: 11.9 min. Pressure before injection start (P0, kPa) : 126.9 Pressure just before closing the valve (Pp, kPa) : 679.6 Pressure at the end of the recovery (Pf, kPa) : 663.2 Pre-set section pressure (during injection) (Pref, kPa) : 500 Initially the pressure increased to >700 kPa. Thereafter it decreased, but the pre-set value was not reached before the end of the flowing period
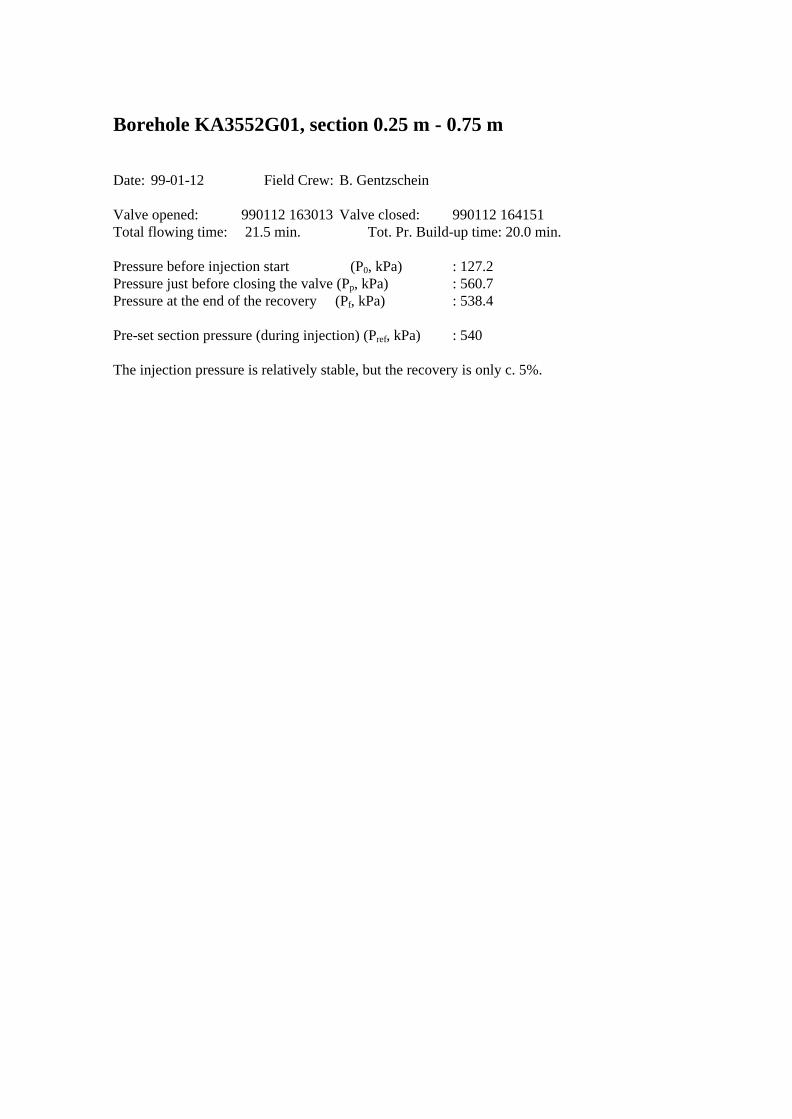
Borehole KA3552G01, section 0.25 m - 0.75 m
Date: 99-01-12 Field Crew: B. Gentzschein
Valve opened: 990112 163013 Valve closed: 990112 164151 Total flowing time: 21.5 min. Tot. Pr. Build-up time: 20.0 min. Pressure before injection start (P0, kPa) : 127.2 Pressure just before closing the valve (Pp, kPa) : 560.7 Pressure at the end of the recovery (Pf, kPa) : 538.4 Pre-set section pressure (during injection) (Pref, kPa) : 540 The injection pressure is relatively stable, but the recovery is only c. 5%.

Borehole KA3552G01, section 0.75 m – 1.25 m
Date: 99-01-12 Field Crew: B. Gentzschein
Valve opened: 990112 180507 Valve closed: 990112 182510 Total flowing time: 20.1 min. Tot. Pr. Build-up time: 11.2 min. Pressure before injection start (P0, kPa) : 125.1 Pressure just before closing the valve (Pp, kPa) : 788.3 Pressure at the end of the recovery (Pf, kPa) : 762.8 Pre-set section pressure (during injection) (Pref, kPa) : 500 Initially the pressure increased to >870 kPa. Then it didn’t reach down to the pre-set value before the injection stop.
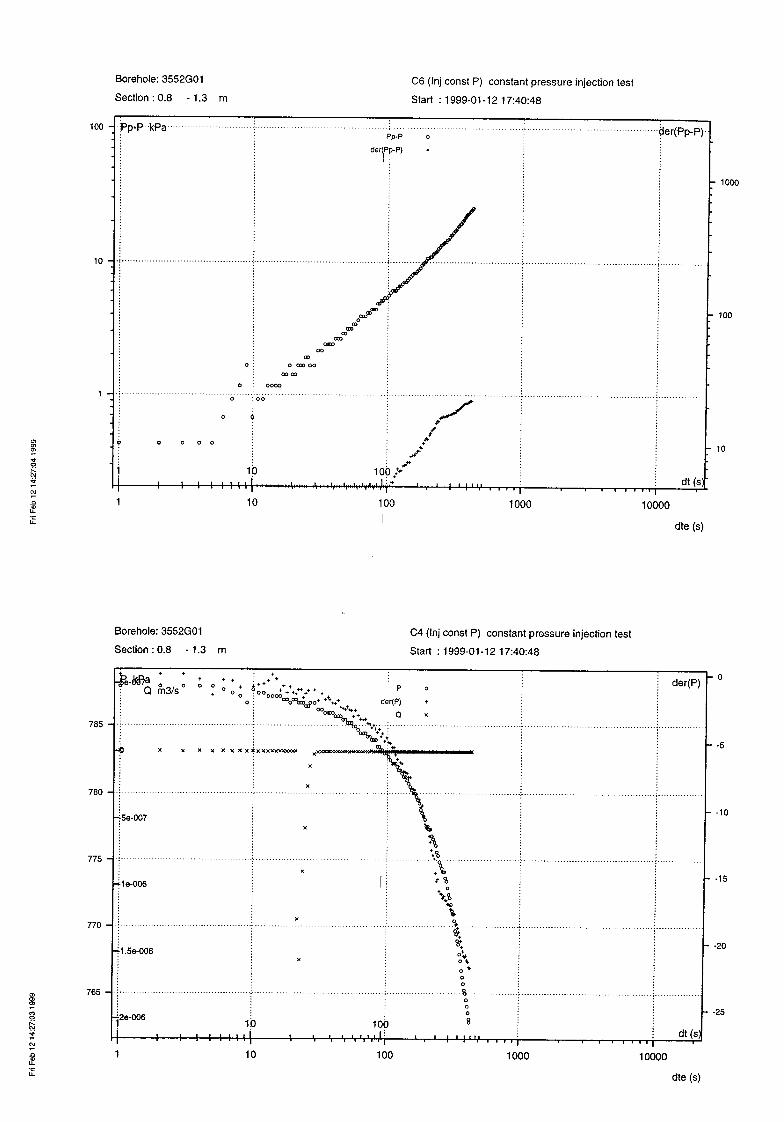

Borehole KA3552G01, section 1.25 m – 1.75 m
Date: 99-01-12 Field Crew: B. Gentzschein
Valve opened: 990112 191647 Valve closed: 990112 193643 Total flowing time: 20.0 min. Tot. Pr. Build-up time: 769.8 min. Pressure before injection start (P0, kPa) : 129.1 Pressure just before closing the valve (Pp, kPa) : 528.4 Pressure at the end of the recovery (Pf, kPa) : 552.9 Pre-set section pressure (during injection) (Pref, kPa) : 500 The flow at the end, Qp, is negative (-6.496e-10 m3/s). This is within the limits of the zero stability, ± 1.67 ⋅ 10-9 m3/s (0.0001 kg/min), see chapter 4. During the recovery, lasting over night, the pressure is increasing.

Borehole KA3554G02, section 0.25 m - 0.75 m
Date: 99-01-13 Field Crew: B. Gentzschein
Valve opened: 990113 095351 Valve closed: 990113 102009 Total flowing time: 26.3 min. Tot. Pr. Build-up time: 11.2 min. Pressure before injection start (P0, kPa) : 116.5 Pressure just before closing the valve (Pp, kPa) : 600.2 Pressure at the end of the recovery (Pf, kPa) : 452.8 Pre-set section pressure (during injection) (Pref, kPa) : 500 Pref was increased to 590 kPa.

Borehole KA3554G02, section 0.75 m – 1.25 m
Date: 99-01-13 Field Crew: B. Gentzschein
Valve opened: 990113 111733 Valve closed: 990113 114304 Total flowing time: 25.5 min. Tot. Pr. Build-up time: 74.5 min. Pressure before injection start (P0, kPa) : 117.6 Pressure just before closing the valve (Pp, kPa) : 517.4 Pressure at the end of the recovery (Pf, kPa) : 653.4 Pre-set section pressure (during injection) (Pref, kPa) : 500 The pressure increased during the recovery period, possibly due to the high pressure in the borehole interval below the packers

Borehole KA3554G02, section 1.25 m – 1.75 m
Date: 99-01-13 Field Crew: B. Gentzschein
Valve opened: 990113 145509 Valve closed: 990113 151711 Total flowing time: 22.1 min. Tot. Pr. Build-up time: 14.8 min. Pressure before injection start (P0, kPa) : 118.1 Pressure just before closing the valve (Pp, kPa) : 571.2 Pressure at the end of the recovery (Pf, kPa) : 574.7 Pre-set section pressure (during injection) (Pref, kPa) : 500 Pref was increased to 550 kPa. A small pressure increase occurred during the recovery period.
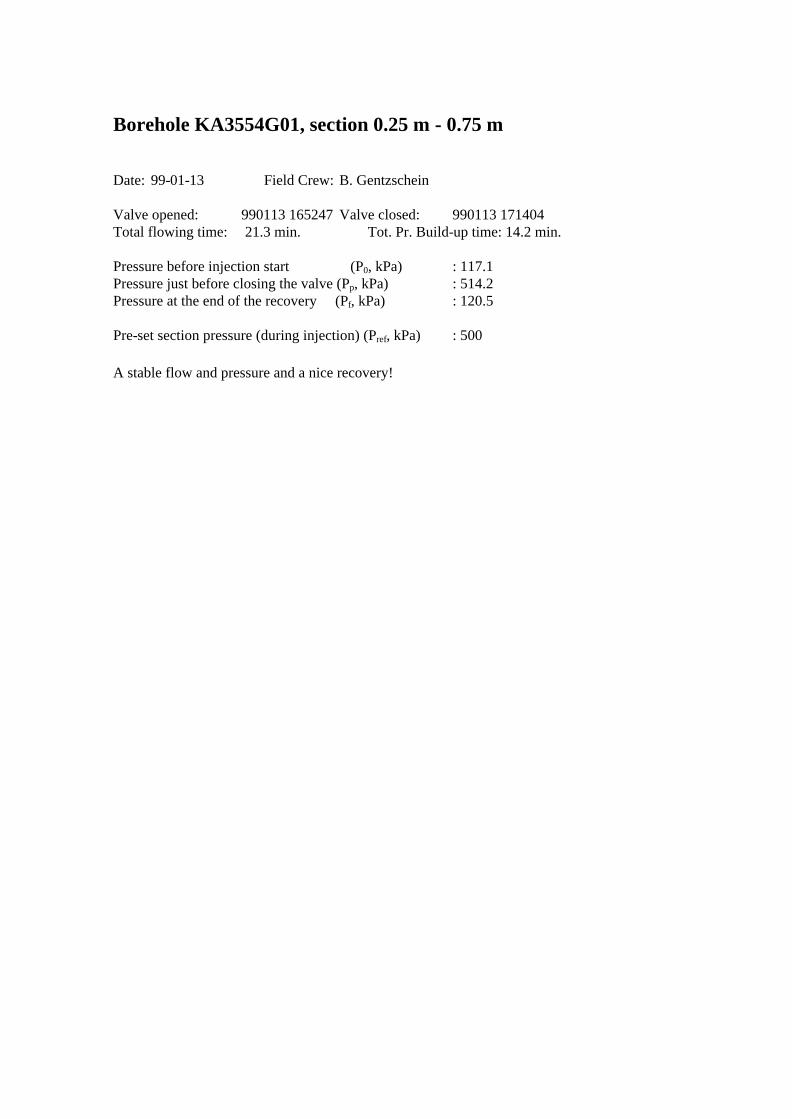
Borehole KA3554G01, section 0.25 m - 0.75 m
Date: 99-01-13 Field Crew: B. Gentzschein
Valve opened: 990113 165247 Valve closed: 990113 171404 Total flowing time: 21.3 min. Tot. Pr. Build-up time: 14.2 min. Pressure before injection start (P0, kPa) : 117.1 Pressure just before closing the valve (Pp, kPa) : 514.2 Pressure at the end of the recovery (Pf, kPa) : 120.5 Pre-set section pressure (during injection) (Pref, kPa) : 500
A stable flow and pressure and a nice recovery!
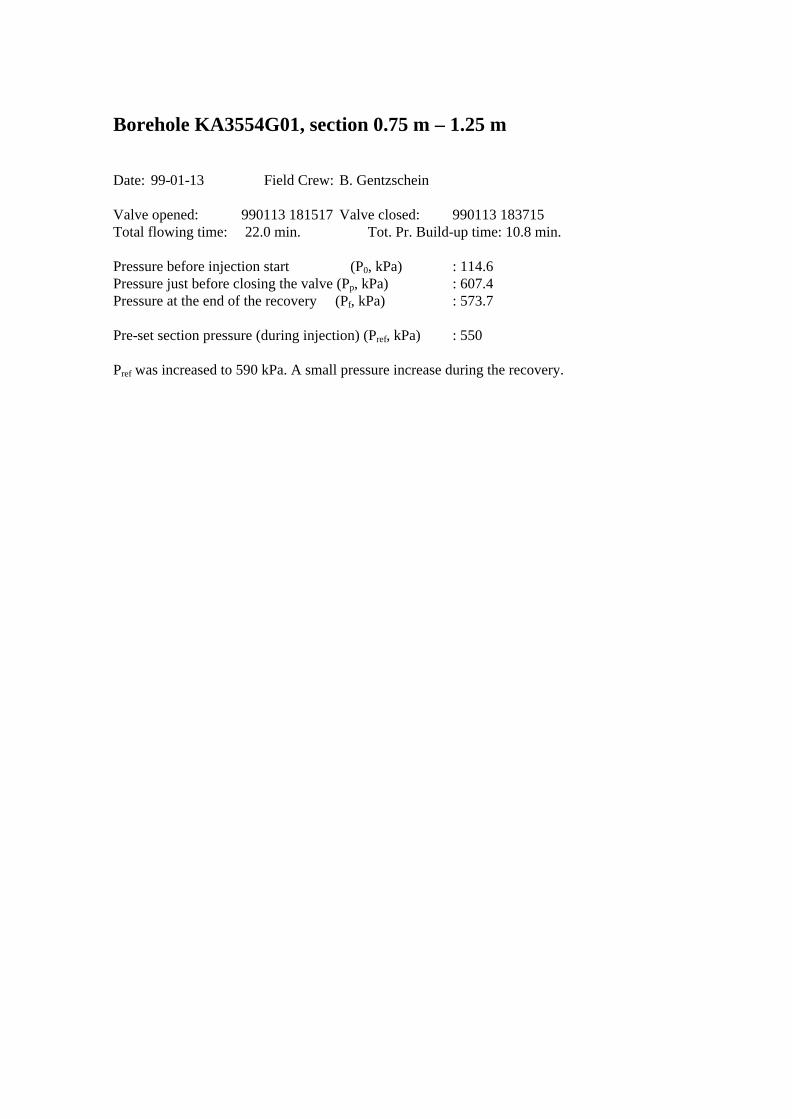
Borehole KA3554G01, section 0.75 m – 1.25 m
Date: 99-01-13 Field Crew: B. Gentzschein
Valve opened: 990113 181517 Valve closed: 990113 183715 Total flowing time: 22.0 min. Tot. Pr. Build-up time: 10.8 min. Pressure before injection start (P0, kPa) : 114.6 Pressure just before closing the valve (Pp, kPa) : 607.4 Pressure at the end of the recovery (Pf, kPa) : 573.7 Pre-set section pressure (during injection) (Pref, kPa) : 550 Pref was increased to 590 kPa. A small pressure increase during the recovery.

Borehole KA3554G01, section 1.25 m – 1.75 m
Date: 99-01-13 Field Crew: B. Gentzschein
Valve opened: 990113 193852 Valve closed: 990113 201258 Total flowing time: 34.1 min. Tot. Pr. Build-up time: 706.6 min. Pressure before injection start (P0, kPa) : 116.9 Pressure just before closing the valve (Pp, kPa) : 520.8 Pressure at the end of the recovery (Pf, kPa) : 2466.4 Pre-set section pressure (during injection) (Pref, kPa) : 500 The pressure increased during the long recovery period. After c. nine hours of recovery, the pressure below the packers declined. It is unknown why.

Borehole KA3572G01, section 0.25 m - 0.75 m
Date: 99-01-14 Field Crew: B. Gentzschein
Valve opened: 990114 114758 Valve closed: 990114 121042 Total flowing time: 22.8 min. Tot. Pr. Build-up time: 70.4 min. Pressure before injection start (P0, kPa) : 129.1 Pressure just before closing the valve (Pp, kPa) : 519.5 Pressure at the end of the recovery (Pf, kPa) : 380.1 Pre-set section pressure (during injection) (Pref, kPa) : 500
A constant injection pressure was achieved after more than 16 minutes.

Borehole KA3572G01, section 0.75 m – 1.25 m
Date: 99-01-14 Field Crew: B. Gentzschein
Valve opened: 990114 141425 Valve closed: 990114 143425 Total flowing time: 20.0 min. Tot. Pr. Build-up time: 15.8 min. Pressure before injection start (P0, kPa) : 122.1 Pressure just before closing the valve (Pp, kPa) : 974.1 Pressure at the end of the recovery (Pf, kPa) : 883.7 Pre-set section pressure (during injection) (Pref, kPa) : 500 Pref was changed to 950 kPa

Borehole KA3572G01, section 1.25 m – 1.75 m
Date: 99-01-14 Field Crew: B. Gentzschein
Valve opened: 990114 154831 Valve closed: 990114 161931 Total flowing time: 31.0 min. Tot. Pr. Build-up time: 12.1 min. Pressure before injection start (P0, kPa) : 136.1 Pressure just before closing the valve (Pp, kPa) : 529.5 Pressure at the end of the recovery (Pf, kPa) : 522.2 Pre-set section pressure (during injection) (Pref, kPa) : 500 The recovery is less than 10 kPa.

Borehole KA3574G01, section 0.25 m - 0.75 m
Date: 99-01-14 Field Crew: B. Gentzschein
Valve opened: 990114 173501 Valve closed: 990114 175814 Total flowing time: 23.2 min. Tot. Pr. Build-up time: 11.7 min. Pressure before injection start (P0, kPa) : 123.7 Pressure just before closing the valve (Pp, kPa) : 539.9 Pressure at the end of the recovery (Pf, kPa) : 535.7 Pre-set section pressure (during injection) (Pref, kPa) : 500 Pref was changed to 520 kPa. The recovery is less than five kPa.

Borehole KA3574G01, section 0.75 m – 1.25 m
Date: 99-01-14 Field Crew: B. Gentzschein
Valve opened: 990114 190421 Valve closed: 990114 193113 Total flowing time: 26.9 min. Tot. Pr. Build-up time: 764.3 min. Pressure before injection start (P0, kPa) : 123.4 Pressure just before closing the valve (Pp, kPa) : 524.7 Pressure at the end of the recovery (Pf, kPa) : 337.6 Pre-set section pressure (during injection) (Pref, kPa) : 500 The recovery lasted over night.

Borehole KA3574G01, section 1.25 m – 1.75 m
Date: 99-01-15 Field Crew: B. Gentzschein
Valve opened: 990115 090150 Valve closed: 990115 093359 Total flowing time: 32.2 min. Tot. Pr. Build-up time: 15.1 min. Pressure before injection start (P0, kPa) : 123.4 Pressure just before closing the valve (Pp, kPa) : 560.6 Pressure at the end of the recovery (Pf, kPa) : 556.8 Pre-set section pressure (during injection) (Pref, kPa) : 500 Pref was changed to 530 kPa. The recovery is less than five kPa.

Borehole KA3576G01, section 0.25 m - 0.75 m
Date: 99-01-15 Field Crew: B. Gentzschein
Valve opened: 990115 105343 Valve closed: 990115 111423 Total flowing time: 20.7 min. Tot. Pr. Build-up time: 75.8 min. Pressure before injection start (P0, kPa) : 122.3 Pressure just before closing the valve (Pp, kPa) : 519.9 Pressure at the end of the recovery (Pf, kPa) : 396.7 Pre-set section pressure (during injection) (Pref, kPa) : 500

Borehole KA357601, section 0.75 m – 1.25 m
Date: 99-01-15 Field Crew: B. Gentzschein
Valve opened: 990115 132813 Valve closed: 990115 135054 Total flowing time: 22.7 min. Tot. Pr. Build-up time: 13.6 min. Pressure before injection start (P0, kPa) : 127.9 Pressure just before closing the valve (Pp, kPa) : 524.4 Pressure at the end of the recovery (Pf, kPa) : 517.3 Pre-set section pressure (during injection) (Pref, kPa) : 500

Borehole KA357601, section 1.25 m – 1.75 m
Date: 99-01-15 Field Crew: B. Gentzschein
Valve opened: 990115 150126 Valve closed: 990115 152344 Total flowing time: 21.3 min. Tot. Pr. Build-up time: 10.3 min. Pressure before injection start (P0, kPa) : 134.8 Pressure just before closing the valve (Pp, kPa) : 529.4 Pressure at the end of the recovery (Pf, kPa) : 523.9 Pre-set section pressure (during injection) (Pref, kPa) : 500
Borehole KA3578G01, section 0.25 m - 0.75 m
Date: 99-01-15 Field Crew: B. Gentzschein
Valve opened: 990115 165533 Valve closed: 990115 171614 Total flowing time: 20.7 min. Tot. Pr. Build-up time: 12.0 min. Pressure before injection start (P0, kPa) : 133.7 Pressure just before closing the valve (Pp, kPa) : 543.3 Pressure at the end of the recovery (Pf, kPa) : 520.0 Pre-set section pressure (during injection) (Pref, kPa) : 500 Pref was changed to 524 kPa. The flow at the end, Qp, is negative (-1.689e-10 m3/s). This is within the limits of the zero stability, ± 1.67 ⋅ 10-9 m3/s (0.0001 kg/min).
Borehole KA357801, section 0.75 m – 1.25 m
Date: 99-01-15 Field Crew: B. Gentzschein
Valve opened: 990115 181213 Valve closed: 990115 183227 Total flowing time: 20.3 min. Tot. Pr. Build-up time: 12.3 min. Pressure before injection start (P0, kPa) : 122.8 Pressure just before closing the valve (Pp, kPa) : 563.0 Pressure at the end of the recovery (Pf, kPa) : 543.3 Pre-set section pressure (during injection) (Pref, kPa) : 500 Pref was changed to 540 kPa.
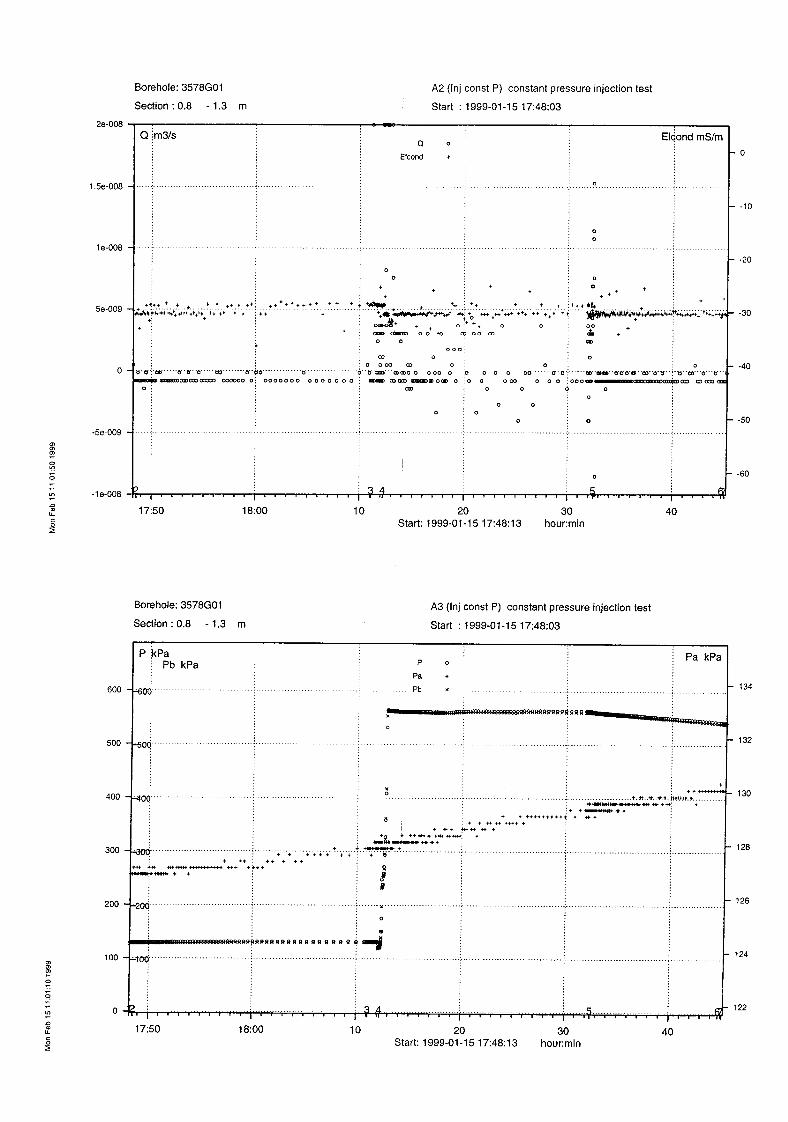

Borehole KA3578G01, section 1.25 m – 1.75 m
Date: 99-01-15 Field Crew: B. Gentzschein
Valve opened: 990115 192522 Valve closed: 990115 194610 Total flowing time: 20.8 min. Tot. Pr. Build-up time: 823.6 min. Pressure before injection start (P0, kPa) : 130.2 Pressure just before closing the valve (Pp, kPa) : 529.9 Pressure at the end of the recovery (Pf, kPa) : 241.5 Pre-set section pressure (during injection) (Pref, kPa) : 500 Recovery over night!