Embed Size (px)
Citation preview

=
Air Quality and Social Deprivation in the UK: an environmental inequalities analysis
Final Report to Department of Environment, Food and Rural Affairs
AEAT/ENV/R/2170, June 2006

AEAT/ENV/R/2170 Air Quality and Social Deprivation in the UK Final Report v1.1
netcen ii
Title Air Quality and Social Deprivation in the UK: an environmental inequalities analysis – Final Report to Defra, Contract RMP/2035
Customer This study was undertaken on behalf of Defra
under Contract RMP/2035. This contract also provided air quality datasets for ONS Neighbourhood Statistics. Funding originated from the Neighbourhood Renewal Unit (part of the Department for Communities and Local Government)
Customer reference
RMP/2035
Confidentiality, copyright and reproduction
Copyright AEA Technology plc All rights reserved. Enquiries about copyright and reproduction should be addressed to the Commercial Manager, AEA Technology plc.
File reference netcen/ED48212/Final Report v1.1 Reference number AEAT/ENV/R/2170 Address for Netcen, AEA Technology Correspondence Gemini Building, Fermi Avenue
Harwell Business Centre Didcot, Oxon OX11 0QR Telephone 0870 190 6554 Facsimile 0870 190 6318 [email protected] netcen is a operating division of AEA Technology
plc netcen is certificated to ISO9001 & ISO 14001
Name Signature Date
Authors Steve Pye Katie King James Sturman
8th June 2006
Reviewed by John Stedman 8th June 2006
Approved by Geoff Dollard 8th June 2006
Note that the air quality datasets used in this study are experimental and are not classified as National Statistics. Front page photograph: © Jon Bower, 2006
AEAT/ENV/R/2170 Air Quality and Social Deprivation in the UK Final Report v1.1
netcen iii

AEAT/ENV/R/2170 Air Quality and Social Deprivation in the UK Final Report v1.1
netcen iv
Executive summary This final report describes the work under Task 3 Policy analysis of the Neighbourhood Statistics on Ambient Air Quality Contract (RMP/3035). The main objective of the policy analysis is to further the current understanding of air quality impacts on local communities with differing levels of social deprivation. Environmental inequalities arise where specific communities, such as the most deprived, experience a poorer environmental quality. Understanding and tackling such inequalities is important in the context of sustainable development, where socio-economic issues need to be considered along side environmental ones, and in view of the emerging agenda on social justice in the UK. To further investigate environmental inequalities associated with air quality, the following analyses were undertaken in this study:
� Comparison of levels of deprivation and air quality concentrations across the UK � Assessment of changes in trends at different spatial resolutions e.g. at the urban
level � Consideration of whether populations experiencing air pollution higher than the Air
Quality Strategy (AQS) objective values tend to be more deprived through assessment of deprivation levels in Air Quality Management Areas (AQMAs)
� Assessment of the potential impact of pollution from large point sources on communities based on their level of deprivation
� Examination of whether pollution levels and associated impacts suffered by the most deprived communities could be compounded by increased susceptibility
The relationship between distribution of pollutant concentrations and areas of social deprivation is complex. It depends on the pollutant in question and differs in different cities and regions of the UK. Consequently it is difficult to draw general conclusions that apply everywhere. There are however a number of important key findings summarised below, which feed into proposed recommendations at the end of this section for further consideration by Defra. UK wide analysis
� Inequalities in the distribution of pollutant concentrations (higher relative concentrations in the more deprived deciles) can be observed for England, Scotland and Northern Ireland for nitrogen dioxide (NO2) and particulate matter (PM10), and for sulphur dioxide (SO2) in England and Northern Ireland. The overall level of inequality is reduced by high concentrations of these species also being observed in the least deprived deciles.1 For NO2 and PM10, this distribution can largely be explained by the high urban concentrations driven by road transport sources, and the higher proportion of deprived communities in urban areas.
� Inequalities are greater in areas with poorest air quality for the above pollutants.
In such areas, the population is characterised by higher levels of deprivation, indicating greater inequalities in such areas than observed at the national level.
� In Wales, the trend is different for NO2 and SO2, with the highest average
concentrations experienced by the least deprived. Above average concentrations are also observed in the most deprived deciles. For PM10, both the most and least deprived deciles experience the highest average concentrations. This different trend is due to the location of more prosperous communities in urban areas
1 A decile refers to 10% of the population characterised by a specific level of deprivation, decile 1 being the most deprived and decile 10 being the least deprived.
AEAT/ENV/R/2170 Air Quality and Social Deprivation in the UK Final Report v1.1
netcen v
experiencing higher pollution due to road transport sources, and a significant proportion of more deprived communities residing in areas with lower levels of road transport emissions e.g. South Wales valleys. This distribution can be clearly seen in Figure 3.6.
� The ground level ozone (O3) trend is the inverse of that observed for NO2, with
relatively lower concentrations experienced by the most deprived deciles, with the exception of Wales, where both the most and least deprived deciles experience the lowest concentrations. This distribution is due to generally lower O3 concentrations in urban areas, due to the NOx titration or ‘quenching’ process (destruction by NO2 of O3 close to sources of nitrogen oxides (NO and NO2), such as road traffic).2
� In future years, the numbers of people experiencing high air pollution is
significantly reduced based on existing and planned policies. Inequalities however persist in some areas despite these improvements, although the population experiencing concentrations above the AQS objective values is much smaller. It appears that policies result in concentration reductions across all deciles but because the highest values tend to be in the most deprived deciles, many are not reduced below stated objectives by 2010.
� The average values determining country trends are based on a significant number
of pollutant concentration values within each deprivation decile. There is wide variation between these values, which needs to be recognised when interpreting the country trends.
Variations in analysis scale, deprivation measures and pollution data
� Different analyses were undertaken to further investigate the observed UK wide trends, through changes to analysis scale, the way deprivation was measured, and the type of pollution data.
� The distribution of population deciles across urban and rural areas is a key
determinant of the country trend. In urban areas, a ‘flatter’ trend can be observed due to high air quality concentrations across all deprivation decile areas. Lower concentrations are more commonly observed in rural areas, which often have larger mid decile populations. The national trend represents a combination of these trends, and tends to show high average concentrations in the most and least deprived deciles, and much lower concentrations in the mid-deciles, which tend to be rural. Consequently, the observed shape of the distribution curve is ‘U’ shaped rather than flat.
� Limited variation in trends was observed for different regions of England, and
between different urban areas of the UK. Generally, all reflected the national trends (although urban trends showed less variation, as discussed above, and as a result less marked inequalities).
� How deprivation is defined – through the indicators used and relative weightings
used in the overall deprivation index - influences the resulting national trend. Our analysis has shown that the level of inequality can change if the definition of overall deprivation is changed. For example, if we measure deprivation on the
2 Whereas nitrogen dioxide (NO2) participates in the formation of ozone, nitrogen oxide (NO) destroys ozone to form oxygen (O2) and nitrogen dioxide (NO2). For this reason, ozone levels are not as high in urban areas (where high levels of NO are emitted from vehicles) as in rural areas (as shown in Figure 3.2). As the nitrogen oxides and hydrocarbons are transported out of urban areas, the ozone-destroying NO is oxidised to NO2, which participates in ozone formation.

AEAT/ENV/R/2170 Air Quality and Social Deprivation in the UK Final Report v1.1
netcen vi
basis of income or health only, the resulting level of inequality differs to an analysis that uses the overall deprivation index (known as the Index of Multiple Deprivation, or IMD).
� Roadside concentrations were compared with deprivation levels. Similar trends
were observed to those in the countrywide analysis (more deprived populations experiencing higher concentrations), illustrating the importance of road transport sources in determining the England distributions.
Communities in Air Quality Management Areas (AQMAs)
� AQMA populations, who are likely to experience high pollution levels by virtue of the designation of an AQMA, are disproportionately deprived relative to the rest of the population in Scotland and England. This apparent inequality is not surprising given that urban populations have a greater number of deprived communities.
� AQMAs, at least for those declared for NO2 in England, appear to cover a
significant number of the census areas that are considered to be high deprivation-high pollution (e.g. in the top percentile). Therefore, AQMAs may be an effective means of reducing inequalities in the future, where they realise the necessary reductions. The impact of AQMAs is not modelled in the 2010 projected data used in this analysis so potential benefits are not identified in the analysis.
Community air quality and contribution from point sources
� The point source analysis suggests that in England, more deprived communities receive larger contributions from point sources to their ambient air quality than less deprived communities for all pollutants included in the analysis – NOx, PM10 and SO2. However, in Wales, the results are inconclusive, with no obvious trend showing that any one type of community is disproportionately affected by pollution from point sources.
Population susceptibility to air quality impacts as a compounding factor of environmental inequalities
� Determining susceptibility is difficult due to the large range of factors that might determine an individual response to a given dose of air pollution. In particular, actual exposure to air pollution is important but cannot be addressed in this analysis, due to its scope and scale. The use of age as an indicator of susceptibility has been justified based on its use in health impact assessment methodologies, with children and elderly groups deemed more susceptible to certain health impacts. An example of this greater susceptibility is the higher rates of asthma observed in children – 1 in 10 (Asthma UK 2004), the symptoms of which can be exacerbated by poor air quality, resulting in additional consultations with physicians.
� We have assumed that age is an indicator of susceptibility in measuring specific
health impacts. On this basis, if a population has a higher proportion of old or young, we could infer that the susceptibility of that population to specific impacts is greater. In England, the most deprived deciles do have a greater proportion of children relative to other age groups, and therefore, that population may have increased susceptibility to specific impacts. However, a lower proportion of elderly in these deciles may result in reduced susceptibility to specific impacts (for the population as a whole). What certainly cannot be inferred is that general susceptibility to health impacts is greater or lesser.
AEAT/ENV/R/2170 Air Quality and Social Deprivation in the UK Final Report v1.1
netcen vii
� There are a higher proportion of children in the most deprived deciles in England, where higher concentrations of NO2 and PM10 tend to be observed. This leads to a greater level of inequality (higher relative concentrations in high deprivation areas) than observed for the population as a whole. This level of inequality may be further increased in view of the greater susceptibility discussed in the previous point.
Based on the above findings, the following recommendations can be made:
1. Consideration of further targeted measures (based on additional research) where high deprivation-high pollution areas persist. This analysis has shown that there are specific areas that have the worst air quality and are the most deprived, currently and in future years. It has also indicated that a disproportionate number of some of the most vulnerable members of the community also live in these areas. Additional action should be developed to target such areas, based on further research to identify such areas. Such recommendations are in line with Government commitments to tackle environmental inequalities.
The Government’s sustainable development strategy makes the following commitments (HMSO 2005) – i) to fund further research on the causes of environmental inequality and the effectiveness of measures to tackle it in order to establish the best ways to tackle these issues in communities and ii) in the short term focus on improving the environment in the areas already identified as most deprived by the Index of Multiple Deprivation (while carrying out further research to help identify the areas with the worst local environment). Defra, in partnership with regional and local agencies, will have a key role to play in meeting this commitment
2. Development of robust quantitative analysis for assessment of
inequalities when appraising different policies. This would demonstrate the impact of new and existing policies on the current and future level of inequalities, based on a consistent methodology, using indicators such as Gini CI values (a measure of the level of equality). This would help incorporate social considerations into policy appraisal on a quantitative basis, as is currently done for economic and environmental ones, for example in the recent economic analysis to inform the consultation of the Air Quality Strategy Review (Defra 2006). Within this assessment, only limited qualitative analysis of the distributional impacts on different communities has been undertaken.
3. Cross-departmental co-operation needs to be further strengthened to
effectively tackle environmental inequalities; as has been noted, environmental inequalities need to be tackled from two sides – firstly, regeneration to reduce multiple deprivation, which is part of a cross-departmental agenda, and secondly, improve environmental quality, in this case air quality, which is where Defra can lead on policy development, with implementation at the local level.
This is being promoted by the Neighbourhood Renewal Unit within the ODPM. Commitment 79 in the Neighbourhood Renewal Strategy (SEU 2001) sets out in general terms how air quality is being improved by Government, through a range of policies to improve local environmental quality and increase recognition of the role of the environment in improving quality of life. For example, the Air Quality Strategy sets out the Government and Devolved Administrations’ policies and proposals for improving ambient air quality across the UK, and sets targets for reducing the levels of eight key air pollutants. Local authorities have a central role to play in delivering cleaner air. Where they identify parts of their areas where the
AEAT/ENV/R/2170 Air Quality and Social Deprivation in the UK Final Report v1.1
netcen viii
nationally prescribed air quality objectives may not be met, they are required to prepare air quality action plans setting out the steps they intend to take to address the problem. As mentioned in recommendation 1, further targeted action could be required to focus on those areas not only with poor air quality but which also have high levels of deprivation.
4. Further research on exposure patterns for different communities based on
behavioural patterns. Models are being developed to better understand the levels of exposure of different communities based on behavioural patterns e.g. travelling to work, staying at home etc. It is recommended that research based on case studies is undertaken to assess differences in exposure between socio-economic groups (based on their different behaviour and living / working environments). In addition, further research is recommended to further develop understanding on susceptibility to air pollution impacts, based on lifestyle choices that different socio-economic groups make e.g. smoking, diet etc.
5. Further research into the distribution of other indicators of environmental
quality. As described in the SDRN (2004) review of environmental justice literature, most research has been undertaken into the inequalities associated with air quality. The distribution of other types of environmental inequality need further research, as do the cumulative environmental inequalities experienced by different communities.

AEAT/ENV/R/2170 Air Quality and Social Deprivation in the UK Final Report v1.1
netcen ix

AEAT/ENV/R/2170 Air Quality and Social Deprivation in the UK Final Report v1.1
netcen x
Contents
1 Introduction 1
NKN pqrav=l_gb`qfsbp= N NKO pqor`qrob=lc=obmloq= O
2 Issues of environmental justice, equity and equality 3
OKN qeb=`lk`bmq=lc=bksfolkjbkq^i=bnrfqv=L=grpqf`b= P OKO bksfolkjbkq^i=bnr^ifqv=^ka=rh=mlif`v= P
3 UK air quality policy and environmental inequalities 5
PKN hbv=plro`bp=lc=^fo=mliirqflk= R PKO rh=^fo=nr^ifqv=mlif`v= U PKP afpqof_rqflk=lc=^fo=mliirqflk=^ka=`ljjrkfqv=abmofs^qflk=ibsbip= NM
4 Review of key literature 17
5 Developing an approach for analysis 21
RKN jbqelalildv=clo=a^q^=^k^ivpfp= ON RKO a^q^=plro`bp=clo=^k^ivpfp= OO RKP hbv=fpprbp=obi^qfkd=ql=a^q^pbqp= OR
6 UK wide analysis 27
SKN `roobkq=afpqof_rqflk^i=qobkap=fk=ibsbip=lc=abmofs^qflk=^ka=mliirq^kq=
`lk`bkqo^qflkp=_v=`lrkqov= OT SKO ^k^ivpfp=lc=`e^kdb=fk=afpqof_rqflk^i=fkbnr^ifqfbp=_bqtbbk=OMMP=^ka=OMNM=PQ SKP obdflk^i=s^of^qflk=fk=qobkap= QQ SKQ alj^fkp=lc=abmofs^qflk=^ka=mliirq^kq=`lk`bkqo^qflkp=_v=`lrkqov= QR SKR `lrkqovJ_^pba=^k^ivpfp=prjj^ov= QV
7 Urban analysis 51
TKN ro_^k=mliirqflk=^ka=ibsbip=lc=abmofs^qflk= RN TKO ro_^k=mliirqflk=colj=ol^a=qo^kpmloq=^ka=abmofs^qflk= RP TKP `ljm^ofplk=lc=`lrkqovI=ro_^k=^ka=oro^i=`lk`bkqo^qflkJabmofs^qflk=
qobkap= RQ TKQ ro_^k=^k^ivpfp=prjj^ov= RT
8 Communities in AQMAs 59
UKN l_gb`qfsbp=^ka=^mmol^`e=ql=^nj^=^k^ivpfp= SM UKO ^nj^=^k^ivpfp=obpriqp= SM UKP ^nj^=^k^ivpfp=prjj^ov= SP
9 Community air quality and contribution from point sources 65
VKN mlfkq=plro`b=a^q^pbq= SR VKO mlfkq=plro`b=^k^ivpfp=^mmol^`e= SS VKP ^k^ivpfp=obpriqp= SU VKQ mlfkq=plro`b=^k^ivpfp=prjj^ov= TO

AEAT/ENV/R/2170 Air Quality and Social Deprivation in the UK Final Report v1.1
netcen xi
10 Population susceptibility to air quality impacts as a compounding factor of environmental inequalities 75
NMKN absbilmfkd=^k=^mmol^`e=ql=^ppbpp=mlmri^qflk=prp`bmqf_fifqv= TR NMKO ^db=^k^ivpfp=clo=bkdi^ka= TT NMKP ^ob^p=lc=eb^iqe=fkbnr^ifqfbp=^ka=^fo=mliirqflk= UN
11 Study recommendations 85
References 88
Annexes 91
AEAT/ENV/R/2170 Air Quality and Social Deprivation in the UK Final Report v1.1
netcen xii
List of figures Figure 3.1 Key UK sources of PM10 emissions, 2003 6 Figure 3.2 Concentrations of ozone in the UK in 2003 7 Figure 3.3 Concentrations of SO2 in the UK in 2003 8 Figure 3.4 NO2 concentrations in 2003, and levels of deprivation in England 11 Figure 3.5 NO2 concentrations in 2003, and levels of deprivation in Scotland 12 Figure 3.6 NO2 concentrations in 2003, and levels of deprivation (from Welsh IMD 2005)
in Wales 13 Figure 3.7 PM10 concentrations in 2003, and levels of deprivation (from NI MDM (Multiple
Deprivation Measure) 2005) in Northern Ireland 14 Figure 5.1 Example of cumulative distributions in Gini analysis 22 Figure 6.1 Mean concentrations of NO2 by decile and country, 2003 28 Figure 6.2 Mean concentrations of PM10 by decile and country, 2003 29 Figure 6.3 Mean concentrations of O3 by decile and country, 2003 29 Figure 6.4 Mean concentrations of SO2 by decile and country, 2003 30 Figure 6.5 Reduction in average pollutant concentrations by decile between 2003 and
2010 35 Figure 6.6 English decile populations in areas with average NO2 concentrations >40
µg/m3 in 2003 and 2010 37 Figure 6.7 Distribution by decile of population in England in areas where NO2 >40 µg/m
3 in 2003 and 2010 38
Figure 6.8 English decile populations in areas with average PM10 concentrations >20 µg/m3 in 2003 and 2010 39
Figure 6.9 English decile populations in areas with average PM10 concentrations >25 µg/m3 in 2003 and 2010 39
Figure 6.10 Distribution by decile of population in England in areas where PM10 >25 µg/m3 in 2003 and 2010 40
Figure 6.11 Scottish decile populations in areas with average PM10 concentrations >18 µg/m3 in 2003 and 2010 41
Figure 6.12 Distribution by decile of population in Scotland in areas where PM10 >18 µg/m3 in 2003 and 2010 41
Figure 6.13 Welsh decile populations in areas with average PM10 concentrations >20 µg/m3 in 2003 and 2010 42
Figure 6.14 Northern Ireland decile populations in areas with average PM10 concentrations >20 µg/m3 in 2003 and 2010 43
Figure 6.15 Distribution by decile of population in Northern Ireland in areas where PM10 >20 µg/m3 in 2003 and 2010 43
Figure 6.16 Regional trends of mean NO2 concentrations by deprivation decile 44 Figure 6.17 Trends analysis for England – mean annual NO2 concentrations vs. domain
deprivation deciles 47 Figure 6.18 Trends analysis for Wales – annual mean PM10 concentrations vs. domain
deprivation deciles 48 Figure 7.1 A comparison of average concentrations of NO2 by decile group between
selected urban areas in England (and the whole of England) 52 Figure 7.2 A comparison of average concentrations of PM10 by decile group between
Wales, Cardiff and Swansea 53 Figure 7.3 Rural-urban population split by deprivation decile in each country of the UK
(as a percentage of each decile population) 55 Figure 7.4 Comparison of English urban – rural trends for NO2 concentrations by
deprivation decile 56 Figure 7.5 Comparison of Northern Ireland urban – rural trends for SO2 concentrations by
deprivation decile 56 Figure 8.1 AQMA location in selected English urban areas classified by deprivation deciles59 Figure 8.2 Population distribution (by decile) in AQMAs declared for NO2 in England 61 Figure 8.3 Population distribution (by decile) in AQMAs declared for PM10 in England 61 Figure 8.4 Population distribution (by decile) in AQMAs declared for NO2 in Scotland 62

AEAT/ENV/R/2170 Air Quality and Social Deprivation in the UK Final Report v1.1
netcen xiii
Figure 8.5 AQMA location in selected Scottish urban areas classified by deprivation deciles 63
Figure 9.1 Percentage contribution to NOx concentrations by point sources in the North East of England 67
Figure 9.2 Analysis of point source contribution by deprivation decile – England 69 Figure 9.3 Areas in England (shown in red) where point source NOx concentrations > 3
ug/m3 70 Figure 9.4 Analysis of point source contribution by deprivation decile – Wales 71 Figure 10.1 Socio-economic model of health 76 Figure 10.2 Percentage of age group by deprivation decile in England 78 Figure 10.3 Population-weighted concentrations (PM10) by age group in each deprivation
decile 79 Figure 10.4 Percentage of age group in each decile for highest PM10 concentration areas80 Figure 10.5 Spearhead Group Areas 83
AEAT/ENV/R/2170 Air Quality and Social Deprivation in the UK Final Report v1.1
netcen xiv
List of tables Table 3.1 UK Air Quality Objectives 9 Table 5.1 Deprivation datasets for constituent countries 23 Table 5.2 Domains included in country-based deprivation datasets (and associated
weightings within the IMD) 23 Table 5.3 Air pollution datasets to be used in the analysis 24 Table 6.1 % Decile population in England experiencing highest 10% of pollutant
concentrations by decile, and Concentration Index value 32 Table 6.2 % Decile population in Scotland experiencing highest 10% of pollutant
concentrations, and Concentration Index value 32 Table 6.3 % Decile population in Wales experiencing highest 10% of pollutant
concentrations, and Concentration Index value 33 Table 6.4 % Decile population in NI experiencing highest 10% of pollutant
concentrations, and Concentration Index value 33 Table 6.5 A comparison of the indicators used in the health domain across the four
indexes 46 Table 7.1 Rural / urban populations in the UK, and numbers of census areas 54 Table 9.1 Point source datasets used in UK Pollution Climate Modelling work 66 Table 9.2 Threshold range by pollutant for point source analysis 67 Table 9.3 Sample size under each threshold value, and potential analysis population 68 Table 10.1 Data used in population weighted analysis for 0-14 age group 80 Table 10.2 Estimated population-weighted means concentrations (ug/m3) for Spearhead
Areas 84

AEAT/ENV/R/2170 Air Quality and Social Deprivation in the UK Final Report v1.1
netcen xv

AEAT/ENV/R/2170 Air Quality and Social Deprivation in the UK Final Report v1.1
netcen 1
1 Introduction
This final report describes the work under Task 3 Policy analysis of the Neighbourhood Statistics on Ambient Air Quality Contract (RMP/3035). The main objective of the policy analysis is to further the current understanding of air quality impacts on local communities with differing levels of social deprivation. Environmental inequalities arise where specific communities, such as the most deprived, experience a poorer environmental quality. Understanding and tackling such inequalities is important in the context of the sustainable development, where socio-economic issues need to be considered along side environmental ones, and in view of the emerging agenda on social justice in the UK. This report develops the approach outlined in the first and second interim reports (King and Pye 2005; Pye et al. 2005), with a more comprehensive and detailed presentation of methodologies and results. It also incorporates stakeholder feedback that arose from the review of interim report 2, and from a stakeholder meeting held at Defra in November 2005. 1.1 Study objectives
The two key objectives of this study were:
1. To better understand the air quality experienced by people living in types of communities as characterised by differing levels of deprivation, and assess whether inequalities exist e.g. specific social groups experience disproportionately high pollutant concentrations relative to others. There is already a significant evidence base to suggest that significant inequalities do exist. This study seeks to both confirm the existing evidence and provide new and additional evidence through assessing different aspects of this issue.
2. To assess how far current policy is reducing inequalities, and what
recommendations can be made to further promote environmental equality. To meet the above objectives, the following specific tasks have been undertaken:
� Comparison of levels of deprivation and air quality concentrations across the UK to assess whether the most deprived communities are suffering the worst air quality. An assessment of how this might change in the future is also undertaken, through comparison with projected 2010 pollution data.
� Assessment of changes in trends at different spatial resolutions e.g. at the urban
level. This analysis looks at whether social deprivation and air quality are more strongly correlated in urban areas, and compares this to the trends observed for rural areas, and for the UK as a whole.
� Consideration of whether populations in AQMAs tend to be more deprived than the
UK population, and if such inequalities exist, whether AQMAs might be an important policy instrument in tackling such inequalities.
� Assessment of the potential impact of pollution from large point sources on
communities based on their level of deprivation. This assessment provides a better understanding of the contribution of industrial point sources to pollution levels in different communities, and helps determine whether more deprived communities suffer disproportionately from pollution from point sources.
AEAT/ENV/R/2170 Air Quality and Social Deprivation in the UK Final Report v1.1
netcen 2
� Examination of whether pollution levels and associated impacts suffered by the
most deprived communities could be compounded by increased susceptibility. Demographic characteristics of the most deprived communities (e.g. age, state of health) could compound existing inequalities, where such communities are already subject to higher pollution levels.
The above tasks cover a range of analyses that should increase the evidence base on environmental inequalities, and provide Government with increased understanding of some of the most pertinent issues. The area of analysis that this study does not seek to develop is an understanding of why certain communities experience higher levels of air pollution than others. The causes of a given pollution-deprivation distribution could be explained by a range of factors including the economic ability to relocate away from pollution sources e.g. busy roads, and historical factors concerning location of certain socio-economic groups across the UK. Given that the analysis in this study is being undertaken at a UK spatial scale, and that distribution factors will differ significantly between localities, we do not consider this issue in significant detail. 1.2 Structure of report
In the first part of this report, the policy context for this work is considered, along with other research in the field of environmental equity and justice relevant to air quality. Section 2 considers the concept of environmental equity, and how this fits into the current UK Government agenda, particularly in terms of sustainable development agenda and initiatives on neighbourhood renewal. Section 3 provides an overview of current UK air quality policy, describing the sources of air pollution and the policies to address different sources. A qualitative assessment is also undertaken of the spatial distribution of air pollution compared to levels of deprivation, based on map images; this provides a visual representation of some of the analysis described later in the report. It is recognised that a significant amount of work has been done in recent years, particularly on air quality and deprivation. Therefore, in order to build on previous work and not simply replicate it, incorporate recommendations from previous work into this study, and help develop our methodological approach, an understanding of previous work is vital. Therefore, a brief review of existing (and current) studies is presented in section 4. The majority of the report describes the different types of analysis undertaken. In section 5, we describe our general approach to the study analysis, including a review of the key datasets used. In subsequent sections, the approach for each specific task is described in greater detail. The analysis has been split into the following five sections:
� UK wide analysis (section 6) � Urban scale analysis (section 7) � Communities in AQMAs (section 8) � Analysis of communities close to point sources (section 9) � Assessment of population susceptibility to air pollution (section 10)
We draw out the key conclusions at the end of each section, and make a number of recommendations based on these findings in section 11. This study focuses on providing a comprehensive analysis for England (for which funding was provided) but for most analyses also covers the other parts of the UK – Scotland, Wales and Northern Ireland.

AEAT/ENV/R/2170 Air Quality and Social Deprivation in the UK Final Report v1.1
netcen 3
2 Issues of environmental justice, equity and equality
2.1 The concept of Environmental Equity / Justice
In recent years, the concepts of environmental equity and environmental justice have been recognised as important in the context of sustainable development. Such concepts concern the quality of the environment (and the policy actions associated with environmental quality) in relation to the different groups in the community (as characterised by, for example, levels of deprivation or race). The concept of environmental justice has been recognised in the USA for many years, primarily focusing on disproportionate environmental risks faced by minority groups e.g. hazardous sites located predominantly in black neighbourhoods. In the UK, significant research in this area is relatively new,3 with a greater focus on environmental inequalities suffered by communities characterised by differing levels of deprivation. A report by the Sustainable Development Research Network (SDRN 2004) considered different definitions of the concepts of environmental justice and equity. They considered a US EPA definition, and selected UK-based definitions. All definitions recognised that environmental justice included the following:
� Deprived / excluded communities not experiencing disproportionate negative environmental impacts, or disproportionate impacts from action taken to reduce such negative impacts
� Access to environmental information and to participation in decision making which may affect the quality of their environment for all communities.
This work focuses on the first issue, assessing the extent to which certain communities do experience disproportionate negative impacts, and how current policy action is reducing such inequalities. This study tends to use the term environmental equality rather than environmental equity or justice. In terms of environmental quality, equality refers to a community experiencing better or worse conditions relative to other communities. It can be measured on the basis of observed differences in environmental quality. Concepts of equity and justice, however, are subjective, suggesting what is fair, and therefore requiring value judgements. To avoid having to make value judgements, we only refer to the concept of equality, recognising that inequalities are what give rise to environmental injustices and inequity. 2.2 Environmental Equality and UK policy
In the UK, recognition of the importance of environmental equality has been reflected by increasing political and government attention in this area. The key UK document on sustainable development, the UK Sustainable Development Strategy (HMSO 2005) has identified environment and social justice as a priority area for focus. It quotes the following from the report by the SDRN (2004) undertaken as supporting evidence for the Strategy:
3 The majority of studies in this area have been undertaken in the last 6-7 years, as reflected in the literature review (in section 4).

AEAT/ENV/R/2170 Air Quality and Social Deprivation in the UK Final Report v1.1
netcen 4
Poor local and environmental quality and differing ease of access to environmental goods and services have a detrimental effect on the quality of life experienced by the deprived communities and socially excluded groups and can reinforce deprivation if not tackled alongside access to employment, health and tackling crime. In recognition of the problem, the Strategy states that ‘the Government will fund further research on the causes of environmental inequality and the effectiveness of measures to tackle it in order to establish the best ways to tackle these issues in communities’. It also states that ‘the Government will in the short term focus on improving the environment in areas already identified as most deprived by the Index of Multiple Deprivation’. There has also been the publication of the Government’s Neighbourhood Renewal Strategy (SEU 2001), which recognises the importance of improving environmental quality as a key aspect of tackling deprivation, and significant activity from organisations such as the Environment Agency funding research on this issue (for example, see reports by Walker et al. 2003). Defra and the Devolved Administrations (and their respective environmental agencies), as the public bodies responsible for environmental quality, have a key role to play in considering ways to reduce identified environmental inequalities. This study is an important means of improving understanding in this area, in particular relating to inequalities associated with air quality. The primary purpose of this report is to provide decision makers involved in air quality policy with an understanding of how current and future policy actions impact on different communities, based on their deprivation characteristics. If policy makers have a better understanding of spatial inequalities experienced by certain communities, current policy action can be assessed to see how to address such inequalities, and future action can be shaped with such issues taken into consideration.

AEAT/ENV/R/2170 Air Quality and Social Deprivation in the UK Final Report v1.1
netcen 5
3 UK air quality policy and environmental inequalities
In addressing environmental inequalities associated with air quality, it is important to identify what the key sources of air pollution are, and the current policies in place to address the associated air quality problems. In this section, the key sources of air pollution are considered, and the policy initiatives undertaken to address air pollution. In addition, the distribution of pollution relative to level of deprivation is considered qualitatively, to help provide an initial assessment of the spatial relationship between air pollution and deprivation. 3.1 Key sources of air pollution
This study focuses on the following air pollutants – Nitrogen oxides (as NO2), particulate matter (PM10), Ozone (O3), and sulphur dioxide (SO2). A brief summary of the key sources is presented below. The information is sourced from the UK National Atmospheric Emissions Inventory (NAEI) in 2003 (Dore et al. 2005). NOx (as NO2) NOx, or nitrogen oxides, consist of NO (nitric oxide) and NO2 (nitrogen dioxide). Emissions are usually in the in the form of NO, transformed in the atmosphere to NO2, principally by reaction with ozone. NOx can also be emitted as NO2, in a primary form i.e. emitted a NO2 and therefore does not undergo secondary transformation. In emission inventories, NOx is usually expressed as NO2. The most significant source of NOx in the UK is road transport, accounting for almost half of emissions. The other key source is industrial combustion, in particular power stations, which account for approximately 25% of emissions. Such emissions have decreased significantly over the past 10 years due to the use of technologies, such a low NOx burners, and improvements in plant thermal efficiency. PM10 PM10 is a measure of the particles in the atmosphere of less than 10 µm. This is viewed as an increasingly important source of pollution, particularly with regard to health impacts. PM10 sources can be categorised into two types; the first is the direct emission of particulate matter (known as primary particulates) into the atmosphere from a wide range of sources such as fuel combustion, surface erosion and wind blown dusts and mechanical break-up in, for example, quarrying and construction sites. The second source is the formation of particulate matter in the atmosphere through the reactions of other pollutants such as sulphur dioxide, nitrogen oxides and ammonia to form solid sulphates and nitrates, as well as organic aerosols formed from the oxidation of NMVOCs. These are called secondary particulates. The modelled PM10 concentration data includes both forms of PM10. PM10 (and smaller fractions) are increasingly viewed as an important pollutant to control in view of the associated health impacts. The key sources of primary PM10 across the UK are shown in Figure 3.1 below.
AEAT/ENV/R/2170 Air Quality and Social Deprivation in the UK Final Report v1.1
netcen 6
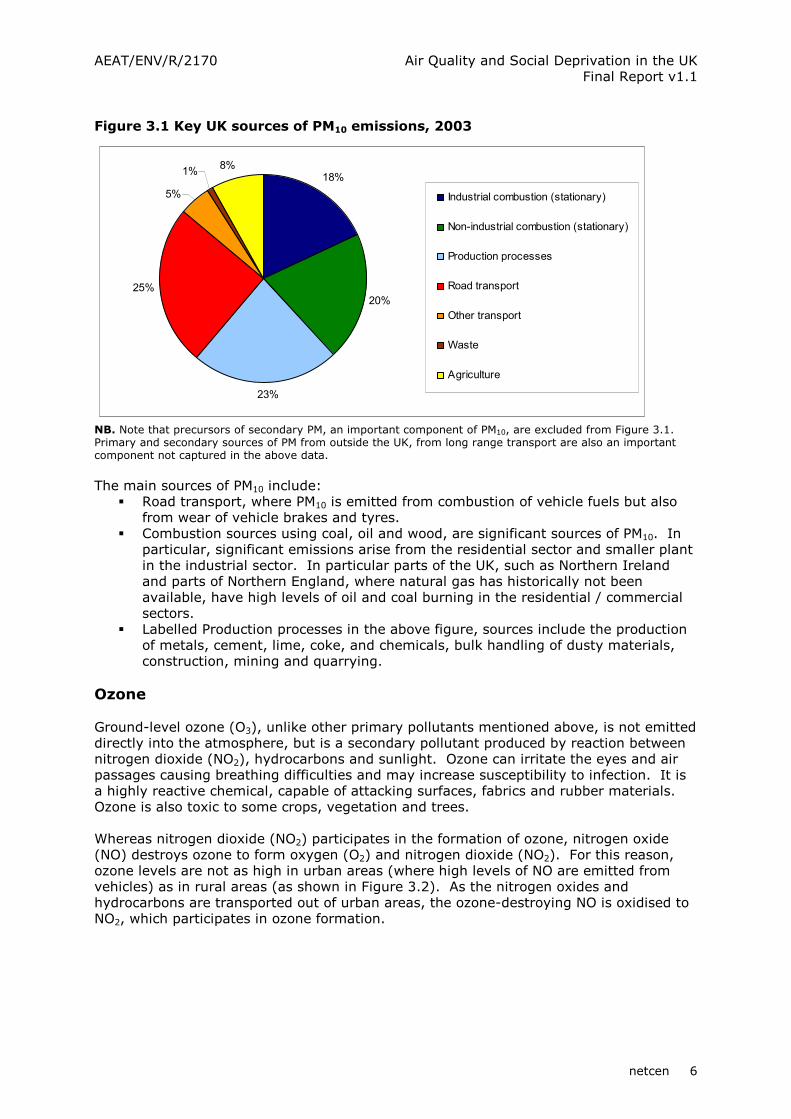
Figure 3.1 Key UK sources of PM10 emissions, 2003
18%
20%
23%
25%
5%
1%8%
Industrial combustion (stationary)
Non-industrial combustion (stationary)
Production processes
Road transport
Other transport
Waste
Agriculture
NB. Note that precursors of secondary PM, an important component of PM10, are excluded from Figure 3.1. Primary and secondary sources of PM from outside the UK, from long range transport are also an important component not captured in the above data. The main sources of PM10 include:
� Road transport, where PM10 is emitted from combustion of vehicle fuels but also from wear of vehicle brakes and tyres.
� Combustion sources using coal, oil and wood, are significant sources of PM10. In particular, significant emissions arise from the residential sector and smaller plant in the industrial sector. In particular parts of the UK, such as Northern Ireland and parts of Northern England, where natural gas has historically not been available, have high levels of oil and coal burning in the residential / commercial sectors.
� Labelled Production processes in the above figure, sources include the production of metals, cement, lime, coke, and chemicals, bulk handling of dusty materials, construction, mining and quarrying.
Ozone Ground-level ozone (O3), unlike other primary pollutants mentioned above, is not emitted directly into the atmosphere, but is a secondary pollutant produced by reaction between nitrogen dioxide (NO2), hydrocarbons and sunlight. Ozone can irritate the eyes and air passages causing breathing difficulties and may increase susceptibility to infection. It is a highly reactive chemical, capable of attacking surfaces, fabrics and rubber materials. Ozone is also toxic to some crops, vegetation and trees. Whereas nitrogen dioxide (NO2) participates in the formation of ozone, nitrogen oxide (NO) destroys ozone to form oxygen (O2) and nitrogen dioxide (NO2). For this reason, ozone levels are not as high in urban areas (where high levels of NO are emitted from vehicles) as in rural areas (as shown in Figure 3.2). As the nitrogen oxides and hydrocarbons are transported out of urban areas, the ozone-destroying NO is oxidised to NO2, which participates in ozone formation.
AEAT/ENV/R/2170 Air Quality and Social Deprivation in the UK Final Report v1.1
netcen 7
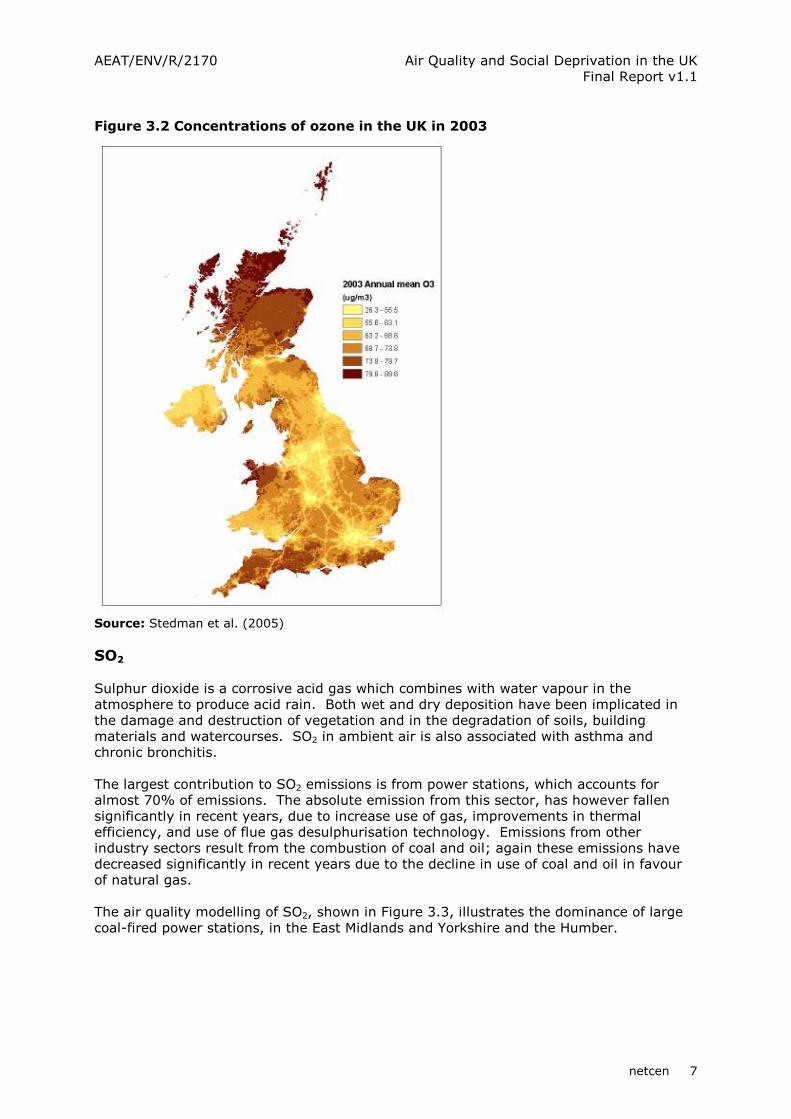
Figure 3.2 Concentrations of ozone in the UK in 2003
Source: Stedman et al. (2005) SO2 Sulphur dioxide is a corrosive acid gas which combines with water vapour in the atmosphere to produce acid rain. Both wet and dry deposition have been implicated in the damage and destruction of vegetation and in the degradation of soils, building materials and watercourses. SO2 in ambient air is also associated with asthma and chronic bronchitis. The largest contribution to SO2 emissions is from power stations, which accounts for almost 70% of emissions. The absolute emission from this sector, has however fallen significantly in recent years, due to increase use of gas, improvements in thermal efficiency, and use of flue gas desulphurisation technology. Emissions from other industry sectors result from the combustion of coal and oil; again these emissions have decreased significantly in recent years due to the decline in use of coal and oil in favour of natural gas. The air quality modelling of SO2, shown in Figure 3.3, illustrates the dominance of large coal-fired power stations, in the East Midlands and Yorkshire and the Humber.
AEAT/ENV/R/2170 Air Quality and Social Deprivation in the UK Final Report v1.1
netcen 8
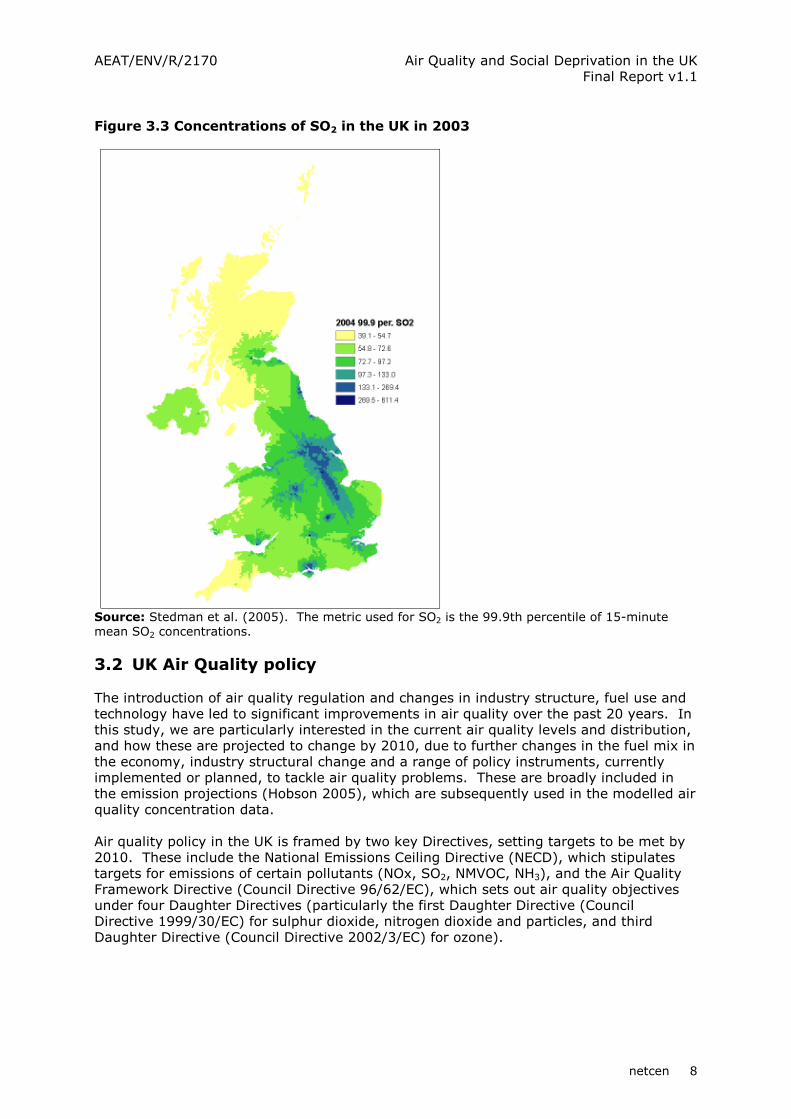
Figure 3.3 Concentrations of SO2 in the UK in 2003
Source: Stedman et al. (2005). The metric used for SO2 is the 99.9th percentile of 15-minute mean SO2 concentrations. 3.2 UK Air Quality policy
The introduction of air quality regulation and changes in industry structure, fuel use and technology have led to significant improvements in air quality over the past 20 years. In this study, we are particularly interested in the current air quality levels and distribution, and how these are projected to change by 2010, due to further changes in the fuel mix in the economy, industry structural change and a range of policy instruments, currently implemented or planned, to tackle air quality problems. These are broadly included in the emission projections (Hobson 2005), which are subsequently used in the modelled air quality concentration data. Air quality policy in the UK is framed by two key Directives, setting targets to be met by 2010. These include the National Emissions Ceiling Directive (NECD), which stipulates targets for emissions of certain pollutants (NOx, SO2, NMVOC, NH3), and the Air Quality Framework Directive (Council Directive 96/62/EC), which sets out air quality objectives under four Daughter Directives (particularly the first Daughter Directive (Council Directive 1999/30/EC) for sulphur dioxide, nitrogen dioxide and particles, and third Daughter Directive (Council Directive 2002/3/EC) for ozone).

AEAT/ENV/R/2170 Air Quality and Social Deprivation in the UK Final Report v1.1
netcen 9
In the UK, The Air Quality Strategy for England, Scotland, Wales and Northern Ireland (January 2000) and Addendum (February 2003) sets standards and objectives for nine main air pollutants which have target dates between 2003 and 2010. These national objectives are similar or tighter than the EU limit and target values under the EU Daughter Directives. At the local level, where potential or actual exceedences of objectives are identified, local authorities have a responsibility through the designation of air quality management areas and implementation of measures to work towards meeting the objectives. The objectives set for air quality pollutants considered in this study are set out in Table 3.1. Note that all of the chosen metrics in this study relate specifically to health impacts. The metric chosen for analysis of ozone concentrations is the annual mean of the daily maximum of running 8-hour mean ozone concentrations, as listed in Table 5.3. This metric is not directly linked to air quality objectives or EU target values but is one of the metrics used to assess the impact of ozone on human health within cost benefit analyses.
Table 3.1 UK Air Quality Objectives
Pollutant Type of limit / objective
Limit value / AQ standard
Averaging period
Achieve by
NO2 AQS (Air Quality Strategy) objective / EU limit value
40 µg m3 Annual 31st December 2005 / 1st January 2010
AQS objective 40 µg m3 Annual 31st December 2004
PM10
EU limit value AQS objective
40 µg m3 / 20 µg m-3 (Scotland 18 µg m-3)*
Annual 1st January 2005 / 1st January 2010*
SO2 AQS objective 266 µg m3 (not to be exceeded more than 35 times a year)
15 minute 31st December 2005
* Indicative limit value (as no current legal basis), except for Scotland, which has annual average of 18ug/m3 to be met in 2010 Given that we focus on industrial point source emissions in section 9 of this report, it is important to describe the policy framework for addressing such emissions. The system of Pollution Prevention and Control under the European Directive (EC/96/61) on integrated pollution prevention and control is replacing that of Integrated Pollution Control (which was established by the Environmental Protection Act 1990) and is taking effect between 2000 and 2007. Different schedules exist in Scotland, Northern Ireland and England / Wales for the transfer to PPC. Under these regulatory frameworks, operators must use Best Available Techniques ("BAT") to control pollution from their industrial activities. The aim of the Best Available Techniques is to prevent, and where that is not practicable, to reduce to acceptable levels, pollution to air, land and water from industrial activities. Depending on the sector and size of operator, the regulator will be the national environmental regulator (e.g. Environment Agency in England and Wales) or the local authorities. In addition to the regulations originating from the IPPC Directive, there are a number of policy measures specifically developed to address specific sources of emissions. These are included in the 2010 projections, and include the following European legislation:
� The large combustion plant Directive (LCPD) � The Solvent Emissions Directive � Sulphur content of liquid fuels regulations, and � European directives on vehicle emissions and fuel quality

AEAT/ENV/R/2170 Air Quality and Social Deprivation in the UK Final Report v1.1
netcen 10
3.3 Distribution of air pollution and community deprivation levels
The analysis in this study is primarily focused on the distribution of air pollution concentrations relative to levels of community deprivation. Prior to undertaking quantitative analysis to explore these distributions, it is possible to draw tentative conclusions from observing the patterns in the images provided in this section. These images illustrate the distributions of these two parameters, and some justification for further investigation of the spatial relationship. For each country, one pollutant has been selected as an illustrative example. However, a brief description of the distribution for the other pollutants is also provided. The deprivation levels have been categorised into deciles, decile 1 being the most deprived 10% of the population and decile 10 being the least deprived. For each country decile 1 has been highlighted with a red outline. The high pollution areas are also outlined in red. We have used the most up-to-date official deprivation datasets, and modelled pollution data for 2003.4 England Figure 3.4 shows a distribution of the most deprived deciles, which tend to be located in the main urban areas of England – Greater London, Birmingham, Merseyside, Greater Manchester, South and West Yorkshire, and the North East. Areas of high NO2 pollutant concentrations (also outlined in red) appear to be in similar locations, driven by road transport sources; this is also the case for PM10. This correlation is not seen for ozone, as the pattern of distribution is the inverse of NO2; higher annual mean concentrations of ozone tend to be found in rural areas. The modelled SO2 pollutant concentration data is driven by emissions from coal-fired power stations, which are primarily located in the regions of Yorkshire and Humber, and East Midlands (see Figure 3.3); therefore, any strong correlation with areas of high deprivation is not so apparent. Scotland Highest NO2 (Figure 3.5) and PM10 concentrations in 2003 are found in the larger urban areas of Scotland - Glasgow and Edinburgh. This also appears to be where the most deprived communities (decile 1) are located, particularly the Glasgow area. As for England, the high concentrations values for these pollutants will be driven by road transport sources. High ozone concentrations (as seen for England) tend to be in rural areas. SO2 concentrations are much lower in Scotland due to fewer point sources. Wales The spatial distribution of PM10 and NO2 relative to deprivation levels, as shown in Figure 3.6, is different from the other countries covered in this analysis. The highest concentrations tend to be in the South Wales urban areas of Newport, Cardiff and Swansea, again where road transport sources are highest. These areas do have communities in decile 1; however, the majority of decile 1 areas are in the once industrialised South Wales valleys, to the north of these large urban areas. The same correlation of high NO2 / PM10 concentrations in the most deprived areas is therefore not observed to the same extent.
4 2004 modelled data is now available but was deemed too late to use for this study.

AEAT/ENV/R/2170 Air Quality and Social Deprivation in the UK Final Report v1.1
netcen 11
Figure 3.4 NO2 concentrations in 2003, and levels of deprivation in England
Data sources: Pollution data from UK Pollution Climate Modelling Project (as described in Stedman 2005). England deprivation data from ODPM (2004)

AEAT/ENV/R/2170 Air Quality and Social Deprivation in the UK Final Report v1.1
netcen 12
Figure 3.5 NO2 concentrations in 2003, and levels of deprivation in Scotland
Data sources: Pollution data from UK Pollution Climate Modelling Project (as described in Stedman 2005). Scotland deprivation data from Scottish Executive (2004)

AEAT/ENV/R/2170 Air Quality and Social Deprivation in the UK Final Report v1.1
netcen 13
Figure 3.6 NO2 concentrations in 2003, and levels of deprivation (from Welsh IMD 2005) in Wales
Data sources: Pollution data from UK Pollution Climate Modelling Project (as described in Stedman 2005). Wales deprivation data from National Assembly for Wales (2005)
AEAT/ENV/R/2170 Air Quality and Social Deprivation in the UK Final Report v1.1
netcen 14
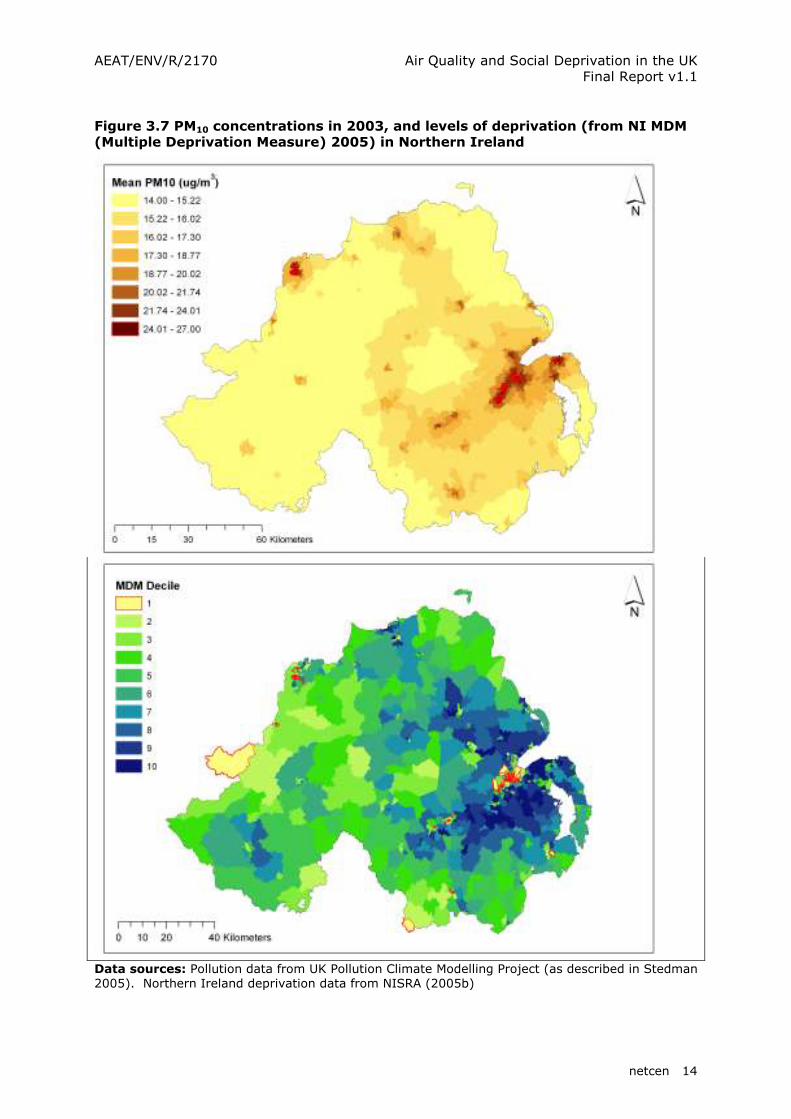
Figure 3.7 PM10 concentrations in 2003, and levels of deprivation (from NI MDM (Multiple Deprivation Measure) 2005) in Northern Ireland
Data sources: Pollution data from UK Pollution Climate Modelling Project (as described in Stedman 2005). Northern Ireland deprivation data from NISRA (2005b)
AEAT/ENV/R/2170 Air Quality and Social Deprivation in the UK Final Report v1.1
netcen 15
Northern Ireland The most deprived areas of Northern Ireland are concentrated in Greater Belfast (Belfast and Lisburn) and Londonderry (see Figure 3.7). These are also the areas where concentrations of NO2, PM10 and SO2 are highest. They key emission source of NOx is road transport; for PM10 the key sources include road transport and domestic burning of solid fuels. The main source of SO2 emissions is also domestic burning of solid fuels. With the introduction of a domestic distribution gas network in Greater Belfast, and renovation of the social housing stock, domestic solid fuel burning is projected to decrease significantly in future years (Pye and Vincent 2003). This qualitative analysis provides a useful indication of the main trends that are likely to emerge from this analysis. From a visual assessment, it is clear that many of the more deprived areas, situated in urban areas, are also subject to the highest levels of air pollution, particularly NO2 and PM10. Annual average ozone concentrations, however, are higher in non-urban areas. Such trends are explored in more detail in this report to understand the extent of these apparent inequalities, and provide the information for policy makers to act if deemed necessary.
AEAT/ENV/R/2170 Air Quality and Social Deprivation in the UK Final Report v1.1
netcen 16

AEAT/ENV/R/2170 Air Quality and Social Deprivation in the UK Final Report v1.1
netcen 17
4 Review of key literature
In the UK, air quality has been the main topic for environmental equity based research in the last 8 years (Mitchell and Walker 2003; Fairburn et al 2005). It is therefore important that this study contributes to existing and current research, and does not simply replicate it. Hence the importance of a literature review, which has been undertaken to help develop the approach for this study, identify key research gaps, and consider the recommendations made in other studies. This is a brief review of the existing research. It focuses on the key research undertaken in the UK in the past five years. A much more detailed review of the literature can be found in Mitchell and Walker (2003), and it is not our intention to reproduce this here. The SDRN (2004) review has also produced a useful review of environmental and social justice issues relating to air quality, and other aspects of environmental quality. This section of the report is structured to reflect that of the report, and is therefore divided into the following areas:5
� Country wide (small area scale) studies � Urban scale studies � Analyses of industrial point sources � Studies considering population characteristics to better understand potential air
quality impacts Country-based (small area scale) studies The key studies that have assessed countrywide air quality distributions relative to levels of community deprivation include Walker et al (2003a-b), Fairburn et al (2005), and Mitchell and Dorling (2003). The Walker et al (2003a-b) study on behalf of the Environment Agency, looked at three key environmental quality indicators, relative to social deprivation – air quality, IPC industries and flood hazard. The analysis of IPC industrial sites is discussed later in this review. As a study for the Environment Agency, the geographical scope of analysis was England and Wales, at a small area scale using ward datasets. The main data used were from the same sources as those used in this study – pollution data from netcen and deprivation data from work undertaken by SDRC at Oxford University – although both datasets used in this analysis have been updated. For the air quality analysis, the study concluded that in England, the most deprived wards tended to experience the highest concentrations. Interestingly, for all pollutants (except SO2), the least deprived wards also experienced above average concentrations. In Wales, the same pattern was found, although the correlation between the least deprived wards and high concentrations was stronger (due to deprivation levels in more urban areas tending to be lower). These patterns were observed for the analysis using mean annual concentrations. Stronger patterns of inequality were observed in England where NAQS objective exceedences or most polluted areas were considered, with the greatest burden on the most deprived communities – and very little on the least deprived.
5 This report includes a section (8) specifically on AQMAs. This is not included in this review as a specific section as such analyses have not been undertaken previously.

AEAT/ENV/R/2170 Air Quality and Social Deprivation in the UK Final Report v1.1
netcen 18
The approach used in Walker et al (2003a) has influenced the development of the approach used in this study. However, there are some key differences between the analyses:
� We consider ozone in the analysis, but not benzene, CO and an air quality index. Walker et al (2003b) do not consider ozone due to the lack of high resolution modelling, and because it is a secondary pollutant ‘not amenable to local level management’. We have included ozone because we consider that there may still be associated equality issues, for which action at the national level could be considered if deemed necessary.
� This analysis uses more up-to-date deprivation data for England and Wales, which is at more detailed resolution e.g. lower Super Output Areas (SOAs) rather than wards or electoral districts.
� This analysis has a wider geographical scope, including Northern Ireland and Scotland (NB. The same study team has undertaken a similar analysis of Scotland – see Fairburn et al 2005).
� This study looks in detail at different measures of deprivation, by assessing individual deprivation domains. Walker et al (2003b) suggests that in further research ‘individual domains within the deprivation index’ could also be considered.
� However, we do not include any explicit analysis of pollution-poverty ‘hotspots’ as undertaken in the Walker study.
A recent study undertaken for SNIFFER6 by the same study team (Fairburn et al 2005) has assessed proximity of communities living at differing levels of deprivation to different factors of environmental quality, one factor being air quality. They essentially use the same analysis approach as that used in the Walker study for England and Wales. They conclude that ‘people living in the most deprived areas are more likely to experience the poorest air quality than those living in less deprived areas.’ This was the case for nitrogen dioxide, benzene, CO and PM10, but not sulphur dioxide. The population living in datazones where air quality exceedances occur tend to be in the more deprived communities. Mitchell and Dorling (2003) undertook a British analysis at a ward scale (which therefore excluded Northern Ireland) to assess two assumptions – that the poor were disproportionately affected by poor air quality (as measured by NO2 concentrations), and that disadvantaged groups bore the costs of pollution generated by those less disadvantaged. They found that more deprived communities suffered above average levels of NO2, and also that the least deprived experienced above average concentrations. Throughout our analysis, we reference the above studies to indicate similarities and differences in the results. Urban scale analysis Two earlier studies sponsored by Defra considered the distribution of community deprivations levels in relation to air quality pollution (NO2 and PM10) levels for specific urban areas. King and Stedman (2000) selected Greater London, Birmingham, Glasgow, Greater Belfast and Port Talbot as areas for research, while Pye et al (2001) looked again at all areas except Glasgow and Port Talbot, and included Cardiff in the analysis. King and Stedman (2000) found some evidence of positive correlation between air quality and deprivation for Greater London, Birmingham, and Greater Belfast, but an inverse relationship in Glasgow and Port Talbot. Pye et al (2001) came to similar conclusions, particularly as their study undertook similar analysis for similar urban areas. Cardiff was
6 SNIFFER is the Scotland and Northern Ireland Forum for Environmental Research (www.sniffer.org.uk)

AEAT/ENV/R/2170 Air Quality and Social Deprivation in the UK Final Report v1.1
netcen 19
a notable exception, with the most deprived wards experiencing lower concentrations than less deprived wards. A study by Mitchell (2005) investigated the distribution of NO2 in Leeds in relation to the deprivation of communities. A strong positive correlation was identified with NO2 – more deprived communities experience higher NO2 pollution. The study demonstrated that options to reduce air pollution tended to lead to a reduction in environmental inequalities. Urban scale analysis has again been undertaken as part of this work, reflecting the importance of different spatial scales of analysis. It should not be assumed that a pattern identified at a national scale would necessarily apply within a regional or urban analysis area (and vice versa). Proximity to large industrial point sources Existing research shows that larger industrial sites , primarily those regulated under IPC, tend to be situated in or located near more deprived areas, specifically studies by FOE (2000, 2001) and Environment Agency (2002). In Walker et al (2003b), a more detailed analysis found that in England, IPC sites were disproportionately located in more deprived wards (although in Wales a less obvious relationship with deprivation was found). They also found that in England more people in deprived communities lived in close proximity (with 1 km) of IPC sites, and that IPC sites tended to be clustered in deprived areas. The analysis also assessed pollution hazard and size of emission, and concluded that these were greater in the sites located near the most deprived communities. Fairburn et al (2005) undertook a similar analysis for Scotland, assessing proximity to IPPC regulated sites. They found that ‘the most deprived are three times more likely to be living near to an IPPC site than the least deprived’ and were found to be ‘disproportionately clustered near to more deprived populations’. Interestingly, sites with highest emissions were not found to be closer to the most deprived communities. A key difference between previous studies and the analysis in this study is that contribution by point sources to air quality experienced by communities is the issue for analysis, rather than proximity of communities to or location of point sources. Walker (2003b) acknowledges that ‘proximity is only a surrogate for impacts’ – it is not clear how well proximity reflects the actual impacts of point source pollution, which will be more dependent on dispersion characteristics (stack height, flue gas velocity, meteorological conditions) and magnitude of emissions. Fairburn et al (2005) acknowledges that their research assesses proximity, using a buffer around industrial sites ‘not as a measure of actual exposure or impact, but as a way of characterising the deprivation profile of people living around the site’. The location of sites relative to communities and community proximity from sites may be important to reflect certain impacts – visual impacts, noise pollution, odour or water quality – which may be affected less by relevant dispersion parameters. However, the actual contribution to air quality concentrations is the more satisfactory way of reflecting the distribution of air quality impacts from large point sources. Assessment of population susceptibility to air pollution impacts This area of research concerns the susceptibility of populations that experience disproportionately higher pollution concentrations. Indicators of susceptibility may be age (with younger children and older adults more prone to air quality impacts) or community health, such as the levels of respiratory illness. Further information on the
AEAT/ENV/R/2170 Air Quality and Social Deprivation in the UK Final Report v1.1
netcen 20
health impacts associated with air quality can be found in reports published by COMEAP7 in the UK and by the EC (under recent CAFE programme).8 Few studies are thought to have addressed this issue, although it is a recommendation from Walker et al (2003b) for additional research. They state that ‘analysis could address target groups based on demographic parameters other than deprivation (e.g. age)’. Mitchell and Dorling (2003) undertook an analysis for Britain, in which they did consider the age of populations in relation to the level of exposure to NO2. In particular, they found that babies, resident in urban areas, tended to experience higher exposure (based on their location of residence), while elderly tended to live further away from the most polluted areas. A greater number of young adults tended to live in urban areas, and therefore in areas with higher NO2 concentrations, whilst older adults with children tended to live in less urban areas, experiencing lower NO2 concentrations. Summary The above review has sought to summarise the key findings of existing research, in order to help shape the approach taken in this study. In doing so, it is hoped that this study will add to understanding of the distribution of air quality impacts on different communities (as characterised by levels of social deprivation). Although there is undoubtedly some replication of analysis with previous research, we believe that this study provides a new set of analyses that will provide additional understanding of this area, in particular:
� A comprehensive UK wide analysis at a small area resolution (including analysis of projected pollution levels – NB Walker et al (2003b) also looked at projected concentrations)
� Development of previous urban scale analysis � Consideration of different indicators of deprivation, and how the use of specific
indicators of deprivation can change the observed trends. � Further development of the distributional impacts of industrial point sources
across different communities, through assessment of modelled contribution to air quality concentrations.
� An examination of the level of deprivation in those areas where specific action is being undertaken to reduce poor air quality – Air Quality Management Areas (AQMAs).
� Consideration of how characteristics of certain populations may compound and / or increase existing inequalities. This is an important area for further research. In this study, we will not only look at age as a separate indicator of susceptibility but try to look at a combination of age and deprivation, to see whether different communities as characterised by level of deprivation not only experience higher pollution levels but may also be more susceptible.
7 COMEAP (Committee on the Medical Effects of Air Pollutants) website - http://www.advisorybodies.doh.gov.uk/comeap/index.htm 8 Health Impact Assessment report under the Clean Air For Europe Programme http://www.europa.eu.int/comm/environment/air/cafe/pdf/cba_methodology_vol2.pdf
AEAT/ENV/R/2170 Air Quality and Social Deprivation in the UK Final Report v1.1
netcen 21
5 Developing an approach for analysis
From the review of the literature, it is clear that many different approaches have been used to assess the links between exposure to air quality concentrations and social deprivation. In particular, the approach in this study draws on the methods used in Walker et al (2003b), and Fairburn et al (2005); description of the observed correlation between air quality and deprivation data values, and the Gini Index of Concentration. Both methods are described in greater detail below. The justification of these methods for the purpose of this analysis is not set out in detail in this report. Further discussion of different methodological approaches is presented in Mitchell and Walker (2003) and Walker et al (2003b). 5.1 Methodology for data analysis
Descriptive statistics A key aim of this analysis is to provide an assessment of the trends concerning communities with differing levels of deprivation, and their exposure to air pollution (based on where they live). This has been done by comparing the mean pollutant concentration of a given geographical area by the deprivation decile to which it belongs. This analysis illustrates the average pollution levels for the most deprived areas (decile 1) to the least deprived areas (decile 10). The variation in average values within each decile is illustrated by the 5th and 95th percentile values. Such analysis provides a simple but effective means of showing overall trends, which can be visually interpreted, and from which tentative conclusions / recommendations can be made. Geographical areas used in this analysis are categorised into deciles based on their deprivation level. Areas are first ranked according to their deprivation score. The most deprived 10% of areas are allocated to decile 1, where their cumulative population is equal (or as close to equal as possible) to 10% of the population. Decile 2 includes the next most deprived 10% of the population. In summary, decile 1 has the greatest concentration of deprived people while decile 10 has the smallest concentration. Fairburn et al (2005) make a useful point concerning definitions of deciles, stating that decile 1 ‘is not the poorest 10% of the population as some of the poorest people will live in pockets within less deprived areas, nor is it the 10% most deprived areas as a population weighting has been applied’. The Gini Concentration Index (CI) For certain areas of analysis, the Gini Concentration Index (CI) has been used to provide a statistical indicator of inequality, by investigating the distribution of a variable with respect to a second variable. For example, in this analysis, CI values have been derived by looking at the distribution of population (and sub-sets of the population) according to levels of deprivation. We can examine whether there are significantly more deprived communities, for example in the areas with the worst air quality, as compared to the population as a whole. To calculate these values, data are plotted as a Lorenz curve (cumulative distribution) - the area between this curve and line of equal distribution (perfect equality) provides the CI value. The larger this area is, the greater the level of inequality (nearer to values of 1 or –1). A curve that closely follows the equal distribution line (nearer a value of zero) reflects greater equality.
AEAT/ENV/R/2170 Air Quality and Social Deprivation in the UK Final Report v1.1
netcen 22
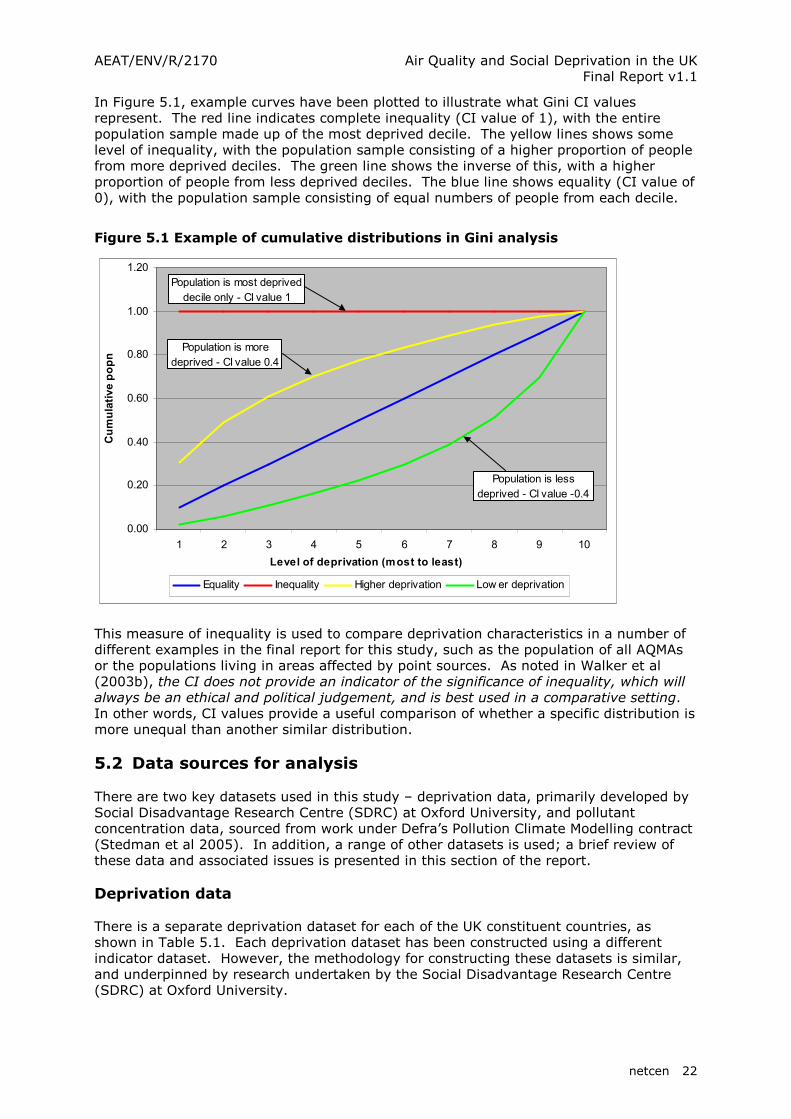
In Figure 5.1, example curves have been plotted to illustrate what Gini CI values represent. The red line indicates complete inequality (CI value of 1), with the entire population sample made up of the most deprived decile. The yellow lines shows some level of inequality, with the population sample consisting of a higher proportion of people from more deprived deciles. The green line shows the inverse of this, with a higher proportion of people from less deprived deciles. The blue line shows equality (CI value of 0), with the population sample consisting of equal numbers of people from each decile.
Figure 5.1 Example of cumulative distributions in Gini analysis
0.00
0.20
0.40
0.60
0.80
1.00
1.20
1 2 3 4 5 6 7 8 9 10
Level of deprivation (most to least)
Cumulative popn
Equality Inequality Higher deprivation Low er deprivation
Population is most deprived
decile only - CI value 1
Population is more
deprived - CI value 0.4
Population is less
deprived - CI value -0.4
This measure of inequality is used to compare deprivation characteristics in a number of different examples in the final report for this study, such as the population of all AQMAs or the populations living in areas affected by point sources. As noted in Walker et al (2003b), the CI does not provide an indicator of the significance of inequality, which will always be an ethical and political judgement, and is best used in a comparative setting. In other words, CI values provide a useful comparison of whether a specific distribution is more unequal than another similar distribution. 5.2 Data sources for analysis
There are two key datasets used in this study – deprivation data, primarily developed by Social Disadvantage Research Centre (SDRC) at Oxford University, and pollutant concentration data, sourced from work under Defra’s Pollution Climate Modelling contract (Stedman et al 2005). In addition, a range of other datasets is used; a brief review of these data and associated issues is presented in this section of the report. Deprivation data There is a separate deprivation dataset for each of the UK constituent countries, as shown in Table 5.1. Each deprivation dataset has been constructed using a different indicator dataset. However, the methodology for constructing these datasets is similar, and underpinned by research undertaken by the Social Disadvantage Research Centre (SDRC) at Oxford University.

AEAT/ENV/R/2170 Air Quality and Social Deprivation in the UK Final Report v1.1
netcen 23
Table 5.1 Deprivation datasets for constituent countries
Country Dataset year
Geography Reference
England 2004 Super Output Area (SOA) lower level
ODPM, Indices of Deprivation (2004)
Wales1 2005 Super Output Area (SOA) lower level
National Assembly for Wales (2005)
Scotland 2004 Datazone Office of the Chief Statistician at the Scottish Executive (2004)
Northern Ireland2
2005 Super Output Area (SOA) lower level
Northern Ireland Statistics and Research Agency (2005b)
1, 2 Both datasets have been updated since Interim report 2, and now use a higher resolution boundary dataset. The deprivation data are at a reasonable high resolution to enable small area analysis, either at a super output area or datazone (in the case of Scotland). Note that the size of such areas is determined by population density, with areas of high population density (urban) being smaller in area than low population density (rural) areas. Each deprivation dataset has an overall measure of deprivation, referred to in this report as the Index of Multiple Deprivation (or IMD). The overall index of multiple deprivation is constructed using a set of domains, which are in turn based on a set of indicators. The domains for each country index are shown below in Table 5.2. Each is weighted according to its importance as an indicator of deprivation. As stated in the indices methodology report for England (ODPM 2004) ‘the weights selected for the domains were supported by the research team’s work, the consultation process and, where available, the wider academic literature. The Income and Employment domains were regarded as the most important contributors to the concept of multiple deprivation and the indicators comprising these domains were very robust. Hence it was decided that they should carry more weight than the other Domains.’ The same process has been undertaken for all of the deprivation datasets used.
Table 5.2 Domains included in country-based deprivation datasets (and associated weightings within the IMD)
Domain type* England Scotland Wales NI
Income ���� 22.5 ���� 29 ���� 25 ���� 25
Employment ���� 22.5 ���� 29 ���� 25 ���� 25
Health ���� 13.5 ���� 14 ���� 15 ���� 15
Education ���� 13.5 ���� 14 ���� 15 ���� 15
Housing ����** ���� 5 ���� 5
Geographic Access ����**
9.3 ���� 9 ���� 10 ���� 10
Crime ���� 9.3 ���� 5
Living Environment ���� 9.3 ���� 5 ����*** 5
* The name of the domain differs between countries – the ‘type’ represents the broad area covered by the domain ** Part of the Access to Housing / Services domain in the England dataset *** Includes housing sub-domain The English IMD includes a domain called ‘living environment’9 and the Welsh index includes a domain called ‘physical environment’.10 Both domains include an air quality indicator, which is problematic for this analysis, as we are assessing the spatial trend between deprivation and air quality; the inclusion of an air quality indicator in the 10 Indicators used in this domain included air quality, air emissions, living within 1 km of a waste disposal site, proportion of people living within 1 km of an Environment Agency regulated industrial source, and proportion of people living in an area with a significant risk of flooding

AEAT/ENV/R/2170 Air Quality and Social Deprivation in the UK Final Report v1.1
netcen 24
domain could lead to potential bias in the results, even though it may account for only a small percentage of the overall IMD. To avoid any potential statistical bias, we have used a revised IMD, in which these domains have been excluded.11 In order to re-create the English index, each domain score rank had an exponential transformation applied (as described in ODPM 2004), with each value re-weighted based on new weightings that compensate for the removed Living Environment domain.12 Such a process was not necessary for revising the Welsh index due to a different index structure. In Annex 2, we have compared a selection of results both using the revised and published English IMD, to determine whether there are any observed differences due to the exclusion of the Living Environment Domain. Only a small difference is observed, indicating the relative weak influence of the air quality indicator on the overall index; however for the integrity of the analysis, it is important to exclude this domain. Pollution data The pollutant concentration data used in this analysis is sourced from Defra’s Pollution Climate Modelling project (Stedman et al 2005). The datasets used are listed in Table 5.3 below.
Table 5.3 Air pollution datasets to be used in the analysis
Pollutant Metric Year NO2 Annual mean background concentrations
Annual mean roadside concentrations Contributions from point sources (as NOx)
2003
PM10* Annual mean background concentrations Annual mean roadside concentrations Contributions from point sources
2003
SO2 The 99.9th percentile of 15-minute mean SO2 concentrations, including contribution from point sources
2003
Ozone Annual mean background concentrations 2003 * PM10 concentration data is reported on the basis of gravimetric rather than TEOM measurement methodologies The concentration data has been formatted to be consistent with the deprivation datasets to enable comparison. There are three types of pollutant concentration data used in this analysis:
� Background concentration data, where an area weighted mean concentration has been calculated from the 1x1 km gridded pollution for each geographical area. A comparison between this methodology and that using population weighted mean values is provided in Annex 2. The area-weighted method was chosen for use in this analysis because both methods have been shown to produce comparable results and the area-weighted method is simpler and quicker to calculate. Both data for the current year (2003) and for the projected year (2010) are used in this analysis. 2010 data is sourced from the work described in Grice et al (2005 draft report).
� Roadside concentration data, where a roadside concentration is calculated by assessing the concentration of each road link in a given boundary area. The calculation is the road link concentration multiplied by the length of link in the
11 Removal of the air quality indicator (as opposed to the whole domain) was not considered due to the unavailability of the base indicator data, and the associated complexities. 12 The Social Disadvantage Research Centre at Oxford University has been consulted regarding the revision of the IMD; they have an agreed position (to that held by ODPM) concerning advice to be issued regarding similar enquiries. Their position is that they do not provide advice regarding the revision of the index, in order to maintain the integrity of the published IMD (based on personal communication with David McLennan (SDRC), March / April 2005).

AEAT/ENV/R/2170 Air Quality and Social Deprivation in the UK Final Report v1.1
netcen 25
area, divided by the total length of road links in the area. This analysis has only been undertaken using PM10 and NO2, as the key road transport pollutants, and for built-up areas in England.
� Point source concentration data, available for industrial point sources, for PM10, NOx and SO2 (based on emissions data from the 2002 NAEI). A description of the methodology for modelling individual point sources is provided in Stedman et al (2005), and is described further in this report in section 9.
5.3 Key issues relating to datasets
Spatial resolution of deprivation and pollution data Although the deprivation data used in this analysis is at a fairly high resolution e.g. super output areas, it is important to recognise that there is still significant variation in deprivation levels within these defined boundary areas. Small pockets of deprivation may not be identified, particularly if surrounding neighbourhoods have low relative levels of deprivation. Similarly, pollution levels vary significantly across a 1 km grid square, particularly if a major road or point source is located in the grid. Such sources would significantly increase the level of pollution across the whole 1x1 km grid cell. The spatial scale of this study – the whole of the UK – means that a balance has to be found between increasing analysis resolution and the resources need to process a significantly larger dataset. In addition, higher resolution data is not available for pollution and deprivation levels for any single country area. Limitations of modelled concentration data The emissions inventory is at a resolution of 1km therefore background concentration data is therefore limited to this resolution. The modelled concentration data is a national assessment based on the national inventory which uses a combination of detailed local information (traffic counts on individual major roads and reported emissions from large point sources) and less specific information (such as emissions factors and surrogate spatial information such as population and employment statistics. Unusual specific local factors may therefore not have been included in the analysis. However the modelled values have been verified by comparison with monitoring data. Confounding factor of population density In previous studies (King and Stedman 2000; Pye et al. 2001), it was recognised that a potential confounding factor of population density might affect the analysis that had been carried out. Population density is used in emissions modelling to map emissions from domestic and some other sectors for which better data sets of geographical distribution are not available. This emissions mapping is used as an input to the background air concentration mapping. Therefore, there may be some overestimation of pollutant concentrations in urban areas where population density is high. However, the significance of this confounding factor is not thought to be unduly high, particularly given recent improvements to spatial emissions mapping, with less reliance on population density. The issue of exposure The underlying assumption throughout this analysis is that the distribution of pollution data provides an indication of population exposure, based on where people live. However, it is recognised that the modelled concentration data is only an indicator of exposure to outdoor air quality concentration. Actual exposure may differ significantly between people who live in the same community, based on a number of factors:
AEAT/ENV/R/2170 Air Quality and Social Deprivation in the UK Final Report v1.1
netcen 26
• Time spent indoors – people who spend more time indoors will experience less exposure to outdoor air quality. Indoor air quality, driven by factors associated with housing quality, will be more important.
• Patterns of daily movement – a resident of a highly polluted area may spend more time in another less polluted area depending on location of job, or other daily activities.
• Workplace environment – another important factor in exposure will be the type of workplace, from offices (with or without air filter systems), to roadside locations, to rural countryside.
Determining exposure is difficult; we are therefore comparing ambient concentration data at places of residence with deprivation, rather than trying to represent population exposure.

AEAT/ENV/R/2170 Air Quality and Social Deprivation in the UK Final Report v1.1
netcen 27
6 UK wide analysis
The focus of this study is to assess the link between communities experiencing different levels of deprivation, and their exposure to air pollution concentrations. The purpose for such an assessment is to understand the level of inequalities, where they exist, and what the appropriate policy response should be. In this section, we focus on assessing this relationship at a country and regional level, to determine whether the evidence of deprived communities suffering higher levels of pollution can be demonstrated, and how this differs by pollutant, country/ region, and measure of deprivation. An important aspect of this analysis is its scope; prior to this, no other study has covered the whole of the UK at a small area resolution (although other research has focused on constituent countries – Scotland (Fairburn 2005), England and Wales (Walker 2003a), England, Scotland and Wales (Mitchell and Dorling 2003)). Variations between countries are important to identify, given the responsibilities of different Devolved Administrations for air quality policy. The following two types of analysis are considered for each country (and for the regions of England):
� The level of multiple deprivation of communities relative to the background concentrations of selected pollutants
� Deprivation levels, as measured by individual domains, of communities relative to background concentrations of selected pollutants
The second analysis, an assessment of the relationship between individual domains and pollutant concentrations, enables a greater understanding of the aspects of deprivation that are most strongly correlated with differing levels of pollutant concentrations. For example, a specific domain may heavily influence the relationship observed in the multiple deprivation analysis, either strengthening or weakening the overall correlation. 6.1 Current distributional trends in levels of deprivation and
pollutant concentrations by country
In this section, we assess the correlation between average background concentrations for each census area, and the corresponding level of deprivation. Two analyses have been undertaken, including:
� A basic trends analysis, where every census area in the UK is compared to average pollutant concentrations in 2003
� An assessment to identify which communities (as classified by deprivation level) experience the worst and best air quality
For all of these analyses, a full set of the detailed results graphs can be found in the accompanying CD (or at www.uksocialdeprivation.aeat.com).
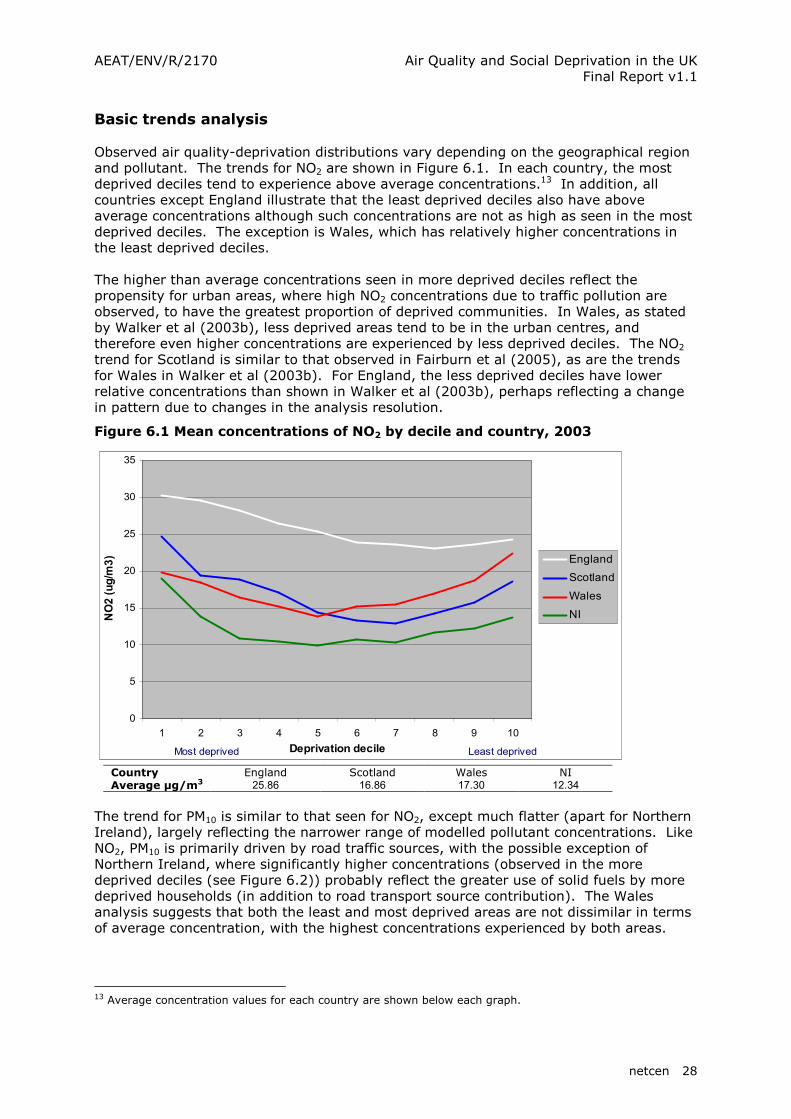
AEAT/ENV/R/2170 Air Quality and Social Deprivation in the UK Final Report v1.1
netcen 28
Basic trends analysis Observed air quality-deprivation distributions vary depending on the geographical region and pollutant. The trends for NO2 are shown in Figure 6.1. In each country, the most deprived deciles tend to experience above average concentrations.13 In addition, all countries except England illustrate that the least deprived deciles also have above average concentrations although such concentrations are not as high as seen in the most deprived deciles. The exception is Wales, which has relatively higher concentrations in the least deprived deciles. The higher than average concentrations seen in more deprived deciles reflect the propensity for urban areas, where high NO2 concentrations due to traffic pollution are observed, to have the greatest proportion of deprived communities. In Wales, as stated by Walker et al (2003b), less deprived areas tend to be in the urban centres, and therefore even higher concentrations are experienced by less deprived deciles. The NO2 trend for Scotland is similar to that observed in Fairburn et al (2005), as are the trends for Wales in Walker et al (2003b). For England, the less deprived deciles have lower relative concentrations than shown in Walker et al (2003b), perhaps reflecting a change in pattern due to changes in the analysis resolution.
Figure 6.1 Mean concentrations of NO2 by decile and country, 2003
0
5
10
15
20
25
30
35
1 2 3 4 5 6 7 8 9 10
Deprivation decile
NO2 (ug/m
3) England
Scotland
Wales
NI
Most deprived Least deprived
Country England Scotland Wales NI Average µg/m3 25.86 16.86 17.30 12.34
The trend for PM10 is similar to that seen for NO2, except much flatter (apart for Northern Ireland), largely reflecting the narrower range of modelled pollutant concentrations. Like NO2, PM10 is primarily driven by road traffic sources, with the possible exception of Northern Ireland, where significantly higher concentrations (observed in the more deprived deciles (see Figure 6.2)) probably reflect the greater use of solid fuels by more deprived households (in addition to road transport source contribution). The Wales analysis suggests that both the least and most deprived areas are not dissimilar in terms of average concentration, with the highest concentrations experienced by both areas.
13 Average concentration values for each country are shown below each graph.
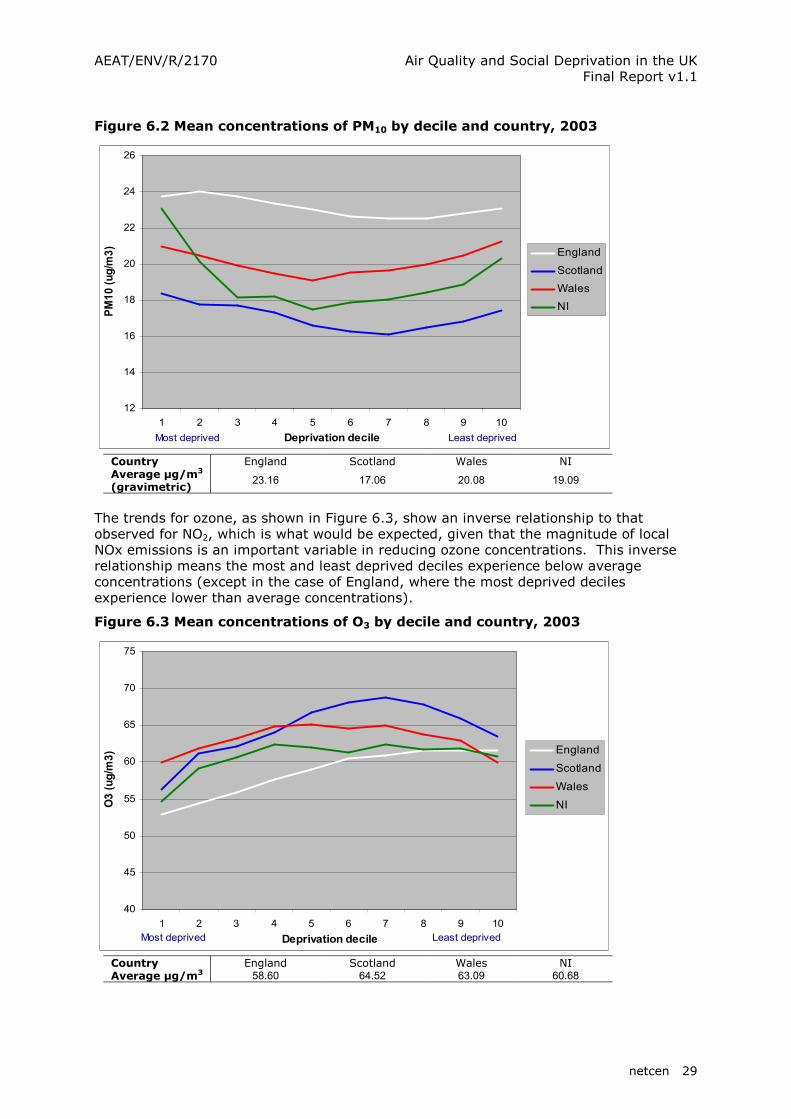
AEAT/ENV/R/2170 Air Quality and Social Deprivation in the UK Final Report v1.1
netcen 29
Figure 6.2 Mean concentrations of PM10 by decile and country, 2003
12
14
16
18
20
22
24
26
1 2 3 4 5 6 7 8 9 10
Deprivation decile
PM10 (ug/m
3)
England
Scotland
Wales
NI
Most deprived Least deprived
Country England Scotland Wales NI Average µg/m3 (gravimetric)
23.16 17.06 20.08 19.09
The trends for ozone, as shown in Figure 6.3, show an inverse relationship to that observed for NO2, which is what would be expected, given that the magnitude of local NOx emissions is an important variable in reducing ozone concentrations. This inverse relationship means the most and least deprived deciles experience below average concentrations (except in the case of England, where the most deprived deciles experience lower than average concentrations).
Figure 6.3 Mean concentrations of O3 by decile and country, 2003
40
45
50
55
60
65
70
75
1 2 3 4 5 6 7 8 9 10
Deprivation decile
O3 (ug/m
3) England
Scotland
Wales
NI
Most deprived Least deprived
Country England Scotland Wales NI Average µg/m3 58.60 64.52 63.09 60.68
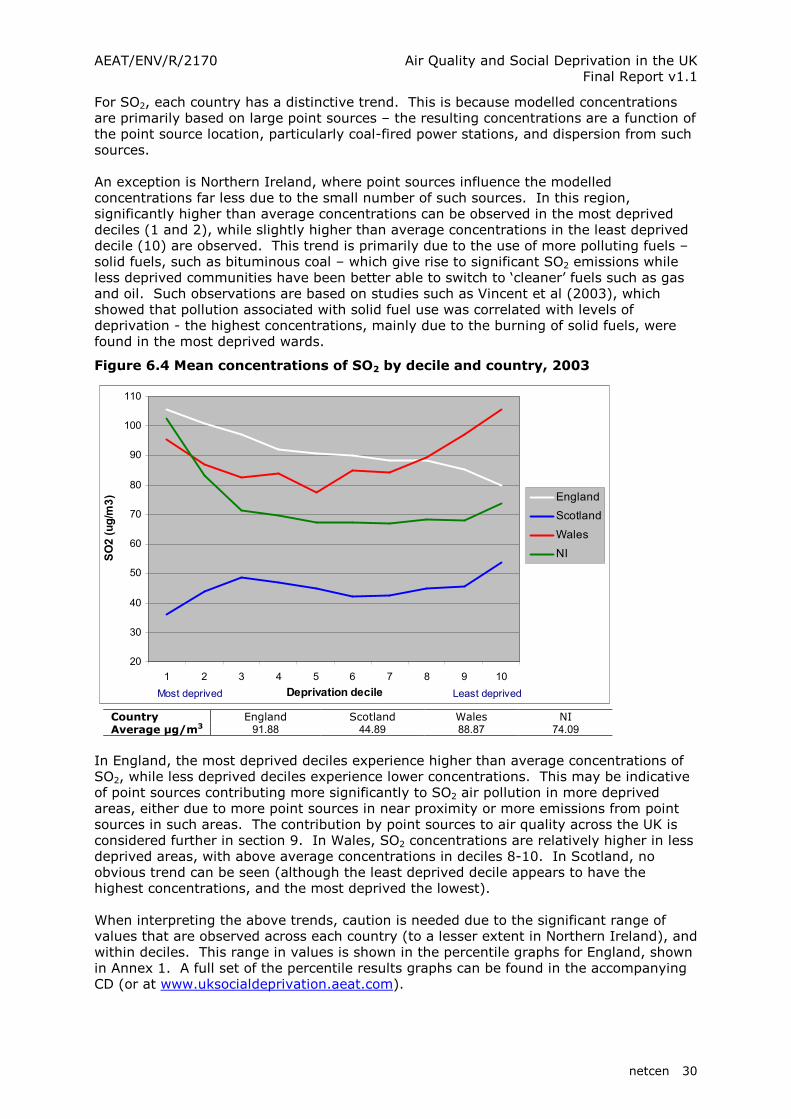
AEAT/ENV/R/2170 Air Quality and Social Deprivation in the UK Final Report v1.1
netcen 30
For SO2, each country has a distinctive trend. This is because modelled concentrations are primarily based on large point sources – the resulting concentrations are a function of the point source location, particularly coal-fired power stations, and dispersion from such sources. An exception is Northern Ireland, where point sources influence the modelled concentrations far less due to the small number of such sources. In this region, significantly higher than average concentrations can be observed in the most deprived deciles (1 and 2), while slightly higher than average concentrations in the least deprived decile (10) are observed. This trend is primarily due to the use of more polluting fuels – solid fuels, such as bituminous coal – which give rise to significant SO2 emissions while less deprived communities have been better able to switch to ‘cleaner’ fuels such as gas and oil. Such observations are based on studies such as Vincent et al (2003), which showed that pollution associated with solid fuel use was correlated with levels of deprivation - the highest concentrations, mainly due to the burning of solid fuels, were found in the most deprived wards.
Figure 6.4 Mean concentrations of SO2 by decile and country, 2003
20
30
40
50
60
70
80
90
100
110
1 2 3 4 5 6 7 8 9 10
Deprivation decile
SO2 (ug/m
3) England
Scotland
Wales
NI
Most deprived Least deprived
Country England Scotland Wales NI Average µg/m3 91.88 44.89 88.87 74.09
In England, the most deprived deciles experience higher than average concentrations of SO2, while less deprived deciles experience lower concentrations. This may be indicative of point sources contributing more significantly to SO2 air pollution in more deprived areas, either due to more point sources in near proximity or more emissions from point sources in such areas. The contribution by point sources to air quality across the UK is considered further in section 9. In Wales, SO2 concentrations are relatively higher in less deprived areas, with above average concentrations in deciles 8-10. In Scotland, no obvious trend can be seen (although the least deprived decile appears to have the highest concentrations, and the most deprived the lowest). When interpreting the above trends, caution is needed due to the significant range of values that are observed across each country (to a lesser extent in Northern Ireland), and within deciles. This range in values is shown in the percentile graphs for England, shown in Annex 1. A full set of the percentile results graphs can be found in the accompanying CD (or at www.uksocialdeprivation.aeat.com).
AEAT/ENV/R/2170 Air Quality and Social Deprivation in the UK Final Report v1.1
netcen 31
Distribution of lowest and highest pollutant concentrations The above graphs provide an average of all pollutant concentrations experienced by all census areas within each decile. Another way to consider inequalities is to assess the proportion of the population in each decile exposed to the best and worst air quality e.g. the highest and lowest 10% of area mean concentration values. This illustrates the distributions of high / low values at either end of the spectrum; in other words, which decile groups are experiencing the best or worst air quality. Such information could be important for policy makers or local authorities considering targeted action in high pollution areas e.g. declaration of AQMAs. Our approach was to rank census areas by their average pollution level; the top and bottom 10% of areas were selected, and analysed on the basis of the deprivation decile that they belonged to. The data are presented in terms of the percentage of the overall decile population in areas of highest / lowest air pollution (see box below for further description). Concentration Index (CI) values are also presented.14 A percentage figure of 15% for decile 1 in the ‘high 10% pollution’ analysis indicates that 15% of the total decile 1 population for a given country is in areas of high pollution. In addition, these data also reflect the percentage of the sampled population (i.e. those in the most polluted areas) in each decile. To illustrate this using the above example, 15% of the population in areas of high pollution is classified as decile 1. The data can be described in both ways due to the equal size populations in every decile and because the top 10% of concentration has been chosen.15 The data for England are presented in Table 6.1. Where a percentage is greater than 15%, it has been highlighted in bold. For NO2 and PM10, approximately 60% of the sampled population is from the most deprived deciles. In addition, for the three most deprived deciles, an average 20% of the population will reside in the 10% most polluted areas. These areas of high NO2 / PM10 pollution-deprivation tend to be concentrated in parts of Greater London, Birmingham, South Yorkshire and towns along the M1 corridor. For SO2, the trend for NO2 / PM10 can also be seen although is much less pronounced, while for O3, less deprived deciles tend to have more people exposed to the highest concentrations. In terms of the lowest 10% of pollutant concentrations, it tends to be the middle decile groups that experience a higher percentage for the pollutants NO2, PM10 and SO2, with lower percentages for the most and least deprived areas. The lowest 10% O3 values, however, tend to be experienced by populations in the most deprived deciles. Our analysis covering the most polluted deciles only illustrates much higher levels of inequality, particularly for PM10 and NO2, a conclusion also made by Walker et al (2003b). The most deprived communities are disproportionately located in areas with the highest air pollution levels.
14 The CI value, based on Gini analysis, is a measure of inequality. In this context, ‘equality’ would exist if each decile grouping had the same proportion of people exposed to the highest concentrations i.e. 10% of the population in each decile. An index value of 1 would represent complete inequality, where the highest concentrations are only experienced by a single decile group. Negative CI values illustrate a situation where the less deprived deciles have a greater proportion of people experiencing higher pollutant concentrations e.g. often in the case of ozone. 15 In the previous report (Interim report 2), geographical boundary areas used for Northern Ireland (wards) and Wales (electoral divisions) had unequal populations. However, this analysis uses output areas for these countries, due to the use of an updated deprivation index, resulting in consistent population totals for each area.

AEAT/ENV/R/2170 Air Quality and Social Deprivation in the UK Final Report v1.1
netcen 32
Table 6.1 % Decile population in England experiencing highest 10% of pollutant concentrations by decile, and Concentration Index value
Decile NO2 PM10 O3 SO2
1 18.8 20.3 0.8 13.2 2 21.3 22.7 2.0 12.6 3 16.7 17.2 4.2 12.2 4 11.8 11.4 9.1 10.8 5 9.6 9.0 14.0 10.3 6 6.0 6.3 16.3 10.5 7 6.0 4.7 16.6 9.4 8 3.9 3.5 16.0 9.3 9 3.4 3.4 14.2 7.4 10 2.8 2.0 9.5 4.2
CI value 0.353 0.389 -0.243 0.136 Average
µg/m3* 40.6/40.9 27.4/27.8 70.9 207/190
* Average values for high concentration areas for decile 10 / decile 1 In Scotland, a similar pattern is seen, although there are some small differences. For NO2 and PM10, only decile 1 (the most deprived) experiences significantly more of the highest concentrations. The percentage values are significantly higher than those in deciles 2 or 3. These areas are predominantly concentrated in the city of Glasgow. For SO2, decile 1 has by far the lowest percentage of population experiencing high concentration values. Again, for the lowest 10% concentrations, a similar pattern to that observed for England emerges, although in terms of O3, only decile 1 experiences a large percentage of the lowest concentrations.
Table 6.2 % Decile population in Scotland experiencing highest 10% of pollutant concentrations, and Concentration Index value
Decile NO2 PM10 O3 SO2
1 32.1 24.4 0.4 2.4 2 9.8 13.3 1.6 9.8 3 11.6 12.3 3.4 11.2 4 9.6 12.8 8.1 10.4 5 5.8 6.4 14.0 12.6 6 6.7 5.9 18.5 9.5 7 6.4 6.3 18.6 9.4 8 7.0 6.4 13.6 12.1 9 8.7 8.0 10.2 10.3 10 8.0 7.0 5.1 11.7
CI value 0.243 0.236 -0.203 -0.072 Average
µg/m3* 30.2/33.9 20/20.4 79.6/82.5 117/125
* Average values for high concentration areas for decile 10 / decile 1 The Wales-based analysis reflects the trend observed in the earlier country-based analysis, where the least deprived deciles experience the higher concentrations for NO2, PM10 and SO2. The most deprived areas also experience higher than average percentage values.

AEAT/ENV/R/2170 Air Quality and Social Deprivation in the UK Final Report v1.1
netcen 33
Table 6.3 % Decile population in Wales experiencing highest 10% of pollutant concentrations, and Concentration Index value
Decile NO2 PM10 O3 SO2
1 10.6 15.0 2.4 11.9 2 10.0 11.1 10.5 7.4 3 7.2 7.7 14.1 6.9 4 6.4 9.2 17.2 7.3 5 5.2 5.2 11.3 4.7 6 9.9 10.1 13.6 8.1 7 4.4 3.9 17.7 7.0 8 7.7 7.4 7.8 10.2 9 6.7 9.9 5.9 19.0 10 29.7 18.6 3.9 17.4
CI value -0.153 -0.012 0.043 -0.151 Average
µg/m3* 30.2/30.7 23.6/23.9 75.8/76.5 177/181
* Average values for high concentration areas for decile 10 / decile 1 Of particular interest in the Northern Ireland analysis is the very high percentage of the population in the most deprived decile that experiences the worst air quality. For decile 1, almost 40% of the population experience the highest 10% of NO2, while for PM10 and SO2 concentrations the percentage is higher. The level of inequality, as measured by the CI value, is particularly strong for SO2 and PM10 (NO2 has a lower value due to the higher percentage values for deciles 8 and 9). In addition to high levels of pollution associated with transport in built-up areas, the most deprived decile probably experience greater levels of pollution due to the use of coal-based fuels, rather than oil or gas, for residential heating. Areas of high pollution-deprivation tend to be located in Belfast and Londonderry. Analysis assessing deprivation levels of those areas experiencing the lowest 10% average pollutant concentrations does not show any obvious trends. As would be expected, over 60% of decile 1 population resides in areas classified in the lowest 10% of pollutant concentrations for ozone.
Table 6.4 % Decile population in NI experiencing highest 10% of pollutant concentrations, and Concentration Index value
Decile NO2 PM10 O3 SO2
1 39.0 46.3 2.8 64.9 2 13.7 12.3 4.6 13.9 3 7.1 3.7 7.1 2.3 4 3.0 7.7 19.4 5.2 5 6.9 3.7 11.4 1.9 6 8.0 5.3 15.0 0.0 7 4.6 7.3 18.6 5.3 8 6.2 1.2 10.8 0.0 9 3.1 3.6 8.7 1.4 10 3.4 10.2 1.3 0.8
CI value 0.413 0.391 -0.035 0.706 Average
µg/m3* 21.9/25.7 25.3/25.2 67.8/70.4 105/113
* Average values for high concentration areas for decile 10 / decile 1 A full set of graphs for this analysis can be found in the accompanying electronic graph output at www.uksocialdeprivation.aeat.com or on attached CD (if report hardcopy).
AEAT/ENV/R/2170 Air Quality and Social Deprivation in the UK Final Report v1.1
netcen 34
6.2 Analysis of change in distributional inequalities between 2003
and 2010
In deciding whether additional action is required to reduce current inequalities, as highlighted in the preceding analyses, it is important to assess whether these inequalities persist in future years, or decrease on the basis of current policies. In this section, we assess the projected change in distributions in 2010 based on the implementation of planned policies (as included in the UK air emission projections (Hobson 2005)). As with any projections of future events or conditions, these projections are uncertain; therefore, this analysis needs to be considered in the context of this uncertainty. Due to a lack of any other information, we make the assumption that the relative levels of deprivation between communities will remain. This may be unrealistic given Government commitments to reducing levels of deprivation – see the Government’s strategy on Neighbourhood Renewal (SEU 2001) for more information. Only the pollution data differs in this analysis, with projected data from Grice et al (2005) used. For 2010, ozone data are not available and therefore not used in this analysis. Two types of analysis were undertaken to assess change across the different deciles. In the first, the overall reduction in average concentrations between 2003 and 2010 for each decile was assessed. This differs from our previous approach of assessing the percentage change between years. In Figure 6.5, the percentage reduction by decile and country is shown for each pollutant. For NO2, the largest reductions are found where concentration levels were highest in 2003. These reductions are in the low and high deciles (as opposed to the mid-deciles) for Scotland, Wales and Northern Ireland. In England, absolute reductions are similar across all deciles – although slightly higher in the most deprived deciles. The trends appear to indicate that policies introduced before 2010 are reducing the inequalities in terms of those experienced by different deciles. However, the difference in reduction between deciles is small e.g. the difference in change between decile 1 and 4 in Scotland is only 1 ug/m3; therefore, the trends observed in 2010 suggest the persistence of inequalities observed in 2003. The 2010 mean pollutant by decile graphs can be found in the accompanying CD (or at www.uksocialdeprivation.aeat.com). For PM10, the only variability observed between deciles in terms of concentration reductions is for Northern Ireland, where higher than average reductions are seen in deciles 1, 2 (most deprived), and 10 (least deprived). Such reductions lead to an apparent reduction in inequalities in 2010 (i.e. a flatter trend line of average concentrations across deciles). These reductions are probably driven by the phase out of solid fuel burning in the residential sector. This is also reflected by the SO2 reduction trend, showing significant reductions in deciles 1 and 2.
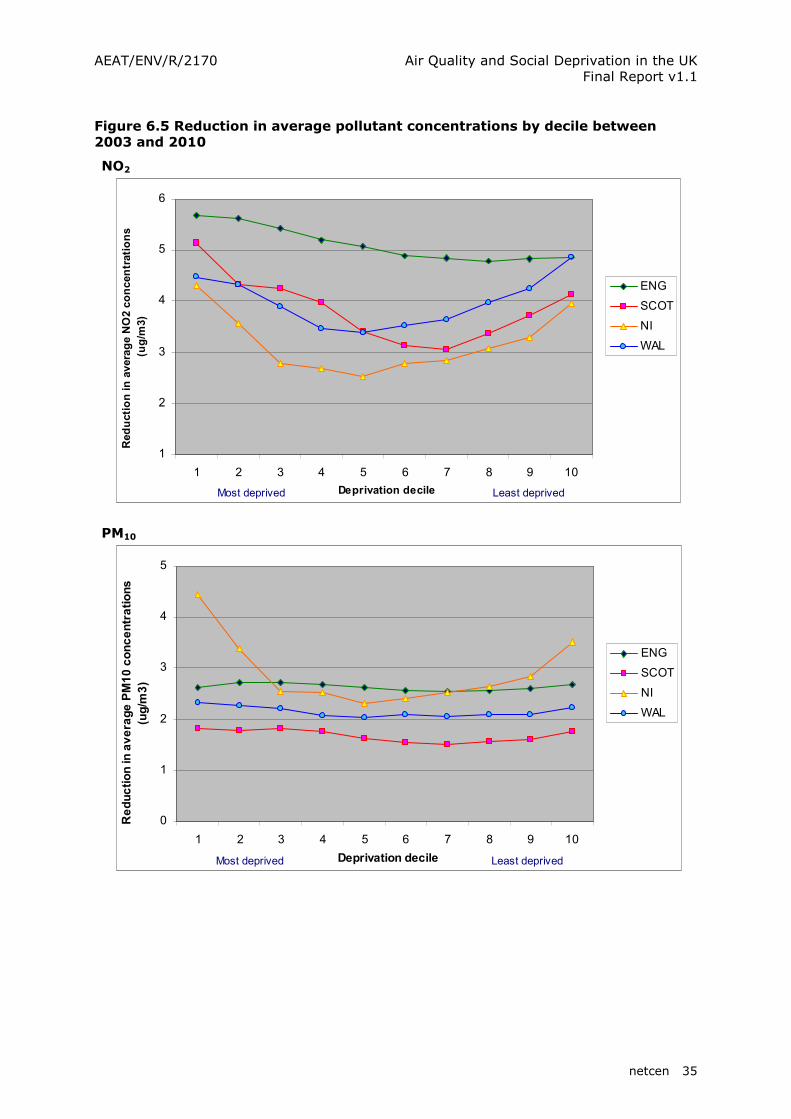
AEAT/ENV/R/2170 Air Quality and Social Deprivation in the UK Final Report v1.1
netcen 35
Figure 6.5 Reduction in average pollutant concentrations by decile between 2003 and 2010
NO2
1
2
3
4
5
6
1 2 3 4 5 6 7 8 9 10
Deprivation decile
Reduction in average NO2 concentrations
(ug/m
3)
ENG
SCOT
NI
WAL
Most deprived Least deprived
PM10
0
1
2
3
4
5
1 2 3 4 5 6 7 8 9 10
Deprivation decile
Reduction in average PM10 concentrations
(ug/m
3)
ENG
SCOT
NI
WAL
Most deprived Least deprived
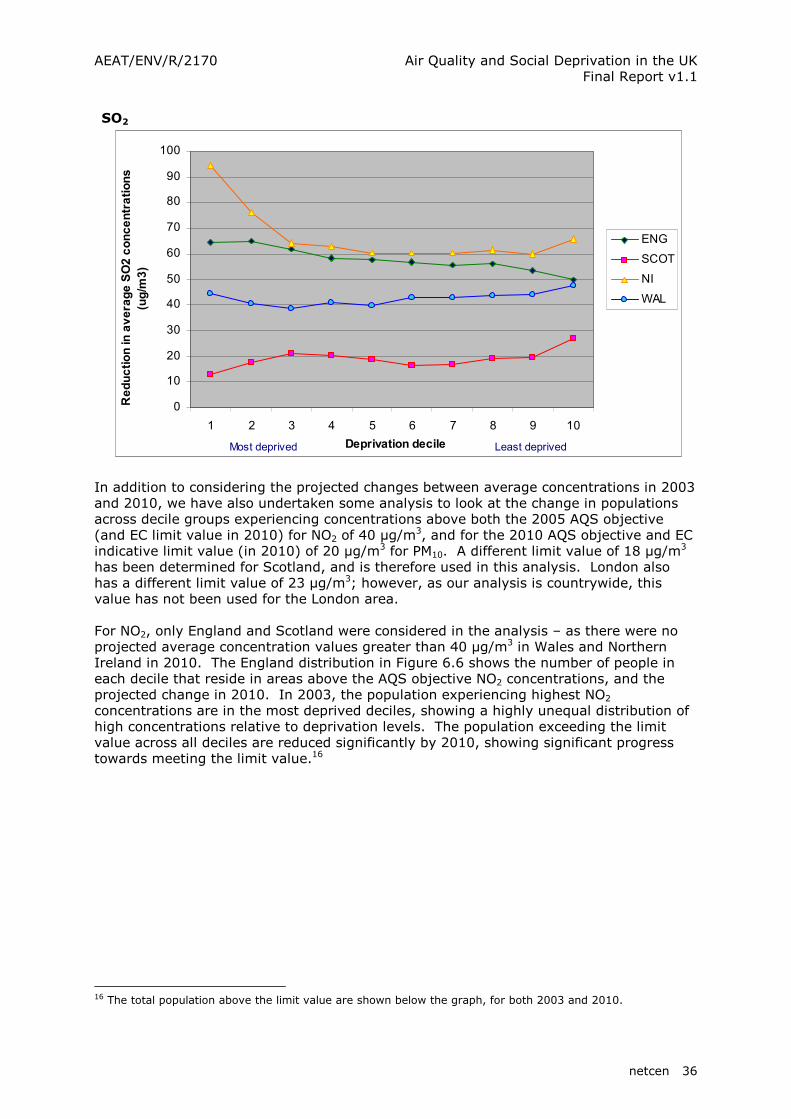
AEAT/ENV/R/2170 Air Quality and Social Deprivation in the UK Final Report v1.1
netcen 36
SO2
0
10
20
30
40
50
60
70
80
90
100
1 2 3 4 5 6 7 8 9 10
Deprivation decile
Reduction in average SO2 concentrations
(ug/m
3)
ENG
SCOT
NI
WAL
Most deprived Least deprived
In addition to considering the projected changes between average concentrations in 2003 and 2010, we have also undertaken some analysis to look at the change in populations across decile groups experiencing concentrations above both the 2005 AQS objective (and EC limit value in 2010) for NO2 of 40 µg/m
3, and for the 2010 AQS objective and EC indicative limit value (in 2010) of 20 µg/m3 for PM10. A different limit value of 18 µg/m
3 has been determined for Scotland, and is therefore used in this analysis. London also has a different limit value of 23 µg/m3; however, as our analysis is countrywide, this value has not been used for the London area. For NO2, only England and Scotland were considered in the analysis – as there were no projected average concentration values greater than 40 µg/m3 in Wales and Northern Ireland in 2010. The England distribution in Figure 6.6 shows the number of people in each decile that reside in areas above the AQS objective NO2 concentrations, and the projected change in 2010. In 2003, the population experiencing highest NO2 concentrations are in the most deprived deciles, showing a highly unequal distribution of high concentrations relative to deprivation levels. The population exceeding the limit value across all deciles are reduced significantly by 2010, showing significant progress towards meeting the limit value.16
16 The total population above the limit value are shown below the graph, for both 2003 and 2010.

AEAT/ENV/R/2170 Air Quality and Social Deprivation in the UK Final Report v1.1
netcen 37
Figure 6.6 English decile populations in areas with average NO2 concentrations >40 µg/m3 in 2003 and 2010
0
100
200
300
400
500
600
1 2 3 4 5 6 7 8 9 10
Deprivation decile
No of people (thousands) in areas > 40 ug/m
3
NO2
2003
2010
Most deprived Least deprived
Population in sample: - 2,165,219 in 2003 and 342,872 in 2010
Figure 6.7 shows the representation of the ‘over 40 µg/m3’ population’ by decile. The data suggest that although there have been significant reductions in population numbers in exceedance areas by 2010, the pattern of inequality still exists (with CI values of 0.301 in 2010 compared to 0.382 in 2003); most deprived communities account for the highest populations experiencing annual pollutant exceedances. This is probably because concentrations in 2003 were highest in the most deprived areas, and have not yet been reduced below the target value, despite the introduction of policy measures.
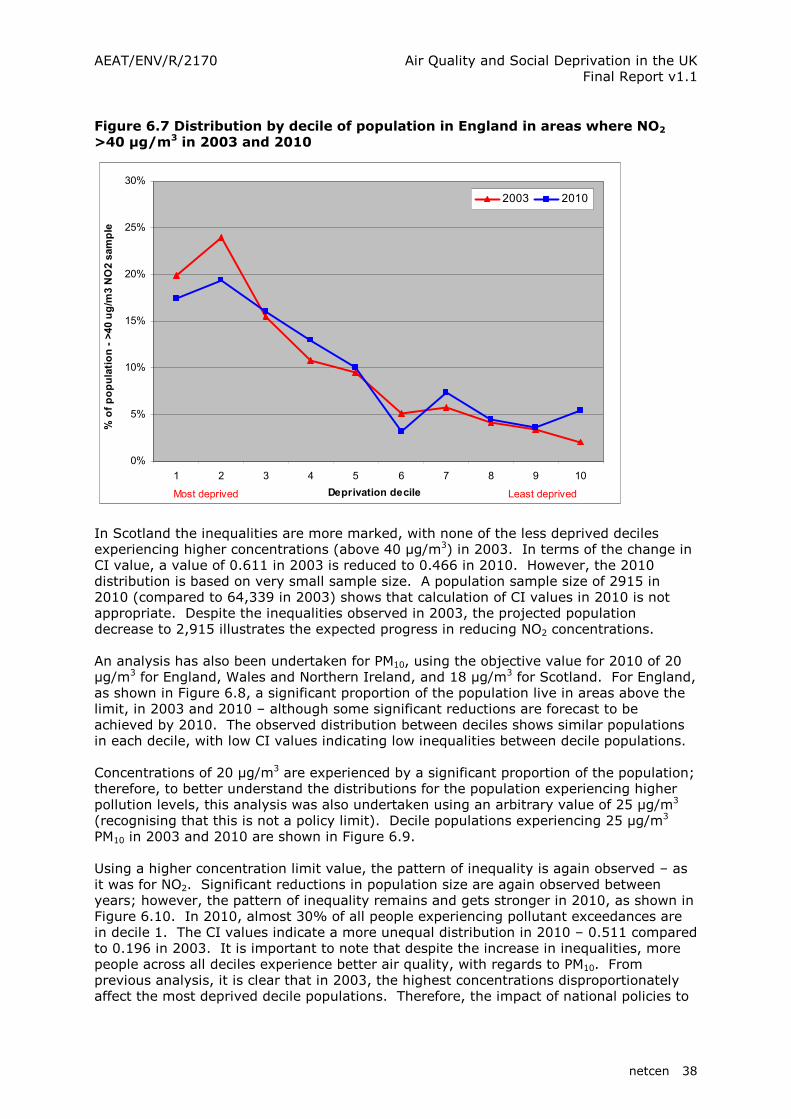
AEAT/ENV/R/2170 Air Quality and Social Deprivation in the UK Final Report v1.1
netcen 38
Figure 6.7 Distribution by decile of population in England in areas where NO2 >40 µg/m3 in 2003 and 2010
0%
5%
10%
15%
20%
25%
30%
1 2 3 4 5 6 7 8 9 10
Deprivation decile
% of population - >40 ug/m
3 NO2 sample
2003 2010
Most deprived Least deprived
In Scotland the inequalities are more marked, with none of the less deprived deciles experiencing higher concentrations (above 40 µg/m3) in 2003. In terms of the change in CI value, a value of 0.611 in 2003 is reduced to 0.466 in 2010. However, the 2010 distribution is based on very small sample size. A population sample size of 2915 in 2010 (compared to 64,339 in 2003) shows that calculation of CI values in 2010 is not appropriate. Despite the inequalities observed in 2003, the projected population decrease to 2,915 illustrates the expected progress in reducing NO2 concentrations. An analysis has also been undertaken for PM10, using the objective value for 2010 of 20 µg/m3 for England, Wales and Northern Ireland, and 18 µg/m3 for Scotland. For England, as shown in Figure 6.8, a significant proportion of the population live in areas above the limit, in 2003 and 2010 – although some significant reductions are forecast to be achieved by 2010. The observed distribution between deciles shows similar populations in each decile, with low CI values indicating low inequalities between decile populations. Concentrations of 20 µg/m3 are experienced by a significant proportion of the population; therefore, to better understand the distributions for the population experiencing higher pollution levels, this analysis was also undertaken using an arbitrary value of 25 µg/m3 (recognising that this is not a policy limit). Decile populations experiencing 25 µg/m3 PM10 in 2003 and 2010 are shown in Figure 6.9. Using a higher concentration limit value, the pattern of inequality is again observed – as it was for NO2. Significant reductions in population size are again observed between years; however, the pattern of inequality remains and gets stronger in 2010, as shown in Figure 6.10. In 2010, almost 30% of all people experiencing pollutant exceedances are in decile 1. The CI values indicate a more unequal distribution in 2010 – 0.511 compared to 0.196 in 2003. It is important to note that despite the increase in inequalities, more people across all deciles experience better air quality, with regards to PM10. From previous analysis, it is clear that in 2003, the highest concentrations disproportionately affect the most deprived decile populations. Therefore, the impact of national policies to
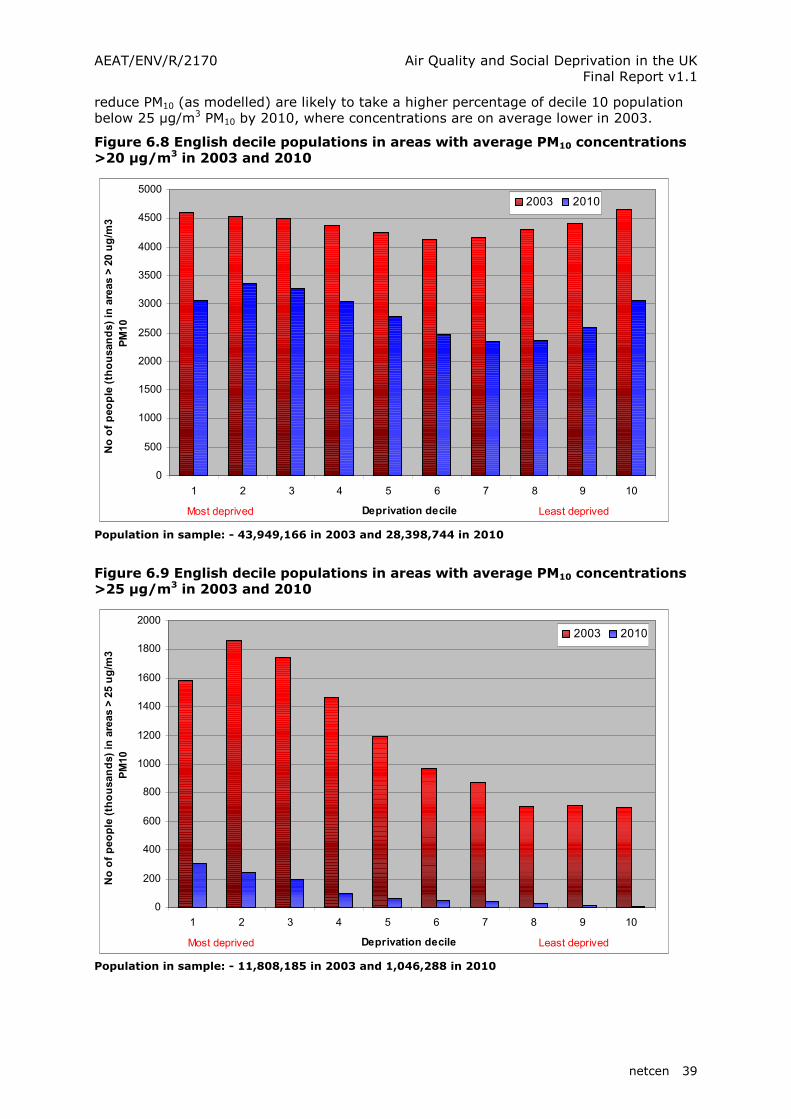
AEAT/ENV/R/2170 Air Quality and Social Deprivation in the UK Final Report v1.1
netcen 39
reduce PM10 (as modelled) are likely to take a higher percentage of decile 10 population below 25 µg/m3 PM10 by 2010, where concentrations are on average lower in 2003.
Figure 6.8 English decile populations in areas with average PM10 concentrations >20 µg/m3 in 2003 and 2010
0
500
1000
1500
2000
2500
3000
3500
4000
4500
5000
1 2 3 4 5 6 7 8 9 10
Deprivation decile
No of people (thousands) in areas > 20 ug/m
3
PM10
2003 2010
Most deprived Least deprived
Population in sample: - 43,949,166 in 2003 and 28,398,744 in 2010
Figure 6.9 English decile populations in areas with average PM10 concentrations >25 µg/m3 in 2003 and 2010
0
200
400
600
800
1000
1200
1400
1600
1800
2000
1 2 3 4 5 6 7 8 9 10
Deprivation decile
No of people (thousands) in areas > 25 ug/m
3
PM10
2003 2010
Most deprived Least deprived
Population in sample: - 11,808,185 in 2003 and 1,046,288 in 2010

AEAT/ENV/R/2170 Air Quality and Social Deprivation in the UK Final Report v1.1
netcen 40
Figure 6.10 Distribution by decile of population in England in areas where PM10 >25 µg/m3 in 2003 and 2010
0.0%
5.0%
10.0%
15.0%
20.0%
25.0%
30.0%
35.0%
1 2 3 4 5 6 7 8 9 10
Deprivation decile
% of population - >25 ug/m
3 PM10 sample
2003 2010
Most deprived Least deprived
This particular issue is reflected in the analysis for Scotland. In Figure 6.11, in 2003, the highest exceedance population can be seen in decile 1. By 2010, policies have reduced the affected population significantly. However, the highest concentrations in decile 1 in 2003 may have been reduced considerably – by the same percentage – but because they were very high initially, they remain above 18 µg/m3 PM10. The inequality of the distribution is much higher in 2010 due to the remaining high percentage in decile 1, as shown in Figure 6.12.
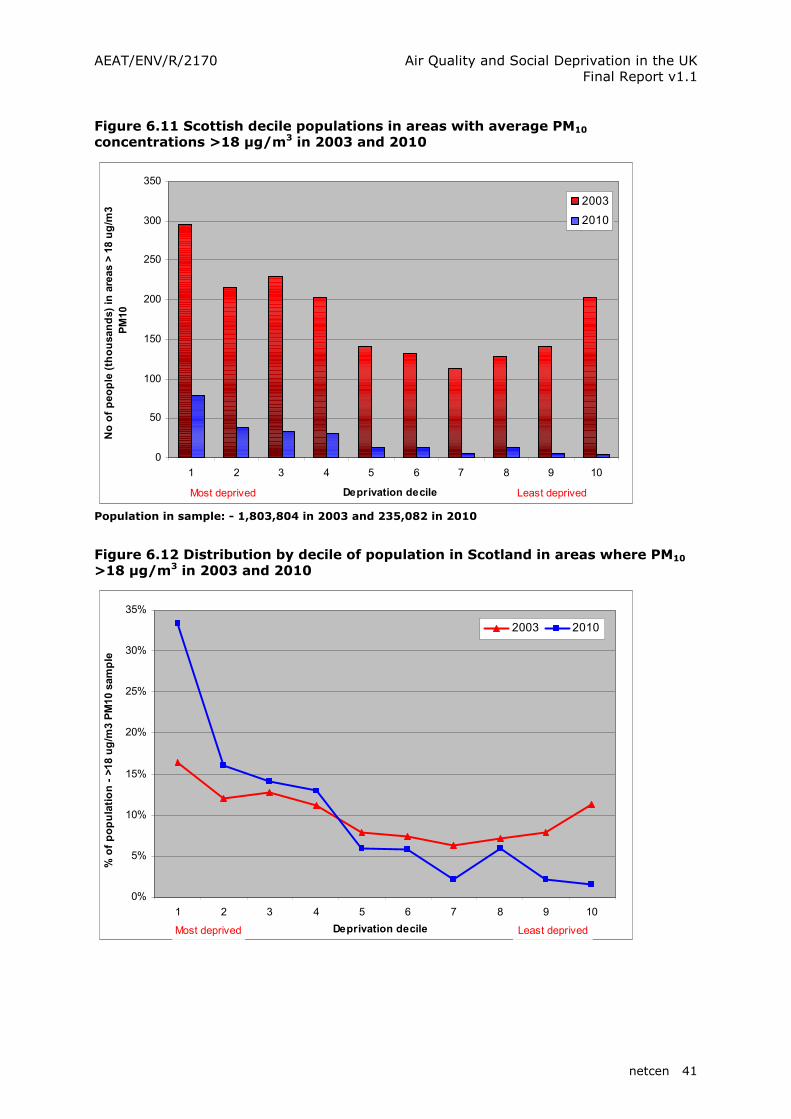
AEAT/ENV/R/2170 Air Quality and Social Deprivation in the UK Final Report v1.1
netcen 41
Figure 6.11 Scottish decile populations in areas with average PM10 concentrations >18 µg/m3 in 2003 and 2010
0
50
100
150
200
250
300
350
1 2 3 4 5 6 7 8 9 10
Deprivation decile
No of people (thousands) in areas > 18 ug/m
3
PM10
2003
2010
Most deprived Least deprived
Population in sample: - 1,803,804 in 2003 and 235,082 in 2010
Figure 6.12 Distribution by decile of population in Scotland in areas where PM10 >18 µg/m3 in 2003 and 2010
0%
5%
10%
15%
20%
25%
30%
35%
1 2 3 4 5 6 7 8 9 10
Deprivation decile
% of population - >18 ug/m
3 PM10 sample
2003 2010
Most deprived Least deprived

AEAT/ENV/R/2170 Air Quality and Social Deprivation in the UK Final Report v1.1
netcen 42
For Wales, a different trend can be observed to that seen for England and Scotland, with high population values for the most and least deprived decile groups in 2003 and 2010 (based on the population in areas above 20 µg/m3 PM10).
Figure 6.13 Welsh decile populations in areas with average PM10 concentrations >20 µg/m3 in 2003 and 2010
0
50
100
150
200
250
1 2 3 4 5 6 7 8 9 10
Deprivation decile
No of people (thousands) in areas >20 ug/m
3 PM10 2003 2010
Most deprived Least deprived
Population in sample: - 1,524,055 in 2003 and 393,076 in 2010
The Northern Ireland trend in 2003 illustrates that a large number of people in deciles 1 and 2, and 10 experience the highest PM10 concentrations. These population numbers are significantly reduced by 2010, as shown in Figure 6.14. However, due to the very high concentrations in decile 1 in 2003, by 2010 some of these areas still have concentrations greater than 20 µg/m3 PM10. Therefore, inequalities appear significant in 2010, with decile 1 accounting for over 60% of the population experiencing such concentrations (see Figure 6.15).

AEAT/ENV/R/2170 Air Quality and Social Deprivation in the UK Final Report v1.1
netcen 43
Figure 6.14 Northern Ireland decile populations in areas with average PM10 concentrations >20 µg/m3 in 2003 and 2010
0
20
40
60
80
100
120
140
160
1 2 3 4 5 6 7 8 9 10
Deprivation decile
No of people (thousands) in areas >20 ug/m
3 PM10 2003
2010
Most deprived Least deprived
Population in sample: - 607,190 in 2003 and 45,790 in 2010
Figure 6.15 Distribution by decile of population in Northern Ireland in areas where PM10 >20 µg/m
3 in 2003 and 2010
0%
10%
20%
30%
40%
50%
60%
70%
1 2 3 4 5 6 7 8 9 10
Deprivation decile
% of population - >20 ug/m
3 PM10 sample
2003 2010
Most deprived Least deprived

AEAT/ENV/R/2170 Air Quality and Social Deprivation in the UK Final Report v1.1
netcen 44
6.3 Regional variation in trends
In addition to the UK analysis, deprivation and air quality distributions were considered at a regional level for England, to determine whether there were distinct regional variations. If variations were to exist, regional (as opposed to national) based strategies may be required to address such inequalities. In this analysis, regions were characterised on the basis of Government Office Area (GOA) boundaries.17 The approach to this analysis is the same as that described for the country-based analysis . The analysis graphs, showing average concentrations by decile in each region can be found at the website www.uksocialdeprivation.aeat.com or on attached CD. In general, they illustrate the differences between levels of concentration to which populations are exposed; however, little variation exists between regions in terms of the average concentrations by decile. For NO2, shown in Figure 6.16, there is limited variability in the trends observed between regions as illustrated by the difficulty in differentiating between specific regions. The South West has lower concentrations in the mid-deciles (3-9). London has much higher concentrations across all deciles (as the only entirely urban GOA). The PM10 graph shows similar differences.
Figure 6.16 Regional trends of mean NO2 concentrations by deprivation decile
10
15
20
25
30
35
40
45
1 2 3 4 5 6 7 8 9 10
Deprivation deciles
NO2 concentration (ug/m
3)
England
East Midlands
East of England
London
North East
North West
South East
South West
West Midlands
Yorkshire /
Humber
Most deprived Least deprived
The ozone graph is the inverse of the trends observed for NO2. SO2 is the pollutant for which significant variability can be seen between regions. This variability can be particularly seen in terms of levels of concentration (low in south west; high in Yorkshire and the Humber) and type of trend (higher or lower in different deciles). This variability is to be expected, given that concentration levels are driven by the contribution from
17 Government Office Regions have been the primary classification for the presentation of regional statistics since 1996, and provide a useful boundary subset of the constituent country level for England (NB. Scotland, Wales and Northern Ireland are not subdivided into GORs). There are currently 9 GORs which are built up based on counties / unitary authorities (ONS website http://www.statistics.gov.uk/geography/gor.asp).
AEAT/ENV/R/2170 Air Quality and Social Deprivation in the UK Final Report v1.1
netcen 45
large point sources; clearly regions will experience different levels of concentration depending on the location of large point sources, particularly coal-fired power stations. In summary, these regional trends do not provide any additional insight into whether regional strategies should differ from those at the national level due to the limited variation between regions in most cases. Regional strategies would be more likely determined by localised pockets of deprivation within a region, where any subsequent action might focus. 6.4 Domains of deprivation and pollutant concentrations by
country
Most studies that have been undertaken relating to air quality and deprivation have used a measure of overall deprivation, made up of a range of deprivation indicators. In this study we have used an Index of multiple deprivation, which combines many indicators of deprivation (known as domains) into a single value of deprivation. This analysis assesses these individual domains, and looks at what differences there might be in environmental inequalities if we were to choose to define deprivation on the basis of health or income, rather than as a combination of such indicators of deprivation. In addition, it is interesting to assess the impact of specific domains on the results observed in section 6.1, and try and determine what deprivation domains are the key drivers of the trends observed. For each country in this analysis, the following domains have been selected:
� Income, as a close proxy of the overall index. In each IMD, the income domain has the highest weighting score attributed (as does the employment domain).
� Health, as a medium weighted domain, and an interesting indicator in the context of air quality based analyses.
� Housing, as a low weighted domain. For England, the domain is a joint access to services / housing domain
Broadly, the domains (in each country index) all use the same types of indicators, with the exception being the Barriers to housing and services domain in the England index, which combines indicators on access to services with those measuring housing deprivation. At a detailed level, differences do exist between the domains as reflected in an example comparing the indicators used in the health domain, shown in Table 6.5. These differences between domains have meant that all analysis has been country-specific, with no direct comparison between different country data.

AEAT/ENV/R/2170 Air Quality and Social Deprivation in the UK Final Report v1.1
netcen 46
Table 6.5 A comparison of the indicators used in the health domain across the four indexes
Country Health domain indicators England Health deprivation and disability –
� Years of Potential Life Lost � Comparative Illness and Disability Ratio � Measures of emergency admissions to hospitals � Measure of adults under 60 suffering from mood or anxiety
disorders Scotland Health deprivation –
� Comparative Mortality Factor � Hospital episodes related to alcohol use � Hospital episodes related to drug use � Comparative Illness Factor � Emergency admissions to hospital � Proportion of population being prescribed drugs for anxiety or
depression or psychosis � Proportion of live singleton births of low birth weight
Wales Health deprivation and disability – � Age and sex Standardised Mortality Ratios (SMR) for people under
65 � People receiving Attendance Allowance or Disability Living
Allowance � People (aged 16-59) receiving Incapacity Benefit or Severe
Disablement Allowance � Age and sex standardised ratio of limiting long-term illness � Proportion of births of low birth-weight (<2,500g)
NI Health deprivation and disability – � Standardised Mortality Ratios (SMR) for men and women at ages
under 75 � People receiving one or more of Attendance Allowance or Disability
Living Allowance or Incapacity Benefit or Severe Disablement Allowance
� People registered as having cancer � Proportion of all 12 to 17 year olds with extractions and registered
with a GDS (General Dentist Service) dentist, and those not registered with a GDS dentist
� Drugs prescribed for depression or anxiety Figure 6.17 illustrates the type of analysis that has been undertaken, where a comparison has been made between the average values for each domain and the overall IMD. Selected analysis graphs can be found in Annex 1 of this report, while all results graphs can be found at the website www.uksocialdeprivation.aeat.com or on attached CD (if report hardcopy). Across all countries, the income domain tends to be the most closely correlated with the IMD-based trend (as represented by the black trend line in the graphs). This is what would be expected, given that the income domain is one of the most important domains, weighted most heavily in the overall index. Similar conclusions can be drawn for the employment domain, as the other most heavily weighted domain (although it is not included explicitly in this analysis).

AEAT/ENV/R/2170 Air Quality and Social Deprivation in the UK Final Report v1.1
netcen 47
Figure 6.17 Trends analysis for England – mean annual NO2 concentrations vs. domain deprivation deciles
20
22
24
26
28
30
32
1 2 3 4 5 6 7 8 9 10
Deprivation Deciles
NO2 concentration (ug/m
3)
HOU Mean
HEA Mean
INC Mean
IMD Mean
Most deprived Least deprived
Observations from this analysis on a country-by-country basis are summarised below. England The health and income domain trends show little variation from the overall IMD trend for all pollutants. This implies that the income and health domain classify broadly similar communities as deprived as the overall IMD. The housing / access to services domain, however, varies noticeably from the IMD trend. For NO2, the housing / access domain trend is a weaker negative correlation (see Figure 6.17) while for ozone the trend is flat rather than positively correlated. For SO2, the trend is positively rather than negatively correlated e.g. the most deprived deciles have the lowest concentrations. Such differences reflect the impact of the access to services indicators, which look at distance to services. More rural or suburban areas (where income deprivation tends to be lower) will score less well in terms of access to services, with fewer services in a given area due to lower population densities. This demonstrates how different measures of deprivation can influence trends analysis based on the use of the IMD. However, as this domain does not have a large weighting in the domain, its influence on the IMD is small. Scotland All domains follow the same trend as observed for the analysis where the overall index of deprivation is used. The correlation between the trends is very close although for SO2, while the trends are generally the same, there is more variability. Interestingly, for NO2 and PM10, the least deprived deciles have slightly lower average concentrations where deprivation is measured by individual domains rather than the overall index (as shown in the Wales example in Figure 6.18).

AEAT/ENV/R/2170 Air Quality and Social Deprivation in the UK Final Report v1.1
netcen 48
Wales In this analysis, the health and income domains follow the IMD trend in general, although reflect slightly higher concentrations in the more deprived deciles for NO2 and PM10, and lower concentrations in the less deprived deciles (see Figure 6.18). The lower concentrations in the less deprived deciles were also observed in the Scottish analysis. The inverse of this trend can be observed for ozone. This slight variation of domain trends from the IMD trends again the impact of combining different domain, and if deprivation was measured solely using one domain, a slightly different trend could emerge. If the IMD was based solely on health, income and housing domains, the IMD trend for Wales would probably be closer to that observed in the other analysis countries e.g. weak negative correlation.
Figure 6.18 Trends analysis for Wales – annual mean PM10 concentrations vs. domain deprivation deciles
16
17
18
19
20
21
22
23
1 2 3 4 5 6 7 8 9 10
Deprivation Deciles
PM10 concentration (ug/m
3)
HOU Mean
HEA Mean
INC Mean
IMD Mean
Most deprived Least deprived
Northern Ireland Health, income and living environment (which includes housing as well as outdoor environment) domains follow the IMD trend for all pollutants, with minimal variation. This contrasts markedly with the housing domain in the old index (as used in Interim report 2), which showed a much flatter trend than the overall IMD.

AEAT/ENV/R/2170 Air Quality and Social Deprivation in the UK Final Report v1.1
netcen 49
6.5 Country-based analysis summary
The key findings for the analyses described in this section are summarised below. Current distributional trends in levels of deprivation and pollutant concentrations by country (Section 6.1)
� Inequalities in air quality concentration distributions are apparent from the above analysis. Pollutant concentrations of NO2 tend to be relatively higher in more deprived areas in all countries except Wales, where concentrations are relatively higher in the least deprived areas. In Northern Ireland and Scotland, the least deprived deciles also experience above average concentrations, while in Wales, the most deprived deciles also experience above average concentrations.
� For PM10, a similar trend to that observed for NO2 can be seen although the trend
tends to be much flatter. The exception is Northern Ireland, where much higher concentrations can be observed in the most deprived deciles, perhaps reflecting the use of solid fuels in such areas. In Wales, both the most and least deprived deciles experience the highest average concentrations.
� The trend for ozone is the inverse of that observed for NO2, with relatively lower
concentrations experienced by the most deprived deciles (except for Wales).
� Greatest variability between country trends is reflected in the SO2 analysis, which is driven by the location of large point sources. The exception is Northern Ireland, where the most prominent source is the residential combustion of solid fuels. In England, Northern Ireland, and Wales, the SO2 trend is similar to that observed for NO2. The Scotland trend, however, is different, with no obvious trend.
� The analysis of areas defined as worst and best air quality suggest that in many
cases the most deprived communities experience the worst air quality for NO2, PM10 and SO2. The exception is Wales, where the least deprived deciles accounts for the greatest proportion of areas with high pollution levels (although the most deprived deciles (1 and 2) also have relatively high proportions).
� The observed inequalities (as measured by CI values) are much greater than for
the preceding analysis, where all areas (not just high/low pollution ones) are included.
Analysis of change in distributional inequalities between 2003 and 2010 (Section 6.2)
� In examining the reductions in NO2 concentrations across deciles between 2003 and 2010, the largest reductions were observed where concentration levels were highest in 2003. This would appear to indicate that policies introduced before 2010 are reducing the inequalities in terms of those experienced by different deciles. However, the difference in reduction between deciles is small, and as a result, inequalities persist.
� For PM10, the only variability observed between deciles in terms of concentration
reductions is for Northern Ireland, where higher than average reductions are seen in deciles 1, 2 (most deprived), and 10 (least deprived), leading to an apparent reduction in inequalities in 2010. These reductions are probably due to the phase out of solid fuel burning in the residential sector. This is also reflected by the SO2 analysis.

AEAT/ENV/R/2170 Air Quality and Social Deprivation in the UK Final Report v1.1
netcen 50
� The assessment of decile populations above given limit values for NO2 and PM10
suggest significant inequalities in England and Scotland in 2003, with larger deprived populations in areas of exceedances. Large reductions in absolute numbers in exceedance areas across all deciles are observed in 2010; however, significant inequalities persist across this significantly smaller 2010 population. Walker et al (2003b) found a similar pattern for England.
Consideration of regional variations in trends (Section 6.3)
� For English regions, little variation in the type of trend observed at the national level is seen. The exception is for the SO2 analysis, where distributions are determined by large point source location. Overall, this analysis suggests that regional strategies to address such inequalities would not differ dramatically from those at the national level due to the limited variation. Regional strategies are more likely to be determined by localised pockets of deprivation within a region where any subsequent action would focus.
Analysis using different domains (indicators) of deprivation (Section 6.4)
� The observed trends in the above analyses are determined by the weighting of different indicators in the IMD. The most weighted indicators tend to be income and employment. The incorporation of other domains, although less weighted in the overall index, can have an impact on the trend. This analysis highlights that trends will vary depending on how deprivation is defined, both in terms of the domains used and weighting given to specific indicators.
AEAT/ENV/R/2170 Air Quality and Social Deprivation in the UK Final Report v1.1
netcen 51
7 Urban analysis
In the previous section of this report, the spatial distribution of pollutant concentrations relative to areas characterised by differing levels of deprivation were considered at the country level. However, we also consider it important to consider the trends within urban areas only, as this is where most of the population lives, where levels of pollution tend to be highest (excluding ozone), and where the potential largest differences in levels of deprivation (between communities) exist. Analysis of specific spatial scales (e.g. country / region / urban) could give rise to different trends, and the strength of observed correlations. Different areas may therefore need distinct strategies for tackling inequalities based on differences in results (although the previous regional analysis, in section 6.3, did not suggest this). This section of the report describes three different analyses:
� Analysis of the spatial distribution and relationship between background pollutant concentrations and levels of multiple deprivation in selected urban areas.
� Analysis of trends based on roadside (as opposed to background) concentrations in built-up areas, to determine whether there are significant differences in trends based on the use of concentration data from road transport sources
� Comparison of urban trends with rural trends, to assess the differences in spatial distribution experienced by different communities on the basis of this land classification.
7.1 Urban pollution and levels of deprivation
Previous urban analyses undertaken in the UK include King and Stedman (2000), Pye et al (2001) and Mitchell (in press). Such analyses have shown similar correlations to those shown in the national scale analysis undertaken in this study. The purpose of undertaking an urban analysis is to look for any variation from national trends e.g. greater levels of inequality or not, and to see whether there are significant variations between different UK cities, in terms of the resulting trends. The following urban areas were selected for analysis – Greater London, Greater Belfast, Glasgow, and Cardiff, as the principal cities in each country, and the urban areas of West Yorkshire, West Midlands, Greater Manchester and Swansea for comparison with Greater London / Cardiff. These areas have been defined using urban agglomerations defined in Bush (2000).18 The approach is the same as that described for the country based analysis, although in this analysis, only PM10 and NO2 have been considered (as the most significant pollutants in UK urban areas). The full set of results for each urban area can be found at the website www.uksocialdeprivation.aeat.com or on the attached CD.
18 The agglomeration zones (areas of urban population > 250,000) dataset is an official dataset used in air quality analysis, based on Defra geographical information system (GIS) data on urban areas for England and Wales, urban localities information in Scotland, and CORINE land cover information within Northern Ireland. Population data sources include Key Statistics for Urban Areas and Output Areas in England and Wales, Office for National Statistics (ONS) 2001, Scottish Executive Settlement Population counts 2001, and Key Statistics for Settlements, Northern Ireland Neighbourhood Information Service (NINIS), 2001. Geographical Extent datasets include Urban Areas and Settlement Boundaries dataset, ONS 2001, Scottish Executive Urban Rural Classification 2003-2004, and Belfast Metropolitan Urban Area (BMUA), NINIS 2001.

AEAT/ENV/R/2170 Air Quality and Social Deprivation in the UK Final Report v1.1
netcen 52
In England, the urban trends for PM10 and NO2 (see Figure 7.1) reflect those observed at the national level, the key difference being that urban average concentration levels are higher. The trends for the selected Scottish and Northern Ireland urban areas also reflect the national trend, although are much flatter. This weaker correlation is probably due to the variation between concentration values being smaller i.e. concentration values will be tend to be higher across all decile groupings in urban areas.
Figure 7.1 A comparison of average concentrations of NO2 by decile group between selected urban areas in England (and the whole of England)
10
15
20
25
30
35
40
45
1 2 3 4 5 6 7 8 9 10
Deprivation decile
NO2 (ug/m
3)
England
G London
G Manchester
W Midlands
W Yorkshire
Most deprived Least deprived
In addition, the urban analyses for England and Scotland show lower relative concentrations for the less deprived areas (compared to the most deprived). This is probably in part due to a larger urban population in the least deprived decile relative to the mid-decile groups, whose average concentration values at a national level would be significantly reduced due to the inclusion of non-urban areas. For a similar reason, the Welsh urban areas trends are flatter, with lower relative concentrations in the least deprived areas – see Figure 7.2 below.
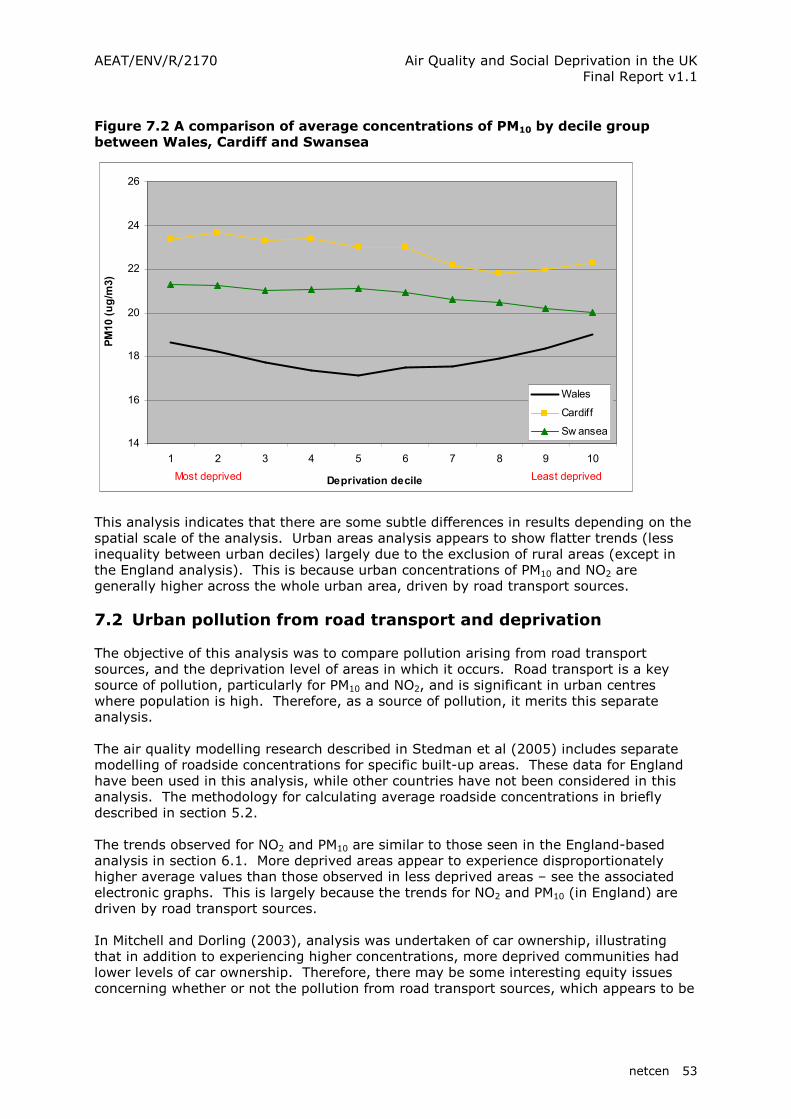
AEAT/ENV/R/2170 Air Quality and Social Deprivation in the UK Final Report v1.1
netcen 53
Figure 7.2 A comparison of average concentrations of PM10 by decile group between Wales, Cardiff and Swansea
14
16
18
20
22
24
26
1 2 3 4 5 6 7 8 9 10
Deprivation decile
PM10 (ug/m
3)
Wales
Cardiff
Sw ansea
Most deprived Least deprived
This analysis indicates that there are some subtle differences in results depending on the spatial scale of the analysis. Urban areas analysis appears to show flatter trends (less inequality between urban deciles) largely due to the exclusion of rural areas (except in the England analysis). This is because urban concentrations of PM10 and NO2 are generally higher across the whole urban area, driven by road transport sources. 7.2 Urban pollution from road transport and deprivation
The objective of this analysis was to compare pollution arising from road transport sources, and the deprivation level of areas in which it occurs. Road transport is a key source of pollution, particularly for PM10 and NO2, and is significant in urban centres where population is high. Therefore, as a source of pollution, it merits this separate analysis. The air quality modelling research described in Stedman et al (2005) includes separate modelling of roadside concentrations for specific built-up areas. These data for England have been used in this analysis, while other countries have not been considered in this analysis. The methodology for calculating average roadside concentrations in briefly described in section 5.2. The trends observed for NO2 and PM10 are similar to those seen in the England-based analysis in section 6.1. More deprived areas appear to experience disproportionately higher average values than those observed in less deprived areas – see the associated electronic graphs. This is largely because the trends for NO2 and PM10 (in England) are driven by road transport sources. In Mitchell and Dorling (2003), analysis was undertaken of car ownership, illustrating that in addition to experiencing higher concentrations, more deprived communities had lower levels of car ownership. Therefore, there may be some interesting equity issues concerning whether or not the pollution from road transport sources, which appears to be

AEAT/ENV/R/2170 Air Quality and Social Deprivation in the UK Final Report v1.1
netcen 54
disproportionately experienced by more deprived communities, is mainly due to the activities of the more wealthy. This analysis does not further develop these issues around who the polluter is, and who is most impacted by such pollution. However, they are mentioned here as an important part of the concept of environmental equity, and an issue that could be of interest to policy makers in considering whether the polluter pays. 7.3 Comparison of country, urban and rural concentration-
deprivation trends
In section 7.1, we have already indicated that the deprivation levels and pollutant concentrations experienced by urban communities are distinct from the type of trend observed at the national level (as described in section 6.1). For rural areas this is also likely to be the case. Prior to any analysis, the assumption might be that rural areas have lower concentrations (with the exception of ozone) and fewer census areas in the more deprived deciles, and therefore a flat trend might be expected. We have undertaken an analysis to assess rural trends in each country, the variation between countries, and how these trends compare to urban and national trends. The analysis is similar to that undertaken in section 6.1 (country-based analysis) except categorises census areas according to whether they have been defined as rural or urban. Table 7.1 provides information on the number of areas and population classified as either urban or rural for each country.
Table 7.1 Rural / urban populations in the UK, and numbers of census areas
Country Source (for definition)
Rural population
Rural areas
Urban population
Urban areas
England ONS 9,789,027 6,338 39,332,904 26,141 Scotland Scottish Executive
(2004b) 1,081,888 1,434 3,976,798 5,066
Wales ONS 1,189,556 768 1,713,562 1,128 NI NISRA (2005) 657,885 328 1,038,720 559 England and Wales urban boundaries were sourced from the urban area and settlement boundary CD National statistics Census 2001. In England, Wales and Northern Ireland, a census area (LSOA) was defined as urban if 20% or more of its area (based on the relevant datasets) was shown to be urban land cover. The Scottish Executive Rural urban classification consists of 6 separate classes – classes 1-4 are considered urban; 5-6 are considered rural. Based on such definitions, a datazone was classified as urban if more than 20% of its area was in a class 1-4 area or rural if more than 20% of its area was in a class 5-6 area. To understand resulting rural and urban trends, it is helpful to consider the split of urban – rural populations across deciles. These splits are shown below in Figure 7.3, and illustrate two key things; firstly, that rural populations are larger in Wales and Northern Ireland and secondly, that rural populations are larger in the mid-deciles, and smallest in the most deprived deciles.
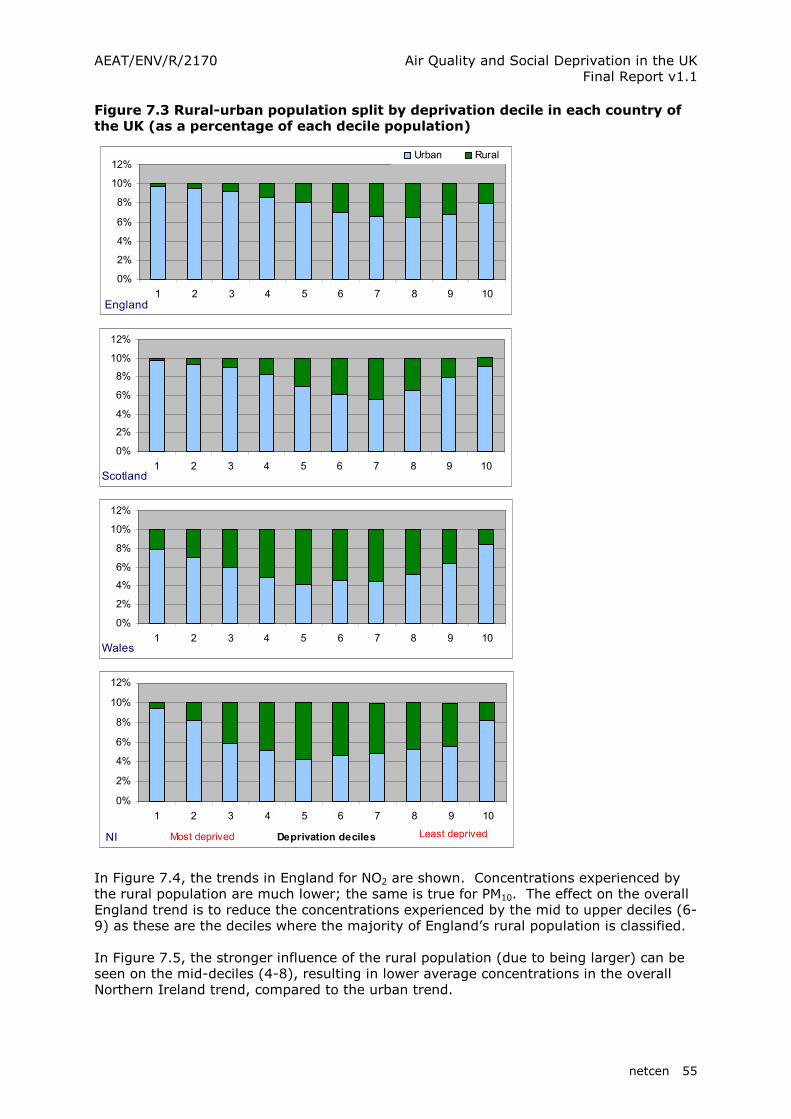
AEAT/ENV/R/2170 Air Quality and Social Deprivation in the UK Final Report v1.1
netcen 55
Figure 7.3 Rural-urban population split by deprivation decile in each country of the UK (as a percentage of each decile population)
0%
2%
4%
6%
8%
10%
12%
1 2 3 4 5 6 7 8 9 10
Urban Rural
0%
2%
4%
6%
8%
10%
12%
1 2 3 4 5 6 7 8 9 10
0%
2%
4%
6%
8%
10%
12%
1 2 3 4 5 6 7 8 9 10
0%
2%
4%
6%
8%
10%
12%
1 2 3 4 5 6 7 8 9 10
Deprivation decilesMost deprived Least deprived
England
Scotland
Wales
NI
In Figure 7.4, the trends in England for NO2 are shown. Concentrations experienced by the rural population are much lower; the same is true for PM10. The effect on the overall England trend is to reduce the concentrations experienced by the mid to upper deciles (6-9) as these are the deciles where the majority of England’s rural population is classified. In Figure 7.5, the stronger influence of the rural population (due to being larger) can be seen on the mid-deciles (4-8), resulting in lower average concentrations in the overall Northern Ireland trend, compared to the urban trend.
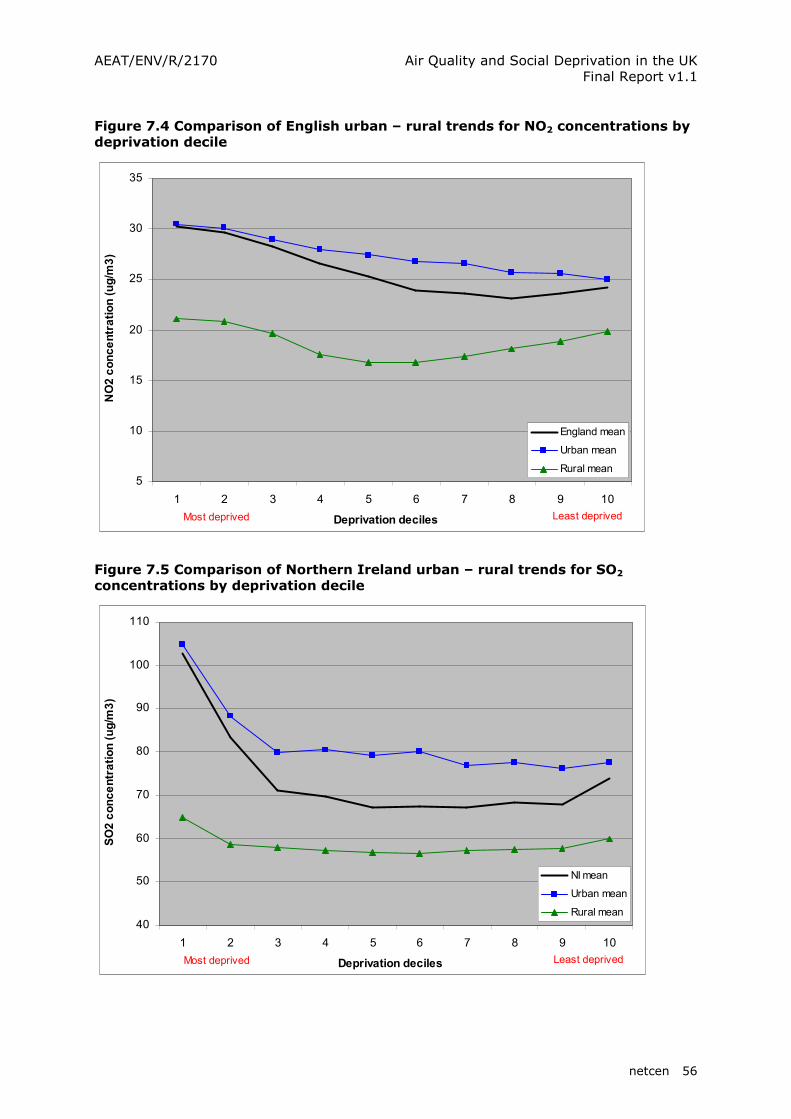
AEAT/ENV/R/2170 Air Quality and Social Deprivation in the UK Final Report v1.1
netcen 56
Figure 7.4 Comparison of English urban – rural trends for NO2 concentrations by deprivation decile
5
10
15
20
25
30
35
1 2 3 4 5 6 7 8 9 10
Deprivation deciles
NO2 concentration (ug/m
3)
England mean
Urban mean
Rural mean
Most deprived Least deprived
Figure 7.5 Comparison of Northern Ireland urban – rural trends for SO2 concentrations by deprivation decile
40
50
60
70
80
90
100
110
1 2 3 4 5 6 7 8 9 10
Deprivation deciles
SO2 concentration (ug/m
3)
NI mean
Urban mean
Rural mean
Most deprived Least deprived

AEAT/ENV/R/2170 Air Quality and Social Deprivation in the UK Final Report v1.1
netcen 57
The key observations from this analysis are summarised below. England For PM10 and NO2, the rural trend has lower average concentrations than urban areas, as would be expected. The significantly smaller rural population means that it’s influence on the overall England trend is limited, reducing some mid-deciles concentrations (as the rural population is largely classified in the mid-deciles - see Figure 7.4). The rural trend itself suggests slightly higher concentrations in the least and most deprived deciles, relative to the mid-deciles. The rural trend for ozone is the inverse of that described for NO2 above. For SO2, the urban trend is the same as that observed for England, while the rural trend is again similar, although suggests higher average concentrations in the most deprived deciles. Scotland The rural trends for NO2 and PM10 are as described for England, although appear to have a larger effect on the overall trend mid-decile concentrations, due to the larger difference between rural and urban concentrations. This influence on the mid-decile concentrations in the overall trend is also seen for ozone and SO2. The rural trend itself for the above pollutants and ozone follows the national trends e.g. for NO2, higher concentrations in the least and most deprived areas, while the urban correlation is much flatter. Wales NO2 and PM10 have fairly flat urban trends e.g. similar concentrations across all deciles, except for decile 10, where concentrations are slightly higher. It appears to be the rural trend that defines the shape of the overall trend. The significantly lower concentrations for the rural mid-deciles compared to the urban deciles results in a ‘U’ shaped curve rather than the flat trend observed for urban areas. Northern Ireland For all pollutants, a similar trend is observed for urban and rural areas, although pollutant concentrations are of course lower in rural areas (except ozone which is higher). The key difference in trends is for deciles 1 and 2, where significantly higher concentrations (or lower concentrations for ozone) are observed, and where the rural population is very small. This has the effect of significantly increasing the average concentrations in the overall trend for the most deprived deciles. These trends are shown Figure 7.5. Selected graphs can be found in Annex 1. A full set of analysis graphs can be seen at www.uksocialdeprivation.aeat.com (or on the CD accompanying this report if in hardcopy). Each graph shows the country average trend, and the equivalent trends for urban and rural areas (as shown in Figure 7.4 above). 7.4 Urban analysis summary
This analysis has proved important for providing a greater understanding of the influence of urban and rural trends on the overall trends described in section 6.1. The key findings are as follows:
� In general, urban trends for PM10 and NO2 are similar to those observed at the national level, except that they are flatter, and in the least deprived deciles, pollutant concentrations are lower (in relative terms). This weaker correlation is probably due to the variation between concentration levels being smaller i.e. concentration values will be tend to be higher across all decile groupings in urban areas, due to high density of pollution sources (in particular road transport). A

AEAT/ENV/R/2170 Air Quality and Social Deprivation in the UK Final Report v1.1
netcen 58
flatter trend is observed because the overall national trend includes rural areas that reduce the concentrations in the mid-less deprived deciles, leading to a stronger correlation. This helps explains the weaker correlations that have been observed in previous studies (such as King and Stedman 2000; Pye et al 2001).
� The size of the rural and urban population and its distribution across the deciles
significantly affects the overall country trend. Rural populations tend to experience lower pollutant concentrations (except in the case of ozone); therefore, if this population is sizeable, it will tend to reduce the average concentrations apparent in the country trend. The deciles in which rural populations are categorised will affect the shape of the trend.
� It appears that the rural trend has a significant impact on the mid-deciles (where
the rural population is highest), lowering the average concentrations seen in the national trend, and as a result, creating a ‘U’ shaped curve rather than a flat trend.
� The trends observed for NO2 and PM10 are similar to those seen in the England-
based analysis in section 6.1, illustrating the importance of road transport sources in determining distributions for these pollutants. More deprived areas appear to experience disproportionately higher average values than those observed in less deprived areas.

AEAT/ENV/R/2170 Air Quality and Social Deprivation in the UK Final Report v1.1
netcen 59
8 Communities in AQMAs
Since 1997, local authorities in the UK have been carrying out a review and assessment of air quality in their area. The aim of the review is to ensure that national air quality objectives will be achieved. If a local authority identifies (through modelling or monitoring) an area where air quality objectives are not likely to be achieved, it must declare an Air Quality Management Area, or AQMA. Once declared, options for meeting stated objectives will need to be considered through action plans. An AQMA may be defined more broadly than the area where exceedances have been identified e.g. a whole local authority area, for reasons of administrative ease or implementation of measures. A recent project (Sturman and King 2005) has developed, for the first time, a GIS dataset of 216 AQMAs in the UK.19 This dataset provides us with the opportunity to explore two issues; firstly, is the population of an AQMA more or less deprived than the national population, and secondly, if populations are more deprived, are AQMAs addressing some of the inequalities observed in earlier analyses described in this report, given that poorer air quality (NO2 and PM10) would be expected in AQMAs. An example of the dataset coverage for England is provided below, in Figure 8.1.
Figure 8.1 AQMA location in selected English urban areas classified by deprivation deciles
Source: Sturman and King (2005)
19 An update of this dataset is currently being compiled which will include new AQMAs, not previously in the University of West England AQMA database, or revisions to existing AQMA boundaries.

AEAT/ENV/R/2170 Air Quality and Social Deprivation in the UK Final Report v1.1
netcen 60
8.1 Objectives and approach to AQMA analysis
This analysis has been undertaken to assess whether AQMA populations are more deprived, and whether these designated areas cover the most deprived deciles. This analysis is important in the context of this study as it considers the potential impact of a policy tool on observed inequalities (described in earlier sections of this report). Our approach has been to identify census areas that are located in or near AQMAs (as defined in Sturman and King 2005), and compare the deprivation profile across these areas to those observed at the country level. Areas located in or near AQMAs have been identified by intersecting the AQMA boundary dataset with the different census area boundaries;20 if intersected, they were included, and their populations grouped by the pollutants for which exceedances had been observed - NO2 or PM10. Based on this data, the distribution of deciles in AQMAs could be observed, and Gini analysis undertaken to determine the equality of the distribution compared to the national sample. There are some important limitations with this analysis that need to be considered when interpreting results. Firstly, the issue of the AQMA dataset being incomplete means that the results of this analysis are provisional, and should be subject to further analysis. Secondly, for some country-pollutant combinations, there are very few census areas that are identified in the analysis sample. Due to the small size of such samples, trends are difficult to determine. A third issue concerns the representation of exceedance areas by AQMAs. Some AQMA boundaries have been drawn up to cover areas of known exceedances but may be extended beyond such areas for reasons of administrative ease. This means that some census areas, identified based on their proximity to AQMAs, may not be subject to any exceedances. 8.2 AQMA analysis results
In this section, the analysis results for each country are presented, showing the number of people located in or near an AQMA21 in each decile graphically, as well as information on sample size. Using Gini-based analysis, CI (Concentration Index) values have also been calculated to indicate relative levels of inequality. Due to the very small sample sizes for Wales and Northern Ireland, results have not been presented. The AQMA boundaries are based on the dataset produced by Sturman and King (2005). England The trend for English AQMAs reflects that seen at the national level, with a larger proportion of the AQMA population in the more deprived deciles (for both NO2 and PM10). There is a particular anomaly in the PM10 sample, where decile 1 shows a much lower population associated with English AQMAs. However, this is probably due to the sample being dominated by specific areas, particularly in London, with fewer decile 1 areas.
20 The 34,378 Lower Layer SOAs in England and Wales (32,482 in England, 1896 in Wales) were generated by a computer programme which merged OAs taking into account measures of population size, mutual proximity and social homogeneity. The boundaries were released to the public in February 2004. The data zone geography covers the whole of Scotland and nests within local authority boundaries. Data zones are groups of Census output areas which have populations of between 500 and 1,000 household residents, and some effort has been made to respect physical boundaries. In addition, they have compact shape and contain households with similar social characteristics. 21 People are defined as being ‘in or near an AQMA’ if the boundary of the area in which they live is crossed by an AQMA area boundary.
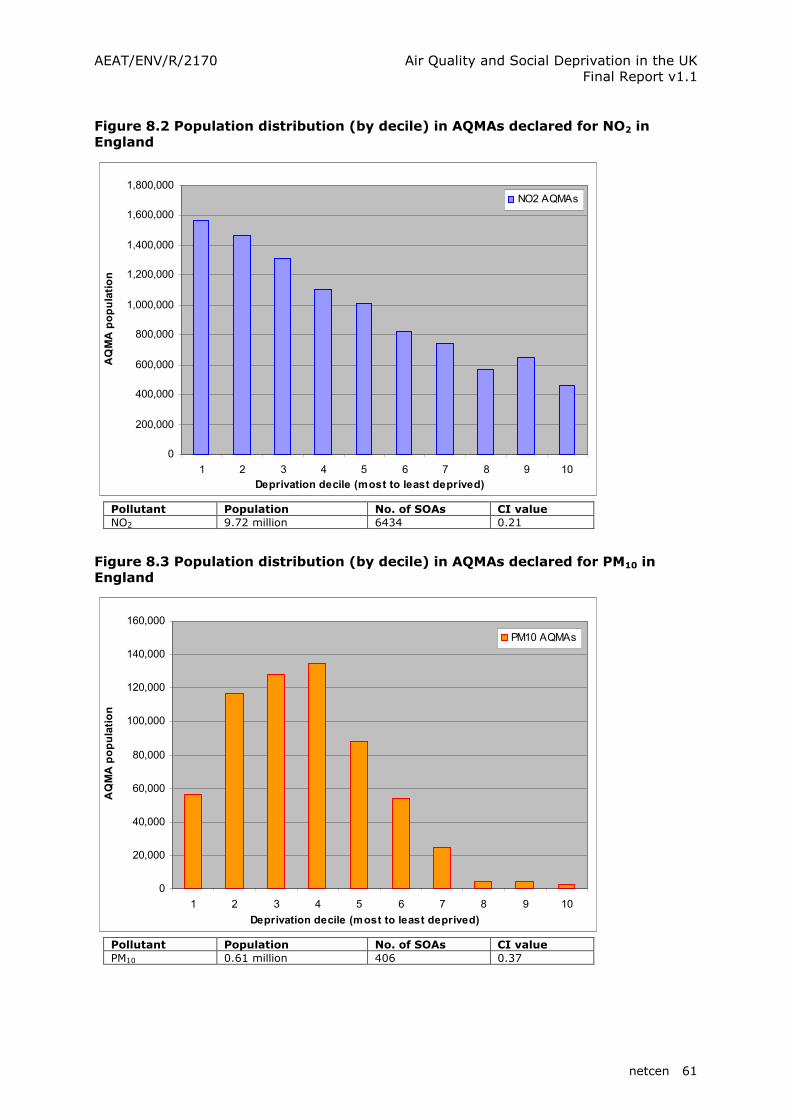
AEAT/ENV/R/2170 Air Quality and Social Deprivation in the UK Final Report v1.1
netcen 61
Figure 8.2 Population distribution (by decile) in AQMAs declared for NO2 in England
0
200,000
400,000
600,000
800,000
1,000,000
1,200,000
1,400,000
1,600,000
1,800,000
1 2 3 4 5 6 7 8 9 10
Deprivation decile (most to least deprived)
AQMA population
NO2 AQMAs
Pollutant Population No. of SOAs CI value
NO2 9.72 million 6434 0.21
Figure 8.3 Population distribution (by decile) in AQMAs declared for PM10 in England
0
20,000
40,000
60,000
80,000
100,000
120,000
140,000
160,000
1 2 3 4 5 6 7 8 9 10
Deprivation decile (most to least deprived)
AQMA population
PM10 AQMAs
Pollutant Population No. of SOAs CI value
PM10 0.61 million 406 0.37
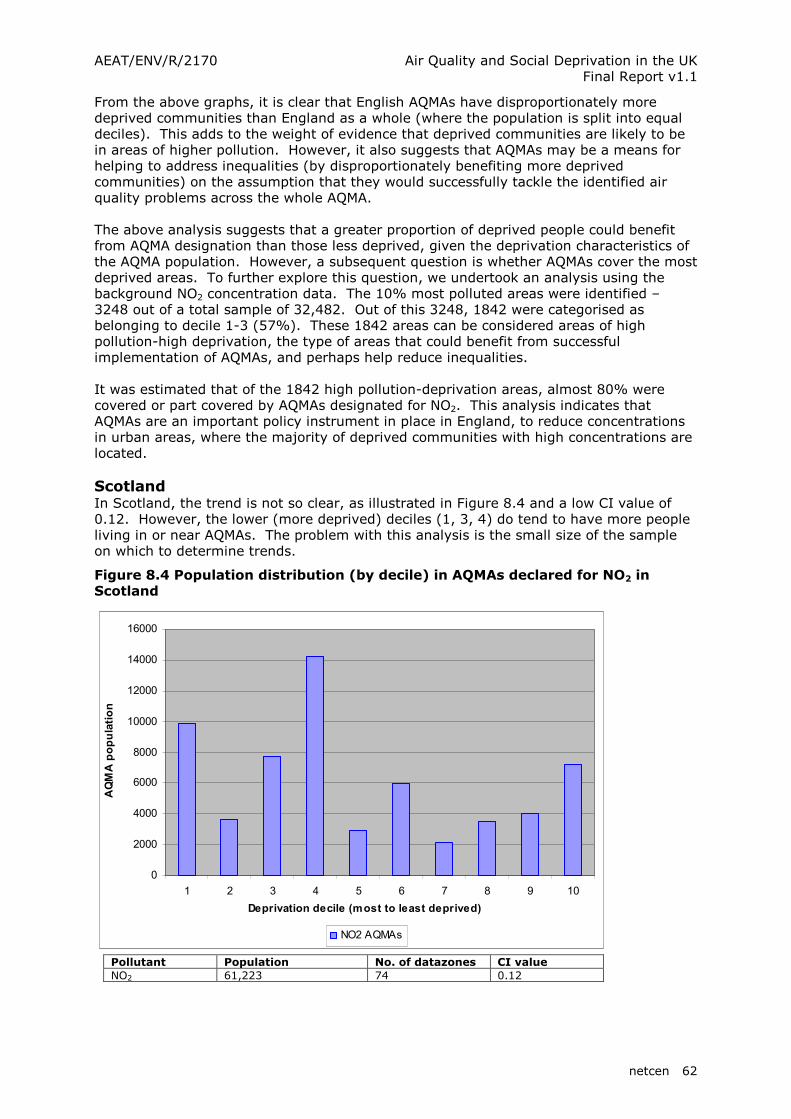
AEAT/ENV/R/2170 Air Quality and Social Deprivation in the UK Final Report v1.1
netcen 62
From the above graphs, it is clear that English AQMAs have disproportionately more deprived communities than England as a whole (where the population is split into equal deciles). This adds to the weight of evidence that deprived communities are likely to be in areas of higher pollution. However, it also suggests that AQMAs may be a means for helping to address inequalities (by disproportionately benefiting more deprived communities) on the assumption that they would successfully tackle the identified air quality problems across the whole AQMA. The above analysis suggests that a greater proportion of deprived people could benefit from AQMA designation than those less deprived, given the deprivation characteristics of the AQMA population. However, a subsequent question is whether AQMAs cover the most deprived areas. To further explore this question, we undertook an analysis using the background NO2 concentration data. The 10% most polluted areas were identified – 3248 out of a total sample of 32,482. Out of this 3248, 1842 were categorised as belonging to decile 1-3 (57%). These 1842 areas can be considered areas of high pollution-high deprivation, the type of areas that could benefit from successful implementation of AQMAs, and perhaps help reduce inequalities. It was estimated that of the 1842 high pollution-deprivation areas, almost 80% were covered or part covered by AQMAs designated for NO2. This analysis indicates that AQMAs are an important policy instrument in place in England, to reduce concentrations in urban areas, where the majority of deprived communities with high concentrations are located. Scotland In Scotland, the trend is not so clear, as illustrated in Figure 8.4 and a low CI value of 0.12. However, the lower (more deprived) deciles (1, 3, 4) do tend to have more people living in or near AQMAs. The problem with this analysis is the small size of the sample on which to determine trends.
Figure 8.4 Population distribution (by decile) in AQMAs declared for NO2 in Scotland
0
2000
4000
6000
8000
10000
12000
14000
16000
1 2 3 4 5 6 7 8 9 10
Deprivation decile (most to least deprived)
AQMA population
NO2 AQMAs
Pollutant Population No. of datazones CI value
NO2 61,223 74 0.12
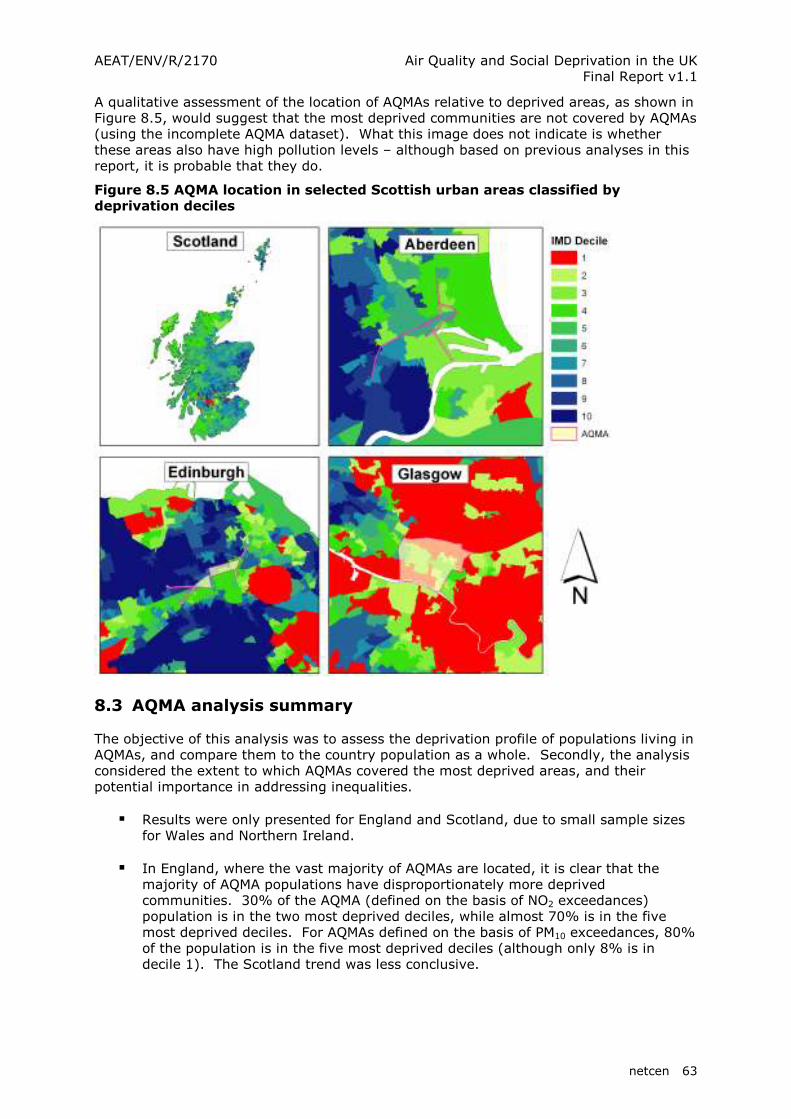
AEAT/ENV/R/2170 Air Quality and Social Deprivation in the UK Final Report v1.1
netcen 63
A qualitative assessment of the location of AQMAs relative to deprived areas, as shown in Figure 8.5, would suggest that the most deprived communities are not covered by AQMAs (using the incomplete AQMA dataset). What this image does not indicate is whether these areas also have high pollution levels – although based on previous analyses in this report, it is probable that they do.
Figure 8.5 AQMA location in selected Scottish urban areas classified by deprivation deciles
8.3 AQMA analysis summary
The objective of this analysis was to assess the deprivation profile of populations living in AQMAs, and compare them to the country population as a whole. Secondly, the analysis considered the extent to which AQMAs covered the most deprived areas, and their potential importance in addressing inequalities.
� Results were only presented for England and Scotland, due to small sample sizes for Wales and Northern Ireland.
� In England, where the vast majority of AQMAs are located, it is clear that the
majority of AQMA populations have disproportionately more deprived communities. 30% of the AQMA (defined on the basis of NO2 exceedances) population is in the two most deprived deciles, while almost 70% is in the five most deprived deciles. For AQMAs defined on the basis of PM10 exceedances, 80% of the population is in the five most deprived deciles (although only 8% is in decile 1). The Scotland trend was less conclusive.
AEAT/ENV/R/2170 Air Quality and Social Deprivation in the UK Final Report v1.1
netcen 64
� The England NO2 analysis indicated that almost 80% of high pollution-high deprivation areas were covered or part covered by AQMAs, highlighting that AQMAs could be an important policy instrument to help reduce inequalities observed in urban areas. The impact of action taken within AQMAs is not included in the UK projected data used in this study, and therefore the benefits of such action may not be apparent.
� There are some key limitations with this analysis. This type of analysis would be
useful to revisit in more detail, addressing the analysis limitations, and considering some of the local trends in more detail, particularly when the new AQMA digitised dataset is complete.
AEAT/ENV/R/2170 Air Quality and Social Deprivation in the UK Final Report v1.1
netcen 65
9 Community air quality and contribution from point sources
Industrial point sources can have significant impacts on the local air quality, and therefore on the local communities nearby. The objective of this analysis is to consider what type of local community, as characterised by deprivation levels, is most affected by industrial point sources, measured by contribution of this source to background ambient concentrations. Previous analyses (notably FOE 2001; Walker et al 2003a; Fairburn et al 2005) have focussed on proximity to plant characterised by size of emission, regulatory regime, or operational performance. Such analyses have generally found that large point sources are disproportionately located close to communities with higher levels of deprivation, and that these sources tend to have higher emission levels and higher pollution hazard ratings. This analysis differs to those undertaken in previous studies, by assessing actual contribution of point sources to overall ambient concentrations; in other words, an assessment of the contribution to air quality by this specific source. Air quality concentration levels experienced by different communities are important to examine because of the potential health impacts that communities might experience as a result of exposure. Therefore, understanding actual contribution from this source is critical, because it tells us something about importance of this source in relation to communities’ air quality, and the resulting health impacts. It is therefore a preferable indicator than proximity, and size of emission, because it can be better linked to impacts. Proximity to point sources, and levels of emissions, do not take into account the variables affecting the dispersion of pollutants, such as stack height, flue gas flow rates, and meteorological conditions. For example, a community half a mile from a large power station may receive a lower pollution contribution from the plant than a community two miles away due to the dispersion variables. It may be that proximity to site is a better proxy for assessing other environmental impacts such as noise and water quality (which do not have such complex dispersion characteristics), and aesthetic impact on the local environment, which are also important factors in determining environmental quality. 9.1 Point source dataset
Maps of modelled concentrations (for NOx22, SO2 and PM10) from point sources have been provided by the UK pollution Climate Modelling project (Stedman et al 2005). These maps are developed from two different point source datasets (all of which are Part A installations under PPC Regulations), using two different modelling approaches:
� Large point sources, modelled explicitly using a dispersion modelling approach. These sources, regulated by the Environment Agency (in England and Wales), SEPA (in Scotland) or DoENI (in Northern Ireland), have authorised emission limits above 500 tonnes for NOx and SO2, and 200 tonnes for PM10. For the dispersion modelling undertaken, a range of parameters has been used including stack height and diameter, and discharge velocity and temperature. A large point source is defined as an emission release point covered by an authorisation; it does not necessarily refer to all emissions from an individual site.
22 NOx rather than NO2 concentration will be considered because NO2 is not modelled for point sources – a conversion to NO2 is applied to the point source NOx contribution when the final NO2 maps are produced.
AEAT/ENV/R/2170 Air Quality and Social Deprivation in the UK Final Report v1.1
netcen 66
� Smaller point sources, modelled using a generalised dispersion kernel approach. These include all point sources below the above emission limits that are identified in the NAEI23 point source database. For smaller point sources, the dispersion kernel approach is explained in detail in Appendix 3 of Stedman et al (2005).
Table 9.1 below provides an overview of the number of point sources in the dataset, and the threshold over or under which they are classified as ‘large’ or ‘small’. The output of the point source modelling is a 1x1 km grid of concentration values from point sources, providing the information to understand the contribution of these sources to overall pollution concentrations. In effect, a pollution ‘footprint’ for these sources is produced.
Table 9.1 Point source datasets used in UK Pollution Climate Modelling work
Pollutant Threshold (tonnes / year)
No. of large point sources*
No. of smaller point sources**
NOx 500 170 923 PM10 200 63 1911 SO2 500 134 591 * Large point source denotes an emission release source covered by an authorisation. ** Small point sources are sourced from the NAEI point source database, and cover Part A and Part B regulated sites, in addition to others. The large point sources are modeled on the basis of emission estimates derived under the NAEI. These estimates may be based on information from the pollution inventory or other industry sources, and will be modelled on an annual basis (whether or not they exceed emission thresholds for reporting under IPC / PPC regulations). There are some distinct differences between the contribution of different size point sources to pollutant concentrations. Above the given thresholds, SO2 contribution is dominated by the larger point sources. The contributions of NOx from point sources in this analysis are dominated by the larger point sources, accounting for between 85-90% in England depending on the threshold considered. On the other hand, for PM10, it is the smaller point sources that contribute most, accounting for 90% or more of point source contribution in England. The differences between types of point source and associated contribution could have implications for the formulation of policy response. 9.2 Point source analysis approach
For this analysis, the modelled point source contribution to ambient concentrations was calculated. Where point sources contributed above certain thresholds, both in terms of percentage and absolute contribution, the deprivation levels of those areas were assessed using Gini-based analysis. The thresholds used are shown in Table 9.2. A range of thresholds has been selected in order to examine the trends where contributions are the highest, in addition to where they are significant. Both types of threshold used are important, particularly the percentage threshold. Simply using an absolute threshold could mean that the importance in terms of contribution to ambient concentration levels by large point sources could be missed in certain areas. A percentage contribution threshold for SO2 has not been considered as the SO2 metric we are using is based on the 99.9
th percentile (see Stedman (2005) for a description of the methodology); a percentage of a percentile does not have a physical meaning because the maximum contribution from different sources to the total concentration may not happen at the same time.
23 National Atmospheric Emissions Inventory (www.naei.org.uk)

AEAT/ENV/R/2170 Air Quality and Social Deprivation in the UK Final Report v1.1
netcen 67
Table 9.2 Threshold range by pollutant for point source analysis
Thresholds Average dataset values
Maximum dataset values
Average ambient concentrations
Pollutant
Absolute contribution to overall concentrations (µg/m3)
% Contribution to overall concentrations
(µg/m3) (µg/m3) (µg/m3)
NOx >3 - 5 5 - 10 0.39 19.62 14.75 PM10 >1 - 2 5 - 10 0.049 5.53 13.53 SO2 >150 - 200 - 18.77 492 59.9 N.B. SO2 is the 99.9 %ile of the 15 minute mean and NOx and PM10 are annual means The threshold values selected equate to over 25% of the maximum value observed in the point source dataset. For SO2, point sources are recognised as the most dominant source of SO2 across the UK (with the exception of areas using significant amounts of solid fuels), while for NOx and PM10, they represent a much smaller contribution. This can be seen in Table 9.2, when comparing the average points dataset value with average ambient concentrations. We have used a threshold range; for example for NOx, 3-5 µg/m3. This enables us to identify any changes in distribution of decile populations when we use different thresholds. A lower threshold will also provide a larger population sample for analysis, as shown in Figure 9.1. The increased coverage using a 5% rather than 10% contribution threshold means that a wider area (and therefore population) is covered.
Figure 9.1 Percentage contribution to NOx concentrations by point sources in the North East of England
The threshold values have not been selected to indicate a specific impact from point sources. They simply provide a basis for characterising areas that receive a relatively large contribution from point sources, and analysing the population deprivation levels in those areas.
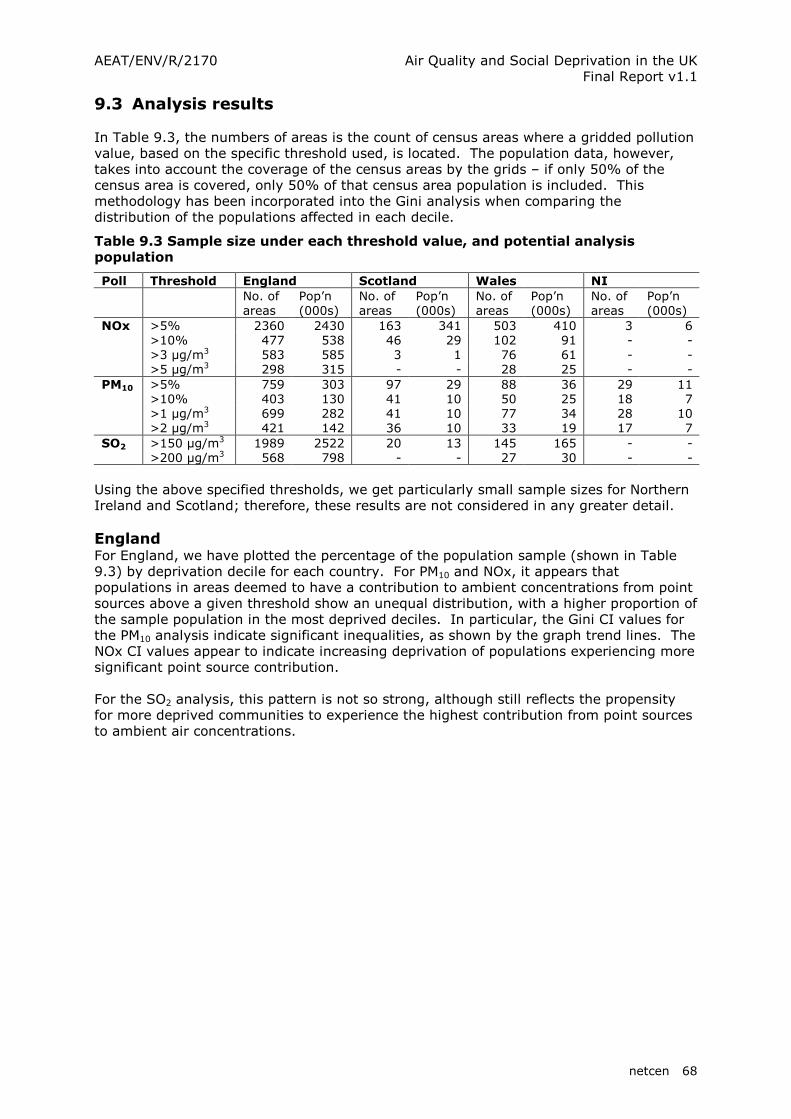
AEAT/ENV/R/2170 Air Quality and Social Deprivation in the UK Final Report v1.1
netcen 68
9.3 Analysis results
In Table 9.3, the numbers of areas is the count of census areas where a gridded pollution value, based on the specific threshold used, is located. The population data, however, takes into account the coverage of the census areas by the grids – if only 50% of the census area is covered, only 50% of that census area population is included. This methodology has been incorporated into the Gini analysis when comparing the distribution of the populations affected in each decile.
Table 9.3 Sample size under each threshold value, and potential analysis population
Poll Threshold England Scotland Wales NI
No. of areas
Pop’n (000s)
No. of areas
Pop’n (000s)
No. of areas
Pop’n (000s)
No. of areas
Pop’n (000s)
NOx >5% 2360 2430 163 341 503 410 3 6 >10% 477 538 46 29 102 91 - - >3 µg/m3 583 585 3 1 76 61 - - >5 µg/m3 298 315 - - 28 25 - - PM10 >5% 759 303 97 29 88 36 29 11 >10% 403 130 41 10 50 25 18 7 >1 µg/m3 699 282 41 10 77 34 28 10 >2 µg/m3 421 142 36 10 33 19 17 7 SO2 >150 µg/m3 1989 2522 20 13 145 165 - - >200 µg/m3 568 798 - - 27 30 - - Using the above specified thresholds, we get particularly small sample sizes for Northern Ireland and Scotland; therefore, these results are not considered in any greater detail. England For England, we have plotted the percentage of the population sample (shown in Table 9.3) by deprivation decile for each country. For PM10 and NOx, it appears that populations in areas deemed to have a contribution to ambient concentrations from point sources above a given threshold show an unequal distribution, with a higher proportion of the sample population in the most deprived deciles. In particular, the Gini CI values for the PM10 analysis indicate significant inequalities, as shown by the graph trend lines. The NOx CI values appear to indicate increasing deprivation of populations experiencing more significant point source contribution. For the SO2 analysis, this pattern is not so strong, although still reflects the propensity for more deprived communities to experience the highest contribution from point sources to ambient air concentrations.
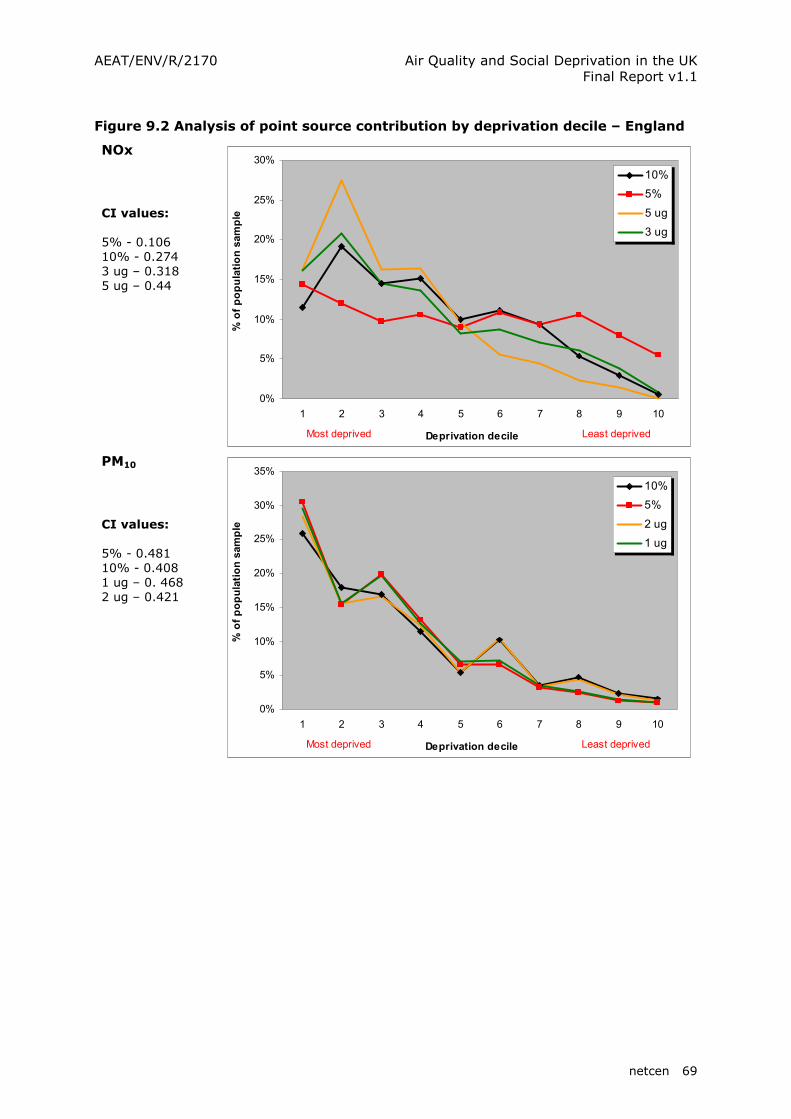
AEAT/ENV/R/2170 Air Quality and Social Deprivation in the UK Final Report v1.1
netcen 69
Figure 9.2 Analysis of point source contribution by deprivation decile – England
NOx CI values: 5% - 0.106 10% - 0.274 3 ug – 0.318 5 ug – 0.44
0%
5%
10%
15%
20%
25%
30%
1 2 3 4 5 6 7 8 9 10
Deprivation decile
% of population sample
10%
5%
5 ug
3 ug
Most deprived Least deprived
PM10 CI values: 5% - 0.481 10% - 0.408 1 ug – 0. 468 2 ug – 0.421
0%
5%
10%
15%
20%
25%
30%
35%
1 2 3 4 5 6 7 8 9 10
Deprivation decile
% of population sample
10%
5%
2 ug
1 ug
Most deprived Least deprived

AEAT/ENV/R/2170 Air Quality and Social Deprivation in the UK Final Report v1.1
netcen 70
SO2
CI values: 150 ug - 0.152 200 ug - 0.108
0%
2%
4%
6%
8%
10%
12%
14%
16%
1 2 3 4 5 6 7 8 9 10
Deprivation decile
% of population sample
200 ug
150 ug
Most deprived Least deprived
Few differences exist in the above PM10 graph, based on the thresholds chosen or type of measures (absolute or percentage threshold). For NOx, a more apparent difference exists for the 3 µg/m3 threshold, which has a much larger population sample, showing a much flatter trend and therefore low CI value. The distribution of areas in England where point source NOx contribution greater than 3 µg/m3 are shown in Figure 9.3. The majority of the areas covered are around the Humber Estuary, particularly in North Lincolnshire, and in the North East (in Stockton and Cleveland). Areas covered by PM10 are less concentrated in a given area, which is what would be expected, given that this dataset is dominated by smaller point sources.
Figure 9.3 Areas in England (shown in red) where point source NOx concentrations > 3 ug/m3

AEAT/ENV/R/2170 Air Quality and Social Deprivation in the UK Final Report v1.1
netcen 71
Wales For Wales, the graphs in Figure 9.4 show very ‘spiky’ inconclusive trends, based on which neither the most or least deprived experience a greater contribution to pollutant concentrations from point sources.
Figure 9.4 Analysis of point source contribution by deprivation decile – Wales
NOx CI values: 5% - -0.027 10% - -0.144 3 ug – -0.074 5 ug – 0.007
0%
5%
10%
15%
20%
25%
1 2 3 4 5 6 7 8 9 10
Deprivation decile
% of population sample
10%
5%
5 ug
3 ug
Most deprived Least deprived
PM10 CI values: 5% - 0.124 10% - 0.145 1 ug – 0.147 2 ug – 0.249
0%
5%
10%
15%
20%
25%
1 2 3 4 5 6 7 8 9 10
Deprivation decile
% of population sample
10%
5%
2 ug
1 ug
Most deprived Least deprived
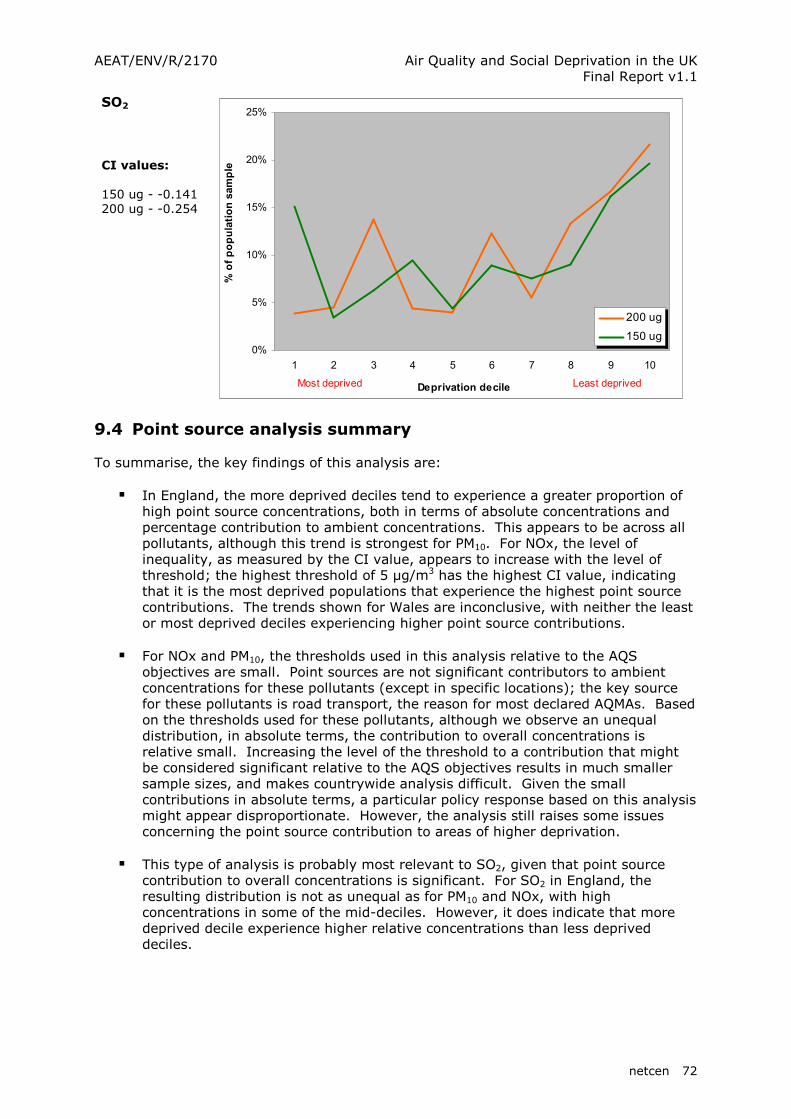
AEAT/ENV/R/2170 Air Quality and Social Deprivation in the UK Final Report v1.1
netcen 72
SO2
CI values: 150 ug - -0.141 200 ug - -0.254
0%
5%
10%
15%
20%
25%
1 2 3 4 5 6 7 8 9 10
Deprivation decile
% of population sample
200 ug
150 ug
Most deprived Least deprived
9.4 Point source analysis summary
To summarise, the key findings of this analysis are:
� In England, the more deprived deciles tend to experience a greater proportion of high point source concentrations, both in terms of absolute concentrations and percentage contribution to ambient concentrations. This appears to be across all pollutants, although this trend is strongest for PM10. For NOx, the level of inequality, as measured by the CI value, appears to increase with the level of threshold; the highest threshold of 5 µg/m3 has the highest CI value, indicating that it is the most deprived populations that experience the highest point source contributions. The trends shown for Wales are inconclusive, with neither the least or most deprived deciles experiencing higher point source contributions.
� For NOx and PM10, the thresholds used in this analysis relative to the AQS
objectives are small. Point sources are not significant contributors to ambient concentrations for these pollutants (except in specific locations); the key source for these pollutants is road transport, the reason for most declared AQMAs. Based on the thresholds used for these pollutants, although we observe an unequal distribution, in absolute terms, the contribution to overall concentrations is relative small. Increasing the level of the threshold to a contribution that might be considered significant relative to the AQS objectives results in much smaller sample sizes, and makes countrywide analysis difficult. Given the small contributions in absolute terms, a particular policy response based on this analysis might appear disproportionate. However, the analysis still raises some issues concerning the point source contribution to areas of higher deprivation.
� This type of analysis is probably most relevant to SO2, given that point source
contribution to overall concentrations is significant. For SO2 in England, the resulting distribution is not as unequal as for PM10 and NOx, with high concentrations in some of the mid-deciles. However, it does indicate that more deprived decile experience higher relative concentrations than less deprived deciles.

AEAT/ENV/R/2170 Air Quality and Social Deprivation in the UK Final Report v1.1
netcen 73
� A limitation with the analysis undertaken is the analysis resolution that we are working at. We assume that modelled contributions from point sources affect the air quality for the whole population of a given 1 x 1 km area. This limitation is due to the available modelled data for input into the analysis. A more robust analysis would use specific actual point source locations, look at the dispersion characteristics for each one, and assess the impact for specific communities.

AEAT/ENV/R/2170 Air Quality and Social Deprivation in the UK Final Report v1.1
netcen 74

AEAT/ENV/R/2170 Air Quality and Social Deprivation in the UK Final Report v1.1
netcen 75
10 Population susceptibility to air quality impacts as a compounding factor of environmental inequalities
An important conclusion in this study, for certain countries and pollutants assessed, is that communities characterised by high levels of deprivation often experience higher than average pollution, or pollution levels that are relatively higher than those experienced by less deprived communities. This research supports the findings of other studies (Walker et al. 2003a; Fairburn et al. 2005) that have reached similar conclusions. In responding to the Government’s agenda on sustainability, this will be an important issue that policy makers developing air quality policy and that authorities implementing measures will need to consider. We expand on this issue in the next section. This section of the report considers a further issue linked to inequalities in communities’ experience of air quality. The issue is whether certain communities, particularly those that are more deprived, are more susceptible to the impacts of air pollution. If this were the case, where such communities experience higher pollutant concentrations, this greater susceptibility would be a compounding factor on the level of inequality. In other words, the inequality already experienced because a deprived community experiences worse air pollution than a less deprived community is increased (or compounded) because that community is more susceptible to the negative health impacts associated with air pollution. In this section of the report we consider some of the issues around susceptibility, and undertake some preliminary analysis to assess whether susceptibility might be a compounding factor. 10.1 Developing an approach to assess population susceptibility
In this study, we have established that in certain areas of the UK, the most deprived communities often experience the worst air pollution. The question for this approach is how to determine whether such communities are more susceptible. Susceptibility to air pollution effects will be determined by a number of different factors:
� Exposure patterns (indoor/outdoor work, exposure during travel, etc), driven by daily activities will determine the exposure to air pollution – either to peak air pollution concentrations or as a cumulative daily dose. The exposure pattern is determined by activity patterns, i.e. how we travel to work or school, the environment in which work or study, and how we spend leisure time. These exposure patterns may be different in deprived communities (e.g. which may require greater travel time to get to work, a different indoor to outdoor level of exposure, etc)
� Individual lifestyle factors, such as choice of diet, smoking, and level of exercise have an impact on human health. Poorer general health as a result of lifestyle factors could lead to greater susceptibility to air pollution impacts and certain lifestyle factors may be more prevalent amongst certain socio-economic groups (e.g. the relationship between diet and income, or smoking and socio-economic group).
� State of health, including both physical and mental health, could have some bearing on the level of immune response to air pollution exposure. There is significant evidence that deprived communities experience poorer health than less deprived communities, as outlined in the Independent Inquiry into Inequality in

AEAT/ENV/R/2170 Air Quality and Social Deprivation in the UK Final Report v1.1
netcen 76
Health report (Acheson 1998). The health domain is an important set of indicators in the deprivation indexes used in this study. 24
� Age of population is considered to be an important factor in health impact assessment methodologies in determining the level of air pollution impacts, with the elderly and children particularly susceptible.
The above factors will play an important role in determining susceptibility. Their role in determining health can be seen in the context of the socio-economic model of health (shown in Figure 10.1), which was used as the framework for considering the different health determinants in the 1998 Independent Inquiry into Inequalities in Health (Acheson 1998). The figure illustrates the influence of different factors, with the most influential at the centre but does not show the many different complex interactions between layers of determinants that affect human health.
Figure 10.1 Socio-economic model of health
It is the complexity of these interactions that make understanding susceptibility to health impacts so difficult. Given the uncertainties surrounding how an individual may be affected by a given dose of air pollution, an analysis to consider susceptibility might be considered speculative. Although significant uncertainties remain, methodologies have been established to calculate the potential impacts from air pollution, using concentration-response functions for different health end points, identified as resulting from air pollution. The impact assessment methodology for the UK has been determined by COMEAP (1998); other methodologies include those developed for the European Commission such as ExternE and the recent CAFE health benefits assessment methodology (Hurley et al. 2005).
24 Each country deprivation index includes a health domain, which are constructed using various indicators, most of which reflect similar factors relating to health. The English IMD includes the following factors in its health domain: Years of Potential Life Lost (YPLL), Comparative Illness and Disability Ratio (CIDR) – measuring uptake of benefits, Measures of emergency admissions to hospital, and Measure of adults under 60 suffering from mood or anxiety disorders.
AEAT/ENV/R/2170 Air Quality and Social Deprivation in the UK Final Report v1.1
netcen 77
In many cases, concentration-response functions have been developed for certain age groups that are deemed more susceptible to the impacts of air pollution, primarily children (0-14 years) and elderly people (> 65 years). In Hurley et al (2005), examples of age-specific functions include:
� Increase in respiratory medication use (0-15 yrs) � Increase in lower respiratory symptoms (0-15 yrs) � Increase in upper respiratory disease consultations (0-15 / 65+ yrs) � Increase in asthma consultations (0-15 / 65+ yrs) � Deaths brought forward (65+ yrs)
Given the importance of age in impact assessment methodologies, we have used this as one indicator of susceptibility. We have assessed whether deprived communities (which may experience higher pollution concentrations) have a higher proportion of elderly or the young, by assessing the age profile of such communities. As implied earlier by the description of uncertainties in determining susceptibility, age is only an indicator of susceptibility, and does not necessarily determine susceptibility in isolation. However, given that it is often an important parameter in health impact assessment, it appears that it use in this analysis is justifiable. Consideration was also given to the use of background rates in communities, as an indicator of susceptibility. The rationale is that higher background rates of illnesses associated with air quality e.g. asthma rates, or respiratory hospital admissions will lead to increased impacts. Background rates are used in concentration-response functions as an important parameter in assessing increased health risk. However, the argument may be circular – higher background rates may be due to poor air quality and therefore may not reflect increased susceptibility. Due to this issue, and the lack of appropriate data at regional or national scale, such an analysis using background rate information has not been undertaken. 10.2 Age analysis for England
Mitchell and Dorling (2003) undertook an age analysis, examining the age distribution of NO2 in Great Britain. They showed that the greatest burden of poor air quality (in terms of NO2) is borne by i) the poor, and ii) very young children and young adults. They assumed that the greatest burden would lie with the very young children of the poor (these groups have little or no say on where they live; young adults do). This analysis has been undertaken for England, and assesses age profile and pollutant concentration on the basis of deprivation. We have used PM10 concentrations data in this analysis as this is recognised as the pollutant driving health impacts. We are also looking to analyse all three variables of age, deprivation and pollution concentration together, rather than in isolation. Figure 10.2 shows the percentage of different age groups as categorised by deprivation decile. Over 12% of children live in decile 1 areas, dropping to just over 9% in mid-decile areas. The population of adults of working age (15-65 years) is equally spread across the deciles (at around 10% in each), while elderly populations are greater in the mid-deciles and much lower in the most deprived deciles.

AEAT/ENV/R/2170 Air Quality and Social Deprivation in the UK Final Report v1.1
netcen 78
Figure 10.2 Percentage of age group by deprivation decile in England
4%
5%
6%
7%
8%
9%
10%
11%
12%
13%
1 2 3 4 5 6 7 8 9 10
Deprivation decile
% of age group population
0-14
15-64
65+
Most deprived Least deprived
In addition, if we look at the age profile for the more deprived deciles, we also see that the most deprived deciles (1 and 2) have a higher proportion of children relative to other deciles. This suggests that there is a compounding effect here. There is a higher proportion of children in the most deprived deciles, there are epidemiological studies that point to greater susceptibility in children, and there is higher pollution in these deciles. However, this does not mean that these decile populations are necessarily more susceptible, because the effect of children (higher numbers and greater susceptibility) may be counterbalanced by the lower numbers of elderly people in more deprived deciles (the elderly also have high susceptibility). To further develop our analysis, we considered what the decile distribution would be for a sample of 100 people (for the all ages category, it is 10 persons in each decile), and the average level of pollution that they would experience. A population-weighted concentration was then calculated, to indicate the level of exposure for each age group in each decile. Figure 10.3 shows the results for the three different population groups, and for the total population.
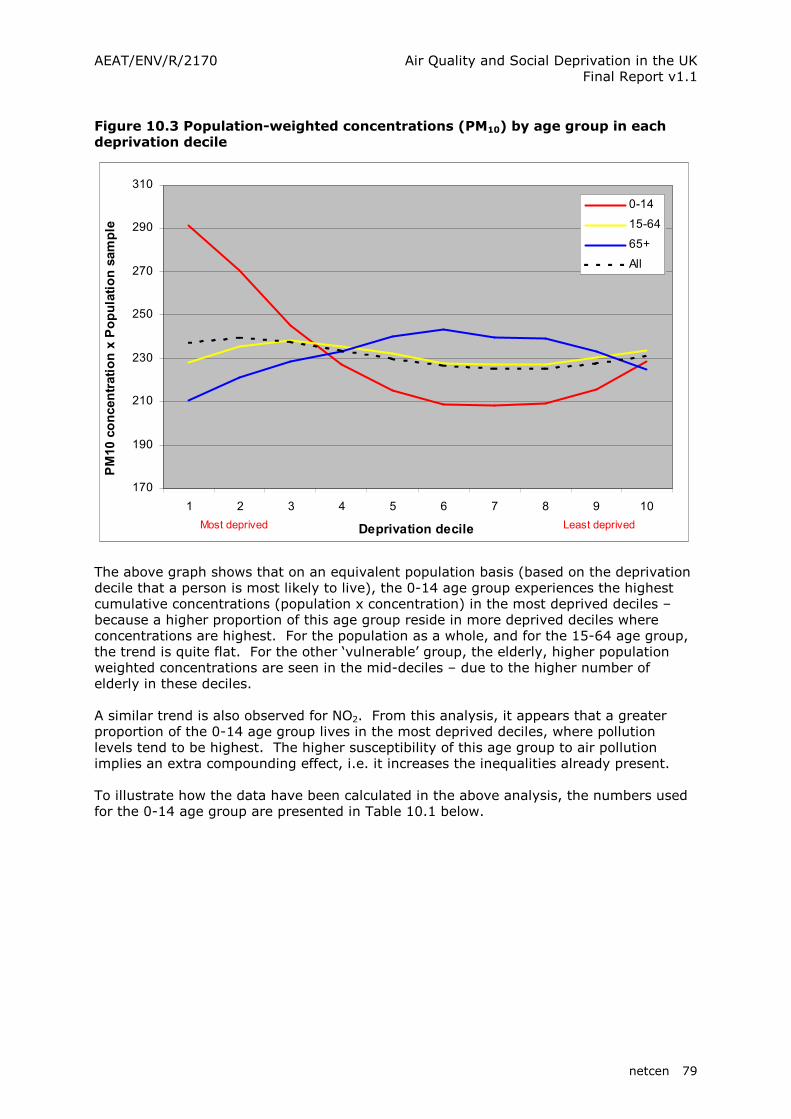
AEAT/ENV/R/2170 Air Quality and Social Deprivation in the UK Final Report v1.1
netcen 79
Figure 10.3 Population-weighted concentrations (PM10) by age group in each deprivation decile
170
190
210
230
250
270
290
310
1 2 3 4 5 6 7 8 9 10
Deprivation decile
PM10 concentration x Population sample
0-14
15-64
65+
All
Most deprived Least deprived
The above graph shows that on an equivalent population basis (based on the deprivation decile that a person is most likely to live), the 0-14 age group experiences the highest cumulative concentrations (population x concentration) in the most deprived deciles – because a higher proportion of this age group reside in more deprived deciles where concentrations are highest. For the population as a whole, and for the 15-64 age group, the trend is quite flat. For the other ‘vulnerable’ group, the elderly, higher population weighted concentrations are seen in the mid-deciles – due to the higher number of elderly in these deciles. A similar trend is also observed for NO2. From this analysis, it appears that a greater proportion of the 0-14 age group lives in the most deprived deciles, where pollution levels tend to be highest. The higher susceptibility of this age group to air pollution implies an extra compounding effect, i.e. it increases the inequalities already present. To illustrate how the data have been calculated in the above analysis, the numbers used for the 0-14 age group are presented in Table 10.1 below.
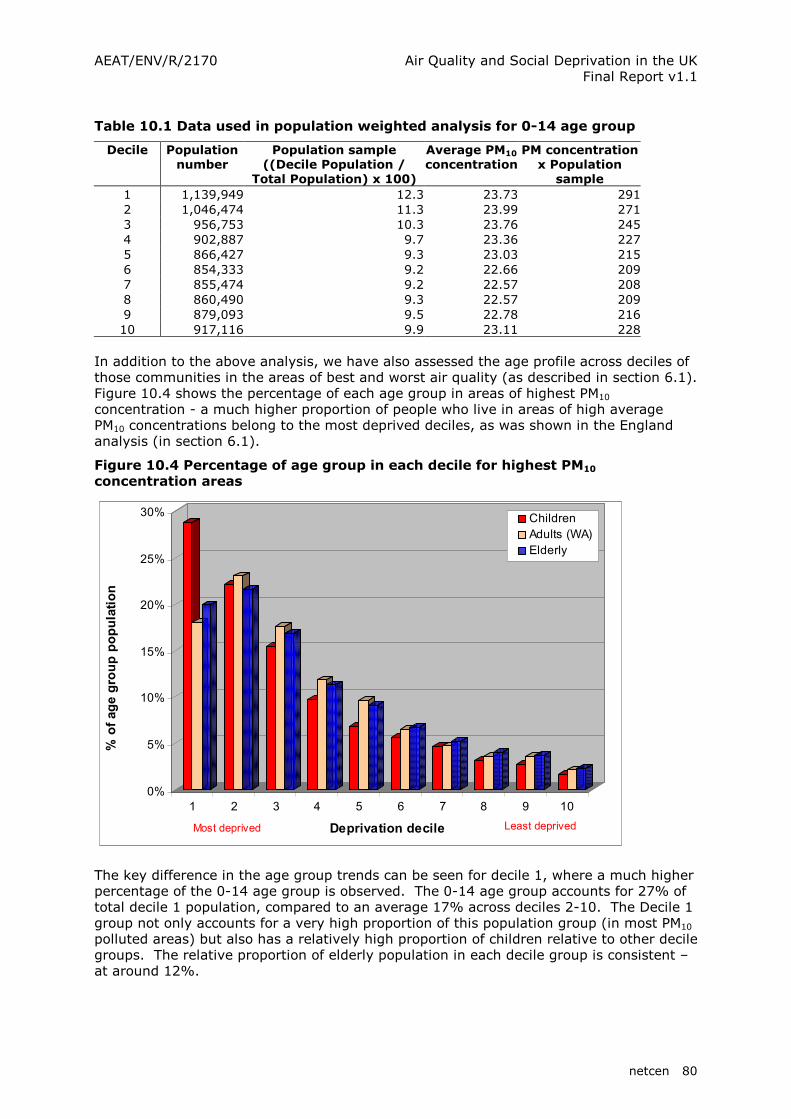
AEAT/ENV/R/2170 Air Quality and Social Deprivation in the UK Final Report v1.1
netcen 80
Table 10.1 Data used in population weighted analysis for 0-14 age group
Decile Population number
Population sample ((Decile Population /
Total Population) x 100)
Average PM10 concentration
PM concentration x Population
sample
1 1,139,949 12.3 23.73 2912 1,046,474 11.3 23.99 2713 956,753 10.3 23.76 2454 902,887 9.7 23.36 2275 866,427 9.3 23.03 2156 854,333 9.2 22.66 2097 855,474 9.2 22.57 2088 860,490 9.3 22.57 2099 879,093 9.5 22.78 21610 917,116 9.9 23.11 228
In addition to the above analysis, we have also assessed the age profile across deciles of those communities in the areas of best and worst air quality (as described in section 6.1). Figure 10.4 shows the percentage of each age group in areas of highest PM10 concentration - a much higher proportion of people who live in areas of high average PM10 concentrations belong to the most deprived deciles, as was shown in the England analysis (in section 6.1).
Figure 10.4 Percentage of age group in each decile for highest PM10 concentration areas
0%
5%
10%
15%
20%
25%
30%
% of age group population
1 2 3 4 5 6 7 8 9 10
Deprivation decile
Children
Adults (WA)
Elderly
Most deprived Least deprived
The key difference in the age group trends can be seen for decile 1, where a much higher percentage of the 0-14 age group is observed. The 0-14 age group accounts for 27% of total decile 1 population, compared to an average 17% across deciles 2-10. The Decile 1 group not only accounts for a very high proportion of this population group (in most PM10 polluted areas) but also has a relatively high proportion of children relative to other decile groups. The relative proportion of elderly population in each decile group is consistent – at around 12%.

AEAT/ENV/R/2170 Air Quality and Social Deprivation in the UK Final Report v1.1
netcen 81
The following conclusions can be drawn from the above analysis:
� Determining susceptibility is difficult due to the large range of factors that might determine an individual response to a given dose of air pollution. In particular, actual exposure to air pollution is important but cannot be addressed in this analysis, due to its scope and scale. The use of age as an indicator of susceptibility has been justified based on its use in health impact assessment methodologies, with children and elderly groups found to be more susceptible to certain health impacts.
� Relative to other age groups, inequalities appear to be even larger for the 0-14
age group, who experience higher average concentrations of pollutants (NO2 and PM10) in the most deprived deciles than other age groups. This is important because this group is more susceptible to the effects of air pollution, i.e. this compounds inequalities.
� The most deprived deciles have a greater proportion of children relative to other
age groups. However, it is not possible to say that these deciles are more susceptible than other decile populations overall, as they have lower numbers of the elderly population.
� In areas of highest PM10 pollution, the distribution for 0-14 age group has a higher
CI value (greater inequalities) due to the significantly higher proportion of this age group classified in decile 1. In addition, the most deprived deciles (1 and 2) – where some of the highest concentrations are experienced - have a higher proportion of 0-14 age group.
10.3 Areas of health inequalities and air pollution
The above analysis considers the population demographics of different socio-economic groups, and questions whether different age profiles might compound inequalities due to greater susceptibility to air pollution health impacts. This analysis starts from a different perspective – it asks ‘in identified areas of poor health and in many cases high levels of deprivation, what levels of pollution can be found?’ In 2004, the Government announced the “Spearhead Group” as a focus of action for the national health inequalities target for 2010 to narrow the gap in life expectancy by geographical area. The group, comprises 70 local authorities, mapping to 88 Primary Care Trusts, with the worst health and deprivation indicators The group is being as a focus to reduce health inequalities, especially in life expectancy.25 If environmental quality, as one of the determinants of health, is poor in such areas and may be contributing to health inequalities, this could reduce the effectiveness of specific initiatives to address health inequalities. The purpose of this analysis is to assess levels of air pollutant concentrations in such areas; if they are higher than average, then this might be another issue that needs to be addressed in conjunction with ongoing initiatives. If poorer health does lead to a greater susceptibility to the impacts of air quality, it is important that a strategy to tackle health inequalities also considers environmental quality factors, including air quality. As part of this section on population health and susceptibility, an analysis has been undertaken to consider whether spearhead areas suffer higher levels of pollution.
25 DoH press release - http://www.dh.gov.uk/PublicationsAndStatistics/PressReleases/PressReleasesNotices/fs/en?CONTENT_ID=4095409&chk=JJsWE0
AEAT/ENV/R/2170 Air Quality and Social Deprivation in the UK Final Report v1.1
netcen 82
Spearhead Group areas are defined as those local authority areas in the worst 5th for 3 of the following 5 criteria:
� Male life expectancy at birth � Female life expectancy at birth � Cancer mortality rate in under 75s � Circulatory disease mortality rate in under 75s � Index of Multiple Deprivation 2004
A shown in Figure 10.5, Spearhead Group areas are clustered in London, the North West, North East, Yorkshire, and specific parts of the Midlands. While their populations are not uniformly disadvantaged, Spearhead Group areas account for over a quarter of the population of England (28%).

AEAT/ENV/R/2170 Air Quality and Social Deprivation in the UK Final Report v1.1
netcen 83
Figure 10.5 Spearhead Group Areas
AEAT/ENV/R/2170 Air Quality and Social Deprivation in the UK Final Report v1.1
netcen 84
Table 10.2 provides a summary of the population weighted mean concentrations across Spearhead Group areas.
Table 10.2 Estimated population-weighted means concentrations (ug/m3) for Spearhead Areas
NO2 PM10 O3 SO2
All Spearhead Group areas 29.4 23.3 53.4 105.9 England average 25.9 23.2 58.6 91.9 Areas designated as having poor health and high levels of deprivation (Spearhead Group areas) tend to experience above average concentrations (except for ozone) than the rest of England. However, given that they cover predominantly urban areas, this pattern is what would be expected. Although for PM10, the difference in average concentrations is minimal, it is slightly higher for NO2, and there is a more noticeable difference for SO2. So while there is a difference, it is quite small. The relatively large local authority areas which constitute the Spearhead Group may mask within areas inequalities where pollutants may be higher, for example, where social housing is located near roads, industrial areas or other sources of pollution. In the field of health policymaking, it is important that the impact of environmental quality on the health of communities is considered, particularly when undertaking initiatives to address health inequalities. Addressing environmental inequalities should be an important part of any strategy, and will involve close cooperation with professionals from other sectors e.g. planning, environmental health etc.

AEAT/ENV/R/2170 Air Quality and Social Deprivation in the UK Final Report v1.1
netcen 85
11 Study recommendations
This study has been broad in the scope of the analysis undertaken. While many different interesting findings have been reported, a question remains about what this information means for policy makers in Defra and those who implement air quality policy, and how it should be used. In this section of the report, we outline some of the recommendations, relating to how the information in this report could be used, and what the priority areas for further research should be. The main study conclusions are not included in this section but can be found in the Executive Summary and at the end of each report section. This study (and other similar studies) provide air quality policymakers with some of the evidence needed for understanding how resources might be most effectively targeted to reduce inequalities. The following recommendations, based primarily on the England analysis, have been kept purposefully broad rather than prescriptive, as a means of encouraging further discussions around the issues raised.
1. Consideration of further targeted measures (based on additional research) where high deprivation-high pollution areas persist. This analysis has shown that there are specific areas that have the worst air quality and are the most deprived, currently and in future years. It has also indicated that a disproportionate number of some of the most vulnerable members of the community also live in these areas. Additional action should be developed to target such areas, based on further research to identify such areas. Such recommendations are in line with Government commitments to tackle environmental inequalities.
The Government’s sustainable development strategy makes the following commitments (HMSO 2005) – i) to fund further research on the causes of environmental inequality and the effectiveness of measures to tackle it in order to establish the best ways to tackle these issues in communities and ii) in the short term focus on improving the environment in the areas already identified as most deprived by the Index of Multiple Deprivation (while carrying out further research to help identify the areas with the worst local environment). Defra, in partnership with regional and local agencies, will have a key role to play in meeting this commitment
2. Development of robust quantitative analysis for assessment of
inequalities when appraising different policies. This would demonstrate the impact of new and existing policies on the current and future level of inequalities, based on a consistent methodology, using indicators such as Gini CI values (a measure of the level of equality). This would help incorporate social considerations into policy appraisal on a quantitative basis, as is currently done for economic and environmental ones, for example in the recent economic analysis to inform the consultation of the Air Quality Strategy Review (Defra 2006). Within this assessment, only limited qualitative analysis of the distributional impacts on different communities has been undertaken.
3. Cross-departmental co-operation needs to be further strengthened to
effectively tackle environmental inequalities; as has been noted, environmental inequalities need to be tackled from two sides – firstly,

AEAT/ENV/R/2170 Air Quality and Social Deprivation in the UK Final Report v1.1
netcen 86
regeneration to reduce multiple deprivation, which is part of a cross-departmental agenda, and secondly, improve environmental quality, in this case air quality, which is where Defra can lead on policy development, with implementation at the local level.
This is being promoted by the Neighbourhood Renewal Unit within the ODPM. Commitment 79 in the Neighbourhood Renewal Strategy (SEU 2001) sets out in general terms how air quality is being improved by Government, through a range of policies to improve local environmental quality and increase recognition of the role of the environment in improving quality of life. For example, the Air Quality Strategy sets out the Government and Devolved Administrations’ policies and proposals for improving ambient air quality across the UK, and sets targets for reducing the levels of eight key air pollutants. Local authorities have a central role to play in delivering cleaner air. Where they identify parts of their areas where the nationally prescribed air quality objectives may not be met, they are required to prepare air quality action plans setting out the steps they intend to take to address the problem. As mentioned in recommendation 1, further targeted action could be required to focus on those areas not only with poor air quality but which also have high levels of deprivation.
4. Further research on exposure patterns for different communities based on
behavioural patterns. Models are being developed to better understand the levels of exposure of different communities based on behavioural patterns e.g. travelling to work, staying at home etc. It is recommended that research based on case studies is undertaken to assess differences in exposure between socio-economic groups (based on their different behaviour and living / working environments). In addition, further research is recommended to further develop understanding on susceptibility to air pollution impacts, based on lifestyle choices that different socio-economic groups make e.g. smoking, diet etc.
5. Further research into the distribution of other indicators of environmental
quality. As described in the SDRN (2004) review of environmental justice literature, most research has been undertaken into the inequalities associated with air quality. The distribution of other types of environmental inequality need further research, as do the cumulative environmental inequalities experienced by different communities.
An additional question that could be considered in future research (that this study does not address in detail) is why do environmental inequalities arise? In other words, why do certain communities experience worse air quality than other communities? At the national scale, which this study is undertaken at, it is clear that emission sources are concentrated in urban areas, particularly road transport sources, which is historically where the most deprived areas tend to be.26 Therefore, the patterns seen in the analysis arise. Inequalities persist due to the limited economic ability of different communities to move from the area that they currently live in, to less deprived areas, where air quality may be better. In addition, there are likely to be other factors affecting relocation, for example, good employment opportunities in urban areas, established social links within communities, ability to sell property etc. 26 There are exceptions to this, including in Wales, where a significant proportion of deprived communities are located in lower road transport pollution areas (such as the South Wales valleys). In Northern Ireland, an important contributor is the higher use of solid fuels in more deprived communities (although this contribution is being reduced with the ongoing refurbishment of the social housing stock). It is also interesting to note that many wealthy communities also live in highly polluted areas e.g. Central London.
AEAT/ENV/R/2170 Air Quality and Social Deprivation in the UK Final Report v1.1
netcen 87
Local factors that give rise to inequalities at a community scale cannot be determined at this analysis scale. These might include the following:
� Public participation and engagement in proposed developments e.g. more deprived communities less able to prevent or protest against development that would lead to higher emissions, such as a retail park or new road
� Significant differences in house prices, leading to poorer socio-economic groups living in houses nearer busy roads, or in closer proximity to industrial areas, within the same census area
� Communities based in certain areas for historic reasons, that have subsequently become areas with significant emission sources
� Households living in social housing rather than as owner-occupiers, and therefore being limited to an allocated residence
These local factors are not picked up in this analysis due to scale of the analysis and resolution of the data. Such factors would need to be investigated at a local level; such an investigation could be an important function of a local authority when assessing the impacts of abatement options e.g. establishment of AQMAs. For national air quality policy, the focus has to be on reducing air pollution so that all communities have good air quality, with specific communities not disadvantaged. The specific reasons for the persistence of trends is unlikely to be an important factor, as Defra aims towards improving air quality across all communities.

AEAT/ENV/R/2170 Air Quality and Social Deprivation in the UK Final Report v1.1
netcen 88
References
Acheson D (1998), Independent Inquiry into Inequalities in Health report, Published by The Stationery Office (ISBN 0 11 322173 8), HMSO Asthma UK (2004), Where Do We Stand? Asthma in the UK Today, Published December 2004, www.asthma.org.uk/ Bush T (2000), Article 5 Assessment of nitrogen dioxide, PM10, sulphur dioxide and lead in the UK, Report for DETR. AEA Technology (November 2005) Council Directive 96/62/EC (1996), of 27th September 1996, on ambient air quality assessment and management (The Framework Directive), Official Journal of the European Communities (21.11.1996, EN Series, L296/55) Council Directive 99/30/EC (1999), of 22nd April 1999, relating to limit values for sulphur dioxide, nitrogen dioxide and oxides of nitrogen, particulate matter, and lead in ambient air (The First Daughter Directive), Official Journal of the European Communities (29.6.1999, EN Series, L163/41) Council Directive 2002/3/EC (2002), of 12th February 2002, relating to ozone in ambient air (The Third Daughter Directive), Official Journal of the European Communities (9.3.2002, EN Series, L67/14) Defra (2006), An Economic Analysis to Inform the Air Quality Strategy Review Consultation - Third Report of the Interdepartmental Group on Costs and Benefits, April 2006 DETR (2000), The Air Quality Strategy for England, Scotland, Wales and Northern Ireland, Department of the Environment, Transport and the Regions, The Scottish Executive, The National Assembly for Wales and the Department of the Environment for Northern Ireland Dore C, Watterson J, Murrells T, Passant N, Hobson M, Baggott S, Thistlethwaite G, Goodwin J, King K, Adams M, Walker C, Downes M, Coleman P, Stewart R, Wagner A, Sturman J, Connolly C, Lawrence H and Cumine P (2005), UK Emissions of Air Pollutants 1970 to 2002 (17th annual report from the UK National Atmospheric Emissions Inventory (NAEI)), Published October 2005 on behalf of Defra. Dore C, Watterson J, Goodwin J, Murrells T, Passant N, Hobson M, Baggott S, Thistlethwaite G, Coleman P, King K, Adams M and Cumine P (2004), UK Emissions of Air Pollutants 1970 to 2002 (16th annual report from the UK National Atmospheric Emissions Inventory (NAEI)), Published October 2004 on behalf of Defra. Environment Agency (2002), The urban environment in England and Wales – a detailed assessment, Bristol, Environment Agency Fairburn J, Walker G, Smith G and Mitchell G (2005), Investigating Environmental Justice in Scotland: links between measures of environmental quality and social deprivation, Published by SNIFFER (Project UE4(03)01) FOE (2000), Pollution injustice, Published by Friends of the Earth, London
AEAT/ENV/R/2170 Air Quality and Social Deprivation in the UK Final Report v1.1
netcen 89
FOE (2001), Pollution and Poverty – Breaking the Link, Published by Friends of the Earth, London Grice S, Bush T, Stedman J, Vincent K, Kent A and Targa J (2005), Baseline projections of Air Quality in the UK for the 2005 Review of the Air Quality Strategy, Report No. AEAT/ENV/R/1936, Draft Report to The Department for Environment, Food and Rural Affairs, Welsh Assembly Government, the Scottish Executive and the Department of the Environment for Northern Ireland HMSO (2005), Securing the Future – UK Government sustainable development strategy, Launched on 7th March 2005, http://www.sustainable-development.gov.uk/ Hobson M (2005), Emission projections – Baseline 2002 projections, A report for AEQ, Defra, Published in January 2005. Hurley F, Hunt A, Cowie H, Holland M, Miller B, Pye S and Watkiss P (2005), Methodology for the Cost-Benefit analysis for CAFÉ - Volume 2: Health Impact Assessment, Service Contract for Carrying out Cost-Benefit Analysis of Air Quality Related Issues, in particular in the Clean Air for Europe (CAFE) Programme, European Commission, February 2005 King K and Pye S (2005), Social Deprivation and Air Quality Policy Analysis (Task 3), Interim Report 1 to Defra, Report No. AEAT/ENV/R/1947 (March 2005) King K and Stedman J (2000), Analysis of Air Pollution and Social Deprivation, Report No. AEAT/ENV/R/0241, AEA Technology on behalf of Defra and the Devolved Administrations Mitchell G (2002), The Response of Urban Air Quality to Strategic Road Transport Initiatives: An Environmental Justice Analysis of Leeds, UK, Environment and Planning A, April 2002. Mitchell G and Walker G (2003), Environmental Quality and Social Deprivation – Phase I: A Review of Research and Analytical Methods, R&D Project Record E2-067/1/PR1, Environment Agency. Mitchell G and Dorling D (2003), An Environmental Justice Analysis of British Air Quality, Environment and Planning A, 35, p909-929 Mitchell G (2005, in press), Forecasting environmental equity: air quality responses to road user charging in Leeds. Journal of Environmental Management NAW (2005), Welsh Index of Multiple Deprivation 2005, National Assembly for Wales, Cardiff NAW (2000), Welsh Index of Multiple Deprivation, National Assembly for Wales, Cardiff. Compiled by Social Disadvantage Research Centre (SDRC), Oxford University NISRA (2005b), Northern Ireland Multiple Deprivation Measure 2005, Published May 2005 by Northern Ireland Statistics and Research Agency. NISRA (2005), Report of the Inter-Departmental Urban-Rural Definition Group - Statistical Classification and Delineation of Settlements, February 2005, Northern Ireland Statistics and Research Agency NISRA (2001), Measures of Deprivation in Northern Ireland, Study by Social Disadvantage Research Centre (SDRC), Oxford University, on behalf of Northern Ireland Statistics and Research Agency.

AEAT/ENV/R/2170 Air Quality and Social Deprivation in the UK Final Report v1.1
netcen 90
ODPM (2004), The English Indices of Deprivation 2004, Study by Social Disadvantage Research Centre (SDRC), Oxford University, on behalf of the Neighbourhood Renewal Unit, Office of the Deputy Prime Minister Pye S and Vincent K (2003), Determining the impact of domestic solid fuel burning on concentrations of PAHs and sulphur dioxide in Northern Ireland, A report produced for the Department for Environment, Food and Rural Affairs; the Scottish Executive; the National Assembly for Wales and the Department of the Environment in Northern Ireland, AEAT/ENV/R/1498, June 2003 Pye S, Sturman J and King K (2005), 2nd Interim report Pye S, Stedman J, Adams M and King K (2001), Further analysis of NO2 and PM10 Air Pollution and Social Deprivation, Report No. AEAT/ENV/R/0865, AEA Technology on behalf of Defra and the Devolved Administrations (excl. the Scottish Executive) Scottish Executive (2004), Scottish Index of Multiple Deprivation 2004, Summary Technical Report, Scottish Executive, Edinburgh Scottish Executive (2004b), Urban Rural classification 2003-2004, Office of the Chief Statistician, Environment and Rural Affairs Department (June 2004) SDRN (2004), Environment and Social Justice: Rapid Research and Evidence Review, Sustainable Development Research Network (co-ordinated by Policy Studies Institute) SEU (2001), A New Commitment to Neighbourhood Renewal - National Strategy Action Plan, A Report by the Social Exclusion Unit, Cabinet Office (January 2001) Stedman J, Bush T, Vincent K, Kent A, Grice S and Abbot J (2005), UK air quality modelling for annual reporting 2003 on ambient air quality assessment under Council Directives 96/62/EC, 1999/30/EC and 2000/69/EC, Report to The Department for Environment, Food and Rural Affairs, Welsh Assembly Government, the Scottish Executive and the Department of the Environment for Northern Ireland Sturman J and King K (2005), GIS Dataset of Air Quality Management Areas, Report No. AEAT/ENV/R/1914, netcen (AEA Technology) on behalf of Defra and the Devolved Administrations Vincent K, Jones H, Holland M, Pye S and Hidri S (2003), Evaluation of the Costs and Benefits of Achieving Air Quality Targets for PAHs in Northern Ireland, Report No. AEAT/ENV/R/1620, On behalf of Department of Environment, Northern Ireland Walker G, Fairburn J, Smith G and Mitchell G (2003a), Environmental Quality and Social Deprivation, R&D Project Record E2-067/1/TR, Environment Agency. Walker G, Mitchell G, Fairburn J and Smith G (2003b), Environmental Quality and Social Deprivation - Phase II: National analysis of flood hazard, IPC industries and air quality, Research and Development Project Record 12615, Environment Agency, 120pp. (IPC analysis also published in Walker G, Mitchell G, Fairburn J. and Smith G. (2005), Industrial pollution and social deprivation: evidence and complexity in evaluating and responding to environmental inequality, Local Environment, 4, 361-371)

= = netcen
Annexes
Annex 1 Selected analysis graphs Annex 2 The use of area weighted pollution means compared to population
weighted means Annex 3 Exploring the difference in results based on revised and published
England IMD

= = netcen
Annex 1 Selected analysis graphs Multiple deprivation and pollutant concentrations – England analysis (Section 6.1)
NO2 pollutant concentrations (2003) in England vs.
deprivation decile
0
5
10
15
20
25
30
35
40
45
50
1 2 3 4 5 6 7 8 9 10
Deprivation deciles
NO2 concentrations (ug/m
3)
Least deprivedMost deprived
PM10 pollutant concentrations (2003) in England vs.
deprivation decile
10
12
14
16
18
20
22
24
26
28
30
1 2 3 4 5 6 7 8 9 10
Deprivation deciles
PM10 concentrations (ug/m
3)
Least deprivedMost deprived

= = netcen
O3 pollutant concentrations (2003) in England vs.
deprivation decile
30
35
40
45
50
55
60
65
70
75
80
1 2 3 4 5 6 7 8 9 10
Deprivation deciles
O3 concentrations (ug/m
3)
Least deprivedMost deprived
SO2 pollutant concentrations (2003) in England vs.
deprivation decile
0
20
40
60
80
100
120
140
160
180
200
1 2 3 4 5 6 7 8 9 10
Deprivation deciles
SO2 concentrations (ug/m
3)
Least deprivedMost deprived

= = netcen
Domains of deprivation and pollutant concentrations – England analysis (Section 6.4)
Mean NO2 concentrations (2003) in England by income, health and
housing deprivation deciles
20
22
24
26
28
30
32
1 2 3 4 5 6 7 8 9 10
Deprivation Deciles
NO2 concentration (ug/m
3)
HOU Mean
HEA Mean
INC Mean
IMD Mean
Most deprived Least deprived
Mean O3 concentrations (2003) in England by income, health and
housing deprivation deciles
50
52
54
56
58
60
62
64
1 2 3 4 5 6 7 8 9 10
Deprivation Deciles
O3 concentration (ug/m
3)
HOU Mean
HEA Mean
INC Mean
IMD Mean
Most deprived Least deprived
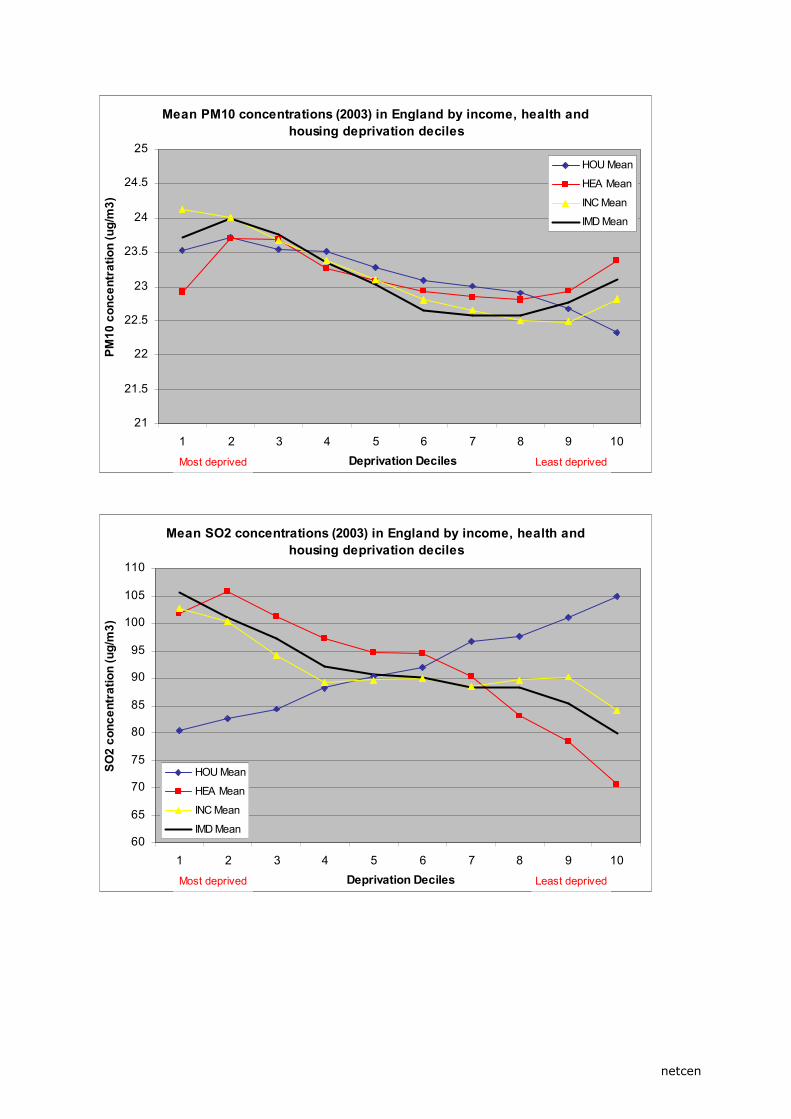
= = netcen
Mean PM10 concentrations (2003) in England by income, health and
housing deprivation deciles
21
21.5
22
22.5
23
23.5
24
24.5
25
1 2 3 4 5 6 7 8 9 10
Deprivation Deciles
PM10 concentration (ug/m
3)
HOU Mean
HEA Mean
INC Mean
IMD Mean
Most deprived Least deprived
Mean SO2 concentrations (2003) in England by income, health and
housing deprivation deciles
60
65
70
75
80
85
90
95
100
105
110
1 2 3 4 5 6 7 8 9 10
Deprivation Deciles
SO2 concentration (ug/m
3)
HOU Mean
HEA Mean
INC Mean
IMD Mean
Most deprived Least deprived

= = netcen
Urban / rural deprivation and NO 2 pollutant concentrations by country (Section 7.3)
Mean NO2 concentrations (2003) in rural and urban areas of England
by deprivation decile
5
10
15
20
25
30
35
1 2 3 4 5 6 7 8 9 10
Deprivation deciles
NO2 concentration (ug/m
3)
England mean
Urban mean
Rural mean
Most deprived Least deprived
Mean NO2 concentrations (2003) in rural and urban areas of Scotland
by deprivation decile
0
5
10
15
20
25
30
35
1 2 3 4 5 6 7 8 9 10
Deprivation deciles
NO2 concentration (ug/m
3)
Urban mean
Rural mean
Scot mean
Most deprived Least deprived

= = netcen
Mean NO2 concentrations (2003) in rural and urban areas of Wales by
deprivation decile
0
5
10
15
20
25
30
35
1 2 3 4 5 6 7 8 9 10
Deprivation deciles
NO2 concentration (ug/m
3)
Urban mean
Rural mean
Wales mean
Most deprived Least deprived
Mean NO2 concentrations (2003) in rural and urban areas of NI by
deprivation decile
0
5
10
15
20
25
1 2 3 4 5 6 7 8 9 10
Deprivation deciles
NO2 concentration (ug/m
3)
Urban mean
Rural mean
NI mean
Most deprived Least deprived
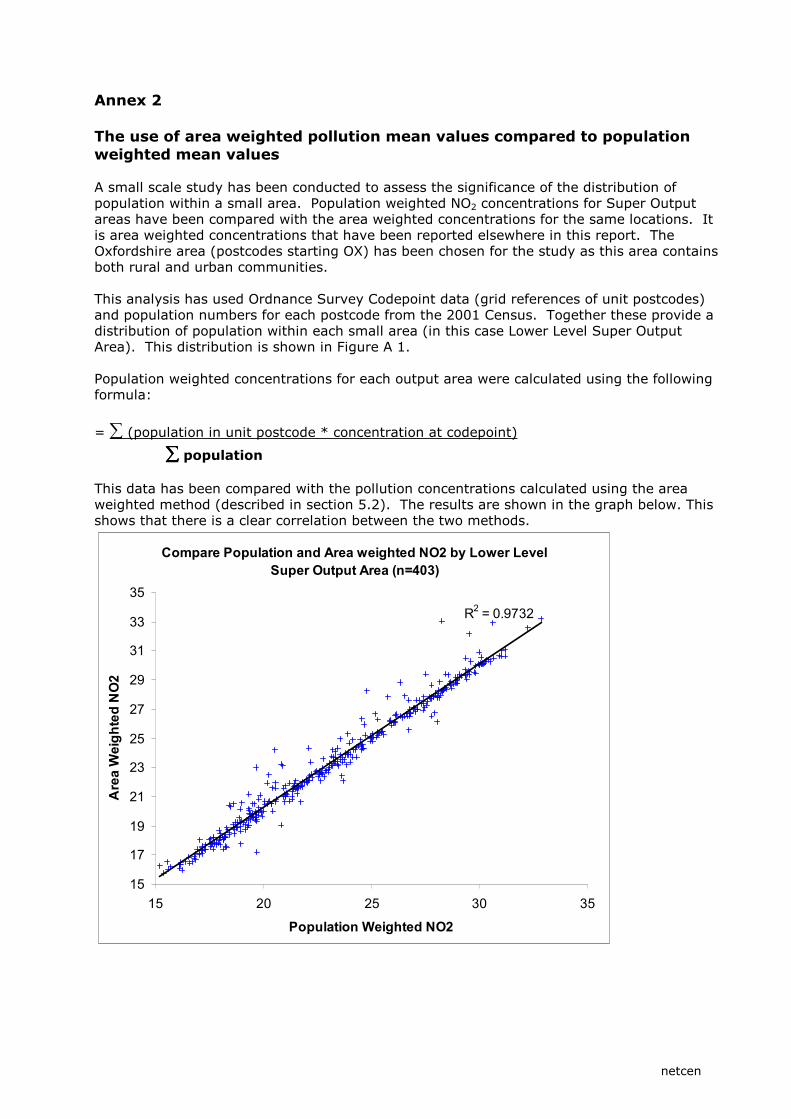
= = netcen
Annex 2
The use of area weighted pollution mean values compared to population
weighted mean values A small scale study has been conducted to assess the significance of the distribution of population within a small area. Population weighted NO2 concentrations for Super Output areas have been compared with the area weighted concentrations for the same locations. It is area weighted concentrations that have been reported elsewhere in this report. The Oxfordshire area (postcodes starting OX) has been chosen for the study as this area contains both rural and urban communities. This analysis has used Ordnance Survey Codepoint data (grid references of unit postcodes) and population numbers for each postcode from the 2001 Census. Together these provide a distribution of population within each small area (in this case Lower Level Super Output Area). This distribution is shown in Figure A 1. Population weighted concentrations for each output area were calculated using the following formula:
= ∑ (population in unit postcode * concentration at codepoint)
∑∑∑∑ population This data has been compared with the pollution concentrations calculated using the area weighted method (described in section 5.2). The results are shown in the graph below. This shows that there is a clear correlation between the two methods.
Compare Population and Area weighted NO2 by Lower Level
Super Output Area (n=403)
R2 = 0.9732
15
17
19
21
23
25
27
29
31
33
35
15 20 25 30 35
Population Weighted NO2
Area W
eighted NO2
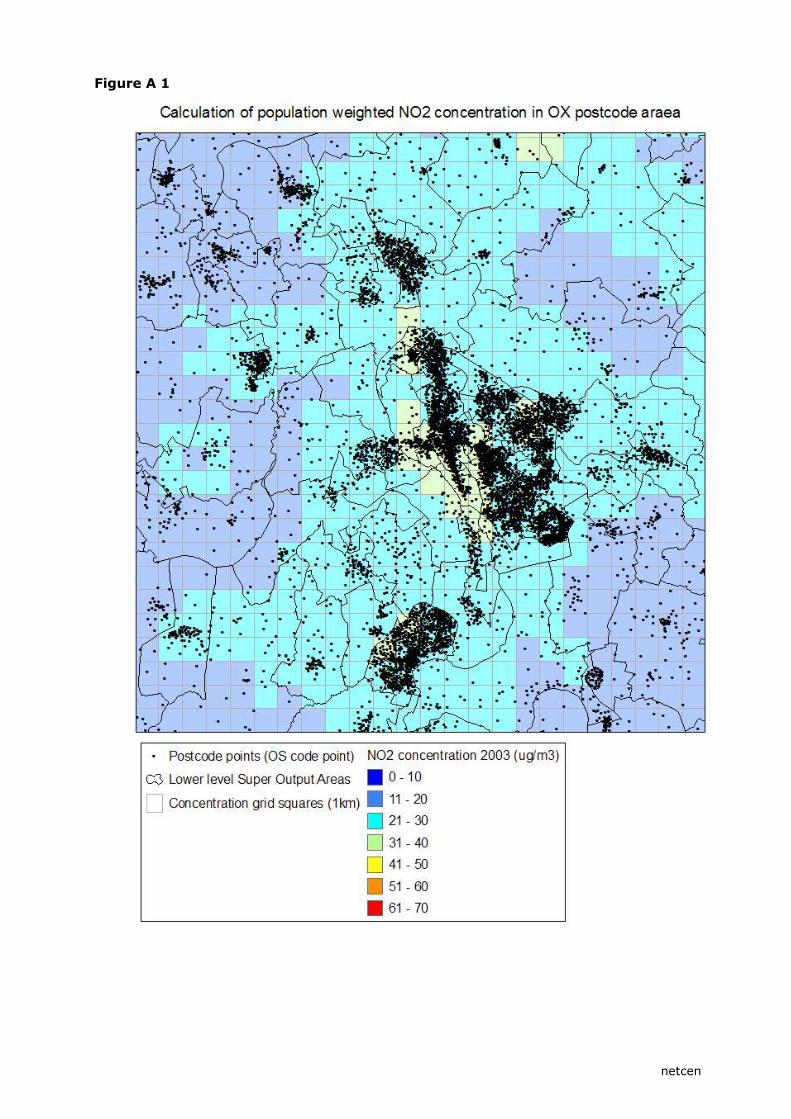
= = netcen
Figure A 1
= = netcen
Annex 3
Exploring the difference in results based on revised and published England
IMD In the analysis for England, a revised Index of Multiple Deprivation (IMD) has been used, not the published index (as described in ODPM 2004). The revised index was constructed to avoid any potential bias in the analysis due to the inclusion of an air quality indicator in the published index. The construction of the revised index is described in section 5.2. In summary, it is the IMD without the Living Environment domain (which included the air quality indicator). In order to assess the potential bias, we have undertaken some simple comparisons of analysis results from the first interim report (Pye 2005), where the published Index was used, and the analysis in this report, which uses the revised index. NO2 and PM10 data have been compared, and the results are shown in Figure A 2. SO2 and ozone have not been considered. Although SO2 emissions have been used in the air quality indicator, they are unlikely to be that closely correlated with modelled SO2 concentrations, particularly as we are using the 99.9th percentile metric in this analysis. Ozone, of course, is not used in the indicator, as the indicator is based on emissions of specific pollutants. For NO2, slightly marginally lower average concentrations can be seen in the most deprived deciles when comparing the revised index to the official index, while slightly higher average concentrations can be seen in the least deprived deciles. The same pattern can be observed for PM10. This does suggest that the exclusion of the Living Environment domain does have an impact, albeit small, on the trend; how much of this is due to the air quality indicator as opposed to the other Living Environment indicators is difficult to tell, and would only be possible through closer examination of the indicator data itself. In summary, in using the official IMD, the inequalities in distribution are marginally higher, with more deprived deciles experiencing higher average concentrations, and less deprived deciles experiencing lower average concentrations. Whether this is specifically due to the influence of the air quality indicator is very difficult to say. What is clear, however, is that the overall conclusions from this analysis are not significantly changed by the use of the revised index instead of the published index.

= = netcen
Figure A 2
Trend comparison between official and revised IMD
England NO2 (2003)
22
23
24
25
26
27
28
29
30
31
1 2 3 4 5 6 7 8 9 10
Deprivation deciles
NO2 concentrations (ug/m
3)
Official
Revised
Trend comparison between official and revised IMD
England PM10 (2003)
22
23
24
25
1 2 3 4 5 6 7 8 9 10
Deprivation deciles
PM10 concentrations (ug/m
3)
Official
Revised