Embed Size (px)
Citation preview

8/6/2019 Alekhya Sip Reportfinalll
http://slidepdf.com/reader/full/alekhya-sip-reportfinalll 1/80
CHAPTER 1
INTRODUCTION
1
8/6/2019 Alekhya Sip Reportfinalll
http://slidepdf.com/reader/full/alekhya-sip-reportfinalll 2/80
Financial planning overview
Financial Planning cultivates a positive attitude towards saving and investment. The
process of identifying the financial needs and setting them up as a goal changes the
way people look at their investment. Proper saving no longer remains a residual
activity it becomes a priority. Their goals give them idea about this. This givesdirection and meaning to individual financial decisions. The individual sees these
decisions as a part of whole process of planning and is able to make meaningful
decisions. He understands the short term and long-term effect of his financial
decisions on his goals. People often invest in various asset classes:
• To beat Inflation
• To fund future needs
• To meet contingencies
• To maintain same standard of living after retirement
Although, it is not possible for an individual investor to understand mutual fund
institutions and investing in such an environment, the process can become fairly time
consuming. Mutual funds (whose fund managers are paid to understand these issues
and whose Asset Management Company invests in research) provide an option of
investing without getting lost in the complexities.
The mutual fund industry has been growing at the annual growth rate of 25% to 30%
in terms of Asset under Management (AUM) in the last few years. Currently, the
industry’s AUM is more than Rs. 8 crores as on May 2010 .
Purpose of the study
The purpose of the study is to compare the HDFC mutual funds with its competitors
DSP Black Rock and Birla Sun Life Mutual Fund
Objective of the study
To evaluate the performance of HDFC mutual fund with its selected competitors DSP
Black Rock and Birla Sun Life Mutual Fund
Significance of Project
Stock markets are slowly recovering around the globe after the great financial crisis.
Hence in India there is a great scope for channelizing the savings of the people into
the mutual funds. This project enables us to determine if HDFC mutual fund is better
choice for investors to invest.
2

8/6/2019 Alekhya Sip Reportfinalll
http://slidepdf.com/reader/full/alekhya-sip-reportfinalll 3/80
Limitations of the study
The following are the limitations of the study
• The study deals with only selected mutual funds and similar products offered by
those mutual funds.
• The study is limited to some of the products of Hdfc due to time constrain.• In the study, some of parameter values are not found due to which I couldn’t
compare based on those parameters.
•The data was analyzed for the month of may and it may be changing over a period of
time.
3

8/6/2019 Alekhya Sip Reportfinalll
http://slidepdf.com/reader/full/alekhya-sip-reportfinalll 4/80
CHAPETR 2
METHODOLOGY
4
8/6/2019 Alekhya Sip Reportfinalll
http://slidepdf.com/reader/full/alekhya-sip-reportfinalll 5/80
Sampling
In order to carry out the comparison, Birla Sun Life Mutual Fund, DSP Black Rock
were chosen. For both the fund houses, the study have randomly chosen four
categories of funds, Equity funds, Equity linked savings schemes, Balanced funds,
Debt funds.
Data Collection
All the data used in this study were secondary data which were mainly collected from
the websites, Fact sheets.
Evaluation Parameters
Following are the evaluation parameters based on which the analysis and comparison
of various schemes is done.Net asset value (NAV)
The value of a collective investment fund based on the market price of securities held
in its portfolio. NAV per share is calculated by dividing net assets of the scheme
/number of Units outstanding. It is the price per share or exchange-traded funds
(ETFs). The higher the value of NAV better is the performance. The reason is the trust
the fund enjoys over a period. Mutual funds pay out virtually all of their income and
capital gains. As a result, changes in NAV are not the best gauge of mutual fund
performance, which is best measured by annual total return.
Expense Ratio
A measure of what it costs an investment company to operate a mutual fund. An
expense ratio is determined through an annual calculation, where a fund's operating
expenses are divided by the average dollar value of its assets under management.
Operating expenses are taken out of a fund's assets and this lowers the return to a
fund's investors.The lower the expense ratio the better is the performance of the
mutual fund. This means that the fund is spending fewer amounts on day-to-day
expenses and eliminating unnecessary burden on investors.
Assets under Management
This is the market value of assets managed by an investment company on behalf of its
investors. Asset under management (AUM) is looked at as a measure of success
5

8/6/2019 Alekhya Sip Reportfinalll
http://slidepdf.com/reader/full/alekhya-sip-reportfinalll 6/80
against the competition. It consists of growth/decline due to both capital
appreciation/losses and new money inflow/outflow.
A higher AUM portrays that the fund is better compared to one having a lower AUM.
BetaBeta is a measure of the volatility, or systematic risk, of a security or a portfolio in
comparison to the market as a whole. Beta is used in the capital asset pricing model
(CAPM), a model that calculates the expected return of an asset based on its beta and
expected market returns.A mutual fund that seesaws in perfect sync with the market
has a beta of 1.0. Portfolios that are more volatile relative to the underlying
benchmark, such as aggressive-growth funds, have betas greater than 1.0; more
conservative investments have coefficients of less than 1.0.
R-squared
This statistical measure represents the percentage of a fund or security's movements
that can be explained by movements in a benchmark index. For fixed-income
securities, the benchmark is the T-bill. For equities, the benchmark is the S&P 500. R-
squared ranges from 0 to 100 and reflects the percentage of a fund's movements that
are explained by movements in its benchmark index. An R-squared of 100 means that
all movements of a fund are completely explained by movements in the index.
Conversely, a low R-squared indicates that very few of the fund's movements are
explained by movements in its benchmark index.
Portfolio Turnover
It is a measure of how frequently assets within a fund are bought and sold by the
managers.Portfolio turnover is calculated by taking either the total amount of new
securities purchased or the amount of securities sold - whichever is less - over a
particular period,divided by the total net asset value (NAV) of the fund. The
measurement is usually reported for a 12-month time period.Mutual funds with high
portfolio turnover tend to whack their investors with taxes at the end of the year. Thesame generally holds for individual investors – the higher the turnover, the poorer the
performance.
6
8/6/2019 Alekhya Sip Reportfinalll
http://slidepdf.com/reader/full/alekhya-sip-reportfinalll 7/80
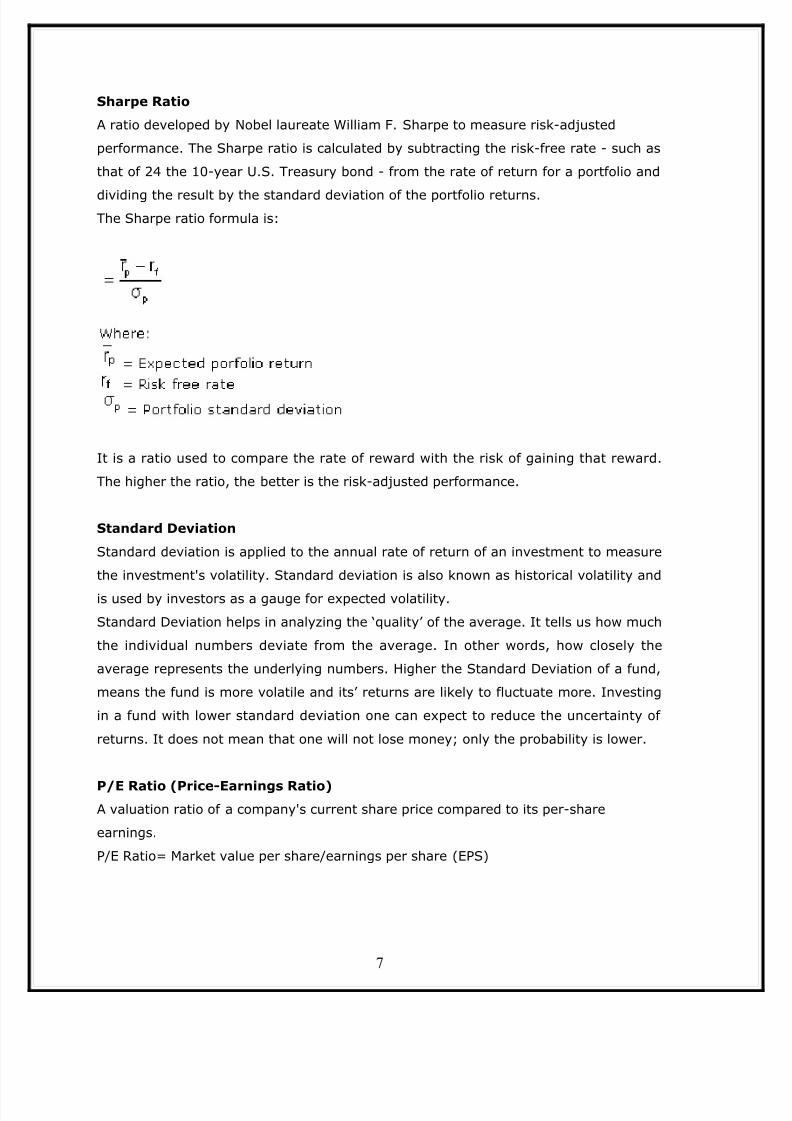
Sharpe Ratio
A ratio developed by Nobel laureate William F. Sharpe to measure risk-adjusted
performance. The Sharpe ratio is calculated by subtracting the risk-free rate - such as
that of 24 the 10-year U.S. Treasury bond - from the rate of return for a portfolio and
dividing the result by the standard deviation of the portfolio returns.The Sharpe ratio formula is:
It is a ratio used to compare the rate of reward with the risk of gaining that reward.
The higher the ratio, the better is the risk-adjusted performance.
Standard Deviation
Standard deviation is applied to the annual rate of return of an investment to measure
the investment's volatility. Standard deviation is also known as historical volatility and
is used by investors as a gauge for expected volatility.
Standard Deviation helps in analyzing the ‘quality’ of the average. It tells us how much
the individual numbers deviate from the average. In other words, how closely the
average represents the underlying numbers. Higher the Standard Deviation of a fund,
means the fund is more volatile and its’ returns are likely to fluctuate more. Investing
in a fund with lower standard deviation one can expect to reduce the uncertainty of
returns. It does not mean that one will not lose money; only the probability is lower.
P/E Ratio (Price-Earnings Ratio)A valuation ratio of a company's current share price compared to its per-share
earnings.
P/E Ratio= Market value per share/earnings per share (EPS)
7
8/6/2019 Alekhya Sip Reportfinalll
http://slidepdf.com/reader/full/alekhya-sip-reportfinalll 8/80
P/B Ratio (Price-To-Book Ratio)
Companies with higher growth rates command higher P/E ratios. Confidence that a
company will improve its profitability or remain profitable generally results in a higher
P/E ratio. If profits are threatened or weak, the P/E ratio is likely to drop. A ratio used
to compare a stock's market value to its book value. It is calculated by dividing thecurrent closing price of the stock by the latest quarter's book value per share. It is
also known as the "price-equity ratio" and is calculated as:
P/B ratio=stock price/(total assets-intangible assets and liabilities)
A lower P/B ratio could mean that the stock is undervalued. However, it could also
mean that something is fundamentally wrong with the company. As with most ratios,
this varies by industry. This ratio also gives some idea of whether you are paying too
much, for what would be left if the company went bankrupt immediately.
Alpha
It is a measure of performance on a risk-adjusted basis. Alpha takes the volatility
(price risk) of a mutual fund and compares its risk-adjusted performance to a
benchmark index. The excess return of the fund relative to the return of the
benchmark index is a fund's alpha.
A positive alpha of 1.0 means the fund has outperformed its benchmark index by 1%.
Correspondingly, a similar negative alpha would indicate an underperformance of 1%.
8

8/6/2019 Alekhya Sip Reportfinalll
http://slidepdf.com/reader/full/alekhya-sip-reportfinalll 9/80
CHAPTER 3
INDUSTRY OVERVIEW
9
8/6/2019 Alekhya Sip Reportfinalll
http://slidepdf.com/reader/full/alekhya-sip-reportfinalll 10/80
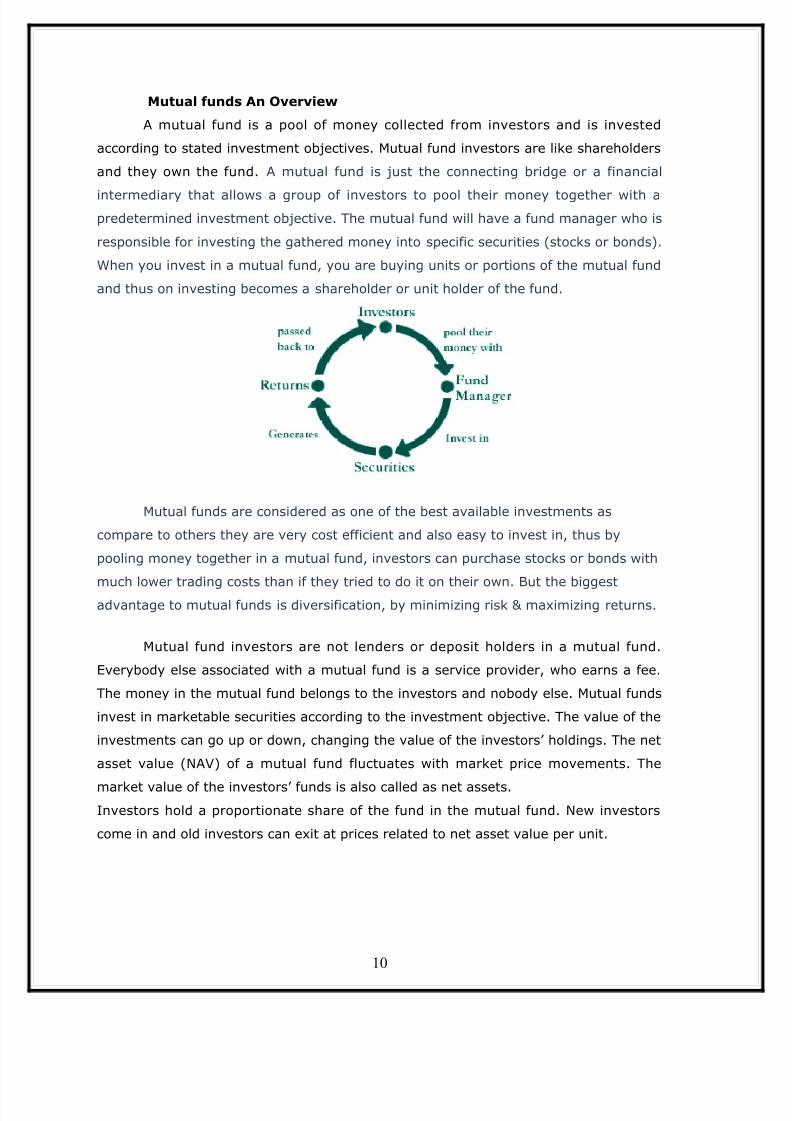
Mutual funds An Overview
A mutual fund is a pool of money collected from investors and is invested
according to stated investment objectives. Mutual fund investors are like shareholders
and they own the fund. A mutual fund is just the connecting bridge or a financial
intermediary that allows a group of investors to pool their money together with apredetermined investment objective. The mutual fund will have a fund manager who is
responsible for investing the gathered money into specific securities (stocks or bonds).
When you invest in a mutual fund, you are buying units or portions of the mutual fund
and thus on investing becomes a shareholder or unit holder of the fund.
Mutual funds are considered as one of the best available investments as
compare to others they are very cost efficient and also easy to invest in, thus by
pooling money together in a mutual fund, investors can purchase stocks or bonds with
much lower trading costs than if they tried to do it on their own. But the biggest
advantage to mutual funds is diversification, by minimizing risk & maximizing returns.
Mutual fund investors are not lenders or deposit holders in a mutual fund.
Everybody else associated with a mutual fund is a service provider, who earns a fee.
The money in the mutual fund belongs to the investors and nobody else. Mutual funds
invest in marketable securities according to the investment objective. The value of the
investments can go up or down, changing the value of the investors’ holdings. The net
asset value (NAV) of a mutual fund fluctuates with market price movements. The
market value of the investors’ funds is also called as net assets.Investors hold a proportionate share of the fund in the mutual fund. New investors
come in and old investors can exit at prices related to net asset value per unit.
10
8/6/2019 Alekhya Sip Reportfinalll
http://slidepdf.com/reader/full/alekhya-sip-reportfinalll 11/80
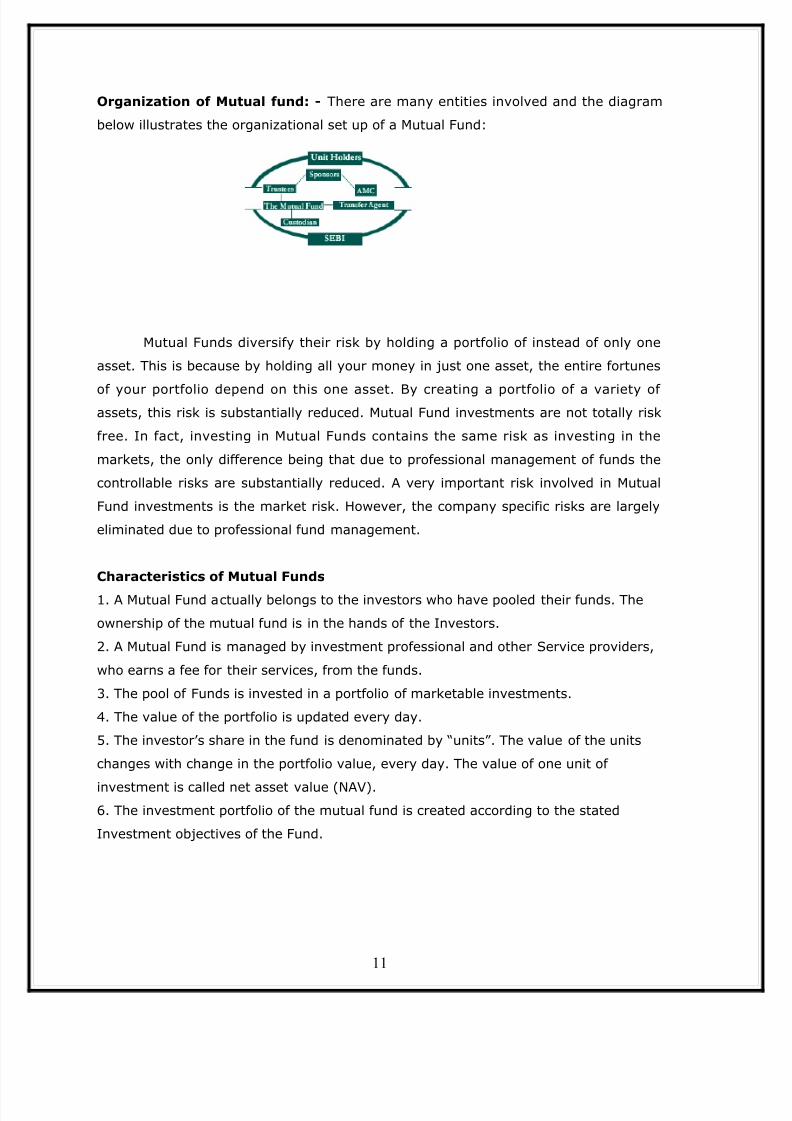
Organization of Mutual fund: - There are many entities involved and the diagram
below illustrates the organizational set up of a Mutual Fund:
Mutual Funds diversify their risk by holding a portfolio of instead of only one
asset. This is because by holding all your money in just one asset, the entire fortunes
of your portfolio depend on this one asset. By creating a portfolio of a variety of assets, this risk is substantially reduced. Mutual Fund investments are not totally risk
free. In fact, investing in Mutual Funds contains the same risk as investing in the
markets, the only difference being that due to professional management of funds the
controllable risks are substantially reduced. A very important risk involved in Mutual
Fund investments is the market risk. However, the company specific risks are largely
eliminated due to professional fund management.
Characteristics of Mutual Funds
1. A Mutual Fund actually belongs to the investors who have pooled their funds. The
ownership of the mutual fund is in the hands of the Investors.
2. A Mutual Fund is managed by investment professional and other Service providers,
who earns a fee for their services, from the funds.
3. The pool of Funds is invested in a portfolio of marketable investments.
4. The value of the portfolio is updated every day.
5. The investor’s share in the fund is denominated by “units”. The value of the units
changes with change in the portfolio value, every day. The value of one unit of
investment is called net asset value (NAV).6. The investment portfolio of the mutual fund is created according to the stated
Investment objectives of the Fund.
11
8/6/2019 Alekhya Sip Reportfinalll
http://slidepdf.com/reader/full/alekhya-sip-reportfinalll 12/80
Objectives of Mutual fund
1. To Provide an opportunity for lower income groups to acquire without much
difficulty, property in the form of shares.
2. To Cater mainly of the need of individual investors, whose means are small.
3. To Manage investors portfolio that provides regular income, growth, Safety,liquidity, tax advantage, professional management and diversification.
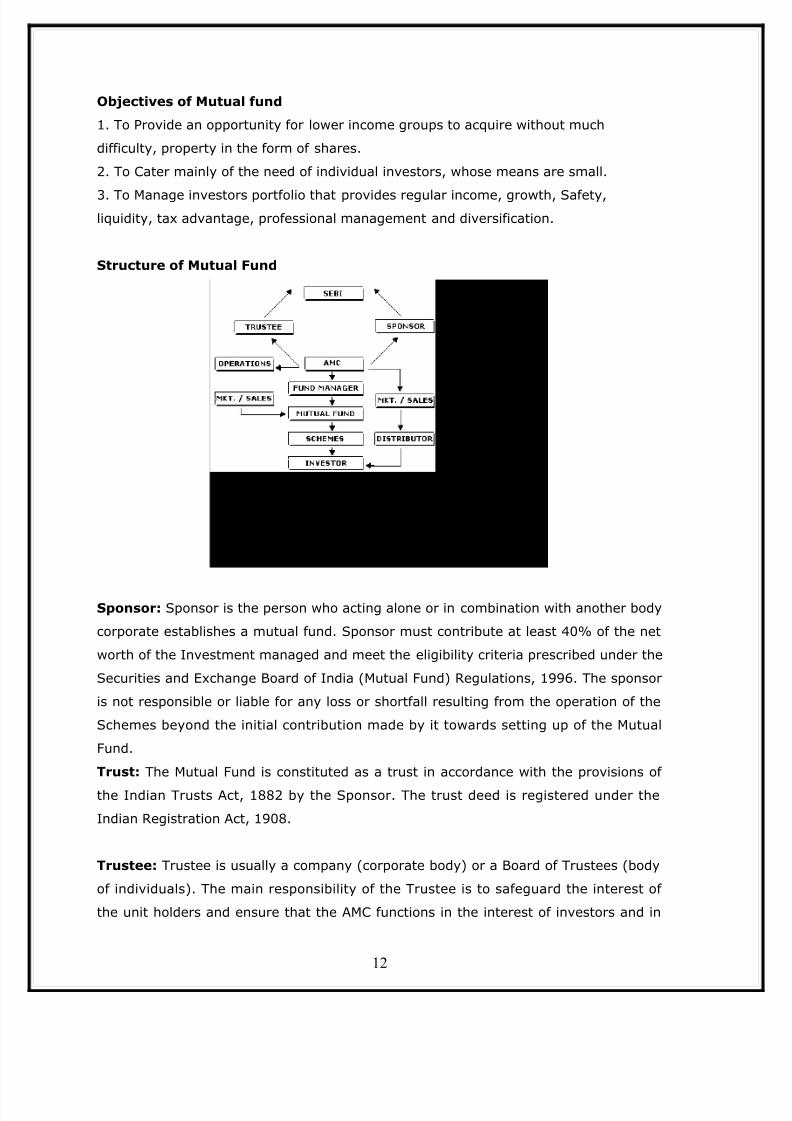
Structure of Mutual Fund
Sponsor: Sponsor is the person who acting alone or in combination with another body
corporate establishes a mutual fund. Sponsor must contribute at least 40% of the net
worth of the Investment managed and meet the eligibility criteria prescribed under the
Securities and Exchange Board of India (Mutual Fund) Regulations, 1996. The sponsor
is not responsible or liable for any loss or shortfall resulting from the operation of the
Schemes beyond the initial contribution made by it towards setting up of the Mutual
Fund.
Trust: The Mutual Fund is constituted as a trust in accordance with the provisions of
the Indian Trusts Act, 1882 by the Sponsor. The trust deed is registered under the
Indian Registration Act, 1908.
Trustee: Trustee is usually a company (corporate body) or a Board of Trustees (body
of individuals). The main responsibility of the Trustee is to safeguard the interest of
the unit holders and ensure that the AMC functions in the interest of investors and in
12
8/6/2019 Alekhya Sip Reportfinalll
http://slidepdf.com/reader/full/alekhya-sip-reportfinalll 13/80
accordance with the Securities and Exchange Board of India (Mutual Funds)
Regulations, 1996, the provisions of the Trust Deed and the Offer Documents of the
respective Schemes. At least 2/3rd directors of the Trustee are independent directors
who are not associated with the Sponsor in any manners.
Regulatory of Mutual Fund in India
• Role of SEBI: The capital market regulates the mutual funds in India. SEBI
requires all mutual funds to be registered with them. SEBI issues guidelines
for all mutual funds operations-investment, accounts, expenses etc. Recently,
it has been decided that Money Market Mutual Funds of registered mutual
funds will be regulated by SEBI through (Mutual Fund) Regulations 1996.
• Role of RBI : A supervisor of the Banks owned Mutual Funds-As banks in
India come under the regulatory Jurisdiction of RBI, banks owned funds to be
under supervision of RBI and SEBI. RBI has supervisory responsibility over all
entities that operate in the money markets.
• Role of Ministry of Finanace(MOF) : Ministry of Finance ultimately
supervises both the RBI and the SEBI and plays the role of apex authority for
any major disputes over SEBI guidelines.
• Role of Company Law Board : Registrar of companies is called Company
Low Board. AMCs of Mutual Funds are companies registered under the
companies Act 1956 .
• Role of Stock Exchange Stock Exchanges are Self-regulatory organizations
supervised by SEBI. Many closed ended funds of AMCs are listed as stock
exchanges and are traded like shares.
• Role of office of the public trustee: Mutual Fund being public trust is
governed by the Indian Trust Act 1882. The Board of trustee or the TrusteesCompany is accountable to the office of public trustee, which in turn reports
to the Charity commissioner. transaction, online RTGS, clearing system helps
the industry a lot.
13
8/6/2019 Alekhya Sip Reportfinalll
http://slidepdf.com/reader/full/alekhya-sip-reportfinalll 14/80
Evolution of Mutual Funds in India
The formation of Unit Trust of India marked the evolution of the Indian mutual fund
industry in the year 1963. The primary objective at that time was to attract the smallinvestors and it was made possible through the collective efforts of the Government of
India and the Reserve Bank of India. The history of mutual fund industry in India can
be better understood divided into following phases:
• Phase I. Establishment and Growth of Unit Trust of India (1963-1987)
Unit Trust of India enjoyed complete monopoly when it was established in the
year 1963 by an act of Parliament. UTI was set up by the Reserve Bank of
India and it continued to operate under the regulatory control of the RBI untilthe two were de-linked in 1978 and the entire control was transferred in the
hands of Industrial Development Bank of India (IDBI). UTI launched its first
scheme in 1964, named as Unit Scheme 1964 (US-64), which attracted the
largest number of investors in any single investment scheme over the years. By
the end of 1987, UTI's assets under management (AUM) grew ten times to
Rs.6700crores.
• Phase II. Entry of Public Sector Funds (1987-1993)
The Indian mutual fund industry witnessed a number of public sector players
entering the market in the year 1987. In November 1987, SBI Mutual Fund
from the State Bank of India became the first non-UTI mutual fund in India.
SBI Mutual Fund was later followed by Canbank Mutual Fund, LIC Mutual Fund,
Indian Bank Mutual Fund, Bank of India Mutual Fund, GIC Mutual Fund and PNB
Mutual Fund. By 1993, the assets under management of the industry increased
seven times to Rs.47, 004 crores. However, UTI remained to be the leader with
about 80% market share.
• Phase III. Emergence of Private Sector Funds (1993-1996)
The permission given to private sector funds including foreign fund
management companies (most of them entering through joint ventures with
Indian promoters) to enter the mutual fund industry in 1993, provided a wide
range of choice to investors and more competition in the industry. Private funds
14
8/6/2019 Alekhya Sip Reportfinalll
http://slidepdf.com/reader/full/alekhya-sip-reportfinalll 15/80
introduced innovative products, investment techniques and investor-servicing
technology. By 1994-95, about 11 private sector funds had launched their
schemes.
•
Phase IV. Growth and SEBI Regulation (1996-2004)The mobilization of funds and the number of players operating in the industry
reached new heights as investors started showing more interest in mutual
funds. Investors' interests were safeguarded by SEBI and the Government
offered tax benefits to the investors in order to encourage them. SEBI (Mutual
Funds) Regulations, 1996 was introduced by SEBI that set uniform standards
for all mutual funds in India. The Union Budget in 1999 exempted all dividend
incomes in the hands of investors from income tax. Various Investor Awareness
Programmes were launched during this phase, both by Securities and Exchange
Board of India (SEBI) and Association of Mutual Funds of India (AMFI), with an
objective to educate investors and make them informed about the mutual fund
industry.
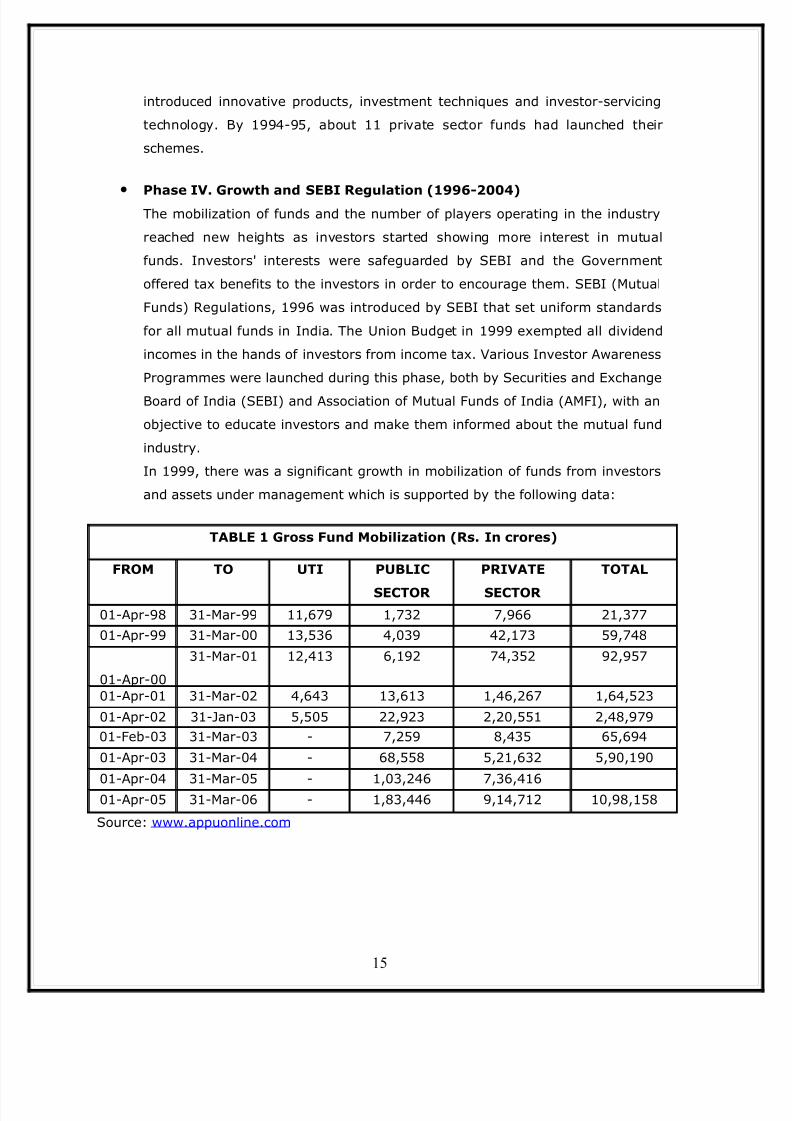
In 1999, there was a significant growth in mobilization of funds from investors
and assets under management which is supported by the following data:
TABLE 1 Gross Fund Mobilization (Rs. In crores)
FROM TO UTI PUBLIC
SECTOR
PRIVATE
SECTOR
TOTAL
01-Apr-98 31-Mar-99 11,679 1,732 7,966 21,37701-Apr-99 31-Mar-00 13,536 4,039 42,173 59,748
01-Apr-00
31-Mar-01 12,413 6,192 74,352 92,957
01-Apr-01 31-Mar-02 4,643 13,613 1,46,267 1,64,52301-Apr-02 31-Jan-03 5,505 22,923 2,20,551 2,48,97901-Feb-03 31-Mar-03 - 7,259 8,435 65,69401-Apr-03 31-Mar-04 - 68,558 5,21,632 5,90,190
01-Apr-04 31-Mar-05 - 1,03,246 7,36,41601-Apr-05 31-Mar-06 - 1,83,446 9,14,712 10,98,158
Source: www.appuonline.com
15
8/6/2019 Alekhya Sip Reportfinalll
http://slidepdf.com/reader/full/alekhya-sip-reportfinalll 16/80
• Phase V. Growth and Consolidation - 2004 Onwards
The industry has also witnessed several mergers and acquisitions recently,
examples of which are acquisition of schemes of Alliance Mutual Fund by Birla
Sun Life, Sun F&C Mutual Fund and PNB Mutual Fund by Principal Mutual Fund.Simultaneously, more international mutual fund players have entered India like
Fidelity, Franklin Templeton Mutual Fund etc. There were 29 funds as at the
end of March 2006. This is a continuing phase of growth of the industry through
consolidation and entry of new international and private sector players.
Mutual Fund Industry in India
Though the evolution of Mutual Fund industry was marked by the formation of UTI in
1963, the UTI Act was repealed in February 2003 and UTI was stripped of its Special
legal status as ‘a trust formed by an Act of Parliament’. The primary objective behind
this was to bring all mutual fund players on the same level.
Presently Unit Trust of India operates under the name of UTI Mutual Fund and its past
schemes (like US-64, Assured Return Schemes) are being gradually wound up.
However, UTI Mutual Fund is still the largest player in the industry.
The continuing phase of growth of the Mutual Fund industry through the consolidation
and entry of new international and private sector players can best be illustrated as
follows:
16

8/6/2019 Alekhya Sip Reportfinalll
http://slidepdf.com/reader/full/alekhya-sip-reportfinalll 17/80
Source: www.appuonline.com
Players in the Mutual Fund Industry
With the increase in mutual fund players in India, a need for mutual fund association
in India was generated to function as a non-profit organization. Association of Mutual
Funds in India (AMFI) was incorporated on 22nd August, 1995.
AMFI is the apex body of all Asset Management Companies (AMC) which has beenregistered with SEBI. Till date all the AMCs that have launched mutual fund schemes
are its members. It functions under the supervision and guidelines of its Board of
Directors.
Association of Mutual Funds India has brought down the Indian Mutual Fund Industry
to a professional and healthy market with ethical lines enhancing and maintaining
standards. It follows the principle of both protecting and promoting the interests of
mutual funds as well as their unit holders.
The Mutual fund performance can be known by its Net Asset Value (NAV). It is
disclosed on daily basis in case of open-ended schemes and on weekly basis in case of
close-ended schemes. It is necessary for all top mutual funds in to put their NAVs on
the web site of Association of Mutual Funds in India (AMFI). Thus the investors can
access NAVs of all mutual funds at one place.
Some of the major players on the Indian mutual fund scene are
17

8/6/2019 Alekhya Sip Reportfinalll
http://slidepdf.com/reader/full/alekhya-sip-reportfinalll 18/80
• ABN AMRO Mutual Fund Kotak Mahindra MutualFund
• Benchmark Mutual Fund LIC Mutual Fund
• Birla Mutual Fund Morgan Stanley Mutual Fund
• BOB Mutual Fund PRINCIPAL Mutual Fund
• Canbank Mutual Fund Prudential ICICI Mutual Fund
• Chola Mutual Fund Reliance Mutual Fund
• Deutsche Mutual Fund Sahara Mutual Fund
• DSP Merrill Lynch Mutual Fund SBI Mutual Fund
• Escorts Mutual Fund Standard Chartered Mutual Fund
• Fidelity Mutual Fund Sundaram Mutual Fund
• Franklin Templeton Investments Tata Mutual Fund
• HDFC Mutual Fund Taurus Mutual Fund
• HSBC Mutual Fund UTI Mutual Fund
• ING Vysya Mutual Fund JM Financial Mutual Fund
Factors impacting the industry
PEST Analysis (Political,Economical,Social,Technological)
Political Factors
• Government Regulation : SEBI regulates the industry and every decision
taken by them impact the industry very quickly.
• Stable constituency : The mutual fund industry can take long term decision
if the government is stable.
18
8/6/2019 Alekhya Sip Reportfinalll
http://slidepdf.com/reader/full/alekhya-sip-reportfinalll 19/80
• Fiscal policy : tax structure plays a very important role in the growth of the
industry .If the tax structure will be high than there will be less savings and
investment. We have seen the interest rate reducing continuously which boost
the industry to sell products which are better than the FDs, PF, NSC and KVPs.
Economic factors
• Market performance : The last five years witnessed a sharp rise in the
markets. The mutual fund industry basically works parallel with the markets.
Suppose, if the markets always be on downside, then the investors will not be
so comfortable to invest. This will reduce the market size drastically.
• Global Standards : As the industry will grow better, India being a global
economy, the MF industry has to match to the global mature MF markets.
They have to give due emphasis on product innovation, cost reduction andpenetration.
• Inflation : price rise affects interest rate and reduces the chances of
investment.
Social factors
• Consumer behaviour : this is very unpredictable and based on sentiments
gets changed very frequently, which sometimes makes selling of products
difficult.• Income : The rich people are in bigger cities, so the mutual fund industry is
much more concentrated there.
• Technological factors : This is the era of information technology and due to
net banking, online transaction, clearing system helps the industry a lot.
Types of Mutual Funds
Mutual Funds are of various categories according to their stated objectives. Mainly
their classifications are as follows:
1. Based on term or structure of fund:
• Open ended and closed ended fund
19
8/6/2019 Alekhya Sip Reportfinalll
http://slidepdf.com/reader/full/alekhya-sip-reportfinalll 20/80
2. Based on investment objective:
• Equity, Balanced and Debt fund
These funds are further sub-divided as follows:
• Equity funds consist of the following;
• Index fund
• Dividend yield fund
• Equity diversified fund
• Thematic fund
• Sector fund
• ELSS fund
Balanced fund further consists of the following:
• Debt-oriented fund and
• Equity-oriented fund
Debt funds are further subdivided into the following:
• Liquid fund
• Gilt fund
• Income fund
• FMPs(fixed maturity plan)
• Floating rate fund
• Arbitrage funds
• MIPs (monthly income plan)
20
8/6/2019 Alekhya Sip Reportfinalll
http://slidepdf.com/reader/full/alekhya-sip-reportfinalll 21/80
Mutual funds can also be categorized based on the following objectives:
1. Based on load charged:
• Load and no-load fund
2. Based on market capitalization:
• Small-cap, Mid-cap and Large-cap funds
3. Type of investors:
• Offshore and pension funds
4. Management style:
• Managed and index funds
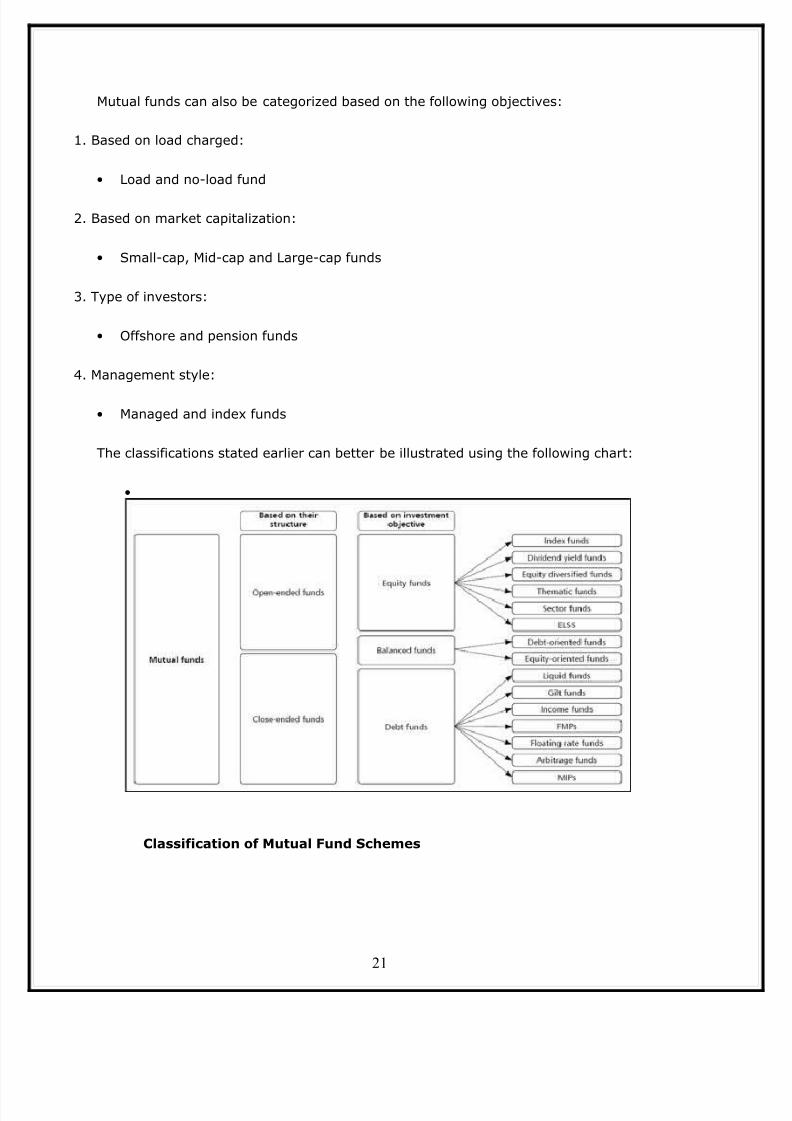
The classifications stated earlier can better be illustrated using the following chart:
•
Classification of Mutual Fund Schemes
21
8/6/2019 Alekhya Sip Reportfinalll
http://slidepdf.com/reader/full/alekhya-sip-reportfinalll 22/80
Classification of Mutual Fund schemes:
Schemes are classified as Close-ended or Open-ended depending upon whether they
give the investor the option to redeem at any time (open-ended) or whether the
investor has to wait till maturity of the scheme.
Open ended funds : The units offered by these schemes are available for sale and
repurchase on any business day at NAV based prices. Hence, the unit capital of the
schemes keeps changing each day. Such schemes thus offer very high liquidity to
investors. An open-ended fund is not obliged to keep selling/issuing new units at all
times, and may stop issuing further subscription to new investors.
Close-ended funds: These funds raise money from investors only once. Therefore,
after the offer period, fresh investments can not be made into the fund. If the fund is
listed on a stock exchange the units can be traded like stocks. Redemption of units can
be made during specified intervals. Therefore, such funds have relatively low liquidity.
Equity Schemes
These schemes, also commonly called Growth Schemes, seek to invest a majority of
their funds in equities and a small portion in money market instruments. Such
schemes have the potential to deliver superior returns over the long term. However,
because they invest in equities, these schemes are exposed to fluctuations in value
especially in the short term. Equity schemes are hence not suitable for investors
seeking regular income or needing to use their investments in the short-term. They
are ideal for investors who have a long-term investment horizon
.
Balanced fund
It is a mutual fund that buys a combination of common stock, preferred stock, bonds,
and short-term bonds, to provide both income and capital appreciation while avoiding
excessive risk. The purpose of balanced funds (also sometimes called hybrid funds) is
to provide investors with a single mutual fund that combines both growth and income
objectives, by investing in both stocks (for growth) and bonds (for income). Such
diversified holdings ensure that these funds will manage downturns in the stock
market without too much of a loss. The flip side, of course, is that balanced funds will
usually increase less than an all-stock fund during a bull market.
Debt Schemes
22
8/6/2019 Alekhya Sip Reportfinalll
http://slidepdf.com/reader/full/alekhya-sip-reportfinalll 23/80
These schemes, also commonly known as Income Schemes, invest in debt securities
such as corporate bonds, debentures and government securities. The prices of these
schemes tend to be more stable compared with equity schemes and most of the
returns to the investors are generated through dividends or steady capital
appreciation. These schemes are ideal for conservative investors or those who are notin a position to take higher equity risks.
Sector Specific Equity Schemes
These are the funds/schemes which invest in the securities of only those sectors or
industries as specified in the offer documents. e.g. Pharmaceuticals, Software, Fast
Moving Consumer Goods (FMCG), Petroleum stocks, etc. The returns in these funds
are dependent on the performance of the respective sectors/industries. While these
funds may give higher returns, they are more risky compared to diversified funds.
Investors need to keep a watch on the performance of those sectors/industries and
must exit at an appropriate time. In order to succeed, the sector of the sectoral fund
must be big enough, with enough stock and must have long term potential. An
investment in a Sectoral fund can have an impact only when it is held on for a long
term.
Tax Saving Schemes
Investors are being encouraged to invest in equity markets through Equity Linked
Savings Scheme (ELSS) by offering them a tax rebate. Here, the units purchasedcannot be assigned / transferred/ pledged / redeemed / switched - out until the
completion of 3 years from the date of allotment of the respective Units. The Scheme
is subject to SEBI (Mutual Funds) Regulations, 1996 and the notifications issued by
the Ministry of Finance (Department of Economic Affairs), Government of India
regarding ELSS. Subject to such conditions and limitations, subscriptions to the Units
not exceeding Rs.10, 000 would be eligible to a deduction, from income tax, of an
amount equal to 20% of the amount subscribed. Investors can also avail a tax benefit
of Rs.1 lakh under the section 80C of Income Tax Act, 1961.
Dividend yield funds
These are the diversified equity funds, which invest predominantly in stocks with a
high dividend yield. Dividend yield is defined as the dividend per share divided by the
stock's market price at the time of investment. The objective of Equity Income or
23
8/6/2019 Alekhya Sip Reportfinalll
http://slidepdf.com/reader/full/alekhya-sip-reportfinalll 24/80
Dividend Yield Equity Funds is to generate high recurring income and steady capital
appreciation for investors by investing in those companies which issue high dividends
(such as Power or Utility companies whose share prices fluctuate comparatively lesser
than other companies' share prices). Traditionally, stocks with a high dividend yield
are considered to be attractive investments, as they tend to be stable performers overlonger time frames and are generally exposed to the lowest risk level as compared to
other equity funds.
Diversified equity fund
Except for a small portion of investment in liquid money market, diversified equity
funds invest mainly in equities without any concentration on a particular sector(s).
These funds are well diversified and reduce sector-specific or company-specific risk.
However, like all other funds diversified equity funds too are exposed to equity market
risk. One prominent type of diversified equity fund in India is Equity Linked Savings
Schemes (ELSS). As per the mandate, a minimum of 90% of investments by ELSS
should be in equities at all times. ELSS investors are eligible to claim deduction from
taxable income (up to Rs 1 lakh) at the time of filing the income tax return. ELSS
usually has a lock-in period and in case of any redemption by the investor before the
expiry of the lock-in period makes him liable to pay income tax on such income(s) for
which he may have received any tax exemption(s) in the past.
Thematic fund
Thematic funds were meant to be the solution to that malaise. Thematic funds invest
in a theme rather than in a single sector. So while the fund manager’s investment
options remained restricted to the theme, there are still several sectors to choose from
within that theme. A theme like infrastructure for instance, has several related sectors
like cement, steel, capital goods/engineering as also unrelated sectors like banking
and finance. Hence during stock-picking, the fund manager of a thematic fund has
more flexibility compared to a fund manager of a sectoral fund.
Income Schemes
These schemes invest in money markets, bonds and debentures of corporate
companies with medium and long-term maturities. These schemes primarily target
current income instead of capital appreciation. Hence, a substantial part of the
distributable surplus is given back to the investor by way of dividend distribution.
24
8/6/2019 Alekhya Sip Reportfinalll
http://slidepdf.com/reader/full/alekhya-sip-reportfinalll 25/80
These schemes usually declare quarterly dividends and are suitable for conservative
investors who have medium to long term investment horizon and are looking for
regular income through dividend or steady capital appreciation.
Gilt FundsThese mutual funds are the safest type of debt funds available since they invest in
bonds backed by the full faith of the government. These funds invest in Government of
India and state government securities and bonds that are guaranteed by the central
and state governments. Hence, the investor usually does not have to worry about
credit risk since Government Debt is generally credit risk free.
Liquid funds
Liquid funds are used primarily as an alternative to short-term fixed deposits. They
invest in short-term debt instruments with maturities of less than one year. Therefore,
they invest in money market instruments, short-term corporate deposits and treasury.
The maturity of instruments held is between three and six months. A liquid fund
provides good liquidity, low interest rate risk and the prevailing yield in the market.
Returns from deposits are taxable depending on the tax bracket of the investor, which
considerably pulls down the actual return. Dividends from liquid funds are tax-free in
the hands of investor, which is why they are more attractive than deposits. But a
Dividend Distribution Tax of 14.16% for individual and 28.32 for corporate is deducted
if dividend option is chosen while investing.
Arbitrage funds
Arbitrage funds are often promoted by fund houses as “risk-free” investments. As a
strategy, arbitrage involves simultaneous purchase and sale of identical or equivalent
instruments from two or more markets in order to benefit from a discrepancy in their
prices. The profit in arbitrage strategy is the difference between the prices of the
instrument in different markets (like cash and derivative markets for instance).
Fixed maturity plan (FMP)
A FMP is a type of a mutual fund that invests in financial instruments whose maturity
date coincides with a specific time period indicated in advance by the fund. FMPs
primarily invest in debt instruments and money market instruments. The instruments
are held till maturity and give less volatile returns to the investor in comparison to
25
8/6/2019 Alekhya Sip Reportfinalll
http://slidepdf.com/reader/full/alekhya-sip-reportfinalll 26/80
equity funds. These plans suit investors who have a time horizon of 15 days, 1 month,
3 months, 6 months and 1 year. Few schemes are also available with a maturity of 3
years and 5 years. FMPs are also less risky than equity funds because of the kind
assets they invest in. FMPs help in the mitigation of interest rate risk, credit risk and
liquidity risk.
Monthly income plan (MIP)
MIPs are debt-oriented funds with a mandate to invest a portion (generally upto 20
per cent) of their assets in equities. They operate on the proposition of combining the
power of equities with the stability of debt. Though MIPs are intended to offer monthly
income, like other market-linked investment avenues, this income is not assured. Thedistribution of income (in form of dividends) is a factor of availability of distributable
surplus. MIPs are typically suited for investors with a low to modest risk appetite.
Investors who would have typically invested in debt funds or assured return
instruments like fixed deposits can consider investing in MIPs if they are willing to take
on a higher degree of risk for generating higher returns.
Load fund
A mutual fund that comes with a sales charge or commission is basically referred to asa load fund. The fund investor pays the load, which goes to compensate a sales
intermediary (broker, financial planner, investment advisor, etc.) for his or her time
and expertise in selecting an appropriate fund for the investor. The load is paid up
front at the time of purchase (entry load), when the shares are sold (exit load), or as
long as the fund is held by the investor (level-load).
No-load fund
Mutual funds in which shares are sold without a commission or sales charge arereferred to as a no-load fund. The reason for this is that the shares are distributed
directly by the investment company, instead of going through a secondary party.
Because there is no transaction cost to purchase a no-load fund, all of the money
invested is working for the investor.
Large cap funds
26
8/6/2019 Alekhya Sip Reportfinalll
http://slidepdf.com/reader/full/alekhya-sip-reportfinalll 27/80
Large cap funds are those which seek capital appreciation by investing primarily in
stocks of large blue chip companies with above-average prospects for earnings
growth. Different mutual funds have different criteria for classifying companies as
large cap. Generally, companies with market capitalization in excess of Rs.1000crore
are known large cap companies. Investing in large caps is a lower risk-lower returnproposition, as such companies are usually widely researched and information is
widely available
Mid cap funds
Mid cap funds are those mutual funds, which invest in medium sized companies. i.e.:
these companies have a market capitalization between Rs.500crore and
Rs.1,000crore. Big investors like mutual funds and Foreign Institutional Investors are
increasingly investing in mid caps nowadays because the price of large caps hasincreased substantially. Such companies offer higher growth potential and therefore an
opportunity to benefit from higher than average valuations.
Small cap funds
Small cap funds are those mutual funds, which invest in small sized companies, i.e.:
companies that have market capitalization of just upto Rs.500crore. Just like mid-cap
funds, investors prefer small cap funds too due to the price rise of large cap funds.
Since the small sized companies tend to be under researched, thus they present an
opportunity to invest in a company that is yet to be identified by the market. Such
companies offer higher growth potential going forward and therefore an opportunity to
benefit from higher than average valuations.
Offshore fund
Offshore funds are those that invest in securities of foreign companies, after requisite
permission from RBI. The objective behind launching offshore funds is to attract
foreign capital for investment in the country of the issuing company. These funds
facilitate cross border fund flow, which is a direct route for getting foreign currency.
From the investment point of view, offshore funds open up domestic capital markets to
the international investors and global portfolio investments.
Pension fund
27
8/6/2019 Alekhya Sip Reportfinalll
http://slidepdf.com/reader/full/alekhya-sip-reportfinalll 28/80
Pension Plan helps an investor to accumulate wealth over a period in order to meet
his/her expenses after retirement. Usually it is the insurance companies that draw
customers with an array of pension plans. Lesser known is the fact that Mutual Fund
also manages pension products. Currently the only mutual fund which caters to the
investors pension need is the Templeton India Pension Plan (TPP), country’s first andonly central government approved private sector pension scheme under Section 88.
Investing in this pension plan provides tax saving benefits similar to tax saving Mutual
Funds (ELSS) and other investing instruments such as National Saving Certificate
(NSC) and Public Provident Fund (PPF). Though both tax saving mutual funds and
pension plans are in the same investment genre as they offer tax-deduction benefits,
both have varying rates. The investment amount on which tax benefits can be claimed
by investing in tax-saving funds is restricted to a maximum permissible limit of Rs
10,000 (approximately).
Index schemes
An Index is used as a measure of the performance of the market as a whole, or a
specific sector of the market. It also serves as a relevant benchmark to evaluate the
performance of mutual funds. Some investors are interested in investing in the market
in general rather than investing in any specific fund. Hence an index fund builds its
portfolio by buying stock in all the companies of a particular index. As it is not
practical to invest in each and every stock in the market in proportion to its size, theseinvestors are comfortable investing in a fund that they believe is a good representative
of the entire market. Index Funds are launched and managed for such investors.
Managed funds
Managed funds - also known as unit trusts - are vehicles that allow the investor to
pool their money with a number of other investors into a single fund that then is able
to invest in assets that might otherwise be out of reach. Managed funds are basically
funds managed for you by others - namely, investment professionals such as fundmanagers. Managed funds can invest in a variety of assets including shares, property
and fixed interest or a combination of these. All managed funds have a prospectus
which allows one to know where the funds are being invested.
Some of the other innovative funds that have been launched by the mutual fund
players are as follows:
28
8/6/2019 Alekhya Sip Reportfinalll
http://slidepdf.com/reader/full/alekhya-sip-reportfinalll 29/80
Money Market Schemes
Money market funds are generally the safest and most secure of mutual fund
investments. The goal of a money-market fund is to preserve principal while yielding a
modest return. These schemes invest in short term instruments such as commercial
paper ("CP"), certificates of deposit ("CD"), treasury bills ("T-Bill") and overnightmoney ("Call"). The schemes are the least volatile of all the types of schemes because
of their investments in money market instrument with short-term maturities. These
schemes have become popular with institutional investors and high net-worth
individuals having short-term surplus funds. When investing in a money-market fund,
attention should be paid to the interest rate that is being offered.
Fund of funds
A fund of funds is a mutual fund scheme that invests primarily in other schemes of the
same mutual fund or other mutual funds. Hence, it is a step ahead of mutual fund in
the sense that while a mutual fund keeps a track of the stocks it invests, a fund of
fund keeps track of the mutual funds it invests and hence manages the portfolio on
behalf of investors. Such funds are treated as a debt-oriented fund for tax purposes.
Fund of funds are designed to achieve greater diversification than traditional mutual
funds. But on the flipside, expense fees on fund of funds are typically higher than
those on regular funds because they include part of the expense fees charged by the
underlying funds.
Derivative funds
They invest in the derivative market which limit the downside risk by selecting hedging
approach and also offer additional return through shorting procedure.
Exchange Traded Fund (ETF)
An ETF is one whose investment objective is to achieve the same return as a particular
market index. An ETF is similar to an index fund in that it will primarily invest in thesecurities of companies that are included in the selected market index. An ETF invests
in a basket of stocks which blindly mimics a chosen market index. And unlike regular
open-end mutual funds, ETFs can be bought and sold throughout the trading day like
any stock. The investment objective of an ETF is to achieve the same return as a
particular market index .
29

8/6/2019 Alekhya Sip Reportfinalll
http://slidepdf.com/reader/full/alekhya-sip-reportfinalll 30/80
The table below depicts the risk profile of certain popular types of mutual fund
schemes:
Table 2
Valuation of Investment
A mutual fund manages the investors’ money on their behalf. Hence, the investors
hold the right to be informed of the value of their investments on a regular basis. Thevalue of a mutual funds investment is reflected in the net asset value. In simple
words, Net Asset Value (NAV) is the market value of the securities held by the
scheme. Since market value of securities changes every day, NAV of a scheme also
varies on day to day basis. The NAV per unit is the market value of securities of a
scheme divided by the total number of units of the scheme on any particular date.
Investment Pattern Risk Profile of Various Types of Schemes
Scheme Type Time Horizon Risk Profile Typical Investment Pattern
Objective
Ope
n
ende
d
Close
ended
Equity
%
Debt
%
Money Mkt.
/ others %
Money
marketYes No Short Term Low 0 0-20 80-100
Income Yes YesMed-Long
Term
Low-
Medium0
80-
1000-20
Growth Yes Yes Long Term High 80-100 0-20 0-20
Balanced Yes Yes Long TermMedium-
High0-60 0-40 0-20
Tax Saving Yes Yes Long Term High 80-10080-
1000-20
30
8/6/2019 Alekhya Sip Reportfinalll
http://slidepdf.com/reader/full/alekhya-sip-reportfinalll 31/80
NAV is required to be disclosed by the mutual funds on a regular basis - daily or
weekly - depending on the type of scheme.
NAV= (Receivables + accrued Income - liability - accrued liability) / no. of
shares per unit outstanding
Regulations require the NAV of a scheme to be calculated and published in atleast twonewspapers on a weekly basis. However close-ended schemes which do not
necessarily have to be listed on stock exchanges, may do so on a monthly or quarterly
basis, subject to permission by SEBI. But now-a-days, mutual funds have recently
started updating the NAV and sale/repurchase prices of their schemes on the website
www.amfiindia.com. Hence SEBI has decided in consultation with AMFI that all mutual
funds should update their NAVs and sale/repurchase prices on AMFI website by 8.p.m.
everyday. This will help the investors and the newspapers to access the NAVs of all the
mutual funds at one place .
Ways of Investing in Mutual Funds
• One-time outright payment
Here, in order to invest directly in the fund, one just needs to hand over the cheque
and the fund units will be received depending on the value of the units on that
particular day. E.g.: to invest Rs.10,000, all that has to be done is to approach the
fund and buy units worth Rs.10,000. The two factors that will determine the number
of units that will be received are entry load and the net asset value.
• Systematic Investment Plan (SIP)
This plan, which is based on rupee cost averaging, allows investors to invest a fixed
amount at regular intervals. This gives the investor a way to save and invest in a
disciplined and phased manner.
• Automatic Reinvestment Plan (ARP)
The reinvestment plan, as the name suggests, can be either in the same scheme or in
another scheme of the same fund. The scheme has two options, dividend option and
growth option. The reinvestment happens at ex-dividend NAV. Investor is allotted
extra units equivalent to dividend due less dividend tax, if any.
31
8/6/2019 Alekhya Sip Reportfinalll
http://slidepdf.com/reader/full/alekhya-sip-reportfinalll 32/80
• Systematic Transfer Plan (STP)
STP provides a facility to transfer on a periodic basis a specific amount from one
scheme to another scheme of the same mutual fund. The redemption from the old
scheme and investment in new scheme happen at the applicable NAVs.
Advantages of Mutual Fund Investment
Small investors usually do not have the necessary expertise and the time to undertake
any study that can facilitate informed decisions on stock market investments. While
this is the predominant reason for the popularity of mutual fund, there are many other
benefits that can accrue to small investors. Some of the advantages are listed below:
• Diversification benefits : Diversified investment improves the risk-return profile
of the portfolio. Diversification becomes possible as the corpus of a mutual fund is
bigger compared to individual investment.
• Low transaction cost : Large volume of investments attract lower brokerage
commissions as compared to the smaller volumes of transactions entered into by
individual investors. Brokers quote a lower rate of commission due to two reasons.
First is competition for institutional investors business. Second reason is that the
overhead costs for executing a trade do not differ much for large and small orders.
Hence, for large order, these costs spread over a larger volume, enabling the
broker to quote a lower commission rate.
• Availability of various schemes : Investors can chose between regular income
schemes and growth schemes, between schemes that invest in the money market
and those that invest in stock market, etc. some schemes provide added
advantage. For example, automatic reinvestment schemes reinvest the distributed
income automatically, thus making the management of funds easier.
• Professional management : Mutual funds are generally managed by
knowledgeable, experienced professionals who are solely devoted to tracking and
updating the portfolios. Hence apart from saving time, mutual funds also provides
better results for the investor• Liquidity : A mutual fund generally stands ready to buy and sell its units on a
regular basis. Thus, it is easier to liquidate holdings in a mutual fund as compared
to direct investment in securities.
• Tax benefits : In India, the dividend received by the investor is tax free. This
enhances the yield on mutual fund marginally as compared to income from other
32
8/6/2019 Alekhya Sip Reportfinalll
http://slidepdf.com/reader/full/alekhya-sip-reportfinalll 33/80
investment options. Also, in the case of long-term (more than one year) capital
gains, the investor need not pay for all equity purchases after March1, 2003.
• Flexibility : Mutual fund possess features such as regular investment plan(SIP),
regular withdrawal plan and dividend reinvestment plan. Because of these
features, one can systematically invest or withdraw according to ones’ needs andconvenience.
• Well regulated : All mutual funds are registered with SEBI and they function
within the provisions of strict regulations designed to protect the interest of
investors. The operations of mutual funds are regulated by SEBI
Disadvantages of Mutual Fund
Investment in mutual fund has its disadvantages as well, which are:• Investors cannot choose the securities they want to invest in, or the
securities they want to sell.• The investors also face the risk of fund managers not performing well.• If the fund manager’s performance is linked to the fund performance, then
he’d be tempted to show god results for short-term without paying attention
to long-term performance of the fund.• The management fees charged by the fund can also reduce the returns
available to the investors.• Lastly, while investors in securities can decide the amount of earnings they
want to withdraw in a particular period, investors in a mutual fund have no
such discretion as the amount of earnings that are to be paid out to the
investors in a particular year is decided by the mutual fund.
ASSET MANAGEMENT COMPANY
In order to understand the role and position of an Asset Management Company in the
mutual fund concept, it is important to understand the structure of the flow of
operations of a mutual fund.
33

8/6/2019 Alekhya Sip Reportfinalll
http://slidepdf.com/reader/full/alekhya-sip-reportfinalll 34/80
Structure of an Asset Management Company
The role of an Asset Management Company is highly significant in the mutual fund
operations. They are the fund managers i.e., they invest the investors money in
various securities (equity, debt and money market instruments) after proper research
and analysis. They also look after the administrative functions of a mutual fund for
which they charge management fee (subject to the ceiling prescribed by SEBI).
It is the sponsor who appoints the asset management company (AMC) for the
investment and administrative functions. The AMC does the research, and manages
the corpus of the fund. It launches the various schemes of the fund, manages them
and then liquidates them at the end of their term. It also takes care of the other
administrative work of the fund. It receives an annual management fee from the fundfor its services. There is also an Asset Management Agreement between the AMC and
the Trustee.
Sponsors
MutualFund
(Trust)Investors
AMC
Trustees
Make theright
investment
34
8/6/2019 Alekhya Sip Reportfinalll
http://slidepdf.com/reader/full/alekhya-sip-reportfinalll 35/80
Intermediary
The role of intermediary is very important in the mutual fund industry. They act as link
between the mutual fund companies and the investors. The intermediaries that include
brokers, sub-brokers, investment houses like Bajaj Capital, not only help in the
subscription of units but also provide guidance to the investors regarding investmentin various mutual fund schemes.
Registrar as an Intermediary
Other intermediaries like registrars and transfer agents performs activities which are
associated with maintaining records concerning units already issued or to be issued by
a company. On a broad reckoning, a registrar renders services in processing
applications received by a company for the issue of its units and in the allotment of
these units to the investors. As a transfer agent, he handles the work related to the
transfer of units issued by a company. Other activities relating to dividend payment,
investor grievance, etc, are also performed by the registrar.
The Asset Management Company (AMC) is required to fulfil the following conditions:• It is required to be formed and registered under Companies Act, 1956. It is also
required to be approved as an AMC by SEBI• It should hold the approval of the board of trustees• It shall have a minimum net worth of Rs.100 million• In an AMC, any of its directors, officers or employees shall not act as a trustee
of any mutual fund or act as director in any other AMC• The board of directors of the AMC will consist of atleast 50% directors who are
not associates of, or associated in any manner with the sponsor or any of its
subsidiaries or the trustees. i.e. they should be independent• The minimum contribution of the sponsor should be atleast 40% of share
capital of AMC• The appointment of the AMC can be terminated by the consent of majority of
the trustees or by 75% of the unit holders of the scheme.
Channels of an Asset Management Company
The various ways through which an Asset Management Company can distribute its
mutual fund products to the customers are:
35
8/6/2019 Alekhya Sip Reportfinalll
http://slidepdf.com/reader/full/alekhya-sip-reportfinalll 36/80
1. Direct selling
• 2. Banks
• Public bank• Private bank
3. Distributors• Regional distributors• National distributors
4. Individual financial Advisor
An AMC has the Following Obligations:
•
An AMC is responsible for floating schemes for the mutual fund and managingthe funds mobilized under various schemes in accordance with the trust deed,
SEBI regulations and the investment objectives stated in the offer document.• The details of transactions in securities by the key personnel of the AMC,
whether in their own name, or on behalf of the AMC, have to be reported by
the AMC to the trustees on a half-yearly basis. This is to help the trustees
ensure that there is no front running or self dealing by either the AMC, or its
key personnel.• The AMC is required to report to the trustees any securities transaction taken
place with any of its associates. This requirement helps ensure that such
transactions are not against the unit holders’ interest.• The AMC should inform the trustees and SEBI about the interest of its directors
in other companies. This information should be updated every six months. It
also has to report about the transaction of dealing in securities on a quarterly
basis. This is to ensure that the fund’s corpus is not being utilized for the
benefit of the sponsor, the AMC or its director, in a way that is detrimental to
the unit holder’s interest.• It is the AMC’s responsibility to appoint registrars and share transfer agents for
the fund. It has to ensure that these parties are registered with SEBI.• It has to submit a report on the functioning of the schemes of the mutual fund
to the trustees on a quarterly basis, or as at such intervals as required by the
trustees
36
8/6/2019 Alekhya Sip Reportfinalll
http://slidepdf.com/reader/full/alekhya-sip-reportfinalll 37/80
• They should limit 5% of aggregate purchase and sales of Securities under all its
scheme per broker per quarter• As far as possible, AMC should avoid services of its sponsor• All security transactions with a Sponsor and his associates must be disclosed
• An AMC should also ensure disclosure of transactions with a company whichhas invested more than 5% on NAV in any scheme.
An AMC can do only the following businesses:
• Asset Management Services• Portfolio Management Services• Portfolio Advisory services• In granting the approval for the AMC, SEBI takes into account the sound track
record, general reputation, fairness in transactions and SEBI’s explanation for
‘sound track record’ is net worth, divided paying capacity and profitability of
the AMC.
Asset under Management (AUM)
Asset under Management (AUM) denotes the market value of the assets that an
investment company manages on behalf of investors. AUM is looked at as a measure
of success against competition and consists of growth/decline due to both capital
appreciation/losses and new money inflow/outflow.
Factors that affect AUMs are foreign exchange movements, structural effects of the
company, market performance i.e.:gains/losses and Net New Asset (NNAs). NNA
refers to the amount of money that has come by way of any new investment from a
client.
37
8/6/2019 Alekhya Sip Reportfinalll
http://slidepdf.com/reader/full/alekhya-sip-reportfinalll 38/80
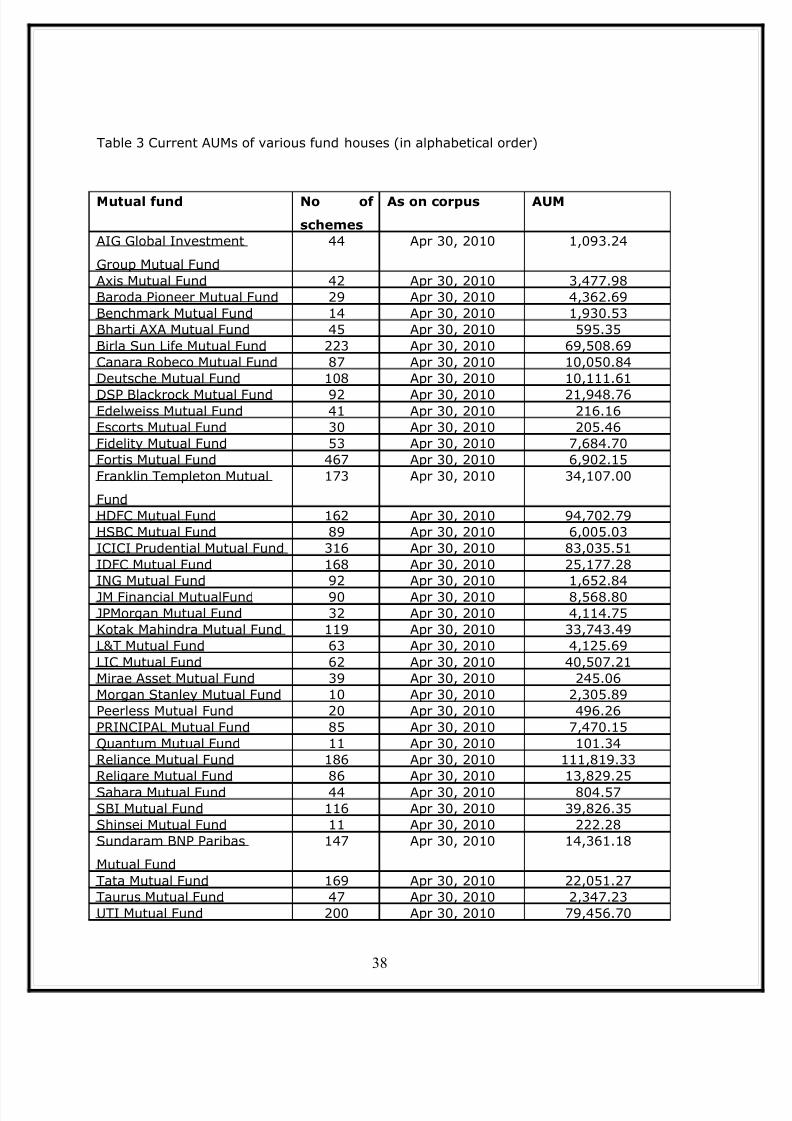
Table 3 Current AUMs of various fund houses (in alphabetical order)
Mutual fund No of
schemes
As on corpus AUM
AIG Global Investment
Group Mutual Fund
44 Apr 30, 2010 1,093.24
Axis Mutual Fund 42 Apr 30, 2010 3,477.98Baroda Pioneer Mutual Fund 29 Apr 30, 2010 4,362.69Benchmark Mutual Fund 14 Apr 30, 2010 1,930.53Bharti AXA Mutual Fund 45 Apr 30, 2010 595.35Birla Sun Life Mutual Fund 223 Apr 30, 2010 69,508.69Canara Robeco Mutual Fund 87 Apr 30, 2010 10,050.84Deutsche Mutual Fund 108 Apr 30, 2010 10,111.61DSP Blackrock Mutual Fund 92 Apr 30, 2010 21,948.76Edelweiss Mutual Fund 41 Apr 30, 2010 216.16Escorts Mutual Fund 30 Apr 30, 2010 205.46Fidelity Mutual Fund 53 Apr 30, 2010 7,684.70Fortis Mutual Fund 467 Apr 30, 2010 6,902.15Franklin Templeton Mutual
Fund
173 Apr 30, 2010 34,107.00
HDFC Mutual Fund 162 Apr 30, 2010 94,702.79HSBC Mutual Fund 89 Apr 30, 2010 6,005.03ICICI Prudential Mutual Fund 316 Apr 30, 2010 83,035.51IDFC Mutual Fund 168 Apr 30, 2010 25,177.28ING Mutual Fund 92 Apr 30, 2010 1,652.84JM Financial MutualFund 90 Apr 30, 2010 8,568.80JPMorgan Mutual Fund 32 Apr 30, 2010 4,114.75Kotak Mahindra Mutual Fund 119 Apr 30, 2010 33,743.49L&T Mutual Fund 63 Apr 30, 2010 4,125.69LIC Mutual Fund 62 Apr 30, 2010 40,507.21Mirae Asset Mutual Fund 39 Apr 30, 2010 245.06Morgan Stanley Mutual Fund 10 Apr 30, 2010 2,305.89Peerless Mutual Fund 20 Apr 30, 2010 496.26PRINCIPAL Mutual Fund 85 Apr 30, 2010 7,470.15Quantum Mutual Fund 11 Apr 30, 2010 101.34Reliance Mutual Fund 186 Apr 30, 2010 111,819.33Religare Mutual Fund 86 Apr 30, 2010 13,829.25Sahara Mutual Fund 44 Apr 30, 2010 804.57SBI Mutual Fund 116 Apr 30, 2010 39,826.35Shinsei Mutual Fund 11 Apr 30, 2010 222.28Sundaram BNP Paribas
Mutual Fund
147 Apr 30, 2010 14,361.18
Tata Mutual Fund 169 Apr 30, 2010 22,051.27Taurus Mutual Fund 47 Apr 30, 2010 2,347.23UTI Mutual Fund 200 Apr 30, 2010 79,456.70
38

8/6/2019 Alekhya Sip Reportfinalll
http://slidepdf.com/reader/full/alekhya-sip-reportfinalll 39/80
CHAPTER 4
COMPANY PROFILE
HDFC ASSET MANAGEMENT COMPANY LIMITED (AMC)
Internal Structure and Processes :
Management Team : HDFC Trustee company Limited: a company incorporated under
39
8/6/2019 Alekhya Sip Reportfinalll
http://slidepdf.com/reader/full/alekhya-sip-reportfinalll 40/80
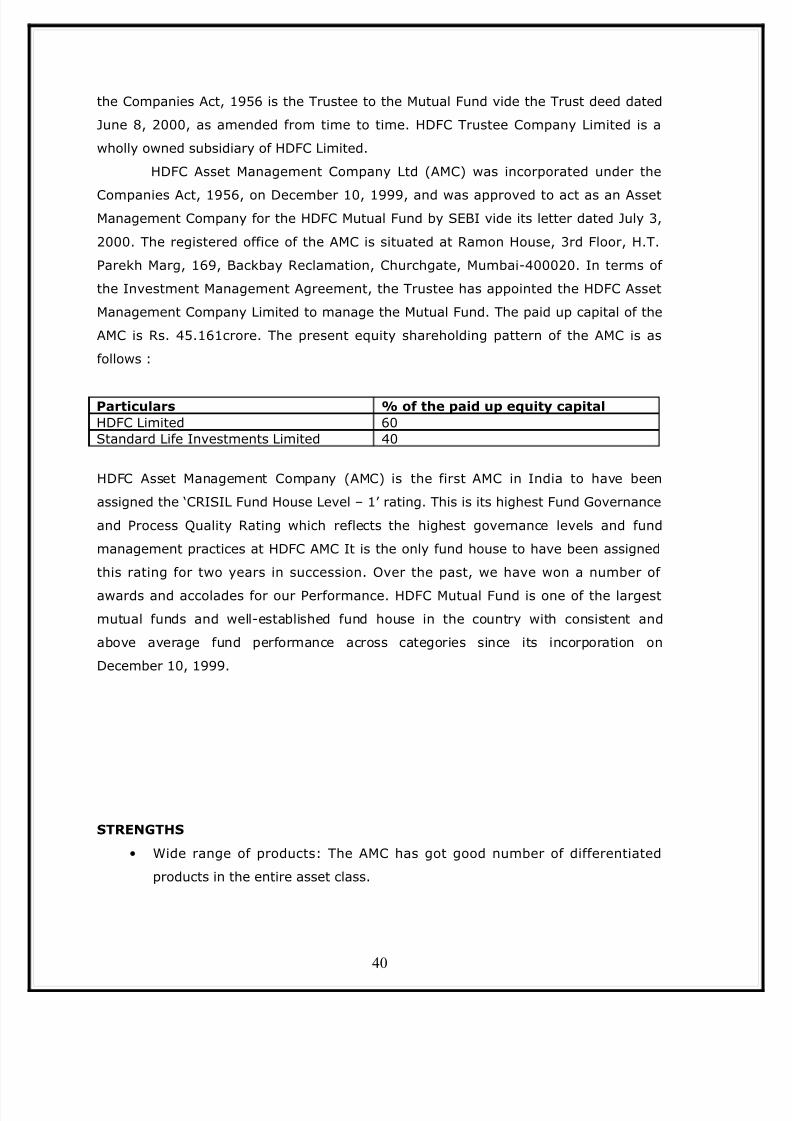
the Companies Act, 1956 is the Trustee to the Mutual Fund vide the Trust deed dated
June 8, 2000, as amended from time to time. HDFC Trustee Company Limited is a
wholly owned subsidiary of HDFC Limited.
HDFC Asset Management Company Ltd (AMC) was incorporated under the
Companies Act, 1956, on December 10, 1999, and was approved to act as an AssetManagement Company for the HDFC Mutual Fund by SEBI vide its letter dated July 3,
2000. The registered office of the AMC is situated at Ramon House, 3rd Floor, H.T.
Parekh Marg, 169, Backbay Reclamation, Churchgate, Mumbai-400020. In terms of
the Investment Management Agreement, the Trustee has appointed the HDFC Asset
Management Company Limited to manage the Mutual Fund. The paid up capital of the
AMC is Rs. 45.161crore. The present equity shareholding pattern of the AMC is as
follows :
Particulars % of the paid up equity capitalHDFC Limited 60Standard Life Investments Limited 40
HDFC Asset Management Company (AMC) is the first AMC in India to have been
assigned the ‘CRISIL Fund House Level – 1’ rating. This is its highest Fund Governance
and Process Quality Rating which reflects the highest governance levels and fund
management practices at HDFC AMC It is the only fund house to have been assigned
this rating for two years in succession. Over the past, we have won a number of
awards and accolades for our Performance. HDFC Mutual Fund is one of the largest
mutual funds and well-established fund house in the country with consistent and
above average fund performance across categories since its incorporation on
December 10, 1999.
STRENGTHS
• Wide range of products: The AMC has got good number of differentiated
products in the entire asset class.
40
8/6/2019 Alekhya Sip Reportfinalll
http://slidepdf.com/reader/full/alekhya-sip-reportfinalll 41/80
• Consistent performance: The funds have given consistent performance over
10 years.• Experienced team: HDFC has fund managers with rich experience whose
consistent performance has made this AMC CRISIL level one fund house.
• Strong Compliance: The AMC has very strong compliance of industry set rulesto protect the interest of the investors.
• Risk management team: AMC has a separate risk management team which
constantly monitors the risk exposure related to different fund management.
WEAKNESSES
• Restrictive reach: HDFC business is more concentrated on urban areas. HDFC
has very limited offices.•
Less Aggressive in Marketing and execution: HDFC does match theaggressiveness required in the industry and are slow in execution.
HDFC MUTUAL FUND AT A GLANCE
Name of Unit : HDFC MUTUAL FUND
Managing Director : Mr . Milind Barve
Address : sapphire square, 2nd floor, Somajiguda,
Hyderabad. .
Form of Organization : Private Sector
Establishment year : 2007
Sponsors : HDFC Corporation limited, Standard life Investments
Limited
Management: Trustee : HDFC Asset Management Company Limited (AMC).
Web site : www.hdfcfund.com
ACHIEVEMENT AND AWARDS
41
8/6/2019 Alekhya Sip Reportfinalll
http://slidepdf.com/reader/full/alekhya-sip-reportfinalll 42/80
• “HDFC Prudence fund” has been ranked ICRA-MFR 1, and Has Been awarded
the Gold Award for ‘Best Performance’ in the category of “Open Ended
Balanced Scheme” for one year Period Ending Dec 31, 2005.• “HDFC Tax saver fund” has been ranked ICRA-MFR 1, and Has Been Silver
award for “Second Best Performance” in the category of “Open Ended EquityLinked Saving Scheme(ELSS)” for Three year Period Ending Dec 31, 2005.
• “HDFC MIP~LTP” has been ranked ICRA-MFR 1, and Has been awarded the
Gold Award For “Best Performance” in the category of “Open Ended Marginal
Equity Scheme” for one year Period Ending Dec 31, 2005.
42

8/6/2019 Alekhya Sip Reportfinalll
http://slidepdf.com/reader/full/alekhya-sip-reportfinalll 43/80
CHAPTER 5
DATA ANALYSIS
Description of Hdfc products
43

8/6/2019 Alekhya Sip Reportfinalll
http://slidepdf.com/reader/full/alekhya-sip-reportfinalll 44/80
1. Hdfc equity fund
Investment objective: The investment objective of the Scheme is to achieve capital
appreciation.
Scheme information
Nature of scheme Open Ended growth scheme
Inception Date January 01, 1995Option/Plan Dividend Option, Growth Option. The
Dividend Option offers Dividend Payout
and Reinvestment Facility.Entry Load
(purchase / additional purchase / switch-
in)
NIL
(With effect from August 1, 2009)
Exit Load
(as a % of the Applicable NAV)
• In respect of each purchase / switch in
of units, an Exit Load of 1.00% is
payable if Units are redeemed /
switched-out within 1 year from the
date of allotment..
• No Exit Load is payable if Units are
redeemed / switched-out after 1 year
from the date of allotment.
NAV details
Plan name NAV date NAV amount
Dividend option 09 Jun 2010 44.3600
Growth option 09 Jun 2010 241.3660
Investment pattern:
Asset type Portfolio(%) Risk profile
Equities and Equity Related 80 - 100 Medium to High
44

8/6/2019 Alekhya Sip Reportfinalll
http://slidepdf.com/reader/full/alekhya-sip-reportfinalll 45/80
Instruments
Debt & Money Market
Instruments
0 - 20 Low to Medium
Investment Strategy:
In order to provide long term capital appreciation, the Scheme will invest
predominantly in growth companies. Companies selected under this portfolio would as
far as practicable consist of medium to large sized companies which:
1. Are likely to achieve above average growth in the industry
2. Enjoy distinct competitive advantages.
3. Have superior financial strengths
Returns
45
8/6/2019 Alekhya Sip Reportfinalll
http://slidepdf.com/reader/full/alekhya-sip-reportfinalll 46/80
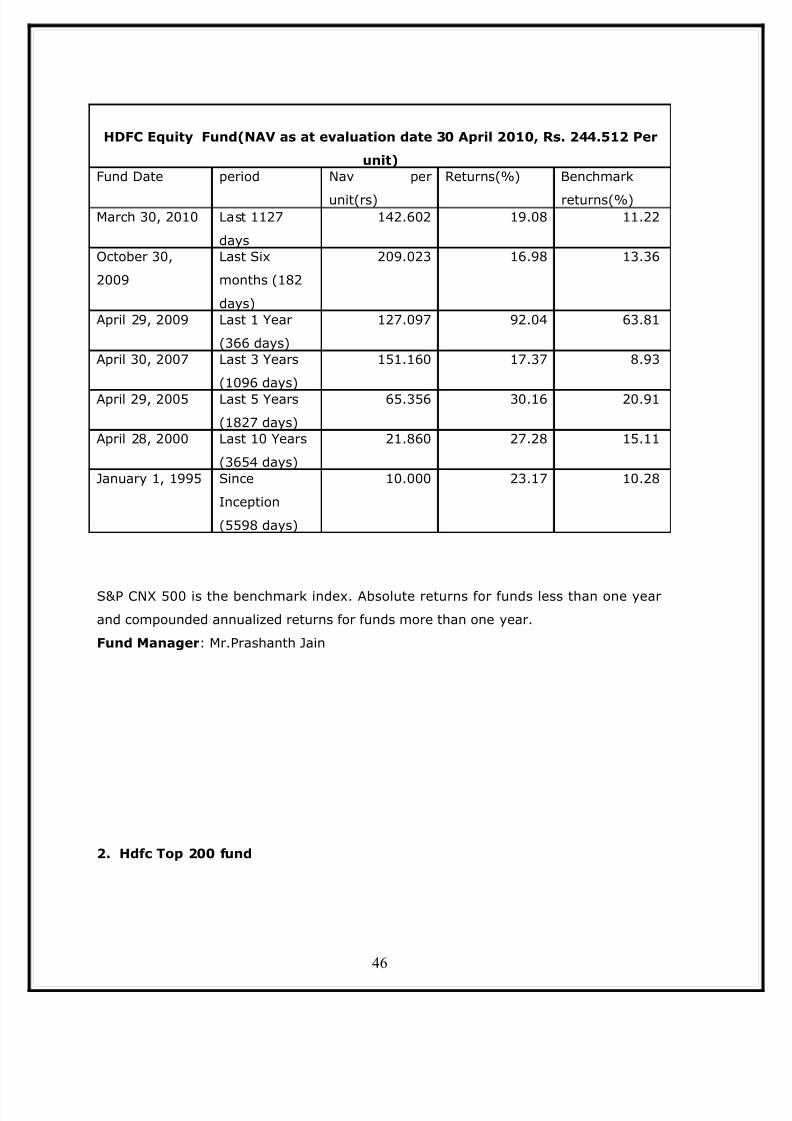
S&P CNX 500 is the benchmark index. Absolute returns for funds less than one year
and compounded annualized returns for funds more than one year.
Fund Manager : Mr.Prashanth Jain
2. Hdfc Top 200 fund
HDFC Equity Fund(NAV as at evaluation date 30 April 2010, Rs. 244.512 Per
unit)Fund Date period Nav per
unit(rs)
Returns(%) Benchmark
returns(%)March 30, 2010 Last 1127
days
142.602 19.08 11.22
October 30,
2009
Last Six
months (182
days)
209.023 16.98 13.36
April 29, 2009 Last 1 Year
(366 days)
127.097 92.04 63.81
April 30, 2007 Last 3 Years
(1096 days)
151.160 17.37 8.93
April 29, 2005 Last 5 Years
(1827 days)
65.356 30.16 20.91
April 28, 2000 Last 10 Years
(3654 days)
21.860 27.28 15.11
January 1, 1995 Since
Inception
(5598 days)
10.000 23.17 10.28
46
8/6/2019 Alekhya Sip Reportfinalll
http://slidepdf.com/reader/full/alekhya-sip-reportfinalll 47/80
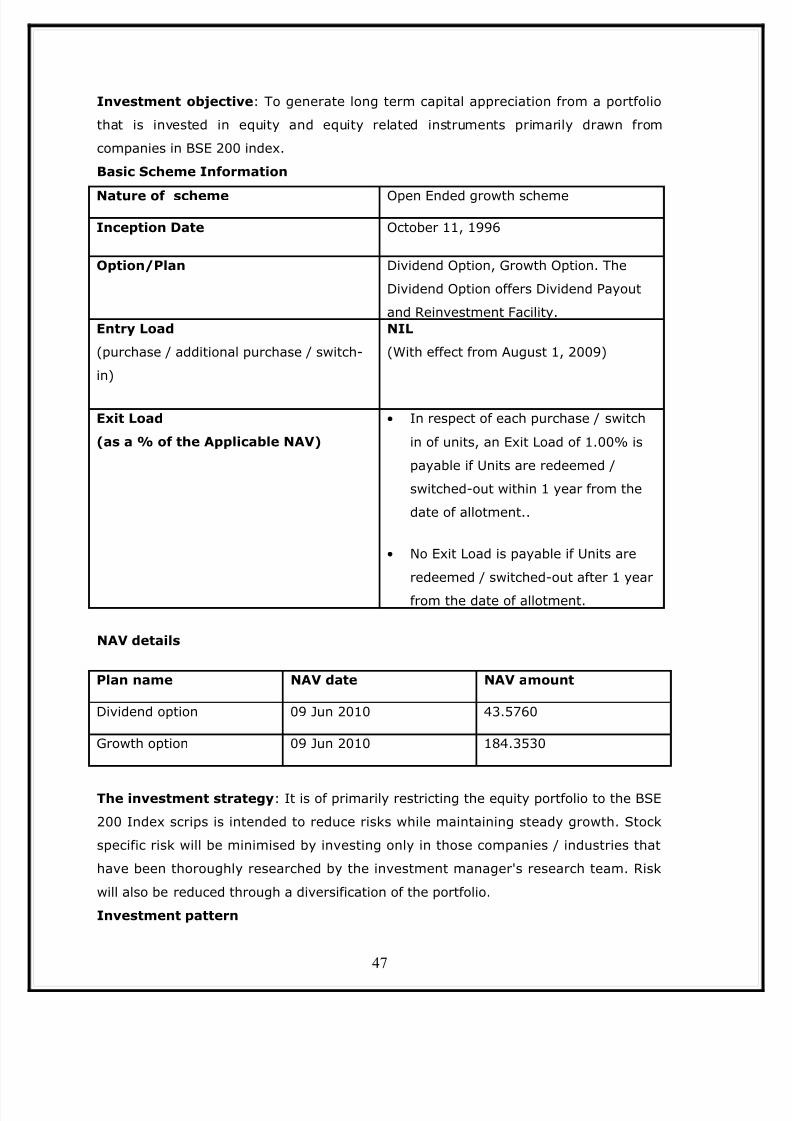
Investment objective : To generate long term capital appreciation from a portfolio
that is invested in equity and equity related instruments primarily drawn from
companies in BSE 200 index.
Basic Scheme Information
Nature of scheme Open Ended growth scheme
Inception Date October 11, 1996
Option/Plan Dividend Option, Growth Option. The
Dividend Option offers Dividend Payout
and Reinvestment Facility.Entry Load
(purchase / additional purchase / switch-
in)
NIL
(With effect from August 1, 2009)
Exit Load
(as a % of the Applicable NAV)
• In respect of each purchase / switch
in of units, an Exit Load of 1.00% is
payable if Units are redeemed /
switched-out within 1 year from the
date of allotment..
• No Exit Load is payable if Units are
redeemed / switched-out after 1 year
from the date of allotment.
NAV details
Plan name NAV date NAV amount
Dividend option 09 Jun 2010 43.5760
Growth option 09 Jun 2010 184.3530
The investment strategy : It is of primarily restricting the equity portfolio to the BSE
200 Index scrips is intended to reduce risks while maintaining steady growth. Stock
specific risk will be minimised by investing only in those companies / industries that
have been thoroughly researched by the investment manager's research team. Risk
will also be reduced through a diversification of the portfolio.
Investment pattern
47
8/6/2019 Alekhya Sip Reportfinalll
http://slidepdf.com/reader/full/alekhya-sip-reportfinalll 48/80
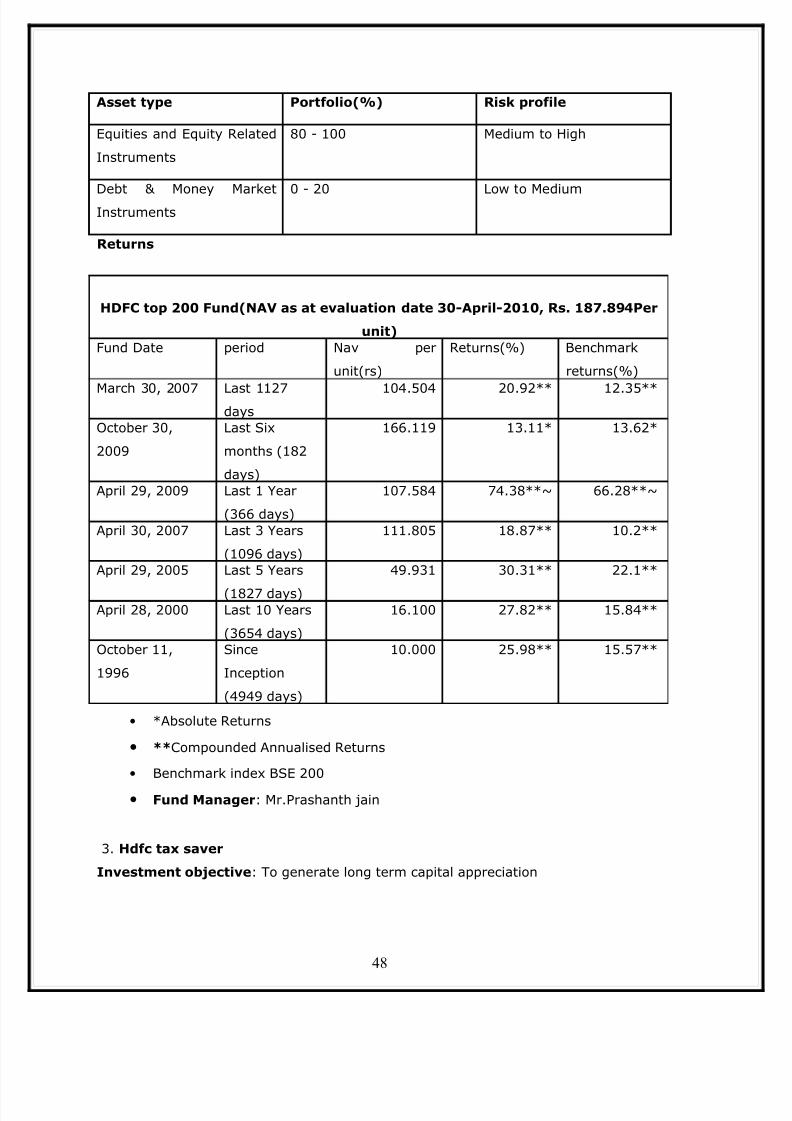
Asset type Portfolio(%) Risk profile
Equities and Equity Related
Instruments
80 - 100 Medium to High
Debt & Money Market
Instruments
0 - 20 Low to Medium
Returns
• *Absolute Returns
• ** Compounded Annualised Returns
• Benchmark index BSE 200
• Fund Manager : Mr.Prashanth jain
3. Hdfc tax saver
Investment objective : To generate long term capital appreciation
HDFC top 200 Fund(NAV as at evaluation date 30-April-2010, Rs. 187.894Per
unit)Fund Date period Nav per
unit(rs)
Returns(%) Benchmark
returns(%)
March 30, 2007 Last 1127days
104.504 20.92** 12.35**
October 30,
2009
Last Six
months (182
days)
166.119 13.11* 13.62*
April 29, 2009 Last 1 Year
(366 days)
107.584 74.38**~ 66.28**~
April 30, 2007 Last 3 Years
(1096 days)
111.805 18.87** 10.2**
April 29, 2005 Last 5 Years
(1827 days)
49.931 30.31** 22.1**
April 28, 2000 Last 10 Years
(3654 days)
16.100 27.82** 15.84**
October 11,
1996
Since
Inception
(4949 days)
10.000 25.98** 15.57**
48
8/6/2019 Alekhya Sip Reportfinalll
http://slidepdf.com/reader/full/alekhya-sip-reportfinalll 49/80
Basic Scheme Information
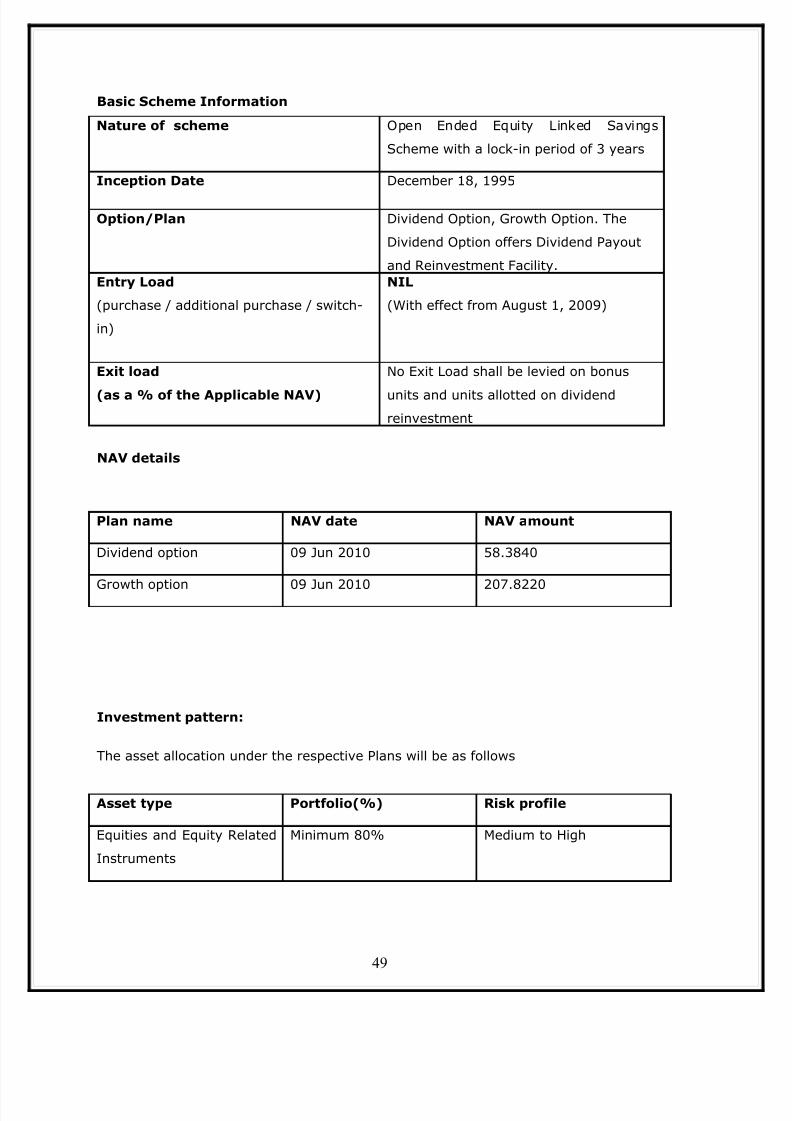
Nature of scheme Open Ended Equity Linked Savings
Scheme with a lock-in period of 3 years
Inception Date December 18, 1995
Option/Plan Dividend Option, Growth Option. The
Dividend Option offers Dividend Payout
and Reinvestment Facility.Entry Load
(purchase / additional purchase / switch-
in)
NIL
(With effect from August 1, 2009)
Exit load
(as a % of the Applicable NAV)
No Exit Load shall be levied on bonus
units and units allotted on dividendreinvestment
NAV details
Plan name NAV date NAV amount
Dividend option 09 Jun 2010 58.3840
Growth option 09 Jun 2010 207.8220
Investment pattern:
The asset allocation under the respective Plans will be as follows
Asset type Portfolio(%) Risk profile
Equities and Equity Related
Instruments
Minimum 80% Medium to High
49

8/6/2019 Alekhya Sip Reportfinalll
http://slidepdf.com/reader/full/alekhya-sip-reportfinalll 50/80
Debt & Money Market
Instruments
Maximum 20% Low to Medium
Investmnet strategy
Debt securities (in the form of non-convertible debentures, bonds, secured premium
notes, zero interest bonds, deep discount bonds, floating rate bond / notes, securitised
debt, pass through certificates, asset backed securities, mortgage backed securities
and any other domestic fixed income securities including structured obligations etc.)
include, but are not limited to :
• Debt obligations of the Government of India, State and local Governments,
Government Agencies and statutory bodies (which may or may not carry a
state / central government guarantee),• Securities that have been guaranteed by Government of India and State
Governments,• Securities issued by Corporate Entities (Public / Private sector undertakings),• Securities issued by Public / Private sector banks and development financial
institutions.
Money Market Instruments include :
• Commercial papers• Commercial bills• Treasury bills• Government securities having an unexpired maturity upto one year• Collateralised Borrowing & Lending Obligations (CBLO)• Certificate of deposit
• usance bills
• Permitted securities under a repo / reverse repo agreement
• Any other like instruments as may be permitted by RBI / SEBI from time totime
Returns
50
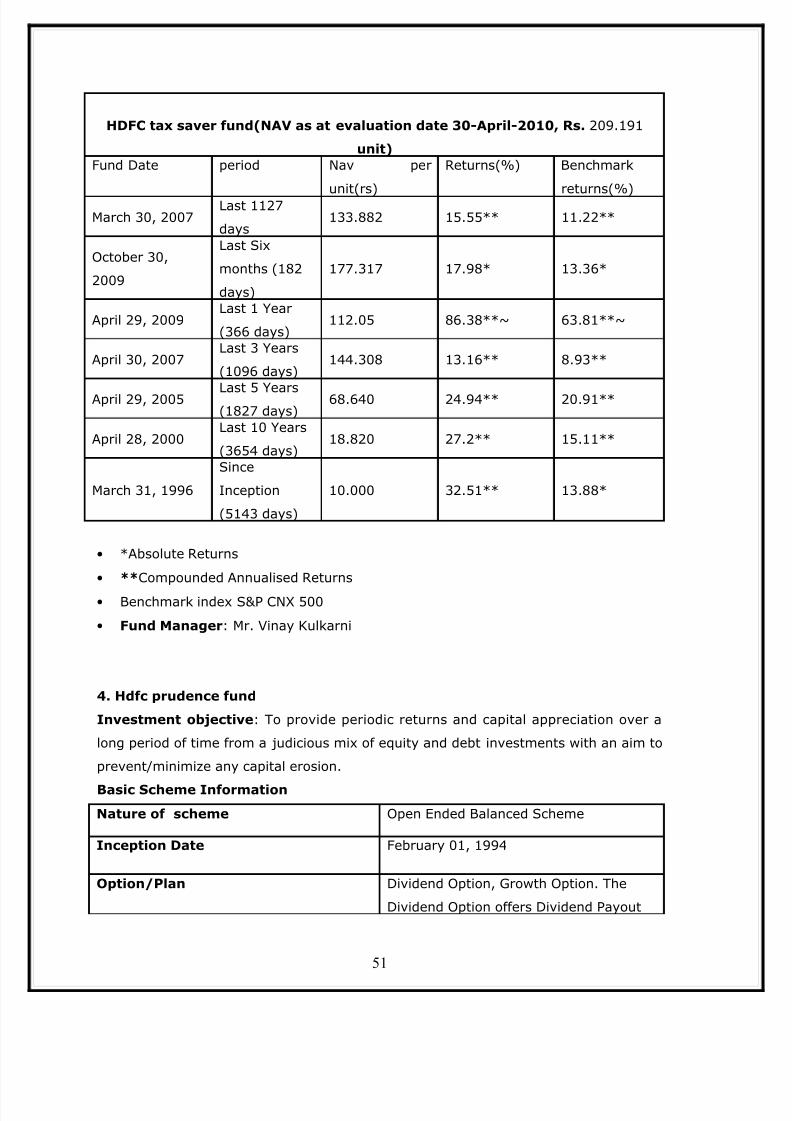
8/6/2019 Alekhya Sip Reportfinalll
http://slidepdf.com/reader/full/alekhya-sip-reportfinalll 51/80
HDFC tax saver fund(NAV as at evaluation date 30-April-2010, Rs. 209.191
unit)Fund Date period Nav per
unit(rs)
Returns(%) Benchmark
returns(%)
March 30, 2007Last 1127
days133.882 15.55** 11.22**
October 30,
2009
Last Six
months (182
days)
177.317 17.98* 13.36*
April 29, 2009Last 1 Year
(366 days)112.05 86.38**~ 63.81**~
April 30, 2007Last 3 Years
(1096 days)144.308 13.16** 8.93**
April 29, 2005 Last 5 Years(1827 days)
68.640 24.94** 20.91**
April 28, 2000Last 10 Years
(3654 days)18.820 27.2** 15.11**
March 31, 1996
Since
Inception
(5143 days)
10.000 32.51** 13.88*
• *Absolute Returns• ** Compounded Annualised Returns• Benchmark index S&P CNX 500• Fund Manager : Mr. Vinay Kulkarni
4. Hdfc prudence fund
Investment objective : To provide periodic returns and capital appreciation over a
long period of time from a judicious mix of equity and debt investments with an aim to
prevent/minimize any capital erosion.
Basic Scheme Information
Nature of scheme Open Ended Balanced Scheme
Inception Date February 01, 1994
Option/Plan Dividend Option, Growth Option. The
Dividend Option offers Dividend Payout
51
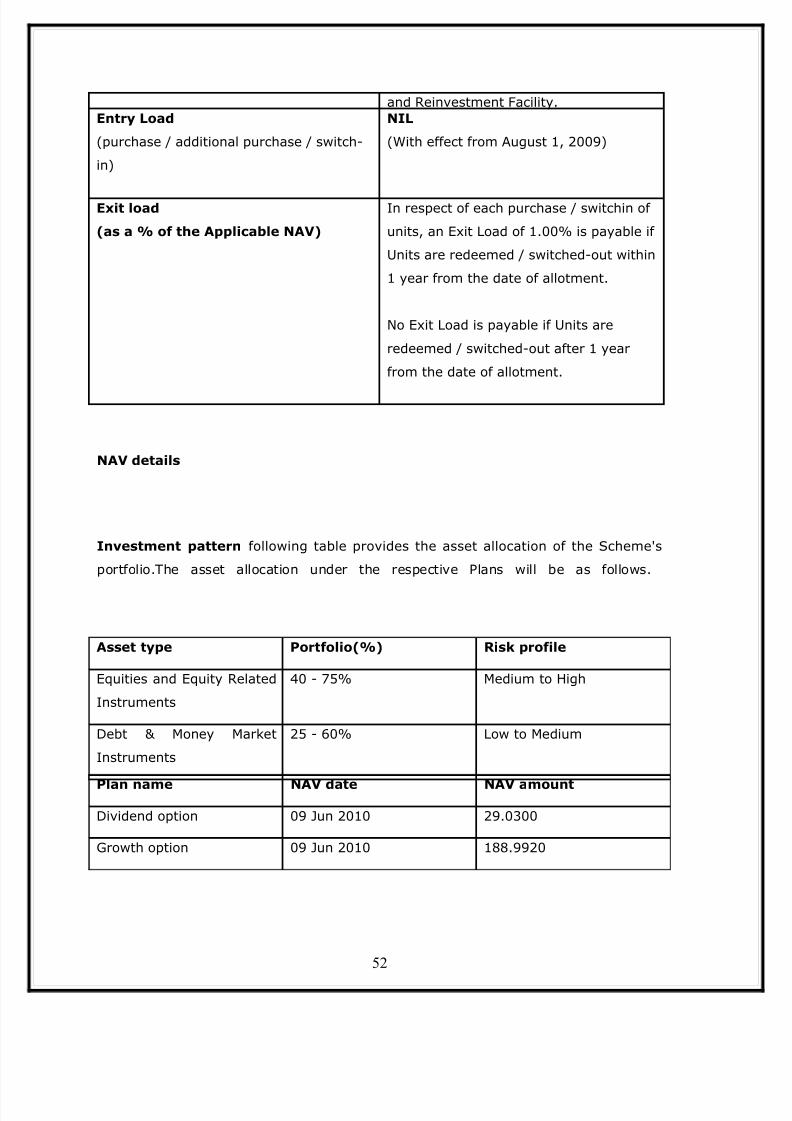
8/6/2019 Alekhya Sip Reportfinalll
http://slidepdf.com/reader/full/alekhya-sip-reportfinalll 52/80
and Reinvestment Facility.Entry Load
(purchase / additional purchase / switch-
in)
NIL
(With effect from August 1, 2009)
Exit load
(as a % of the Applicable NAV)
In respect of each purchase / switchin of
units, an Exit Load of 1.00% is payable if
Units are redeemed / switched-out within
1 year from the date of allotment.
No Exit Load is payable if Units are
redeemed / switched-out after 1 year
from the date of allotment.
NAV details
Investment pattern following table provides the asset allocation of the Scheme's
portfolio.The asset allocation under the respective Plans will be as follows.
Plan name NAV date NAV amount
Dividend option 09 Jun 2010 29.0300
Growth option 09 Jun 2010 188.9920
Asset type Portfolio(%) Risk profile
Equities and Equity Related
Instruments
40 - 75% Medium to High
Debt & Money Market
Instruments
25 - 60% Low to Medium
52

8/6/2019 Alekhya Sip Reportfinalll
http://slidepdf.com/reader/full/alekhya-sip-reportfinalll 53/80
Investment Strategy :
As outlined above, the investments in the Scheme will comprise both debt and
equities. The Fund would invest in Debt instruments such as Government securities,
money market instruments, securitised debts, corporate debentures and bonds,
preference shares, quasi Government bonds, and in equity shares. In the long term,the mix between debt instruments and equity instruments is targeted between 60:40
and 40:60 respectively. The exact mix will be a function of interest rates, equity
valuations, reserves position, risk taking capacity of the portfolio without
compromising the consistency of dividend pay out (in the case of Dividend Plan), need
for capital preservation and the need to generate capital appreciation.
Returns
53
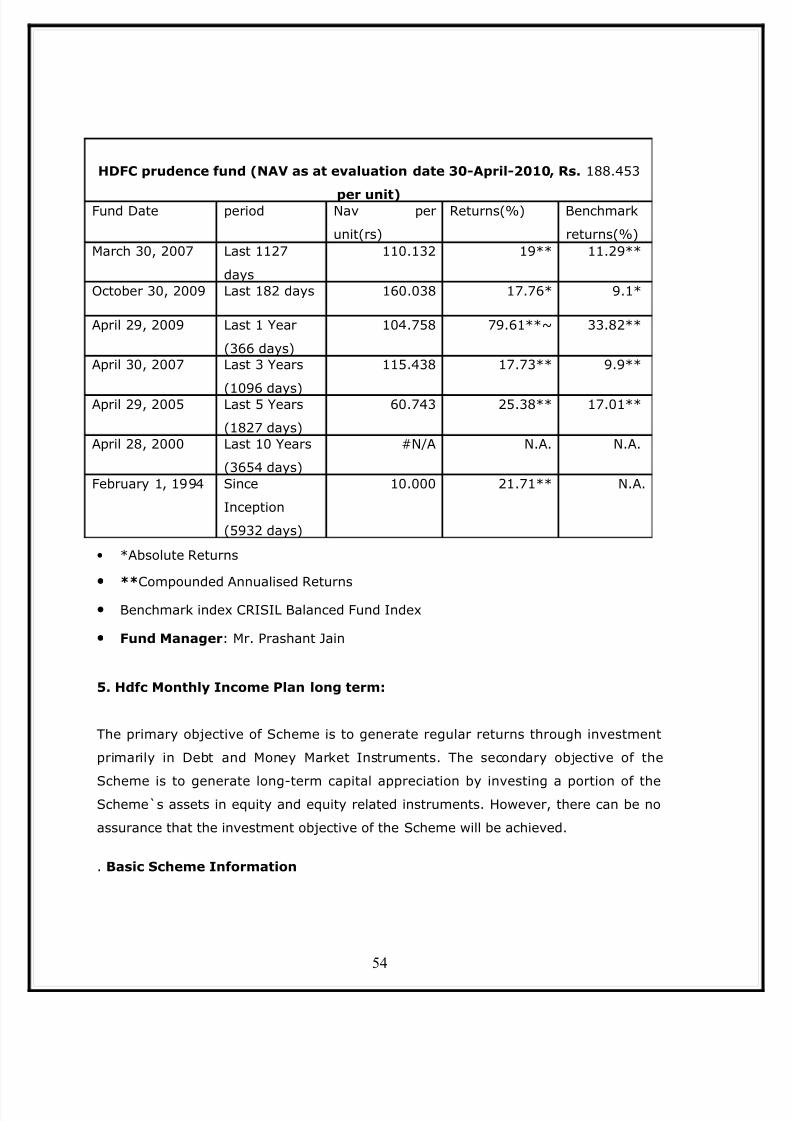
8/6/2019 Alekhya Sip Reportfinalll
http://slidepdf.com/reader/full/alekhya-sip-reportfinalll 54/80
• *Absolute Returns
• ** Compounded Annualised Returns
• Benchmark index CRISIL Balanced Fund Index
• Fund Manager : Mr. Prashant Jain
5. Hdfc Monthly Income Plan long term:
The primary objective of Scheme is to generate regular returns through investment
primarily in Debt and Money Market Instruments. The secondary objective of the
Scheme is to generate long-term capital appreciation by investing a portion of theScheme`s assets in equity and equity related instruments. However, there can be no
assurance that the investment objective of the Scheme will be achieved.
. Basic Scheme Information
HDFC prudence fund (NAV as at evaluation date 30-April-2010, Rs. 188.453
per unit)Fund Date period Nav per
unit(rs)
Returns(%) Benchmark
returns(%)March 30, 2007 Last 1127
days
110.132 19** 11.29**
October 30, 2009 Last 182 days 160.038 17.76* 9.1*
April 29, 2009 Last 1 Year
(366 days)
104.758 79.61**~ 33.82**
April 30, 2007 Last 3 Years
(1096 days)
115.438 17.73** 9.9**
April 29, 2005 Last 5 Years
(1827 days)
60.743 25.38** 17.01**
April 28, 2000 Last 10 Years
(3654 days)
#N/A N.A. N.A.
February 1, 1994 Since
Inception
(5932 days)
10.000 21.71** N.A.
54
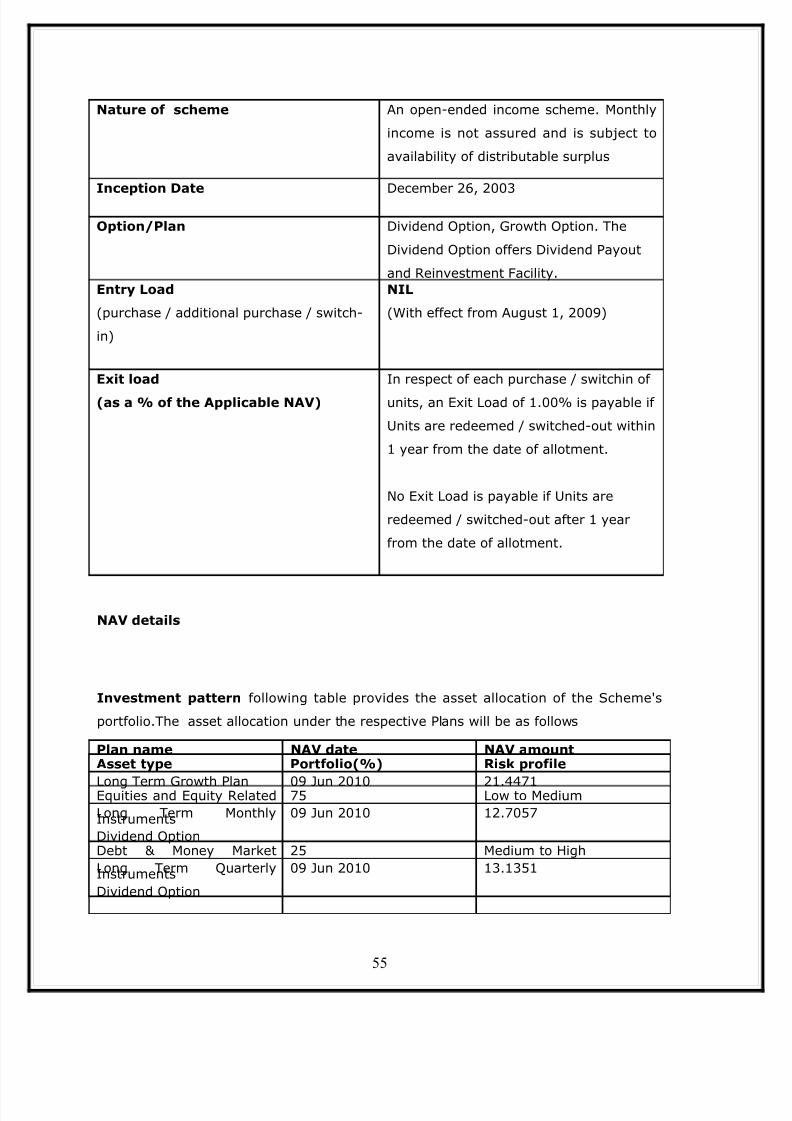
8/6/2019 Alekhya Sip Reportfinalll
http://slidepdf.com/reader/full/alekhya-sip-reportfinalll 55/80
NAV details
Investment pattern following table provides the asset allocation of the Scheme's
portfolio.The asset allocation under the respective Plans will be as follows
Nature of scheme An open-ended income scheme. Monthly
income is not assured and is subject to
availability of distributable surplus
Inception Date December 26, 2003
Option/Plan Dividend Option, Growth Option. The
Dividend Option offers Dividend Payout
and Reinvestment Facility.Entry Load
(purchase / additional purchase / switch-
in)
NIL
(With effect from August 1, 2009)
Exit load
(as a % of the Applicable NAV)
In respect of each purchase / switchin of
units, an Exit Load of 1.00% is payable if
Units are redeemed / switched-out within
1 year from the date of allotment.
No Exit Load is payable if Units are
redeemed / switched-out after 1 year
from the date of allotment.
Plan name NAV date NAV amount
Long Term Growth Plan 09 Jun 2010 21.4471Long Term Monthly
Dividend Option
09 Jun 2010 12.7057
Long Term Quarterly
Dividend Option
09 Jun 2010 13.1351
Asset type Portfolio(%) Risk profile
Equities and Equity Related
Instruments
75 Low to Medium
Debt & Money Market
Instruments
25 Medium to High
55

8/6/2019 Alekhya Sip Reportfinalll
http://slidepdf.com/reader/full/alekhya-sip-reportfinalll 56/80
Returns
• *Absolute Returns
• ** Compounded Annualised Returns
• Benchmark index CRISIL MIP blended Index
• Fund Manager : Mr. Shobhit Mehrotra
6. Hdfc Liquid fund
Investment objective : The primary objective of the Scheme is to enhance income
consistent with a high level of liquidity, through a judicious portfolio mix comprising of
money market and debt instruments.Basic Scheme Information
Nav details
HDFC MIP fund(NAV as at evaluation date 30-April-2010, Rs. 21.4447 per unit)
Fund Date period Nav per
unit(rs)
Returns(%) Benchmark
returns(%)March 30, 2007 Last 1127
days
14.7446 12.9** 8.52**
October 30, 2009 Last 182 days 20.0979 6.7* 4.73*
April 29, 2009 Last 1 Year
(366 days)
17.2035 24.58** 9.97**
April 30, 2007 Last 3 Years
(1096 days)
14.987 12.67** 8.2**
April 29, 2005 Last 5 Years
(1827 days)
11.300 13.65** 8.84**
April 28, 2000 Last 10 Years
(3654 days)
#N/A N.A. N.A.
December 26,2003
SinceInception
(2317 days)
10.000 12.77** 7.28**
Nature of scheme Open Ended High Liquidity Income
Scheme
Inception Date October 17 , 2000
Option/Plan Dividend Plan,Growth Plan. The Dividend
Plan offers Daily Dividend option
(reinvestment facility only); Weekly andMonthly Dividend option (with payout
and Reinvestment facility).Entry Load
(purchase / additional purchase / switch-
in)
NIL
(With effect from August 1, 2009)
Exit load
(as a % of the Applicable NAV)
NIL
56

8/6/2019 Alekhya Sip Reportfinalll
http://slidepdf.com/reader/full/alekhya-sip-reportfinalll 57/80
Returns
• *Absolute Returns
• ** Compounded Annualised Returns
• Benchmark index CRISIL liquid fund Index
• Fund Manager : Mr. Shobhit Mehrotra
Plan Name NAV Date NAV Amount
Daily Div Reinvest 09 Jun 2010 10.1982
Weekly Dividend Option 09 Jun 2010 10.3129
Monthly Dividend Option 09 Jun 2010 10.2748
Growth Plan 09 Jun 2010 18.3939
HDFC liquidfund(NAV as at evaluation date 30-April-2010, Rs. 18.305 per
unit)
Fund Date period Nav per
unit(rs)
Returns(%) Benchmark
returns(%)
Apr 23,10
Last 7 days 18.28 0.08 0.06
Apr 15,10
Last 15 days 18.27 0.18 0.14
Mar 30,10
Last 1 month 18.23 0.37 0.31
Jan 29,10
Last 3 months (1096
days)
18.12 0.99 0.97
Oct 30,09
Last 6months (1827
days)
17.94 1.98 1.67
Apr 29,09
Last 1 year (3654
days)
17.54 4.33 3.17
Apr 30,07
Last 3 years 14.994 6.87 6.37
Apr 30,05
Last 5 years 13.21 6.73 6.21
Oct 17,00
Since inception(3482
days)
10.00 6.54 N.A
57

8/6/2019 Alekhya Sip Reportfinalll
http://slidepdf.com/reader/full/alekhya-sip-reportfinalll 58/80
Investment pattern: The following table provides the asset allocation of the
Scheme's portfolio.The asset allocation under the respective Plans will be as follows.
Investment strategy : The Scheme will retain the flexibility to invest in the entire
range of money market and debt instruments.
7. Hdfc cash management savings plan
Investment objective
The investment objective of the Scheme is to generate optimal returns while
maintaining safety and high liquidity.
Basic Scheme Information
Type of Instruments Normal
Allocation
(% of Net
Assets)
Normal
Deviation
(% of Normal
Allocation)
Risk Profile of
the Instrument
Money Market
Instruments (including
cash/ call money)
50-90 50 Low
Debt
Instruments(including
securitised debt)
10-50 50 Low to Medium
58

8/6/2019 Alekhya Sip Reportfinalll
http://slidepdf.com/reader/full/alekhya-sip-reportfinalll 59/80
NAV details
Investment pattern following table provides the asset allocation of the Scheme's
portfolio.The asset allocation under the respective Plans will be as follows
Returns
Nature of scheme Open Ended High Liquidity Income
Scheme
Inception Date November 18, 1999
Option/Plan Growth Option, Daily dividend option(reinvestment facility only) and Weekly
dividend option (with payout and
Reinvestment facility).Entry Load
(purchase / additional purchase / switch-
in)
NIL
(With effect from August 1, 2009)
Exit load
(as a % of the Applicable NAV)
NIL
Plan Name NAV date NAV amount
Daily Div Reinvest 09 Jun 2010 10.6364
Growth Option 09 Jun 2010 19.42
Asset type Portfolio(%) Risk profile
Equities and Equity Related
Instruments
Upto 100 Low to Medium
Debt & Money Market
Instruments
Upto 100 Very low
59

8/6/2019 Alekhya Sip Reportfinalll
http://slidepdf.com/reader/full/alekhya-sip-reportfinalll 60/80
• *Absolute Returns
• ** Compounded Annualised Returns
• Benchmark index CRISIL liquid fund Index
• Fund Manager: Mr. Anil Bamboli
Comparative Analysis of HDFC with DSP BLACK ROCK and BIRLA SUN LIFE:
In this study I have considered 3 categories of funds namely Equity, Debt, Balanced.
In Equity category I have considered Hdfc Equity fund, Hdfc Top 200, Hdfc Tax saver,
Hdfc Infrastructure. In Debt category I have considered Hdfc Liquid fund, Hdfc cash
Mananagemnt Fund, Hdfc MIP long term
1. Equity funds
These funds often aims to provide medium to long term capital appreciation through
investment in shares of quality companies and by focusing on well established large
HDFC Cash management (NAV as at 30-April-2010, Rs. 19.3238 per unit)
Date period NAV per
unit(Rs.)
Returns(%) Benchmark
returns(%0
Apr 23,10
Last 7 days 19.30 0.09 0.06
Apr 15,10
Last 15 days 19.28 0.19 0.14
Mar 30,10Last 1 month 19.24 0.41 0.31
Jan 29,10
Last 3 months
(1096 days)
19.11 1.09 0.97
Oct 30,09
Last 6months
(1827 days)
18.91 2.16 1.67
Apr 29,09
Last 1 year
(3654 days)
18.46 4.61 3.17
Apr 30,07
Last 3 years 15.75 7.04 6.37
Apr 30,05Last 5 years 13.84 6.89 6.21
Apr 28 ,00 Last 10 years 10.07 6.73 N.ANov 18,99 Since inception 10.00 6.54 N.A
60
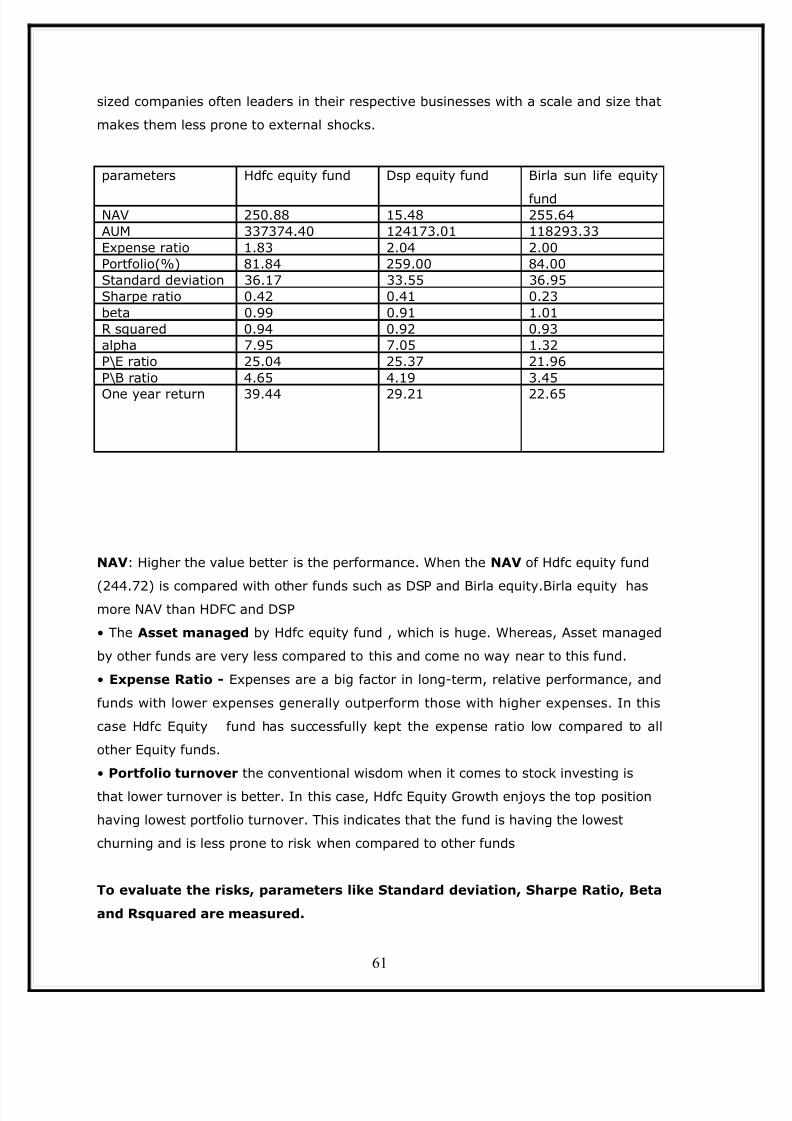
8/6/2019 Alekhya Sip Reportfinalll
http://slidepdf.com/reader/full/alekhya-sip-reportfinalll 61/80
sized companies often leaders in their respective businesses with a scale and size that
makes them less prone to external shocks.
NAV : Higher the value better is the performance. When the NAV of Hdfc equity fund
(244.72) is compared with other funds such as DSP and Birla equity.Birla equity hasmore NAV than HDFC and DSP
• The Asset managed by Hdfc equity fund , which is huge. Whereas, Asset managed
by other funds are very less compared to this and come no way near to this fund.
• Expense Ratio - Expenses are a big factor in long-term, relative performance, and
funds with lower expenses generally outperform those with higher expenses. In this
case Hdfc Equity fund has successfully kept the expense ratio low compared to all
other Equity funds.
• Portfolio turnover the conventional wisdom when it comes to stock investing is
that lower turnover is better. In this case, Hdfc Equity Growth enjoys the top position
having lowest portfolio turnover. This indicates that the fund is having the lowest
churning and is less prone to risk when compared to other funds
To evaluate the risks, parameters like Standard deviation, Sharpe Ratio, Beta
and Rsquared are measured.
parameters Hdfc equity fund Dsp equity fund Birla sun life equity
fundNAV 250.88 15.48 255.64AUM 337374.40 124173.01 118293.33Expense ratio 1.83 2.04 2.00Portfolio(%) 81.84 259.00 84.00Standard deviation 36.17 33.55 36.95Sharpe ratio 0.42 0.41 0.23beta 0.99 0.91 1.01R squared 0.94 0.92 0.93alpha 7.95 7.05 1.32P\E ratio 25.04 25.37 21.96P\B ratio 4.65 4.19 3.45One year return 39.44 29.21 22.65
61
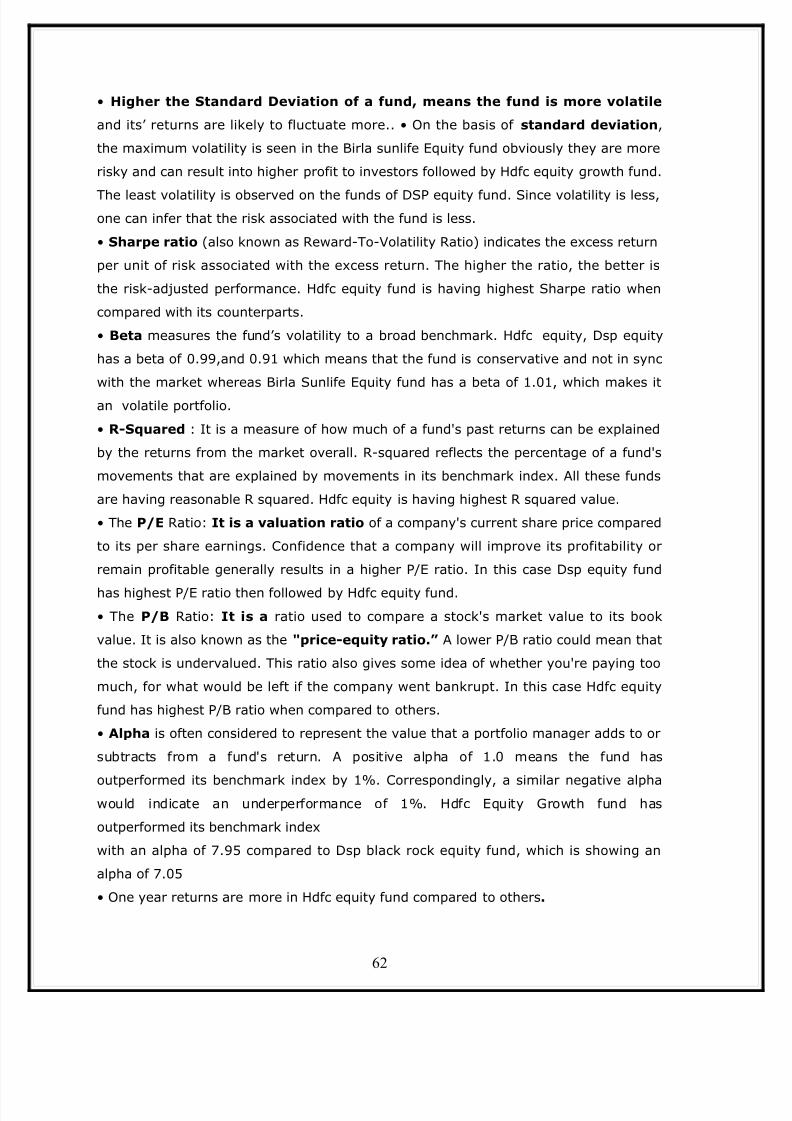
8/6/2019 Alekhya Sip Reportfinalll
http://slidepdf.com/reader/full/alekhya-sip-reportfinalll 62/80
• Higher the Standard Deviation of a fund, means the fund is more volatile
and its’ returns are likely to fluctuate more.. • On the basis of standard deviation ,
the maximum volatility is seen in the Birla sunlife Equity fund obviously they are more
risky and can result into higher profit to investors followed by Hdfc equity growth fund.
The least volatility is observed on the funds of DSP equity fund. Since volatility is less,one can infer that the risk associated with the fund is less.
• Sharpe ratio (also known as Reward-To-Volatility Ratio) indicates the excess return
per unit of risk associated with the excess return. The higher the ratio, the better is
the risk-adjusted performance. Hdfc equity fund is having highest Sharpe ratio when
compared with its counterparts.
• Beta measures the fund’s volatility to a broad benchmark. Hdfc equity, Dsp equity
has a beta of 0.99,and 0.91 which means that the fund is conservative and not in sync
with the market whereas Birla Sunlife Equity fund has a beta of 1.01, which makes it
an volatile portfolio.
• R-Squared : It is a measure of how much of a fund's past returns can be explained
by the returns from the market overall. R-squared reflects the percentage of a fund's
movements that are explained by movements in its benchmark index. All these funds
are having reasonable R squared. Hdfc equity is having highest R squared value.
• The P/E Ratio: It is a valuation ratio of a company's current share price compared
to its per share earnings. Confidence that a company will improve its profitability or
remain profitable generally results in a higher P/E ratio. In this case Dsp equity fund
has highest P/E ratio then followed by Hdfc equity fund.• The P/B Ratio: It is a ratio used to compare a stock's market value to its book
value. It is also known as the "price-equity ratio.” A lower P/B ratio could mean that
the stock is undervalued. This ratio also gives some idea of whether you're paying too
much, for what would be left if the company went bankrupt. In this case Hdfc equity
fund has highest P/B ratio when compared to others.
• Alpha is often considered to represent the value that a portfolio manager adds to or
subtracts from a fund's return. A positive alpha of 1.0 means the fund has
outperformed its benchmark index by 1%. Correspondingly, a similar negative alphawould indicate an underperformance of 1%. Hdfc Equity Growth fund has
outperformed its benchmark index
with an alpha of 7.95 compared to Dsp black rock equity fund, which is showing an
alpha of 7.05
• One year returns are more in Hdfc equity fund compared to others .
62
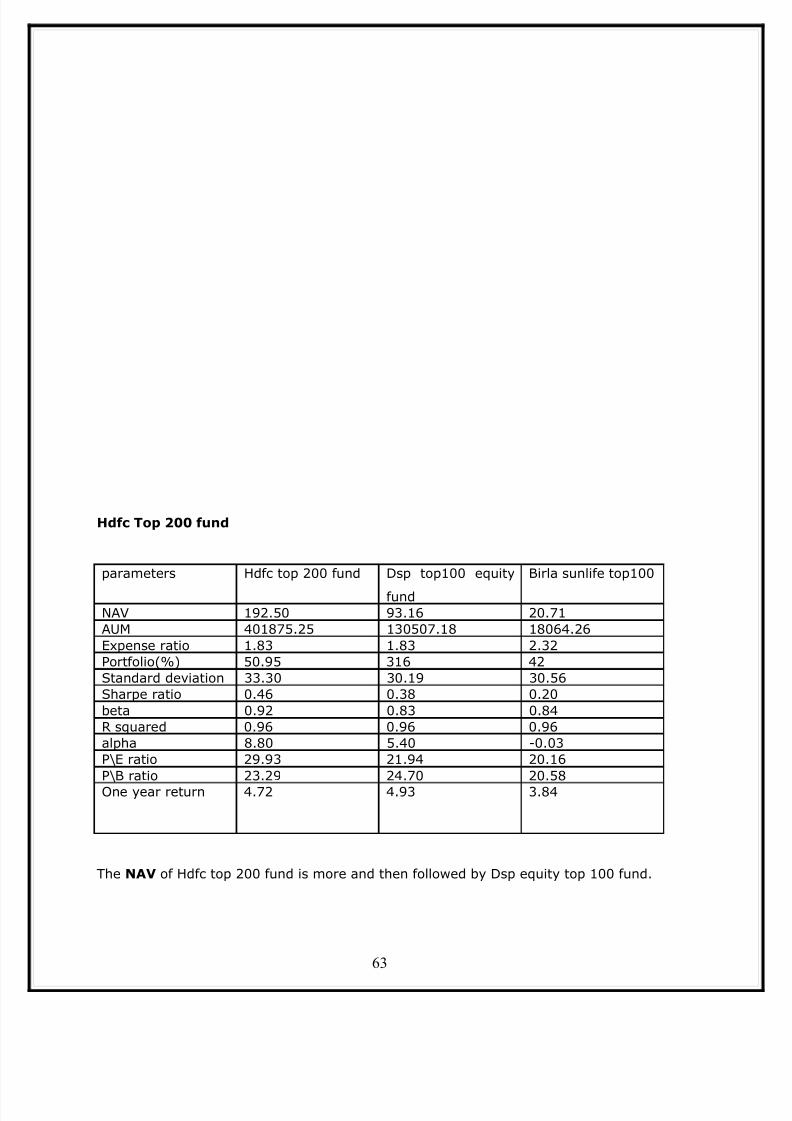
8/6/2019 Alekhya Sip Reportfinalll
http://slidepdf.com/reader/full/alekhya-sip-reportfinalll 63/80
Hdfc Top 200 fund
The NAV of Hdfc top 200 fund is more and then followed by Dsp equity top 100 fund.
parameters Hdfc top 200 fund Dsp top100 equity
fund
Birla sunlife top100
NAV 192.50 93.16 20.71AUM 401875.25 130507.18 18064.26Expense ratio 1.83 1.83 2.32Portfolio(%) 50.95 316 42Standard deviation 33.30 30.19 30.56Sharpe ratio 0.46 0.38 0.20beta 0.92 0.83 0.84R squared 0.96 0.96 0.96alpha 8.80 5.40 -0.03P\E ratio 29.93 21.94 20.16P\B ratio 23.29 24.70 20.58One year return 4.72 4.93 3.84
63
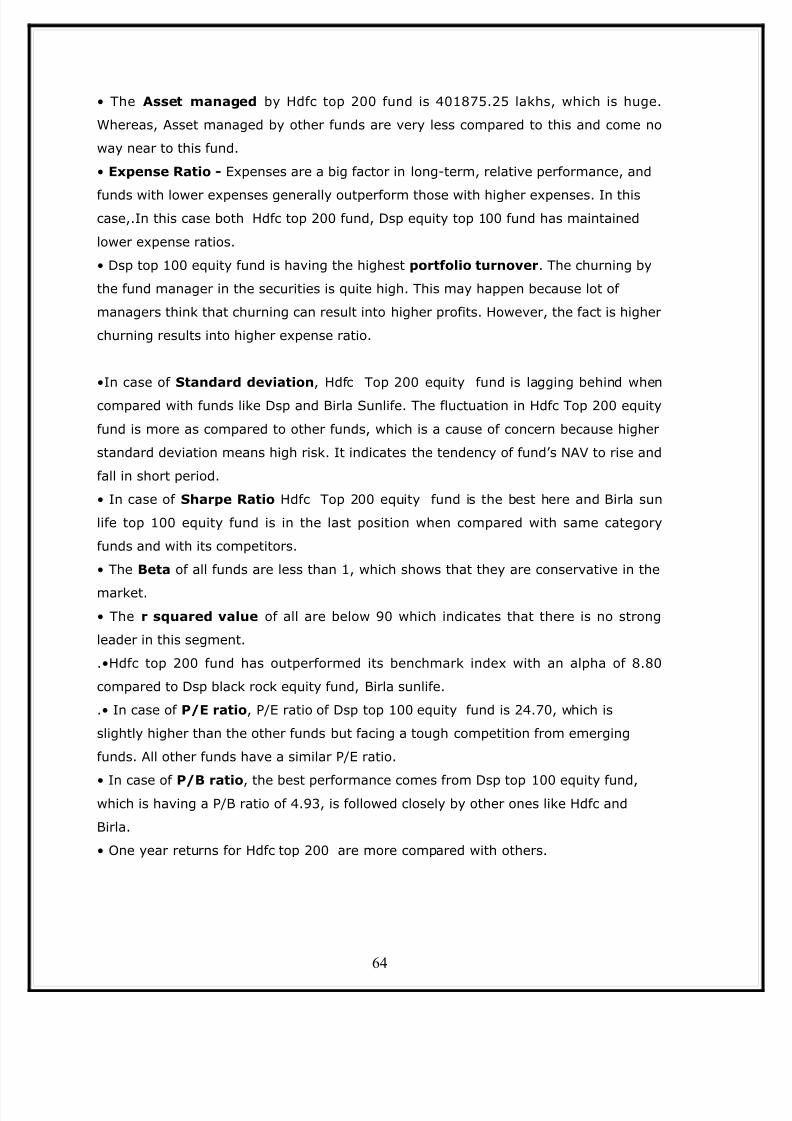
8/6/2019 Alekhya Sip Reportfinalll
http://slidepdf.com/reader/full/alekhya-sip-reportfinalll 64/80
• The Asset managed by Hdfc top 200 fund is 401875.25 lakhs, which is huge.
Whereas, Asset managed by other funds are very less compared to this and come no
way near to this fund.
• Expense Ratio - Expenses are a big factor in long-term, relative performance, and
funds with lower expenses generally outperform those with higher expenses. In thiscase,.In this case both Hdfc top 200 fund, Dsp equity top 100 fund has maintained
lower expense ratios.
• Dsp top 100 equity fund is having the highest portfolio turnover . The churning by
the fund manager in the securities is quite high. This may happen because lot of
managers think that churning can result into higher profits. However, the fact is higher
churning results into higher expense ratio.
•In case of Standard deviation , Hdfc Top 200 equity fund is lagging behind when
compared with funds like Dsp and Birla Sunlife. The fluctuation in Hdfc Top 200 equity
fund is more as compared to other funds, which is a cause of concern because higher
standard deviation means high risk. It indicates the tendency of fund’s NAV to rise and
fall in short period.
• In case of Sharpe Ratio Hdfc Top 200 equity fund is the best here and Birla sun
life top 100 equity fund is in the last position when compared with same category
funds and with its competitors.
• The Beta of all funds are less than 1, which shows that they are conservative in the
market.• The r squared value of all are below 90 which indicates that there is no strong
leader in this segment.
.•Hdfc top 200 fund has outperformed its benchmark index with an alpha of 8.80
compared to Dsp black rock equity fund, Birla sunlife.
.• In case of P/E ratio , P/E ratio of Dsp top 100 equity fund is 24.70, which is
slightly higher than the other funds but facing a tough competition from emerging
funds. All other funds have a similar P/E ratio.
• In case of P/B ratio , the best performance comes from Dsp top 100 equity fund,which is having a P/B ratio of 4.93, is followed closely by other ones like Hdfc and
Birla.
• One year returns for Hdfc top 200 are more compared with others.
64

8/6/2019 Alekhya Sip Reportfinalll
http://slidepdf.com/reader/full/alekhya-sip-reportfinalll 65/80
Tax Benefit Funds
These funds often seeks medium to long-term growth of capital, with income tax
rebate.
Death and taxes, they say, are the two inevitabilities. While one can hardly do
anything about the first, tax saving instruments can offer relief to alleviate some of
the pain caused by the latter. While tax-saving instruments like EPF, PPF, and NSChave been there for long, equity linked savings scheme (ELSS) are now offering
investors a way to look beyond the world of low returns.
NAV : Hdfc tax saver fund has managed to maintain a very good position and aheadparameters Hdfc tax saver fund Dsp tax saver fund Birla sunlife tax
planNAV 216.30 16.43 12.82
AUM 152249.62 50520.47 4841.53Expense ratio 1.94 2.08 2.41
Portfolio(%) 18.99 114 72.00Standard deviation 33.83 35.77 34.58Sharpe ratio 0.33 0.37 0.06beta 0.92 0.95 0.94R squared 0.94 0.89 0.94alpha 4.37 6.36 -.4.64P/E ratio 22.21 23.57 25.29P\B ratio 4.73 5.23 5.171 year return 43.38 33.27 12.52
65
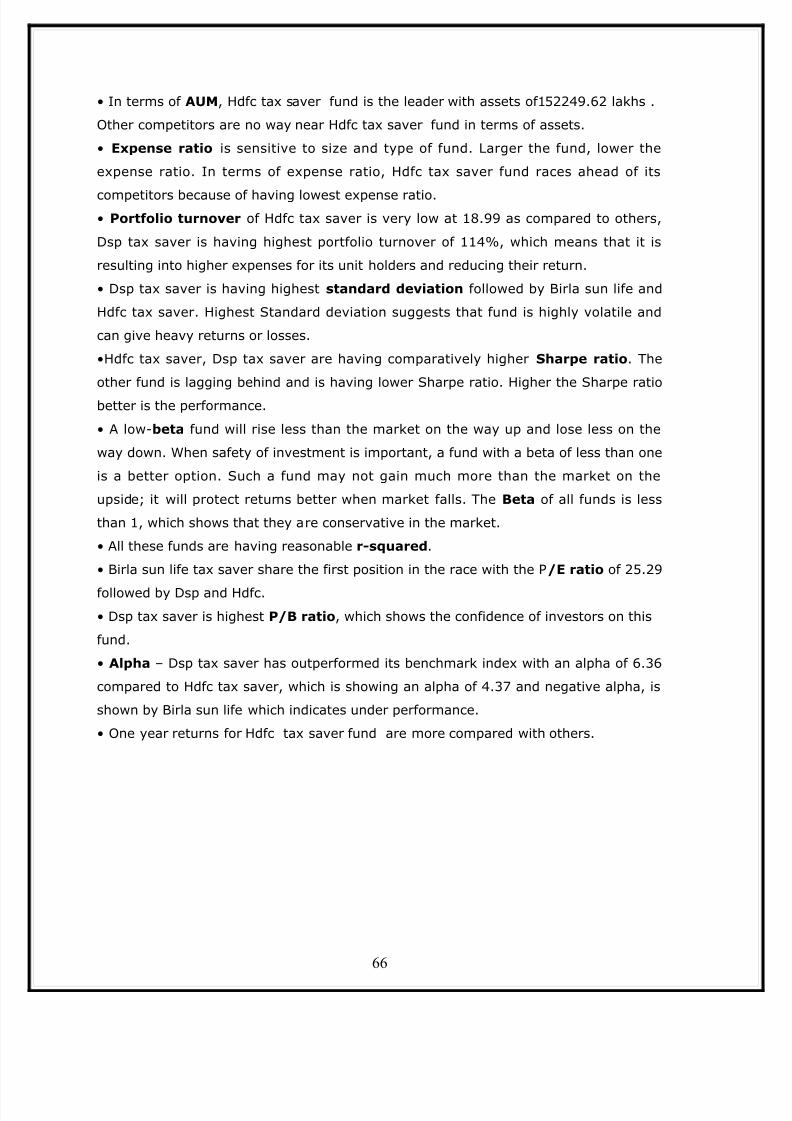
8/6/2019 Alekhya Sip Reportfinalll
http://slidepdf.com/reader/full/alekhya-sip-reportfinalll 66/80
• In terms of AUM , Hdfc tax saver fund is the leader with assets of152249.62 lakhs .
Other competitors are no way near Hdfc tax saver fund in terms of assets.
• Expense ratio is sensitive to size and type of fund. Larger the fund, lower the
expense ratio. In terms of expense ratio, Hdfc tax saver fund races ahead of its
competitors because of having lowest expense ratio.• Portfolio turnover of Hdfc tax saver is very low at 18.99 as compared to others,
Dsp tax saver is having highest portfolio turnover of 114%, which means that it is
resulting into higher expenses for its unit holders and reducing their return.
• Dsp tax saver is having highest standard deviation followed by Birla sun life and
Hdfc tax saver. Highest Standard deviation suggests that fund is highly volatile and
can give heavy returns or losses.
•Hdfc tax saver, Dsp tax saver are having comparatively higher Sharpe ratio . The
other fund is lagging behind and is having lower Sharpe ratio. Higher the Sharpe ratio
better is the performance.
• A low- beta fund will rise less than the market on the way up and lose less on the
way down. When safety of investment is important, a fund with a beta of less than one
is a better option. Such a fund may not gain much more than the market on the
upside; it will protect returns better when market falls. The Beta of all funds is less
than 1, which shows that they are conservative in the market.
• All these funds are having reasonable r-squared .
• Birla sun life tax saver share the first position in the race with the P /E ratio of 25.29
followed by Dsp and Hdfc.• Dsp tax saver is highest P/B ratio , which shows the confidence of investors on this
fund.
• Alpha – Dsp tax saver has outperformed its benchmark index with an alpha of 6.36
compared to Hdfc tax saver, which is showing an alpha of 4.37 and negative alpha, is
shown by Birla sun life which indicates under performance.
• One year returns for Hdfc tax saver fund are more compared with others.
66
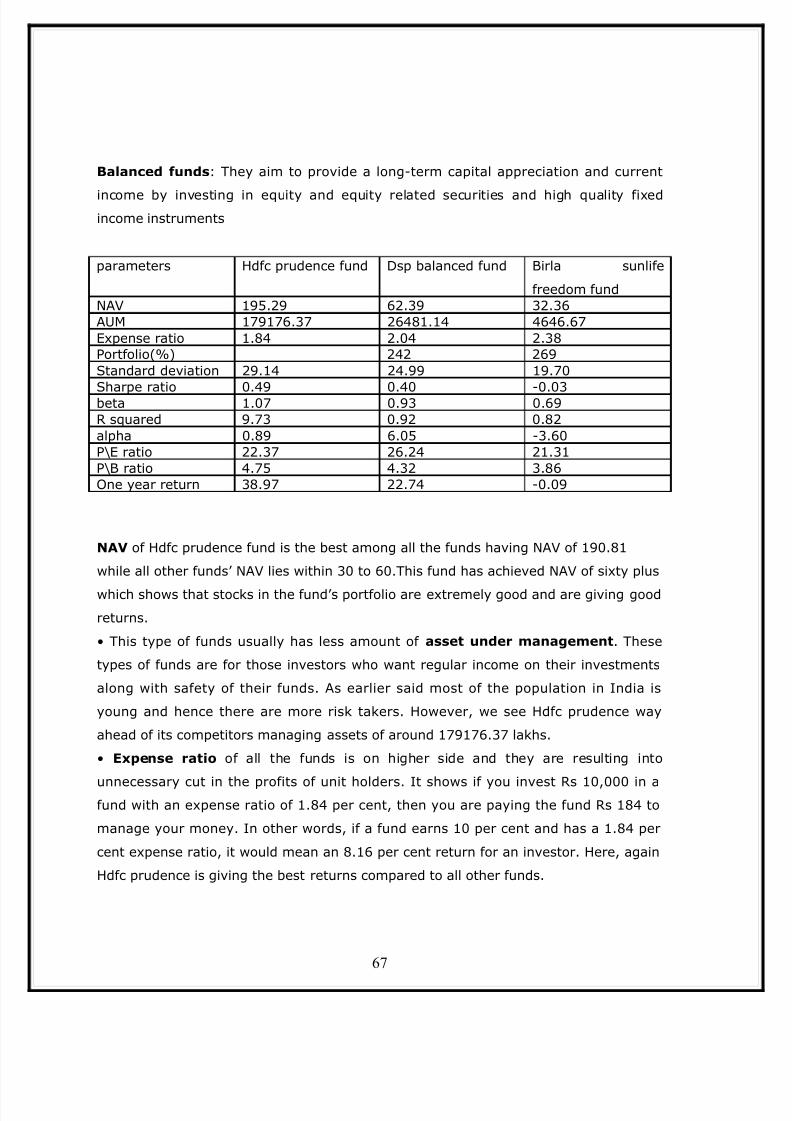
8/6/2019 Alekhya Sip Reportfinalll
http://slidepdf.com/reader/full/alekhya-sip-reportfinalll 67/80
Balanced funds : They aim to provide a long-term capital appreciation and current
income by investing in equity and equity related securities and high quality fixedincome instruments
parameters Hdfc prudence fund Dsp balanced fund Birla sunlife
freedom fundNAV 195.29 62.39 32.36AUM 179176.37 26481.14 4646.67Expense ratio 1.84 2.04 2.38Portfolio(%) 242 269Standard deviation 29.14 24.99 19.70
Sharpe ratio 0.49 0.40 -0.03beta 1.07 0.93 0.69R squared 9.73 0.92 0.82alpha 0.89 6.05 -3.60P\E ratio 22.37 26.24 21.31P\B ratio 4.75 4.32 3.86One year return 38.97 22.74 -0.09
NAV of Hdfc prudence fund is the best among all the funds having NAV of 190.81
while all other funds’ NAV lies within 30 to 60.This fund has achieved NAV of sixty plus
which shows that stocks in the fund’s portfolio are extremely good and are giving good
returns.
• This type of funds usually has less amount of asset under management . These
types of funds are for those investors who want regular income on their investments
along with safety of their funds. As earlier said most of the population in India is
young and hence there are more risk takers. However, we see Hdfc prudence way
ahead of its competitors managing assets of around 179176.37 lakhs.
• Expense ratio of all the funds is on higher side and they are resulting into
unnecessary cut in the profits of unit holders. It shows if you invest Rs 10,000 in afund with an expense ratio of 1.84 per cent, then you are paying the fund Rs 184 to
manage your money. In other words, if a fund earns 10 per cent and has a 1.84 per
cent expense ratio, it would mean an 8.16 per cent return for an investor. Here, again
Hdfc prudence is giving the best returns compared to all other funds.
67

8/6/2019 Alekhya Sip Reportfinalll
http://slidepdf.com/reader/full/alekhya-sip-reportfinalll 68/80
• Portfolio turnover ratios are not available for all the funds so comparison is not
possible.
• Birla sun life balanced fund has the lowest standard deviation and is comparatively
exposed to less risk while Hdfc prudence has highest standard deviation which
indicates that they are more exposed to risk.• Sharpe ratio is a measure that uses the standard deviation and excess return to
determine reward per unit of risk. High values indicate greater return per unit of risk.
Hdfc balanced fund steals the show on this factors loosely followed by Dsp balanced
fund.
• Beta of Dsp balanced, Birla sun life balanced are less than 1 which indicates that
they are very conservative and are not in tandem with market.Hdfc prudence fund is
having beta of 1.07 which indicates it is more volatile than the market.
• Again, R-squared of all the balanced funds are less than 95. This shows that there
is no strong leader in this segment.
• P/E Ratio of Dsp Balanced fund is the highest P/E Ratio showing the confidence that
the company will remain profitable.
• Hdfc prudence fund is having highest P/B ratio , which shows the confidence of
investors on this fund.
• Alpha is often considered to represent the value that a portfolio manager adds to or
subtracts from a fund's return. In this case, Dsp Balanced fund has outperformed its
benchmark index with an alpha of 6.05. Other funds have a comparatively very low
alpha values or are negative in nature which indicates their underperformance.• One year returns for Hdfc prudence fund are more compared with others.
68

8/6/2019 Alekhya Sip Reportfinalll
http://slidepdf.com/reader/full/alekhya-sip-reportfinalll 69/80
Income funds : These schemes invest in money markets, bonds and debentures of
corporate companies with medium and long-term maturities. These schemes primarily
target current income instead of capital appreciation.
1. MIP-Monthly Income Plan
• The NAV of Birla sun life Mip fund is more then followed by Hdfc Mip long term.
• The Asset managed by Hdfc Mip long term is 250962.56 lakhs, which is huge.
Whereas, Asset managed by other funds are very less compared to this and come no
way near to this fund.
• Expense Ratio - Expenses are a big factor in long-term, relative performance, and
funds with lower expenses generally outperform those with higher expenses. In this
case Hdfc Mip long term is maintaining lower expense ratio.
• Portfolio turnover ratios are not available for all the funds so comparison is not
possible
•In case of Standard deviation , Hdfc Mip long term fund is lagging behind when
compared with funds like Dsp and Birla Sun life. The fluctuation in Hdfc Top 200 equityfund is more as compared to other funds, which is a cause of concern because higher
standard deviation means high risk. It indicates the tendency of fund’s NAV to rise and
fall in short period.
parameters Hdfc Mip longtem
fund
DspSavings
manager(aggressive
fund)
Birla sunlife Mip
fund
NAV 21.75 18.51 25.30AUM 250962.56 8318.50 11344.42Expense ratio 1.58 2.14 2.11Portfolio(%) - - 10.00
Standarddeviation
10.60 6.64 7.84
Sharpe ratio 0.69 0.59 0.48beta 1.14 0.70 0.78R squared 0.73 0.72 0.64alpha 4.43 2.13 1.74P\E ratio 23.80 16.93 23.73P\B ratio 4.82 3.59 4.51One year return 15.10 9.50 8.43
69

8/6/2019 Alekhya Sip Reportfinalll
http://slidepdf.com/reader/full/alekhya-sip-reportfinalll 70/80
• In case of Sharpe Ratio Hdfc Mip long term fund is the best here and Birla sun life
Mip fund is in the last position when compared with same category funds and with its
competitors.
• The Beta of Hdfc Mip long term fund is more than 1, which shows that they are
more volatile relative to the benchmark index and remaining funds are conservative innature.
• The r squared values of all are below 90 which indicates that there is no strong
leader in this segment.
• In case of P/E ratio , Hdfc Mip long term fund is 23.80, which is slightly higher than
Birla sun life Mip.
• In case of P/B ratio , the best performance comes from Hdfc Mip long term fund,
which is having a P/B ratio of 4.82, is followed closely by Birla.
• In case of alpha Hdfc Mip long term fund has outperformed its benchmark index with
an alpha of 4.43.
• One year returns for Hdfc MIP long term fund are more compared with others.
2. Liquid fund
parameters Hdfc liquid fund Dsp liquidity fund Birla sunlife cash
70

8/6/2019 Alekhya Sip Reportfinalll
http://slidepdf.com/reader/full/alekhya-sip-reportfinalll 71/80
plus fundNav 18.45 22.14 24.74AUM 3187.10 3134.59 12313.33Expense ratio 0.28 0.57 0.46Portfolio(%) - - -Standard deviation 0.19 0.20 0.19Sharpe ratio 6.14 0.67 2.01beta 0.02 0.01 0.01R squared 0.02 0.02 0.01alpha 0.89 0.37 0.371 year return 4.28 3.57 3.74
NAV: Birla sun life cash plus fund has managed to maintain a very good position and
ahead of its competitors in the segment with a NAV of Rs. 24.66. This shows that Birla
sun life cash plus fund is outperforming its competitors.
• In terms of AUM , Birla sun life cash plus fund is the leader with assets of12313.33
lakhs
• Expense ratio is sensitive to size and type of fund. Larger the fund, lower the
expense ratio. In terms of expense ratio, Hdfc liquid fund races ahead of its
competitors because of having lowest expense ratio.
• Portfolio turnover ratio of all the three funds are not available so comparison is
not possible.
• Standard Deviations of all the funds are similar and among these Dsp liquidity is
more which indicates volatility than competitors.
•Hdfc liquid fund is having comparatively higher Sharpe ratio . The other fund islagging behind and is having lower Sharpe ratio. Higher the Sharpe ratio better is the
performance.
• A low- beta fund will rise less than the market on the way up and lose less on the
way down. When safety of investment is important, a fund with a beta of less than one
is a better option. Such a fund may not gain much more than the market on the
upside; it will protect returns better when market falls. The Beta of all funds is less
than 1, which shows that they are conservative in the market.
• All these funds are having very low r-squared values.
• P/E ratios and P/B ratios of all the funds are not available so they cannot be
compared.
• Alpha is often considered to represent the value that a portfolio manager adds to or
subtracts from a fund's return. All funds have a comparatively very low alpha values
which indicates their underperformance
• One year returns for Hdfc liquid fund are more compared with others.
71

8/6/2019 Alekhya Sip Reportfinalll
http://slidepdf.com/reader/full/alekhya-sip-reportfinalll 72/80
3. Cash management fund
72

8/6/2019 Alekhya Sip Reportfinalll
http://slidepdf.com/reader/full/alekhya-sip-reportfinalll 73/80
NAV : Higher the value better is the performance. The NAV of Dsp money manager
fund (244.72) is highest among all which shows good performance.
• The Asset managed by Hdfc cash management fund, which is huge. Whereas,
Asset managed by other funds are very less compared to this and come no way near
to this fund.
• Expense Ratio - Expenses are a big factor in long-term, relative performance, and
funds with lower expenses generally outperform those with higher expenses. In this
case Hdfc cash management fund and Birla sun life cash manager fund has
successfully kept the expense ratio low.• Portfolio turnover ratios are not available so they cannot be compared.
• Higher the Standard Deviation of a fund, means the fund is more volatile
and its’ returns are likely to fluctuate more.. On the basis of standard deviation , the
maximum volatility is seen in the Dsp money manager fund obviously they are more
risky and can result into higher profit to investors followed by Birla sunlife cash
manager fund. The least volatility is observed in Hdfc cash management fund. Since
volatility is less, one can infer that the risk associated with the fund is less.
• Sharpe ratio (also known as Reward-To-Volatility Ratio) indicates the excess return
per unit of risk associated with the excess return. The higher the ratio, the better is
the risk-adjusted performance. Hdfc cash management fund is having highest Sharpe
ratio when compared with its counterparts.
• Beta of all the funds is less than 1 which indicates that all funds are conservative in
market.
parameters Hdfc cash management
fund
Dsp money
manager fund
Birla sunlife
cash managerfund
NAV 19.49 1280.03 22.71AUM 117077.01 12105.48 2671.51Expense ratio 0.25 0.86 0.25Portfolio(%)Standard
deviation
0.18 0.36 0.20
Sharpe ratio 6.26 2.07 4.07beta 0.02 0.07 0.01R squared 1.13 0.00 0.01
alpha 0.03 0.74 0.821 year return 4.56 3.55 4.16
73

8/6/2019 Alekhya Sip Reportfinalll
http://slidepdf.com/reader/full/alekhya-sip-reportfinalll 74/80
• R-Squared: It is a measure of how much of a fund's past returns can be explained
by the
Returns from the market overall. All these funds are having very low values which
indicate all the percentages of fund’s movements are not explained by movements in
its benchmark index.• The P/E Ratio and P/B Ratio are not available so they cannot be compared.
• Alpha of Hdfc cash management fund, Birla sun life cash manager fund Dsp money
manager fund are greater than 0 which means the fund is in sync with the benchmark
index.
• One year returns for Hdfc Cash management fund are more compared with others.
Thematic funds: Thematic funds were meant to be the solution to that malaise.
Thematic funds invest in a theme rather than in a single sector. So while the fund
manager’s investment options remained restricted to the theme, there are still several
sectors to choose from within that theme. A theme like infrastructure for instance, has
several related sectors like cement, steel, capital goods/engineering as also unrelatedsectors like banking and finance
parameters Hdfc infrastructure Dsp tiger fund Birla infrastructure fundNAV 11.70 46.79 17.00AUM 102325.27 178028.95 26577.32Expense ratio 1.90 1.78 2.22Portfolio(%) 20.01 95.00 65.00Standard
deviation
37.81 41.29
Sharpe ratio 0.24 0.26beta 1.04 1.12R squared 0.96 0.93alpha 1.54 2.63P\E ratio 27.84 22.51 24.68P\B ratio 3.72 3.50 3.281 year return 30.69 13.81 17.95
74
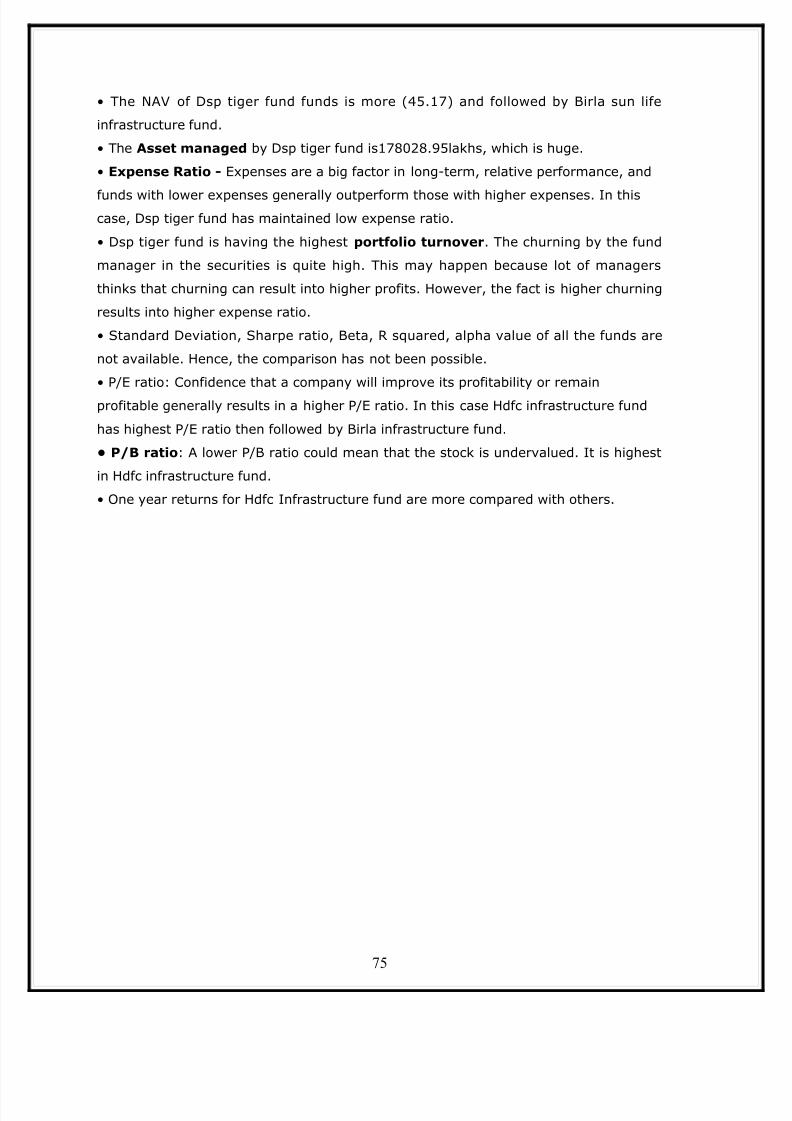
8/6/2019 Alekhya Sip Reportfinalll
http://slidepdf.com/reader/full/alekhya-sip-reportfinalll 75/80
• The NAV of Dsp tiger fund funds is more (45.17) and followed by Birla sun life
infrastructure fund.
• The Asset managed by Dsp tiger fund is178028.95lakhs, which is huge.
• Expense Ratio - Expenses are a big factor in long-term, relative performance, and
funds with lower expenses generally outperform those with higher expenses. In thiscase, Dsp tiger fund has maintained low expense ratio.
• Dsp tiger fund is having the highest portfolio turnover . The churning by the fund
manager in the securities is quite high. This may happen because lot of managers
thinks that churning can result into higher profits. However, the fact is higher churning
results into higher expense ratio.
• Standard Deviation, Sharpe ratio, Beta, R squared, alpha value of all the funds are
not available. Hence, the comparison has not been possible.
• P/E ratio: Confidence that a company will improve its profitability or remain
profitable generally results in a higher P/E ratio. In this case Hdfc infrastructure fund
has highest P/E ratio then followed by Birla infrastructure fund.
• P/B ratio : A lower P/B ratio could mean that the stock is undervalued. It is highest
in Hdfc infrastructure fund.
• One year returns for Hdfc Infrastructure fund are more compared with others.
75

8/6/2019 Alekhya Sip Reportfinalll
http://slidepdf.com/reader/full/alekhya-sip-reportfinalll 76/80
CHAPTER 6
FINDINGS AND CONCLUSION
76
8/6/2019 Alekhya Sip Reportfinalll
http://slidepdf.com/reader/full/alekhya-sip-reportfinalll 77/80
FINDINGS AND CONCLUSION
Equity funds
• NAV : Higher the value better is the performance. When the NAV of Hdfc equity
fund (244.72) is compared with other funds such as DSP and Birla equity.Birla
equity has more NAV than HDFC and DSP.• Hdfc Equity fund has successfully kept the expense ratio low compared to all
other Equity funds.
• Sharpe ratio (also known as Reward-To-Volatility Ratio) indicates the excess
return per unit of risk associated with the excess return. The higher the ratio,
the better is the risk-adjusted performance. Hdfc equity fund is having highest
Sharpe ratio when compared with its counterparts.
• The NAV of Hdfc top 200 fund is more and then followed by Dsp equity top 100
fund.• Hdfc top 200 fund, Dsp equity top 100 fund has maintained lower expense
ratios.Hdfc Top 200 equity fund is the best here and Birla sun life top 100
equity fund is in the last position when compared with same category funds
and with its competitors.
Tax saver funds
• Hdfc tax saver fund has managed to maintain a very good position and ahead
of its competitors in the segment with a NAV of Rs. 211.33. This shows that
Hdfc tax saver fund is outperforming its competitors.
77
8/6/2019 Alekhya Sip Reportfinalll
http://slidepdf.com/reader/full/alekhya-sip-reportfinalll 78/80
• Hdfc tax saver fund races ahead of its competitors because of having lowest
expense ratio
• Hdfc tax saver, Dsp tax saver are having comparatively higher Sharpe ratio .
Balanced funds
• NAV of Hdfc prudence fund is the best among all the funds having NAV of
190.81.• Hdfc prudence is giving the best returns compared to all other funds due to
smaller expense ratio.
• Hdfc prudence fund steals the show on the sharpe ratio factor loosely followed
by Dsp balanced fund.
Debt funds• The NAV of Birla sun life Mip fund is more then followed by Hdfc Mip long term
• Hdfc Mip long term is maintaining lower expense ratio.
• Sharpe Ratio of Hdfc Mip long term fund is the best here and Birla sun life Mip
fund is in the last position when compared with same category funds and with
its competitors.
• NAV of Birla sun life cash plus fund has managed to maintain a very good
position and ahead of its competitors in the segment with a NAV of Rs. 24.66.• Hdfc liquid fund races ahead of its competitors because of having lowest
expense ratio.
• Hdfc liquid fund is having comparatively higher Sharpe ratio . The other fund is
lagging behind and is having lower Sharpe ratio.
• The NAV of Dsp money manager fund (244.72) is highest among all which
shows good performance.• Hdfc cash management fund and Birla sun life cash manager fund has
successfully kept the expense ratio low.• Hdfc cash management fund is having highest Sharpe ratio when compared
with its counterparts.
Thematic fund
• The NAV of Dsp tiger fund funds is more (45.17) and followed by Birla sun life
infrastructure fund. Dsp tiger fund has maintained low expense ratio.
78

8/6/2019 Alekhya Sip Reportfinalll
http://slidepdf.com/reader/full/alekhya-sip-reportfinalll 79/80
• All the one year returns of all the Hdfc funds are greater than Dsp and Birla
Sunlife Mutual funds.
The study concludes that all Hdfc products which are taken for comparison have been
performing well. This can be said based on the parameters considered such as Netasset value, Assets under management, Expense ratio. Assets managed by Hdfc
products are high when compared with Birla and Dsp black rock. Even The Expense
ratios have been very low which indicates that funds are performing well and One year
returns are also high for all the products. So Finally we can conclude that Hdfc
products have been performing well and we can also suggest the customers that Hdfc
would be a better alternative for them to invest.
CHAPTER 7
BIBLIOGRAPHY
79

8/6/2019 Alekhya Sip Reportfinalll
http://slidepdf.com/reader/full/alekhya-sip-reportfinalll 80/80
BIBLIOGRAPHY
Websites
• www.valuresearchonline.com
• Hdfc fund.com
• www.amfiindia.com
• www.mutualfundsindia.com
• www.investopedia.com
• Brochures and fact sheets of various funds from respective web pages