Embed Size (px)
Citation preview
1
Alibaba Group Announces September Quarter 2014 Results
Hangzhou, China, November 4, 2014 – Alibaba Group Holding Limited (NYSE: BABA) today announced
its financial results for the quarter ended September 30, 2014.
“We delivered a strong quarter with significant growth across our key operating metrics,” said Jonathan Lu,
chief executive officer of Alibaba Group. “Our business continues to perform well, and our results reflect
both the strength of our ecosystem and the strong foundation we have for sustainable growth. On our China
retail marketplaces, gross merchandise volume for the quarter increased 49% and annual active buyers
increased 52% year on year. We extended our unrivaled leadership in mobile with 217 million monthly
active users on our mobile commerce apps in September and US$95 billion in mobile GMV for the twelve
months ended September 2014. We are also encouraged by continued improvement of mobile monetization
which demonstrates the strong commercial intent of our users.”
“Our financial performance this quarter was robust, with revenue growing 54% year on year.” said Maggie
Wei Wu, chief financial officer of Alibaba Group. “We continue to execute our focused growth strategy, and
the fundamental strength of our business gives us the confidence to invest in new initiatives to add new users,
improving engagement and customer experience, expand our products and services and drive long-term
shareholder value.”
September Quarter Operational and Financial Highlights
Operational highlights:
September 30,
2013
June 30,
2014
September 30,
2014 % Change
RMB RMB RMB US$(1)
YoY QoQ
(in millions, except percentages)
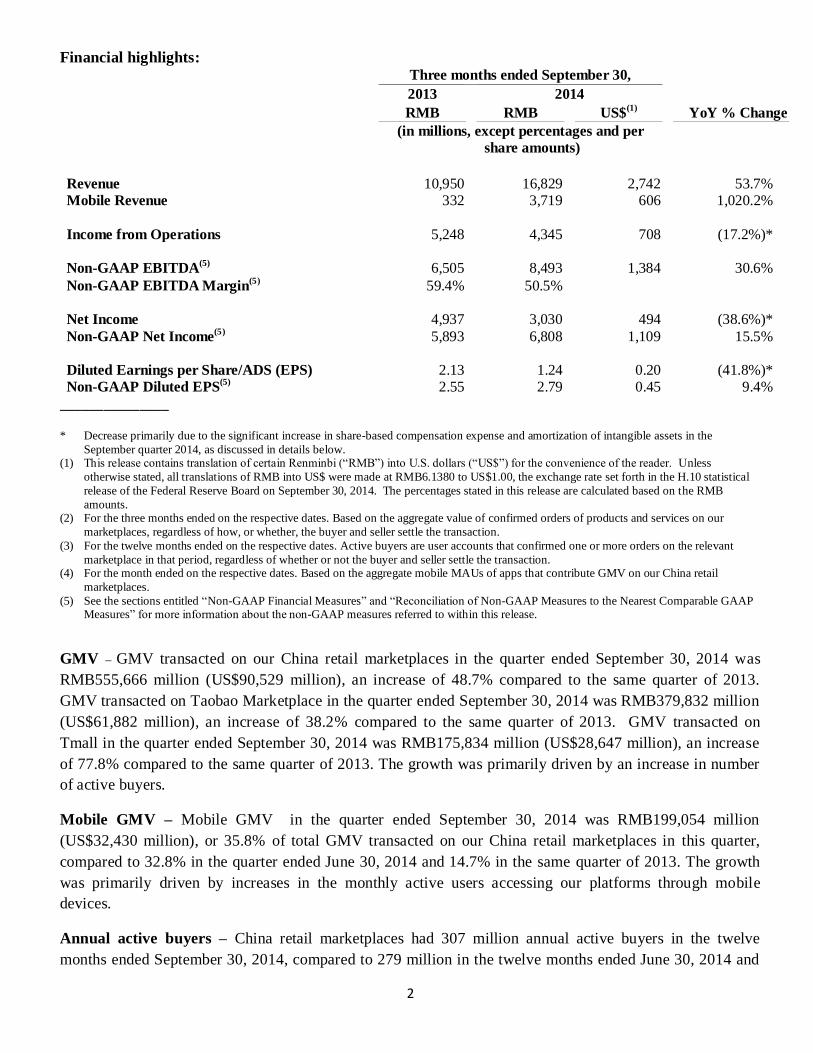
GMV(2) 373,659 500,916 555,666 90,529 48.7% 10.9%
Mobile GMV as a percentage of total
GMV(2) 14.7% 32.8% 35.8%
Annual Active Buyers(3) 202 279 307 52.0% 10.0%
Mobile Monthly Active Users (MAUs)(4)
91 188 217 138.5% 15.4%
2
Financial highlights:
Three months ended September 30,
2013 2014
RMB RMB US$(1)
YoY % Change
(in millions, except percentages and per
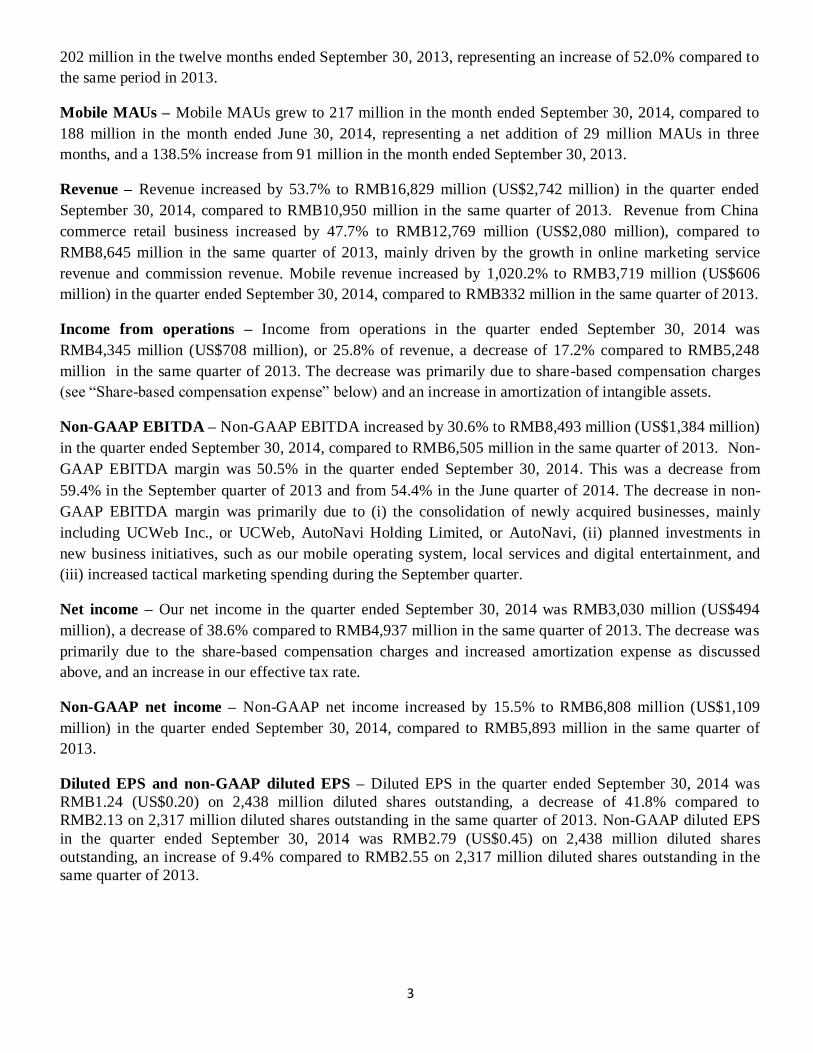
share amounts) Revenue 10,950 16,829 2,742 53.7% Mobile Revenue 332 3,719 606 1,020.2%
Income from Operations 5,248 4,345 708 (17.2%)* Non-GAAP EBITDA
(5) 6,505 8,493 1,384 30.6% Non-GAAP EBITDA Margin
(5) 59.4% 50.5% Net Income 4,937 3,030 494 (38.6%)*
Non-GAAP Net Income(5) 5,893 6,808 1,109 15.5%
Diluted Earnings per Share/ADS (EPS) 2.13 1.24 0.20 (41.8%)* Non-GAAP Diluted EPS
(5) 2.55 2.79 0.45 9.4% _______________
* Decrease primarily due to the significant increase in share-based compensation expense and amortization of intangible assets in the
September quarter 2014, as discussed in details below. (1) This release contains translation of certain Renminbi (“RMB”) into U.S. dollars (“US$”) for the convenience of the reader. Unless
otherwise stated, all translations of RMB into US$ were made at RMB6.1380 to US$1.00, the exchange rate set forth in the H.10 statistical
release of the Federal Reserve Board on September 30, 2014. The percentages stated in this release are calculated based on the RMB
amounts. (2) For the three months ended on the respective dates. Based on the aggregate value of confirmed orders of products and services on our
marketplaces, regardless of how, or whether, the buyer and seller settle the transaction.
(3) For the twelve months ended on the respective dates. Active buyers are user accounts that confirmed one or more orders on the relevant
marketplace in that period, regardless of whether or not the buyer and seller settle the transaction. (4) For the month ended on the respective dates. Based on the aggregate mobile MAUs of apps that contribute GMV on our China retail
marketplaces.
(5) See the sections entitled “Non-GAAP Financial Measures” and “Reconciliation of Non-GAAP Measures to the Nearest Comparable GAAP Measures” for more information about the non-GAAP measures referred to within this release.
GMV – GMV transacted on our China retail marketplaces in the quarter ended September 30, 2014 was
RMB555,666 million (US$90,529 million), an increase of 48.7% compared to the same quarter of 2013.
GMV transacted on Taobao Marketplace in the quarter ended September 30, 2014 was RMB379,832 million
(US$61,882 million), an increase of 38.2% compared to the same quarter of 2013. GMV transacted on
Tmall in the quarter ended September 30, 2014 was RMB175,834 million (US$28,647 million), an increase
of 77.8% compared to the same quarter of 2013. The growth was primarily driven by an increase in number
of active buyers.
Mobile GMV – Mobile GMV in the quarter ended September 30, 2014 was RMB199,054 million
(US$32,430 million), or 35.8% of total GMV transacted on our China retail marketplaces in this quarter,
compared to 32.8% in the quarter ended June 30, 2014 and 14.7% in the same quarter of 2013. The growth
was primarily driven by increases in the monthly active users accessing our platforms through mobile
devices.
Annual active buyers – China retail marketplaces had 307 million annual active buyers in the twelve
months ended September 30, 2014, compared to 279 million in the twelve months ended June 30, 2014 and
3
202 million in the twelve months ended September 30, 2013, representing an increase of 52.0% compared to
the same period in 2013.
Mobile MAUs – Mobile MAUs grew to 217 million in the month ended September 30, 2014, compared to
188 million in the month ended June 30, 2014, representing a net addition of 29 million MAUs in three
months, and a 138.5% increase from 91 million in the month ended September 30, 2013.
Revenue – Revenue increased by 53.7% to RMB16,829 million (US$2,742 million) in the quarter ended
September 30, 2014, compared to RMB10,950 million in the same quarter of 2013. Revenue from China
commerce retail business increased by 47.7% to RMB12,769 million (US$2,080 million), compared to
RMB8,645 million in the same quarter of 2013, mainly driven by the growth in online marketing service
revenue and commission revenue. Mobile revenue increased by 1,020.2% to RMB3,719 million (US$606
million) in the quarter ended September 30, 2014, compared to RMB332 million in the same quarter of 2013.
Income from operations – Income from operations in the quarter ended September 30, 2014 was
RMB4,345 million (US$708 million), or 25.8% of revenue, a decrease of 17.2% compared to RMB5,248
million in the same quarter of 2013. The decrease was primarily due to share-based compensation charges
(see “Share-based compensation expense” below) and an increase in amortization of intangible assets.
Non-GAAP EBITDA – Non-GAAP EBITDA increased by 30.6% to RMB8,493 million (US$1,384 million)
in the quarter ended September 30, 2014, compared to RMB6,505 million in the same quarter of 2013. Non-
GAAP EBITDA margin was 50.5% in the quarter ended September 30, 2014. This was a decrease from
59.4% in the September quarter of 2013 and from 54.4% in the June quarter of 2014. The decrease in non-
GAAP EBITDA margin was primarily due to (i) the consolidation of newly acquired businesses, mainly
including UCWeb Inc., or UCWeb, AutoNavi Holding Limited, or AutoNavi, (ii) planned investments in
new business initiatives, such as our mobile operating system, local services and digital entertainment, and
(iii) increased tactical marketing spending during the September quarter.
Net income – Our net income in the quarter ended September 30, 2014 was RMB3,030 million (US$494
million), a decrease of 38.6% compared to RMB4,937 million in the same quarter of 2013. The decrease was
primarily due to the share-based compensation charges and increased amortization expense as discussed
above, and an increase in our effective tax rate.
Non-GAAP net income – Non-GAAP net income increased by 15.5% to RMB6,808 million (US$1,109
million) in the quarter ended September 30, 2014, compared to RMB5,893 million in the same quarter of
2013.
Diluted EPS and non-GAAP diluted EPS – Diluted EPS in the quarter ended September 30, 2014 was
RMB1.24 (US$0.20) on 2,438 million diluted shares outstanding, a decrease of 41.8% compared to
RMB2.13 on 2,317 million diluted shares outstanding in the same quarter of 2013. Non-GAAP diluted EPS
in the quarter ended September 30, 2014 was RMB2.79 (US$0.45) on 2,438 million diluted shares
outstanding, an increase of 9.4% compared to RMB2.55 on 2,317 million diluted shares outstanding in the
same quarter of 2013.
4
September Quarter Financial Results
Revenue – Revenue for the quarter ended September 30, 2014 was RMB16,829 million (US$2,742 million),
an increase of 53.7% compared to RMB10,950 million in the same quarter of 2013. The increase was mainly
driven by the continuing rapid growth of our China commerce retail business.
• China commerce retail business – Revenue from China commerce retail business in the quarter ended
September 30, 2014 was RMB12,769 million (US$2,080 million), or 75.9% of total revenue, an increase
of 47.7% compared to RMB8,645 million in the same quarter of 2013. The increase was mainly driven
by the growth in online marketing services revenue and commission revenue. Commission revenue
accounted for 33.5% of China commerce retail revenue in the quarter ended September 30, 2014,
compared to 24.8% in the same quarter of 2013. Revenue growth during this period occurred in the
context of and reflected an increase of 48.7% in GMV transacted on our China retail marketplaces, which
was primarily driven by a 52.0% increase in the number of active buyers. Monetization rate remained
stable at 2.30% in the quarter ended September 30, 2014, compared to 2.31% in the same quarter of 2013.
Mobile revenue in the quarter ended September 30, 2014 was RMB3,719 million (US$606 million),
representing 29.1% of China commerce retail business revenue, compared to 19.4% in the quarter ended
June 30, 2014 and 3.8% in the same quarter of 2013. Mobile revenue increased as a result of increased
mobile GMV and increased mobile monetization rate to 1.87%, up from 1.49% in the quarter ended June
30, 2014 and 0.61% in the same quarter of 2013.
• China commerce wholesale business – Revenue from our China commerce wholesale business in the
quarter ended September 30, 2014 was RMB790 million (US$129 million), an increase of 39.1%
compared to RMB568 million in the same quarter of 2013. The increase in revenue was due to an
increase in paying members and an increase in average revenue from paying members.
• International commerce retail business – Revenue from our international commerce retail business in
the quarter ended September 30, 2014 was RMB419 million (US$68 million), nearly doubling from
RMB210 million in the same quarter of 2013. The main reason for this increase was an increase in GMV
transacted on AliExpress.
• International commerce wholesale business – Revenue from our international commerce wholesale
business in the quarter ended September 30, 2014 was RMB1,198 million (US$195 million), an increase
of 24.0% compared to RMB966 million in the same quarter of 2013. The main reason for this increase
was an increase in the number of paying members.
Cost of revenue – Cost of revenue in the quarter ended September 30, 2014 was RMB5,596 million
(US$912 million), or 33.3% of revenue, compared to RMB3,001 million, or 27.4% of revenue, in the same
quarter of 2013. The increase was primarily due to (i) an increase in share-based compensation expense
caused by the re-measurement at period end to fair value of share-based awards granted to the employees of
Zhejiang Ant Small and Micro Financial Services Company, Ltd., or Ant Financial, and (ii) an increase in
co-location, bandwidth and depreciation expenses as a result of our investments in Alibaba Cloud Computing
and our data platform.
Product development expenses – Product development expenses in the quarter ended September 30, 2014
were RMB2,581 million (US$421 million), or 15.3% of revenue, compared to RMB1,168 million, or 10.7%
5
of revenue in the same quarter of 2013. The increase was primarily due to an increase in payroll and benefit
expense including share-based compensation expense. Our product development headcount increased as we
continue to focus on new and existing product development and as a result of our acquisitions of UCWeb and
AutoNavi.
Sales and marketing expenses – Sales and marketing expenses in the quarter ended September 30, 2014
were RMB1,749 million (US$285 million), or 10.4% of revenue, compared to RMB657 million, or 6.0% of
revenue in the same quarter of 2013. The increase was primarily due to an increase in tactical advertising and
promotional spending mainly to promote our China retail marketplaces during this quarter when intense
global interest in Alibaba enhanced the effectiveness of marketing campaigns. Additionally, the
consolidation of marketing expense in acquired businesses, including UCWeb and AutoNavi, and an increase
in promoting new business initiatives (including local services and digital entertainment) also contributed to
the increase of sales and marketing expenses in this quarter.
General and administrative expenses – General and administrative expenses in the quarter ended
September 30, 2014 were RMB1,960 million (US$319 million), or 11.6% of revenue, compared to RMB793
million, or 7.2% of revenue in the same quarter of 2013. The increase was primarily due to an increase in
share-based compensation expense.
Share-based compensation expense – Share-based compensation expense included in respective cost or
expense items above in the quarter ended September 30, 2014 was RMB3,010 million (US$490 million), or
17.9% of revenue, an increase of 248.4% compared to RMB864 million, or 7.9% of revenue, in the same
quarter of 2013. Share-based compensation expense as a percentage of revenue increased due to
performance-based and retention grants of share-based awards to our employees and members of executive
management prior to our initial public offering, with vesting periods ranging from four to six years, as well
as the re-measurement charge relating to share-based awards granted to the employees of Ant Financial as
described under Cost of Revenue above.
Amortization of intangible assets – Amortization of intangible assets in the quarter ended September 30,
2014 was RMB598 million (US$97 million), a significant increase from RMB39 million in the same quarter
of 2013. The increase was primarily related to the strategic acquisitions, including UCWeb and AutoNavi.
Income from operations– Income from operations in the quarter ended September 30, 2014 was RMB4,345
million (US$708 million), or 25.8% of revenue, a decrease of 17.2% compared to RMB5,248 million, or
47.9% of revenue, in the same quarter of 2013. The decrease was primarily due to an increase in share-based
compensation expense and an increase in amortization of intangible assets.
Non-GAAP EBITDA – Non-GAAP EBITDA increased by 30.6% to RMB8,493 million (US$1,384 million)
in the quarter ended September 30, 2014, compared to RMB6,505 million in the same quarter of 2013. Non-
GAAP EBITDA margin was 50.5% in the quarter ended September 30, 2014. This was a decrease from
59.4% in the September quarter of 2013 and from 54.4% in the June quarter of 2014. The decrease in non-
GAAP EBITDA margin was primarily due to (i) the consolidation of newly acquired businesses, mainly
including UCWeb and AutoNavi, (ii) planned investments in new business initiatives, such as our mobile
operating system, local services and digital entertainment, and (iii) increased tactical marketing spending
during the September quarter. A reconciliation of income from operations to non-GAAP EBITDA is
included at the end of this release.
6
Interest and investment income, net – Interest and investment income, net in the quarter ended September
30, 2014 was RMB468 million (US$76 million), an increase of 47.2% compared to RMB318 million in the
same quarter of 2013. The increase in net interest and investment income was primarily due to a net gain
recognized with respect to the revaluation of previously held equity interests relating to the merger of
AutoNavi, and an increase in interest income as a result of higher cash balance during the period, partially
offset by losses recognized with respect to the revaluation of convertible bonds in connection with our
strategic investments in publicly traded entities.
Interest expense – Interest expense in the quarter ended September 30, 2014 was RMB521 million (US$85
million), an increase of 39.3% compared to RMB374 million in the same quarter of 2013. The increase in
interest expense was primarily due to an increase in average loan amount outstanding during the period
following the drawdown in April 2014 of the remaining US$3.0 billion under a US$8.0 billion credit facility.
Other income, net – Other income, net in the quarter ended September 30, 2014 was RMB378 million
(US$62 million), a decrease of 2.8% compared to RMB389 million in the same quarter of 2013. For the
quarter ended September 30, 2014, other income, net, primarily included royalty fees and software
technology service fees received from Ant Financial which increased to RMB430 million (US$70 million) in
the quarter ended September 30, 2014 from RMB204 million in the same quarter of 2013, and RMB195
million of expenses relating to the sale of shares by existing shareholders in our initial public offering.
Income tax expenses – Income tax expenses in the quarter ended September 30, 2014 were RMB1,339
million (US$218 million), an increase of 110.2% compared to RMB637 million in the same quarter of 2013.
The increase was primarily due to the increase in taxable income from our operations in China. Our effective
tax rate increased to 28.7% in the quarter ended September 30, 2014 from 11.4% in the same quarter of 2013.
Excluding share-based compensation expense which is not deductible for income tax purposes, and gain on
revaluation of investments which are not subject to income tax, our effective tax rate would have been 17.6%
in the quarter ended September 30, 2014, compared to 9.9% in the same quarter of 2013. Such increase was
primarily because the enterprise income tax, or EIT, exemption period of one of our major subsidiaries
expired and such subsidiary became subject to an EIT rate of 12.5% (or 50% of the statutory EIT rate) in
calendar year 2014.
Net income and non-GAAP net income – As a result of the foregoing, our net income in the quarter ended
September 30, 2014 was RMB3,030 million (US$494 million), a decrease of 38.6% compared to RMB4,937
million in the same quarter of 2013. Excluding the effects of share-based compensation expense,
amortization of intangible assets and certain other items, non-GAAP net income in the quarter ended
September 30, 2014 was RMB6,808 million (US$1,109 million), an increase of 15.5% compared to
RMB5,893 million in the same quarter of 2013. A reconciliation of net income to non-GAAP net income is
included at the end of this release.
Net income attributable to ordinary shareholders – Net income attributable to ordinary shareholders in
the quarter ended September 30, 2014 was RMB2,976 million (US$485 million), a decrease of 39.1%
compared to RMB4,883 million in the same quarter of 2013.
Diluted EPS and non-GAAP diluted EPS – Diluted EPS in the quarter ended September 30, 2014 was
RMB1.24 (US$0.20) on 2,438 million diluted shares outstanding, a decrease of 41.8% compared to
RMB2.13 on 2,317 million diluted shares outstanding in the same quarter of 2013. Excluding the effects of
7
share-based compensation expense, amortization of intangible assets and certain other items, non-GAAP
diluted EPS in the quarter ended September 30, 2014 was RMB2.79 (US$0.45), an increase of 9.4%
compared to RMB2.55 in the same quarter of 2013. A reconciliation of diluted EPS to the non-GAAP diluted
EPS is included at the end of this release.
Cash – As of September 30, 2014, cash, cash equivalents and short-term investments were RMB109,911
million (US$17,906 million), compared to RMB43,632 million as of March 31, 2014.
Cash flow from operating activities and free cash flow– Net cash provided by operating activities in the
quarter ended September 30, 2014 was RMB5,865 million (US$955 million), an increase of 29.6% compared
to RMB4,526 million in the same quarter of 2013. Capital expenditures in the quarter ended September 30,
2014 were RMB3,396 million (US$553 million), compared to RMB1,140 million in the same quarter of
2013. Capital expenditures in the quarter ended September 30, 2014 included cash outflow for acquisition of
land use rights and construction in progress of RMB1,703 million. Free cash flow, a non-GAAP
measurement of liquidity, in the quarter ended September 30, 2014 was RMB8,938 million (US$1,456
million), an increase of 33.7% compared to RMB6,683 million in the same quarter of 2013. A reconciliation
of net cash provided by operating activities to free cash flow, the non-GAAP measure of liquidity, is
included at the end of this release.
Net cash used in investing activities – During the quarter ended September 30, 2014, net cash used in
investing activities of RMB32,555 million (US$5,304 million) mainly included disbursements for short-term
investments of RMB13,807 million (US$2,249 million), capital expenditure of RMB3,396 million (US$553
million) as well as investment and acquisition activities of RMB15,912 million (US$2,592 million). The
cash outflows related to our previously announced investment and acquisition activities included: (i) the
merger of AutoNavi, a leading provider of digital map content and navigation and location-based solutions in
China, of RMB6,348 million; (ii) investment in Intime Retail (Group) Company Limited, one of China’s
leading department store operators, of RMB4,264 million; (iii) investment in Singapore Post Limited, the
national postal service provider in Singapore and a leading provider of ecommerce and logistics solutions in
the Asia-Pacific region, of RMB1,548 million; and (iv) investment in Guangzhou Evergrande Football Club,
China’s first-ever winner of the Asian Football Confederation Champions League Cup, of RMB1,200
million.
Webcast and Conference Call Information
A live webcast of the earnings conference call, which will be held shortly following the release of this
announcement, can be accessed at http://www.alibabagroup.com/en/ir/earnings. An archived webcast will be
available through the same link following the call. A replay of the conference call will be available for two
weeks (dial-in number: +1 855-859-2056; conference ID: 24286757).
Please visit Alibaba Group’s Investor Relations website at http://www.alibabagroup.com/en/ir/home on
November 4, 2014 to view the earnings release and accompanying slides prior to the conference call.
About Alibaba Group
8
Alibaba Group's mission is to make it easy to do business anywhere. The company is the largest online and
mobile commerce company in the world in terms of gross merchandise volume. Founded in 1999, the
company provides the fundamental technology infrastructure and marketing reach to help businesses
leverage the power of the Internet to establish an online presence and conduct commerce with hundreds of
millions of consumers and other businesses.
Alibaba Group's major businesses include:
• Taobao Marketplace (www.taobao.com), China's largest online shopping destination
• Tmall.com (www.tmall.com), China's largest third-party platform for brands and retailers
• Juhuasuan (www.juhuasuan.com), China's most popular online group buying marketplace
• Alitrip (www.alitrip.com), a leading online travel booking platform
• AliExpress (www.aliexpress.com), a global online marketplace for consumers to buy directly from
China
• Alibaba.com (www.alibaba.com), China's largest global online wholesale platform for small
businesses
• 1688.com (www.1688.com), a leading online wholesale marketplace in China
• Alibaba Cloud Computing (www.aliyun.com), a provider of cloud computing services to businesses
and entrepreneurs
Alibaba Group also provides payment and/or escrow services on its marketplaces through its contractual
arrangements with Ant Financial Services Group, a related company of Alibaba Group that operates Alipay
(www.alipay.com).
Through China Smart Logistics (or Zhejiang Cainiao Supply Chain Management Co., Ltd.), a 48%-owned
affiliate, Alibaba Group operates a central logistics information system that connects a network of express
delivery companies in China.
Contact
Investor Relations Contacts
Grace Wong
Media Contacts
Robert Christie
Safe Harbor Statements
This announcement contains forward-looking statements. These statements are made under the “safe harbor”
provisions of the U.S. Private Securities Litigation Reform Act of 1995. These forward-looking statements
can be identified by terminology such as “will,” “expects,” “anticipates,” “future,” “intends,” “plans,”
“believes,” “estimates,” “potential,” “continue,” “ongoing,” “targets” and similar statements. Among other
9
things, statements that are not historical facts, including statements about Alibaba’s beliefs and expectations,
the business outlook and quotations from management in this announcement, as well as Alibaba’s strategic
and operational plans, are or contain forward-looking statements. Alibaba may also make written or oral
forward-looking statements in its periodic reports to the U.S. Securities and Exchange Commission (the
“SEC”), in press releases and other written materials and in oral statements made by its officers, directors or
employees to third parties. Forward-looking statements involve inherent risks and uncertainties. A number of
factors could cause actual results to differ materially from those contained in any forward-looking statement,
including but not limited to the following: Alibaba’s goals and strategies; Alibaba’s future business
development; Alibaba’s ability to maintain the trusted status of its ecosystem, reputation and brand;
Alibaba’s ability to retain or increase engagement of buyers, sellers and other participants in its ecosystem
and enable new offerings; Alibaba’s ability to successfully monetize traffic on its mobile platform; risks
associated with limitation or restriction of services provided by Alipay; risks associated with increased
investments in Alibaba’s business; risks associated with acquisitions; privacy and regulatory concerns;
competition; security breaches; the continued growth of the e-commerce market in China and globally; and
fluctuations in general economic and business conditions in China and globally and assumptions underlying
or related to any of the foregoing. Further information regarding these and other risks is included in
Alibaba’s filings with the SEC. All information provided in this press release and in the attachments is as of
the date of this press release and are based on assumptions that we believe to be reasonable as of this date,
and Alibaba does not undertake any obligation to update any forward-looking statement, except as required
under applicable law.
Non-GAAP Financial Measures
To supplement its consolidated financial statements, which are prepared and presented in accordance with
GAAP, Alibaba Group uses the following non-GAAP financial measures: non-GAAP EBITDA (including
non-GAAP EBITDA margin), non-GAAP net income, non-GAAP diluted EPS and free cash flow. For more
information on these non-GAAP financial measures, please refer to the table captioned “Reconciliations of
Non-GAAP Measures to the Nearest Comparable GAAP Measures” in this press release.
Alibaba Group believes that non-GAAP EBITDA, non-GAAP net income and non-GAAP diluted EPS help
identify underlying trends in its business that could otherwise be distorted by the effect of the expenses that
Alibaba Group includes in income from operations, net income and diluted EPS. Alibaba Group believes that
non-GAAP EBITDA, non-GAAP net income and non-GAAP diluted EPS provide useful information about
its operating results, enhance the overall understanding of its past performance and future prospects and
allow for greater visibility with respect to key metrics used by our management in its financial and
operational decision-making. Alibaba Group considers free cash flow to be a liquidity measure that provides
useful information to management and investors about the amount of cash generated by its business that can
be used for strategic corporate transactions, including investing in its new business initiatives, making
strategic investments and acquisitions and strengthening its balance sheet. Non-GAAP EBITDA, non-GAAP
net income, non-GAAP diluted EPS and free cash flow should not be considered in isolation or construed as
an alternative to net income, diluted EPS, cash flows or any other measure of performance or as an indicator
of Alibaba Group’s operating performance. These non-GAAP financial measures presented here may not be
comparable to similarly titled measures presented by other companies. Other companies may calculate
similarly titled measures differently, limiting their usefulness as comparative measures to our data.
Non-GAAP EBITDA represents income from operations (which excludes interest and investment income,
net, interest expense, other income, net, income tax expenses and share of results of equity investees) before
certain non-cash expenses, consisting of share-based compensation expense, amortization, depreciation and
10
impairment of goodwill and intangible assets that Alibaba Group does not believe are reflective of its core
operating performance during the periods presented.
Non-GAAP net income represents net income before share-based compensation expense, amortization,
impairment of goodwill, intangible assets and investments, gain (loss) on deemed
disposals/disposals/revaluation of investments, amortization of excess value receivable arising from the
restructuring of commercial arrangement with Ant Financial, and a one-time expense item consisting of the
expenses relating to the sale of shares by existing shareholders in our initial public offering.
Non-GAAP diluted EPS represents non-GAAP net income attributable to ordinary shareholders divided by
the weighted average number of shares outstanding during the periods on a diluted basis, including
accounting for the effects of the assumed conversion of convertible preference shares.
Free cash flow represents net cash provided by operating activities as presented in Alibaba Group’s
consolidated cash flow statement less purchases of property and equipment and intangible assets (excluding
acquisition of land use rights and construction in progress) and adjusted for changes in loan receivables
relating to micro loans of its SME loan business. Alibaba Group presents the adjustment for changes in loan
receivables because such receivables are reflected under cash flow from operating activities, whereas the
secured borrowings and other bank borrowings used to finance them are reflected under cash flows from
financing activities, and accordingly, the adjustment is made to show cash flows from operating activities net
of the effect of changes in loan receivables.
The tables captioned “Reconciliations of Non-GAAP Measures to the Nearest Comparable GAAP Measures”
in this press release has more details on the non-GAAP financial measures that are most directly comparable
to GAAP financial measures and the related reconciliations between these financial measures.
11
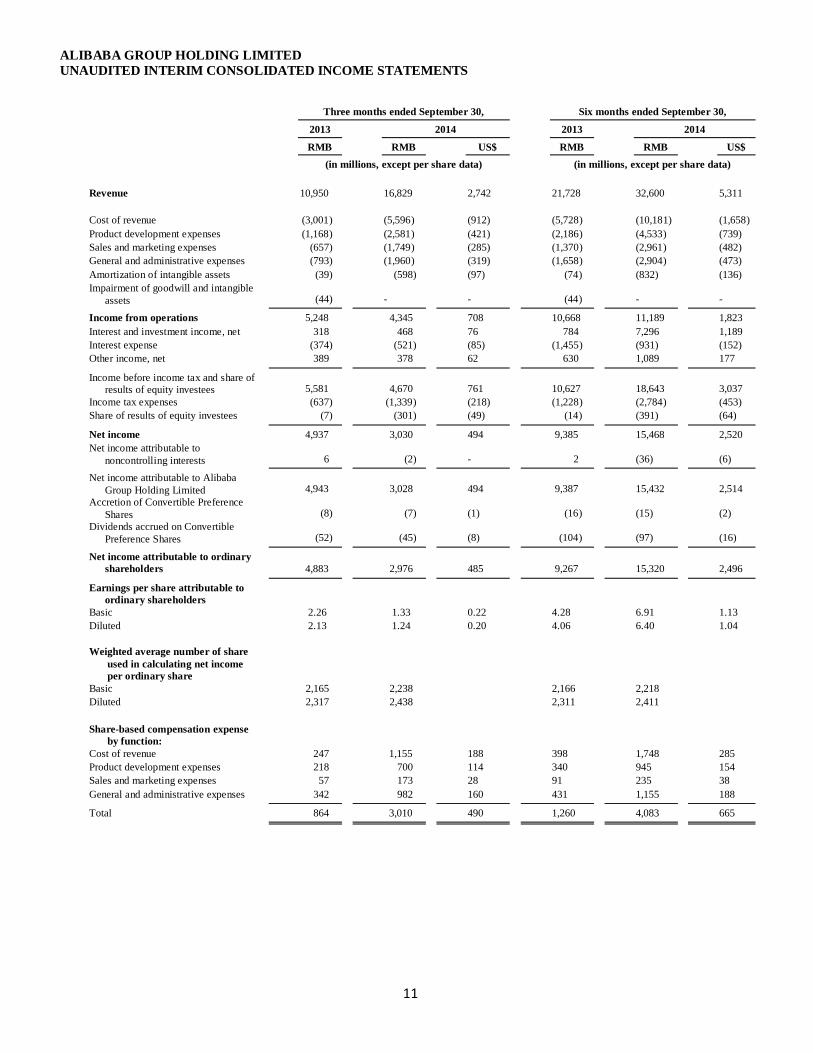
ALIBABA GROUP HOLDING LIMITED UNAUDITED INTERIM CONSOLIDATED INCOME STATEMENTS
Three months ended September 30,
Six months ended September 30,
2013
2014
2013
2014
RMB
RMB
US$
RMB
RMB
US$
(in millions, except per share data) (in millions, except per share data)
Revenue 10,950 16,829 2,742 21,728 32,600 5,311
Cost of revenue (3,001) (5,596) (912) (5,728) (10,181) (1,658)
Product development expenses (1,168) (2,581) (421) (2,186) (4,533) (739)
Sales and marketing expenses (657) (1,749) (285) (1,370) (2,961) (482)
General and administrative expenses (793) (1,960) (319) (1,658) (2,904) (473)
Amortization of intangible assets (39) (598) (97) (74) (832) (136)
Impairment of goodwill and intangible
assets (44) - - (44) - - Income from operations 5,248 4,345 708 10,668 11,189 1,823
Interest and investment income, net 318 468 76 784 7,296 1,189
Interest expense (374) (521) (85) (1,455) (931) (152)
Other income, net 389 378 62 630 1,089 177 Income before income tax and share of
results of equity investees 5,581 4,670 761 10,627 18,643 3,037
Income tax expenses (637) (1,339) (218) (1,228) (2,784) (453)
Share of results of equity investees (7) (301) (49) (14) (391) (64) Net income 4,937 3,030 494 9,385 15,468 2,520
Net income attributable to
noncontrolling interests 6 (2) - 2 (36) (6) Net income attributable to Alibaba
Group Holding Limited 4,943 3,028 494 9,387 15,432 2,514
Accretion of Convertible Preference
Shares (8) (7) (1) (16) (15) (2)
Dividends accrued on Convertible
Preference Shares (52) (45) (8) (104) (97) (16) Net income attributable to ordinary
shareholders
4,883 2,976 485 9,267 15,320 2,496 Earnings per share attributable to
ordinary shareholders Basic 2.26 1.33 0.22 4.28 6.91 1.13
Diluted 2.13 1.24 0.20 4.06 6.40 1.04
Weighted average number of share
used in calculating net income
per ordinary share Basic 2,165 2,238 2,166 2,218
Diluted 2,317 2,438 2,311 2,411
Share-based compensation expense
by function: Cost of revenue 247 1,155 188 398 1,748 285
Product development expenses 218 700 114 340 945 154
Sales and marketing expenses 57 173 28 91 235 38
General and administrative expenses 342 982 160 431 1,155 188 Total 864 3,010 490 1,260 4,083 665
12
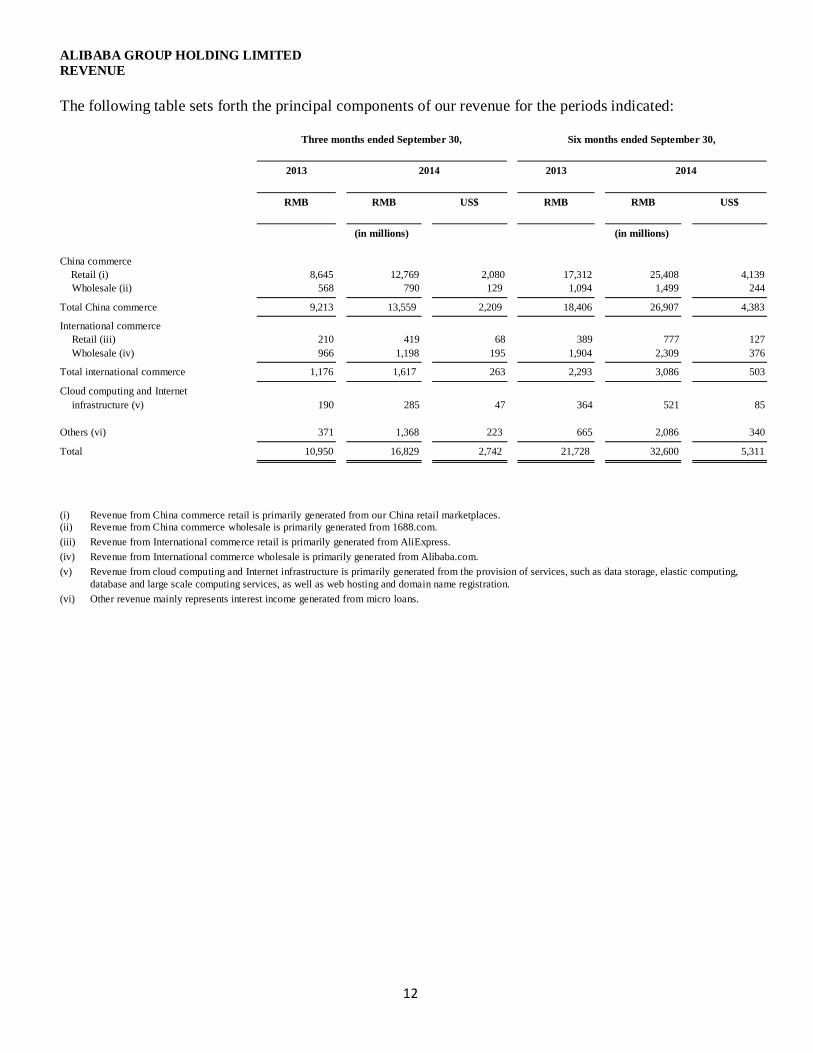
ALIBABA GROUP HOLDING LIMITED REVENUE
The following table sets forth the principal components of our revenue for the periods indicated:
Three months ended September 30,
Six months ended September 30,
2013
2014
2013
2014
RMB
RMB
US$
RMB
RMB
US$
(in millions) (in millions)
China commerce
Retail (i) 8,645 12,769 2,080 17,312 25,408 4,139
Wholesale (ii) 568 790 129 1,094 1,499 244 Total China commerce 9,213 13,559 2,209 18,406 26,907 4,383 International commerce
Retail (iii) 210 419 68 389 777 127
Wholesale (iv) 966 1,198 195 1,904 2,309 376 Total international commerce 1,176 1,617 263 2,293 3,086 503 Cloud computing and Internet
infrastructure (v) 190 285 47 364 521 85
Others (vi) 371 1,368 223 665 2,086 340 Total 10,950 16,829 2,742 21,728 32,600 5,311
(i) Revenue from China commerce retail is primarily generated from our China retail marketplaces.
(ii) Revenue from China commerce wholesale is primarily generated from 1688.com.
(iii) Revenue from International commerce retail is primarily generated from AliExpress.
(iv) Revenue from International commerce wholesale is primarily generated from Alibaba.com.
(v) Revenue from cloud computing and Internet infrastructure is primarily generated from the provision of services, such as data storage, elastic computing,
database and large scale computing services, as well as web hosting and domain name registration.
(vi) Other revenue mainly represents interest income generated from micro loans.
13
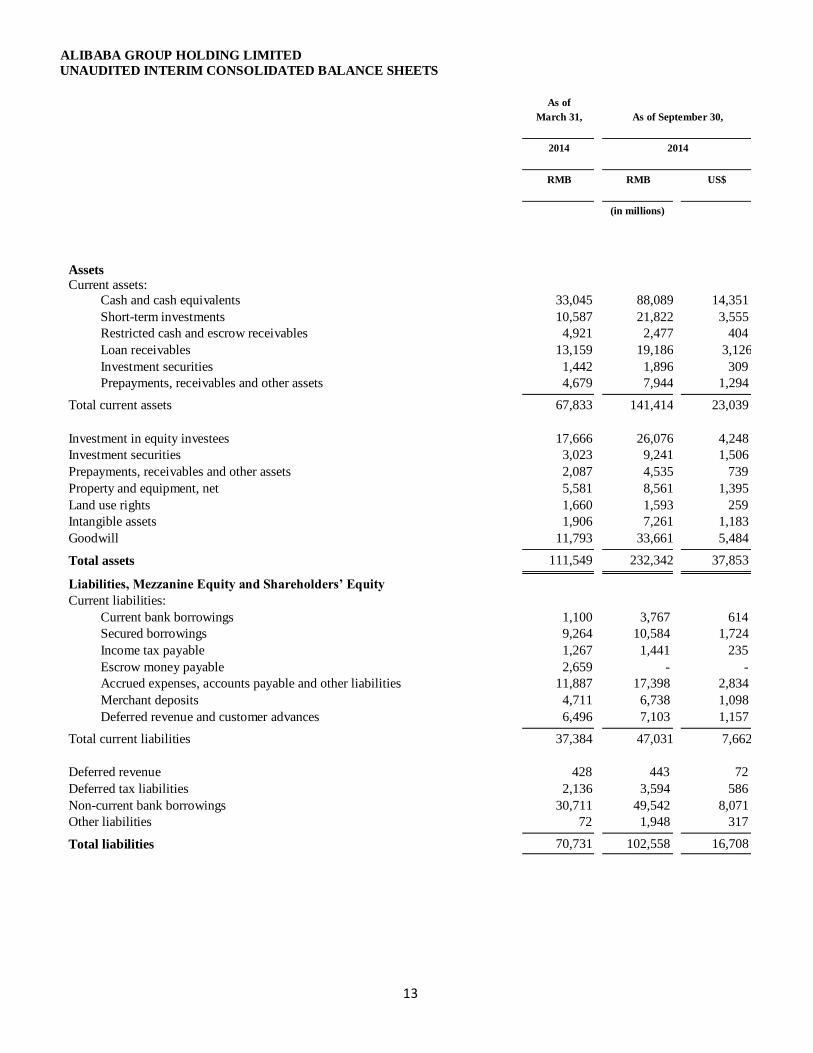
ALIBABA GROUP HOLDING LIMITED UNAUDITED INTERIM CONSOLIDATED BALANCE SHEETS
As of
March 31,
As of September 30,
2014
2014
RMB
RMB
US$
(in millions)
Assets Current assets:
Cash and cash equivalents 33,045 88,089 14,351
Short-term investments 10,587 21,822 3,555
Restricted cash and escrow receivables 4,921 2,477 404
Loan receivables 13,159 19,186 3,126
Investment securities 1,442 1,896 309
Prepayments, receivables and other assets 4,679 7,944 1,294
Total current assets 67,833 141,414 23,039
Investment in equity investees 17,666 26,076 4,248
Investment securities 3,023 9,241 1,506
Prepayments, receivables and other assets 2,087 4,535 739
Property and equipment, net 5,581 8,561 1,395
Land use rights 1,660 1,593 259
Intangible assets 1,906 7,261 1,183
Goodwill 11,793 33,661 5,484
Total assets 111,549 232,342 37,853
Liabilities, Mezzanine Equity and Shareholders’ Equity
Current liabilities:
Current bank borrowings 1,100 3,767 614
Secured borrowings 9,264 10,584 1,724
Income tax payable 1,267 1,441 235
Escrow money payable 2,659 - -
Accrued expenses, accounts payable and other liabilities 11,887 17,398 2,834
Merchant deposits 4,711 6,738 1,098
Deferred revenue and customer advances 6,496 7,103 1,157
Total current liabilities 37,384 47,031 7,662
Deferred revenue 428 443 72
Deferred tax liabilities 2,136 3,594 586
Non-current bank borrowings 30,711 49,542 8,071
Other liabilities 72 1,948 317
Total liabilities 70,731 102,558 16,708
14
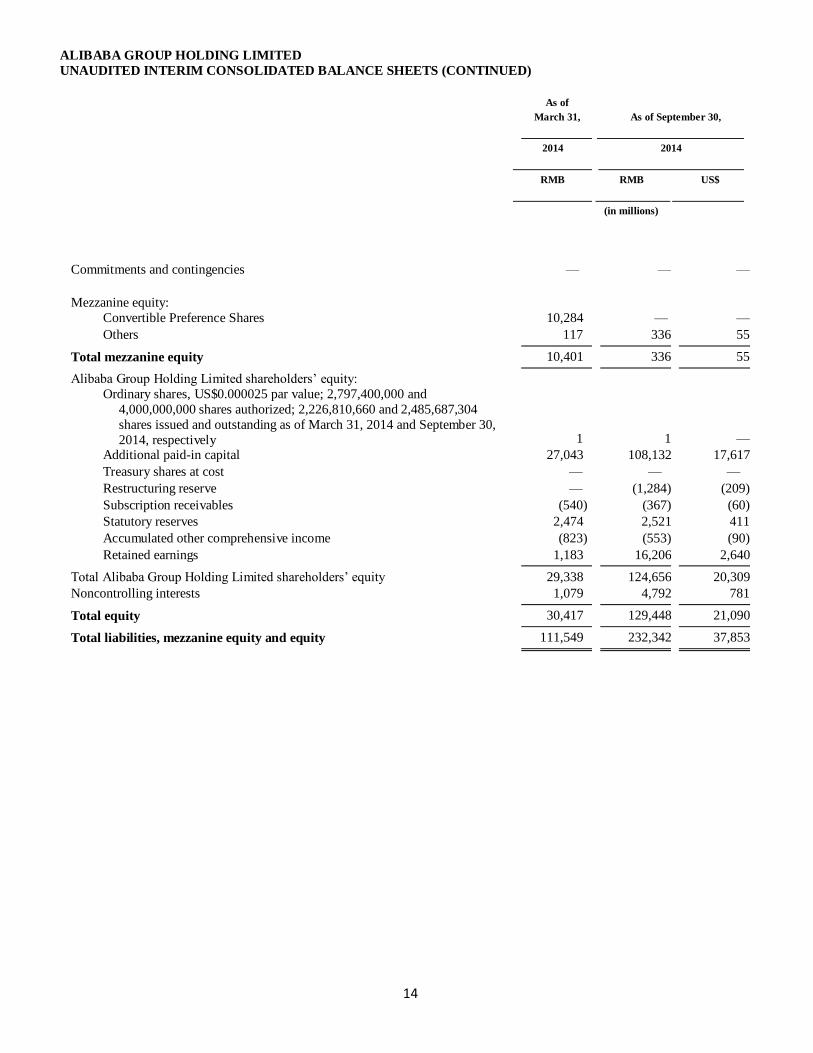
ALIBABA GROUP HOLDING LIMITED UNAUDITED INTERIM CONSOLIDATED BALANCE SHEETS (CONTINUED)
As of
March 31,
As of September 30,
2014
2014
RMB
RMB
US$
(in millions)
Commitments and contingencies — — —
Mezzanine equity: Convertible Preference Shares 10,284 — —
Others 117 336 55
Total mezzanine equity 10,401 336 55
Alibaba Group Holding Limited shareholders’ equity: Ordinary shares, US$0.000025 par value; 2,797,400,000 and
4,000,000,000 shares authorized; 2,226,810,660 and 2,485,687,304
shares issued and outstanding as of March 31, 2014 and September 30,
2014, respectively 1 1 —
Additional paid-in capital 27,043 108,132 17,617
Treasury shares at cost — — —
Restructuring reserve — (1,284) (209)
Subscription receivables (540) (367) (60)
Statutory reserves 2,474 2,521 411
Accumulated other comprehensive income (823) (553) (90)
Retained earnings 1,183 16,206 2,640
Total Alibaba Group Holding Limited shareholders’ equity 29,338 124,656 20,309
Noncontrolling interests 1,079 4,792 781
Total equity 30,417 129,448 21,090
Total liabilities, mezzanine equity and equity 111,549 232,342 37,853
15
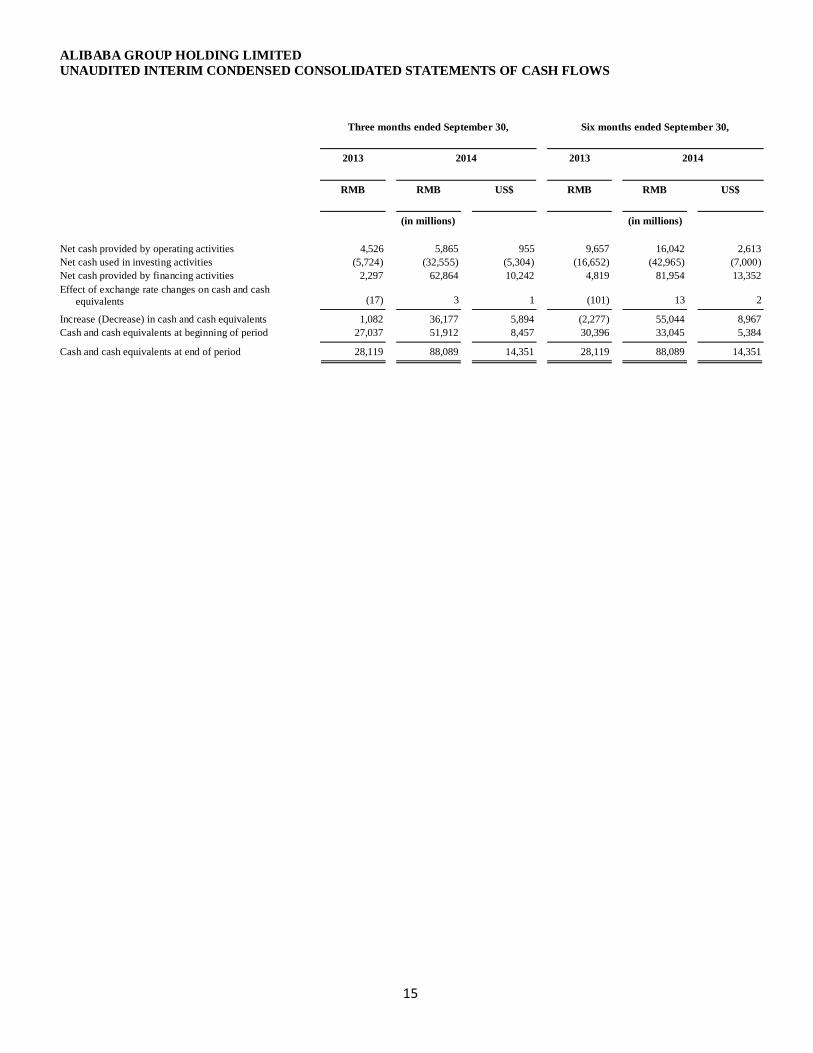
ALIBABA GROUP HOLDING LIMITED UNAUDITED INTERIM CONDENSED CONSOLIDATED STATEMENTS OF CASH FLOWS
Three months ended September 30,
Six months ended September 30,
2013
2014
2013
2014
RMB
RMB
US$
RMB
RMB
US$
(in millions) (in millions)
Net cash provided by operating activities 4,526 5,865 955 9,657 16,042 2,613
Net cash used in investing activities (5,724) (32,555) (5,304) (16,652) (42,965) (7,000)
Net cash provided by financing activities 2,297 62,864 10,242 4,819 81,954 13,352
Effect of exchange rate changes on cash and cash
equivalents (17) 3 1 (101) 13 2 Increase (Decrease) in cash and cash equivalents 1,082 36,177 5,894 (2,277) 55,044 8,967
Cash and cash equivalents at beginning of period 27,037 51,912 8,457 30,396 33,045 5,384 Cash and cash equivalents at end of period 28,119 88,089 14,351 28,119 88,089 14,351
16
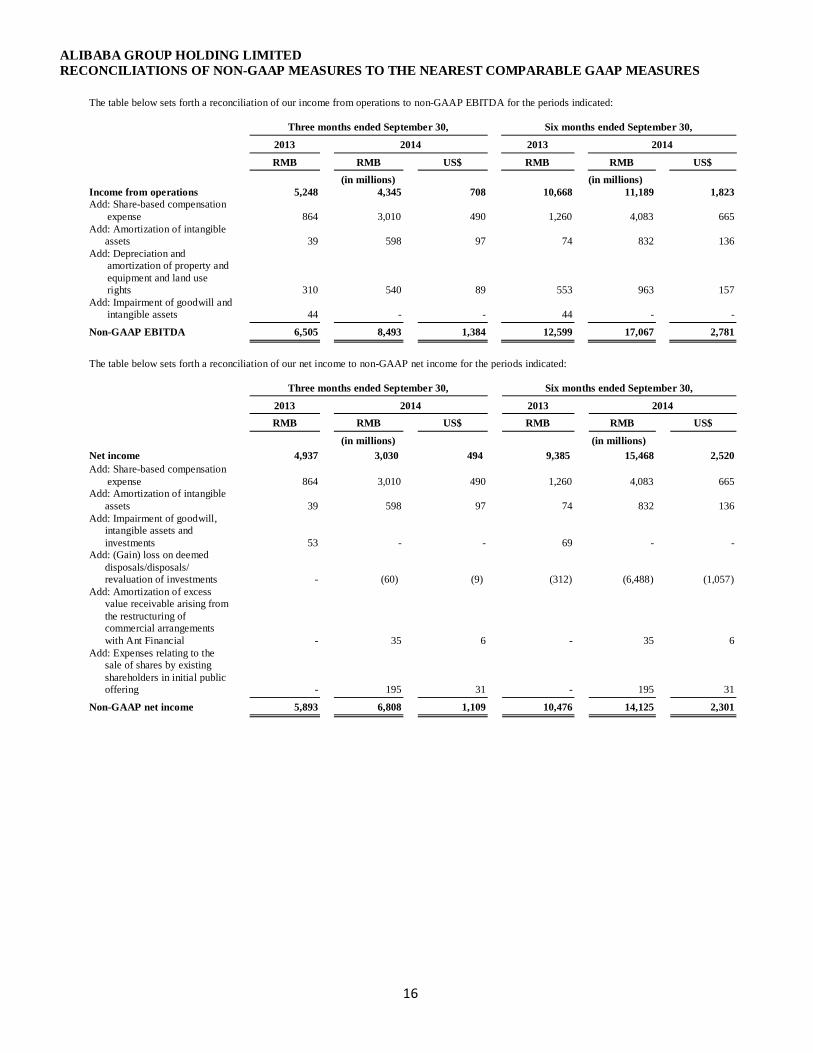
ALIBABA GROUP HOLDING LIMITED RECONCILIATIONS OF NON-GAAP MEASURES TO THE NEAREST COMPARABLE GAAP MEASURES
The table below sets forth a reconciliation of our income from operations to non-GAAP EBITDA for the periods indicated:
Three months ended September 30,
Six months ended September 30,
2013
2014
2013
2014
RMB
RMB
US$
RMB
RMB
US$
(in millions) (in millions)
Income from operations 5,248 4,345 708 10,668 11,189 1,823
Add: Share-based compensation
expense 864 3,010 490 1,260 4,083 665
Add: Amortization of intangible
assets 39 598 97 74 832 136
Add: Depreciation and
amortization of property and
equipment and land use
rights 310 540 89 553 963 157
Add: Impairment of goodwill and
intangible assets 44 - - 44 - - Non-GAAP EBITDA 6,505 8,493 1,384 12,599 17,067 2,781
The table below sets forth a reconciliation of our net income to non-GAAP net income for the periods indicated:
Three months ended September 30,
Six months ended September 30,
2013
2014
2013
2014
RMB
RMB
US$
RMB
RMB
US$
(in millions) (in millions) Net income 4,937 3,030 494 9,385 15,468 2,520
Add: Share-based compensation
expense 864 3,010 490 1,260 4,083 665
Add: Amortization of intangible
assets 39 598 97 74 832 136
Add: Impairment of goodwill,
intangible assets and
investments 53 - - 69 - -
Add: (Gain) loss on deemed
disposals/disposals/
revaluation of investments - (60) (9) (312) (6,488) (1,057)
Add: Amortization of excess
value receivable arising from
the restructuring of
commercial arrangements
with Ant Financial - 35 6 - 35 6
Add: Expenses relating to the
sale of shares by existing
shareholders in initial public
offering - 195 31 - 195 31 Non-GAAP net income 5,893 6,808 1,109 10,476 14,125 2,301
17
ALIBABA GROUP HOLDING LIMITED RECONCILIATIONS OF NON-GAAP MEASURES TO THE NEAREST COMPARABLE GAAP MEASURES
(CONTINUED)
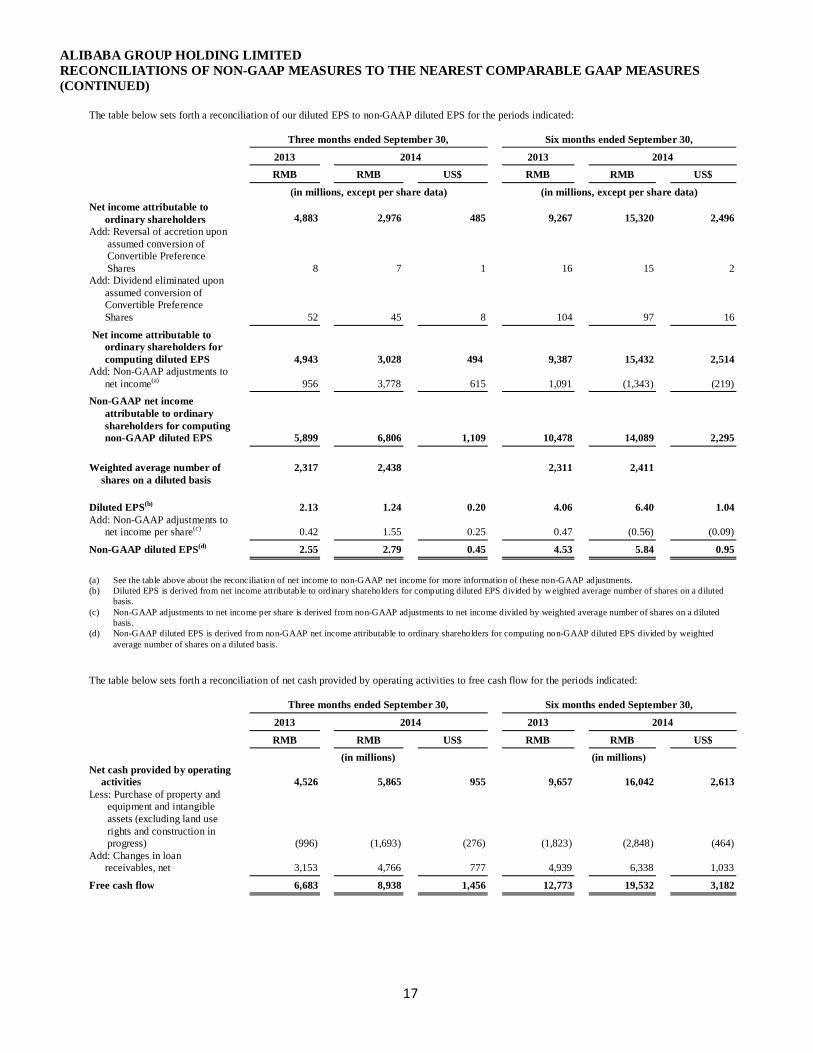
The table below sets forth a reconciliation of our diluted EPS to non-GAAP diluted EPS for the periods indicated:
Three months ended September 30,
Six months ended September 30,
2013
2014
2013
2014
RMB
RMB
US$
RMB
RMB
US$
(in millions, except per share data) (in millions, except per share data) Net income attributable to
ordinary shareholders 4,883 2,976 485 9,267 15,320 2,496
Add: Reversal of accretion upon
assumed conversion of
Convertible Preference
Shares 8 7 1 16 15 2
Add: Dividend eliminated upon
assumed conversion of
Convertible Preference
Shares 52 45 8 104 97 16 Net income attributable to
ordinary shareholders for
computing diluted EPS 4,943 3,028 494 9,387 15,432 2,514
Add: Non-GAAP adjustments to
net income(a)
956 3,778 615 1,091 (1,343) (219) Non-GAAP net income
attributable to ordinary
shareholders for computing
non-GAAP diluted EPS 5,899 6,806 1,109 10,478 14,089 2,295
Weighted average number of
shares on a diluted basis
2,317 2,438 2,311 2,411
Diluted EPS(b)
2.13 1.24 0.20 4.06 6.40 1.04
Add: Non-GAAP adjustments to
net income per share(c)
0.42 1.55 0.25 0.47 (0.56) (0.09) Non-GAAP diluted EPS
(d) 2.55 2.79 0.45 4.53 5.84 0.95
(a) See the table above about the reconciliation of net income to non-GAAP net income for more information of these non-GAAP adjustments.
(b) Diluted EPS is derived from net income attributable to ordinary shareholders for computing diluted EPS divided by weighted average number of shares on a diluted
basis.
(c) Non-GAAP adjustments to net income per share is derived from non-GAAP adjustments to net income divided by weighted average number of shares on a diluted
basis.
(d) Non-GAAP diluted EPS is derived from non-GAAP net income attributable to ordinary shareholders for computing non-GAAP diluted EPS divided by weighted
average number of shares on a diluted basis.
The table below sets forth a reconciliation of net cash provided by operating activities to free cash flow for the periods indicated:
Three months ended September 30,
Six months ended September 30,
2013
2014
2013
2014
RMB
RMB
US$
RMB
RMB
US$
(in millions) (in millions)
Net cash provided by operating
activities 4,526 5,865 955 9,657 16,042 2,613
Less: Purchase of property and
equipment and intangible
assets (excluding land use
rights and construction in
progress) (996) (1,693) (276) (1,823) (2,848) (464)
Add: Changes in loan
receivables, net 3,153 4,766 777 4,939 6,338 1,033 Free cash flow 6,683 8,938 1,456 12,773 19,532 3,182
18
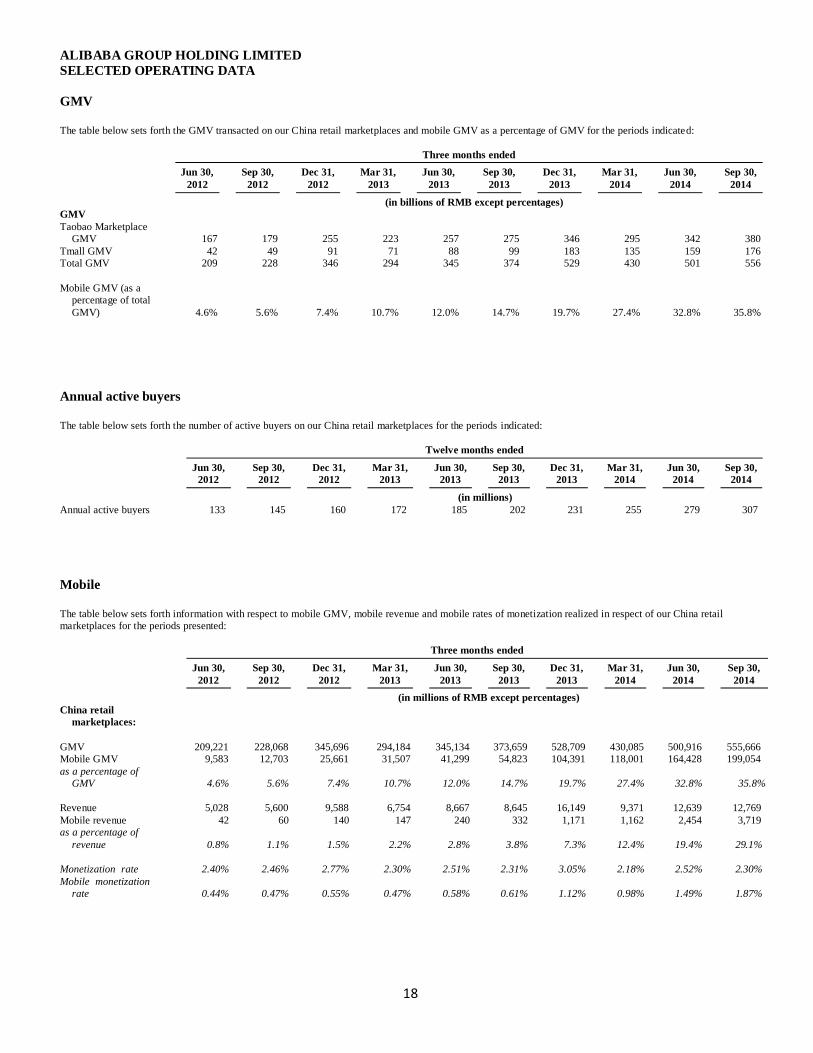
ALIBABA GROUP HOLDING LIMITED SELECTED OPERATING DATA
GMV
The table below sets forth the GMV transacted on our China retail marketplaces and mobile GMV as a percentage of GMV for the periods indicated:
Three months ended
Jun 30,
2012
Sep 30,
2012
Dec 31,
2012
Mar 31,
2013
Jun 30,
2013
Sep 30,
2013
Dec 31,
2013
Mar 31,
2014
Jun 30,
2014
Sep 30,
2014
(in billions of RMB except percentages)
GMV
Taobao Marketplace
GMV 167 179 255 223 257 275 346 295 342 380
Tmall GMV 42 49 91 71 88 99 183 135 159 176
Total GMV 209 228 346 294 345 374 529 430 501 556
Mobile GMV (as a
percentage of total
GMV) 4.6% 5.6% 7.4% 10.7% 12.0% 14.7% 19.7% 27.4% 32.8% 35.8%
Annual active buyers
The table below sets forth the number of active buyers on our China retail marketplaces for the periods indicated:
Twelve months ended
Jun 30,
2012
Sep 30,
2012
Dec 31,
2012
Mar 31,
2013
Jun 30,
2013
Sep 30,
2013
Dec 31,
2013
Mar 31,
2014
Jun 30,
2014
Sep 30,
2014 (in millions)
Annual active buyers 133 145 160 172 185 202 231 255 279 307
Mobile
The table below sets forth information with respect to mobile GMV, mobile revenue and mobile rates of monetization realized in respect of our China retail
marketplaces for the periods presented:
Three months ended
Jun 30,
2012
Sep 30,
2012
Dec 31,
2012
Mar 31,
2013
Jun 30,
2013
Sep 30,
2013
Dec 31,
2013
Mar 31,
2014
Jun 30,
2014
Sep 30,
2014 (in millions of RMB except percentages)
China retail
marketplaces:
GMV 209,221 228,068 345,696 294,184 345,134 373,659 528,709 430,085 500,916 555,666
Mobile GMV 9,583 12,703 25,661 31,507 41,299 54,823 104,391 118,001 164,428 199,054
as a percentage of GMV 4.6% 5.6% 7.4% 10.7% 12.0% 14.7% 19.7% 27.4% 32.8% 35.8%
Revenue 5,028 5,600 9,588 6,754 8,667 8,645 16,149 9,371 12,639 12,769
Mobile revenue 42 60 140 147 240 332 1,171 1,162 2,454 3,719
as a percentage of
revenue 0.8% 1.1% 1.5% 2.2% 2.8% 3.8% 7.3% 12.4% 19.4% 29.1%
Monetization rate 2.40% 2.46% 2.77% 2.30% 2.51% 2.31% 3.05% 2.18% 2.52% 2.30%
Mobile monetization rate 0.44% 0.47% 0.55% 0.47% 0.58% 0.61% 1.12% 0.98% 1.49% 1.87%