Embed Size (px)
Citation preview

1
Alibaba Group Announces December Quarter 2014 Results
Hangzhou, China, January 29, 2015 – Alibaba Group Holding Limited (NYSE: BABA) today announced
its financial results for the quarter ended December 31, 2014.
“We delivered a strong quarter with significant growth across our key operating metrics,” said Jonathan Lu,
chief executive officer of Alibaba Group. “Gross merchandise volume across our China retail marketplaces
grew 49% year on year, and our annual active buyers increased to 334 million in 2014, an increase of 45%
year on year. Our unrivaled leadership and momentum in mobile continued — we added 48 million active
users sequentially and delivered over US$1 billion in mobile revenue during the quarter. Our business
continues to perform well, and our results reflect the strength of our ecosystem and the strong foundation we
have for sustainable growth.”
“Alibaba performed very well this quarter, with revenue growing 40% year on year,” said Maggie Wu, chief
financial officer of Alibaba Group. “We continue to execute our focused growth strategy, and the
fundamental strength of our business gives us the confidence to invest in new initiatives to add new users,
improve engagement and customer experience, expand our products and services and drive long-term
shareholder value.”
December Quarter Operational and Financial Highlights*
Operational highlights:
December 31,
2013
September 30,
2014
December 31,
2014
% Change
YoY QoQ
Quarterly GMV (1)
(in RMB billions) 529 556 787 49% 42%
Quarterly Mobile GMV (1)
(in RMB
billions) 104 199 327 213% 64%
Mobile GMV as a percentage of total
GMV(1)
20% 36% 42%
Annual Active Buyers(2)
(in millions) 231 307 334 45% 9%
Mobile Monthly Active Users (MAUs)(3)
(in millions) 136 217 265 95% 22%
______________
* For definitions of terms used but not defined in this press release, please refer to the prospectus of our initial public offering.
(1) For the three months ended on the respective dates.
(2) For the twelve months ended on the respective dates.
(3) For the month ended on the respective dates.

2
Financial highlights:
Three months ended December 31,
2013 2014
RMB RMB US$ YoY % Change
(in millions, except percentages and per share
amounts)
Revenue 18,745 26,179 4,219 40%
Mobile Revenue 1,171 6,420 1,035 448%
Income from Operations 8,801 9,347 1,506 6%
Non-GAAP EBITDA 11,246 15,103 2,434 34%
Non-GAAP EBITDA Margin 60% 58% 58%
Net Income 8,357 5,983 964 (28%)
Non-GAAP Net Income 10,463 13,115 2,114 25%
Diluted Earnings per Share/ADS
(EPS) 3.55 2.29 0.37 (35%)
Non-GAAP Diluted EPS 4.45 5.05 0.81 13%
_______________
This release contains translation of certain Renminbi (“RMB”) amounts into U.S. dollars (“US$”) for the convenience of the reader, unless
otherwise stated, all translations of RMB into US$ were made at RMB6.2046 to US$1.00, the exchange rate set forth in the H.10 statistical
release of the Federal Reserve Board on December 31, 2014. The percentages stated in this release are calculated based on the RMB
amounts.
See the sections entitled “Non-GAAP Financial Measures” and “Reconciliation of Non-GAAP Measures to the Nearest Comparable GAAP
Measures” for more information about the non-GAAP measures referred to within this release.
Decrease primarily due to an increase in share-based compensation expense, a one-time charge for financing-related fees and an increase in
income tax expenses in the quarter ended December 31, 2014, as discussed in detail below.
GMV – GMV transacted on our China retail marketplaces in the quarter ended December 31, 2014 was
RMB787 billion (US$127 billion), an increase of 49% compared to the same quarter of 2013, and compared
to RMB556 billion in the quarter ended September 30, 2014, representing a net addition of RMB231 billion
GMV in three months. GMV transacted on Taobao Marketplace in the quarter ended December 31, 2014 was
RMB494 billion (US$80 billion), an increase of 43% compared to the same quarter of 2013. GMV
transacted on Tmall in the quarter ended December 31, 2014 was RMB293 billion (US$47 billion), an
increase of 60% compared to the same quarter of 2013. The GMV growth was primarily driven by an
increase in the number of active buyers and also partially attributable to category expansion, for example,
auction transactions. On November 11, 2014, our Singles Day promotion generated GMV settled through
Alipay of RMB57 billion (US$9.2 billion) on our China and international retail marketplaces within a 24-
hour period, an increase of 58% compared to the Singles Day in 2013.
Mobile GMV – Mobile GMV in the quarter ended December 31, 2014 was RMB327 billion (US$53 billion),
an increase of 213% compared to the same quarter of 2013. Mobile GMV accounted for 42% of total GMV
transacted on our China retail marketplaces in this quarter, compared to 36% in the quarter ended September
30, 2014 and 20% in the same quarter of 2013. The growth was primarily driven by an increase in the
monthly active users accessing our platforms through mobile devices and an increase in the level of their
spending.

3
Annual active buyers – Our China retail marketplaces had 334 million annual active buyers in the twelve
months ended December 31, 2014, compared to 307 million in the twelve months ended September 30, 2014
and 231 million in the twelve months ended December 31, 2013, representing an increase of 45% compared
to the same period in 2013. The growth in annual active buyers was driven by an increase in active buyers
throughout China, with substantially faster growth from lower tier cities.
Mobile MAUs – Mobile MAUs grew to 265 million in the month ended December 31, 2014, compared to
217 million in the month ended September 30, 2014, representing a record high net addition of 48 million
MAUs in three months, and a 95% increase from 136 million in the month ended December 31, 2013.
According to iResearch, our Mobile Taobao App continues to be the No. 1 e-commerce app in China,
demonstrating our ability to attract mobile users with strong purchasing intent on a large scale.
Revenue – Revenue increased by 40% to RMB26,179 million (US$4,219 million) in the quarter ended
December 31, 2014, compared to RMB18,745 million in the same quarter of 2013. Revenue from the China
commerce retail business increased by 32% to RMB21,275 million (US$3,429 million), compared to
RMB16,149 million in the same quarter of 2013, mainly driven by the growth in commission revenue and
online marketing services revenue. Mobile revenue from the China commerce retail business increased by
448% to RMB6,420 million (US$1,035 million) in the quarter ended December 31, 2014, compared to
RMB1,171 million in the same quarter of 2013, primarily due to a greater proportion of GMV generated on
mobile devices and an increase in the mobile monetization rate.
Income from operations – Income from operations in the quarter ended December 31, 2014 was RMB9,347
million (US$1,506 million), an increase of 6% compared to RMB8,801 million in the same quarter of 2013.
Operating income growth was lower than revenue growth primarily due to an increase in share-based
compensation expense (as discussed in “Share-based compensation expense” below).
Non-GAAP EBITDA – Non-GAAP EBITDA increased by 34% to RMB15,103 million (US$2,434 million)
in the quarter ended December 31, 2014, compared to RMB11,246 million in the same quarter of 2013.
Non-GAAP EBITDA margin was 58% in the quarter ended December 31, 2014, compared to 60% in the
December quarter of 2013. The year-on-year decrease in non-GAAP EBITDA margin was primarily due to
the consolidation of newly acquired businesses, mainly UCWeb Inc., or UCWeb, and AutoNavi Holding
Limited, or AutoNavi, and investments in new business initiatives, such as our mobile operating system,
local services and digital entertainment. The quarter-on-quarter increase in non-GAAP EBITDA margin from
51% in the quarter ended September 30, 2014 was primarily due to operating leverage in this seasonally
strong quarter.
Net income – Our net income in the quarter ended December 31, 2014 was RMB5,983 million (US$964
million), a decrease of 28% compared to RMB8,357 million in the same quarter of 2013. The decrease was
primarily due to (i) an increase in share-based compensation expense (including the effect of “mark-to-
market” accounting of share-based awards in an amount of RMB1,494 million (US$241 million)) (as
discussed in “Share-based compensation expense” below), (ii) an RMB830 million (US$134 million) one-
time charge for financing-related fees as a result of the early repayment of our US$8 billion bank borrowings
(as discussed in “Interest expense” below), and (iii) an increase in income tax expenses, primarily due to the
expiration of an enterprise income tax (“EIT”) exemption period for one of our major subsidiaries (as
discussed in “Income tax expenses” below).
Non-GAAP net income – Non-GAAP net income increased by 25% to RMB13,115 million (US$2,114
million) in the quarter ended December 31, 2014, compared to RMB10,463 million in the same quarter of
2013.

4
Diluted EPS and non-GAAP diluted EPS – Diluted EPS in the quarter ended December 31, 2014 was
RMB2.29 (US$0.37) on 2,588 million diluted shares outstanding, a decrease of 35% compared to RMB3.55
on 2,343 million diluted shares outstanding in the same quarter of 2013. Non-GAAP diluted EPS in the
quarter ended December 31, 2014 was RMB5.05 (US$0.81) on 2,588 million diluted shares outstanding, an
increase of 13% compared to RMB4.45 on 2,343 million diluted shares outstanding in the same quarter of
2013. The lower non-GAAP diluted EPS growth rate relative to non-GAAP net income growth rate was due
to an increase in number of diluted shares outstanding in the quarter ended December 31, 2014 following the
completion of our initial public offering in September 2014.
December Quarter Financial Results
Revenue – Revenue for the quarter ended December 31, 2014 was RMB26,179 million (US$4,219 million),
an increase of 40% compared to RMB18,745 million in the same quarter of 2013. The increase was mainly
driven by the continuing rapid growth of our China commerce retail business. The following table sets forth
a breakdown of our revenue for the periods indicated.
Three months ended December 31,
2013 2014
RMB
% of
Revenue RMB US$
% of
Revenue
YoY
Change
(in millions, except percentages)
China commerce
Retail 16,149 86% 21,275 3,429 82% 32%
Wholesale 612 3% 860 139 3% 41%
Total China commerce 16,761 89% 22,135 3,568 85% 32%
International commerce
Retail 264 2% 554 89 2% 110%
Wholesale 1,000 5% 1,209 195 5% 21%
Total international commerce 1,264 7% 1,763 284 7% 39%
Cloud computing and Internet
infrastructure 196 1% 362 58 1% 85%
Others 524 3% 1,919 309 7% 266%
Total 18,745 100% 26,179 4,219 100% 40%
China commerce retail business – Revenue from our China commerce retail business in the quarter
ended December 31, 2014 was RMB21,275 million (US$3,429 million), or 82% of total revenue, an
increase of 32% compared to RMB16,149 million in the same quarter of 2013. The increase was mainly
driven by the growth in commission revenue and online marketing services revenue. Commission
revenue accounted for 37% of China commerce retail revenue in the quarter ended December 31, 2014,
compared to 30% in the same quarter of 2013. Revenue growth during this period occurred in the context
of and reflected an increase of 49% in GMV transacted on our China retail marketplaces, which was
primarily driven by a 45% increase in the number of active buyers.
The lower revenue growth relative to GMV growth was mainly a result of (i) the higher percentage of
total GMV contributed by mobile GMV, which has a lower monetization rate compared to the non-
mobile monetization rate, and (ii) lower pay-for-performance (“P4P”) monetization on the personal
computer (“PC”) interface compared to the same quarter of 2013. The lower P4P monetization on PC
was primarily caused by our continued efforts to improve user experience, which adversely affected cost
per click. Our strong momentum in mobile and commitment to improving user experience may slow the
growth rate of our online marketing services revenue in the near term, but we believe they will create
significant value for both our users and our business in the longer term.

5
Mobile revenue from the China commerce retail business in the quarter ended December 31, 2014 was
RMB6,420 million (US$1,035 million), an increase of 448% compared to RMB1,171 million in the same
quarter of 2013, representing 30% of our China commerce retail business revenue, compared to 29% in
the quarter ended September 30, 2014 and 7% in the same quarter of 2013. The increase in mobile
revenue from the China commerce retail business was primarily due to a greater proportion of GMV
generated on mobile devices and an increase in the mobile monetization rate.
China commerce wholesale business – Revenue from our China commerce wholesale business in the
quarter ended December 31, 2014 was RMB860 million (US$139 million), an increase of 41% compared
to RMB612 million in the same quarter of 2013. The increase was due to an increase in average revenue
from paying members and an increase in paying members.
International commerce retail business – Revenue from our international commerce retail business in
the quarter ended December 31, 2014 was RMB554 million (US$89 million), an increase of 110%
compared to RMB264 million in the same quarter of 2013. The increase was primarily due to an increase
in GMV transacted on AliExpress, partially attributable to AliExpress’ participation in our Singles Day
promotion campaign on November 11, 2014 for the first time.
International commerce wholesale business – Revenue from our international commerce wholesale
business in the quarter ended December 31, 2014 was RMB1,209 million (US$195 million), an increase
of 21% compared to RMB1,000 million in the same quarter of 2013. The main reason for this increase
was an increase in the number of paying members and an increase in average revenue from paying
members.
Others – Other revenue in the quarter ended December 31, 2014 was RMB1,919 million (US$309
million), an increase of 266% compared to RMB524 million in the same quarter of 2013. This increase
was primarily due to the consolidation of revenue from acquired business (mainly UCWeb and AutoNavi)
and an increase in interest income generated by our SME loan business. When the restructuring of our
relationship with Ant Financial closes, which we expect in the March 2015 quarter, we will no longer
consolidate revenue generated by the SME loan business in our financial results.
Cost of revenue – Cost of revenue in the quarter ended December 31, 2014 was RMB7,520 million
(US$1,212 million), or 29% of revenue, compared to RMB4,171 million, or 22% of revenue, in the same
quarter of 2013. The increase was primarily due to an increase in share-based compensation expense (as
discussed in “Share-based compensation expense” below), an increase in costs associated with our new
businesses initiatives, and an increase in payment processing fees resulting from an increase in GMV
transacted on our retail marketplaces.
Product development expenses – Product development expenses in the quarter ended December 31, 2014
were RMB3,083 million (US$497 million), or 12% of revenue, compared to RMB1,707 million, or 9% of
revenue in the same quarter of 2013. The increase was primarily due to an increase in share-based
compensation expense (as discussed in “Share-based compensation expense” below). The increase was
partially offset by the decrease in royalty fees paid to Yahoo which terminated upon completion of our initial
public offering in September 2014.
Sales and marketing expenses – Sales and marketing expenses in the quarter ended December 31, 2014
were RMB3,021 million (US$487 million), or 12% of revenue, compared to RMB1,897 million, or 10% of
revenue in the same quarter of 2013. The increase was primarily due to an increase in share-based
compensation expense (as discussed in “Share-based compensation expense” below). The increase was also

6
due to the consolidation of marketing expenses of acquired business (mainly UCWeb and AutoNavi), an
increase in advertising and promotional spending mainly to strengthen marketing of our Taobao and Tmall
brands, especially in lower tier cities, as well as to promote our new businesses initiatives (e.g., local services)
during this quarter.
General and administrative expenses – General and administrative expenses in the quarter ended
December 31, 2014 were RMB2,419 million (US$390 million), or 9 % of revenue, compared to RMB2,046
million, or 11% of revenue in the same quarter of 2013. The decrease in general and administrative expenses
as a percentage of revenue was primarily due to a one-time equity-settled donation expense of RMB1,269
million made in the quarter ended December 31, 2013 relating to the grant of options to purchase 50,000,000
of our ordinary shares to a non-profit organization, which was partially offset by an increase in share-based
compensation expense in the quarter ended December 31, 2014 (as discussed in “Share-based compensation
expense” below).
Share-based compensation expense – Share-based compensation expense included in respective cost or
expense items above in the quarter ended December 31, 2014 was RMB4,313 million (US$695 million), or
16% of revenue, an increase of 554% compared to RMB659 million, or 4% of revenue, in the same quarter
of 2013. The increase was primarily caused by (1) performance-based and retention grants of share-based
awards granted prior to our initial public offering in 2014, with vesting periods of four years for our
employees and six years for senior management, (2) the “mark-to-market” accounting of (i) share-based
awards we granted to the employees of Zhejiang Ant Small and Micro Financial Services Company Ltd., or
Ant Financial, and (ii) Ant Financial’s share-based awards granted by a major shareholding entity of Ant
Financial controlled by Jack Ma, our executive chairman, to our employees. The expense arising from such
Ant Financial share-based awards granted to our employees represents a non-cash accounting charge to us
that will not result in any equity dilution to our shareholders. Without the effect of such “mark-to-market”
accounting, our share-based compensation expense would have been RMB2,819 million (US$454 million) in
the quarter ended December 31, 2014, compared to RMB2,233 million in the quarter ended September 30,
2014. Pursuant to generally accepted accounting principles in the United States, we are required to perform
such re-measurement at each period end. Accordingly, we expect that our share-based compensation expense
will continue to be affected by changes in the fair value of our share-based awards as well as the fair value of
Ant Financial’s share-based awards granted to our employees.
Amortization of intangible assets – Amortization of intangible assets in the quarter ended December 31,
2014 was RMB614 million (US$99 million), a significant increase from RMB123 million in the same
quarter of 2013. This increase was due to an increase in intangibles assets primarily as a result of our
strategic acquisitions, mainly UCWeb and AutoNavi.
Income from operations – Income from operations in the quarter ended December 31, 2014 was RMB9,347
million (US$1,506 million), an increase of 6% compared to RMB8,801 million in the same quarter of 2013.
The lower growth of operating income relative to revenue growth in this quarter and the decrease in
operating margin to 36% in the quarter ended December 31, 2014 from 47% in the same quarter of 2013
were primarily due to an increase in share-based compensation expense (as discussed in “Share-based
compensation expense” above).
Non-GAAP EBITDA – Non-GAAP EBITDA increased by 34% to RMB15,103 million (US$2,434 million)
in the quarter ended December 31, 2014, compared to RMB11,246 million in the same quarter of 2013.
Non-GAAP EBITDA margin was 58% in the quarter ended December 31, 2014, compared to 60% in the
December quarter of 2013. The year-on-year decrease in non-GAAP EBITDA margin was primarily due to
the consolidation of newly acquired businesses, mainly UCWeb and AutoNavi, and investments in new
business initiatives, such as our mobile operating system, local services and digital entertainment. The

7
quarter-on-quarter increase in non-GAAP EBITDA margin from 51% in the quarter ended September 30,
2014 was primarily due to operating leverage in this seasonally strong quarter. A reconciliation of operating
income to non-GAAP EBITDA is included at the end of this release.
Interest and investment income, net – Interest and investment income, net in the quarter ended December
31, 2014 was RMB313 million (US$51 million), an increase of 6% compared to RMB296 million in the
same quarter of 2013. The increase was primarily due to an increase in interest income as a result of higher
cash balance during the period, which in turn was primarily due to the proceeds from our initial public
offering in September 2014 and an increase in operating cash flow. This increase was partially offset by an
increase in impairment charge of cost-method investments and losses recognized with respect to the periodic
revaluation of convertible bonds we held in connection with our strategic investments in publicly traded
entities.
Interest expense – Interest expense in the quarter ended December 31, 2014 was RMB1,344 million
(US$216 million), an increase of 247% compared to RMB387 million in the same quarter of 2013. The
increase was primarily due to an RMB830 million (US$134 million) one-time charge for financing-related
fees as a result of the early repayment of our US$8 billion bank borrowings with proceeds from our issuance
of US$8 billion senior unsecured notes in this quarter.
Other income, net – Other income, net in the quarter ended December 31, 2014 was RMB901 million
(US$145 million), an increase of 64% compared to RMB548 million in the same quarter of 2013. The
increase was primarily due to an increase of RMB101 million (US$16 million) in royalty fees and software
technology service fees received from Ant Financial to RMB344 million (US$55 million) in the quarter
ended December 31, 2014 from RMB243 million in the same quarter of 2013 as a result of an increase in
pre-tax income of Ant Financial, as well as an increase in government grants received from central and local
governments in connection with our contribution to technology development and investments in local
business districts.
Income tax expenses – Income tax expenses in the quarter ended December 31, 2014 were RMB2,429
million (US$392 million), an increase of 228% compared to RMB741 million in the same quarter of 2013.
The increase was primarily due to the increase in taxable income from our operations in China. Our effective
tax rate increased to 26% in the quarter ended December 31, 2014 from 8% in the same quarter of 2013.
Excluding share-based compensation expense, impairment of goodwill, intangible assets and investments,
and unrealized gain/loss on investments which are not deductible or assessable for income tax purposes, our
effective tax rate would have been 17% in the quarter ended December 31, 2014, compared to 7% in the
same quarter of 2013. The increase was primarily due to the expiration of an EIT exemption period for one of
our major subsidiaries, upon which the subsidiary became subject to an EIT rate of 12.5% (or 50% of the
statutory EIT rate) in calendar year 2014.
Net income and non-GAAP net income – As a result of the foregoing, our net income in the quarter ended
December 31, 2014 was RMB5,983 million (US$964 million), a decrease of 28% compared to RMB8,357
million in the same quarter of 2013. Excluding the effects of share-based compensation expense, impairment
of goodwill and investment in equity investees, the one-time charge for financing-related fees, amortization
of intangible assets and certain other items, non-GAAP net income in the quarter ended December 31, 2014
was RMB13,115 million (US$2,114 million), an increase of 25% compared to RMB10,463 million in the
same quarter of 2013. A reconciliation of net income to non-GAAP net income is included at the end of this
release.

8
Net income attributable to ordinary shareholders – Net income attributable to ordinary shareholders in
the quarter ended December 31, 2014 was RMB5,936 million (US$957million), a decrease of 28% compared
to RMB8,266 million in the same quarter of 2013.
Diluted EPS and non-GAAP diluted EPS – Diluted EPS in the quarter ended December 31, 2014 was
RMB2.29 (US$0.37) on 2,588 million diluted shares outstanding, a decrease of 35% compared to RMB3.55
on 2,343 million diluted shares outstanding in the same quarter of 2013. Excluding the effects of share-based
compensation expense, impairment of goodwill and investment in equity investees, the one-time charge for
financing-related fees, amortization of intangible assets and certain other items, non-GAAP diluted EPS in
the quarter ended December 31, 2014 was RMB5.05 (US$0.81), an increase of 13% compared to RMB4.45
in the same quarter of 2013. The lower non-GAAP diluted EPS relative to non-GAAP net income growth
rate was due to an increase in the number of diluted shares outstanding in the quarter ended December 31,
2014 following the completion of our initial public offering. A reconciliation of diluted EPS to the non-
GAAP diluted EPS is included at the end of this release.
Cash – As of December 31, 2014, cash, cash equivalents and short-term investments were RMB130,741
million (US$21,071 million), compared to RMB43,632 million as of March 31, 2014.
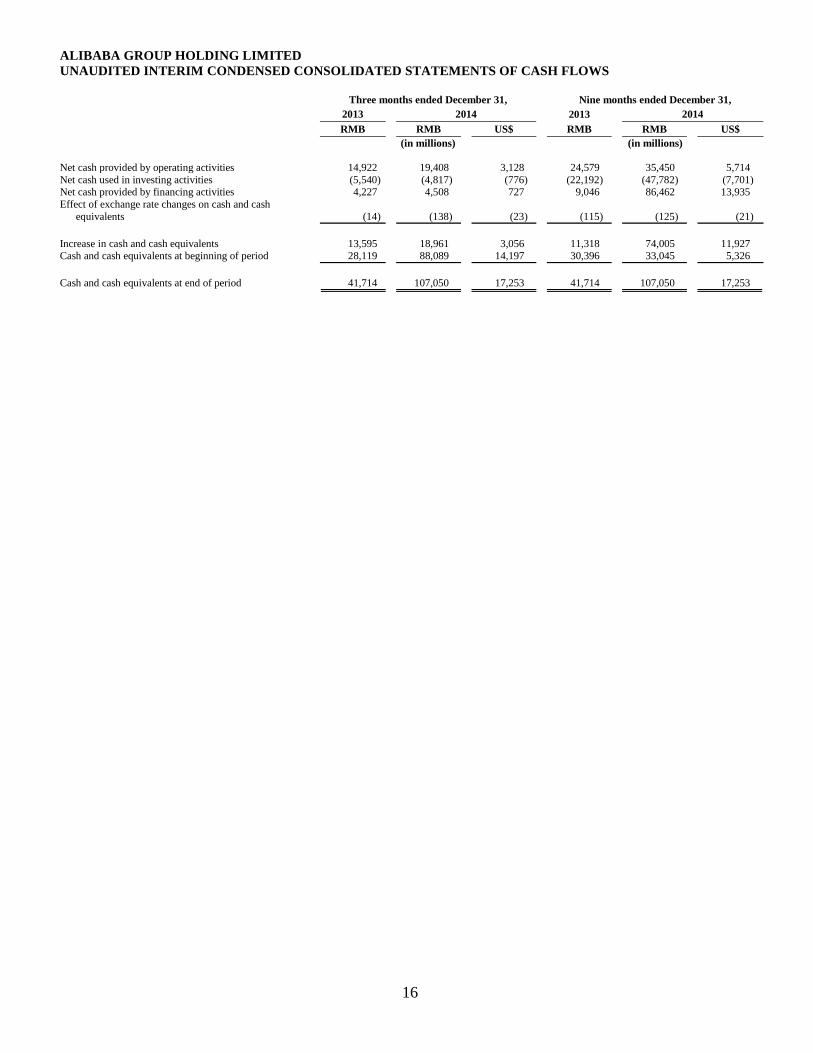
Cash flow from operating activities and free cash flow – Net cash provided by operating activities in the
quarter ended December 31, 2014 was RMB19,408 million (US$3,128 million), an increase of 30%
compared to RMB14,922 million in the same quarter of 2013. Capital expenditures in the quarter ended
December 31, 2014 were RMB1,513 million (US$244 million), compared to RMB1,601 million in the same
quarter of 2013. Capital expenditures in the quarter ended December 31, 2014 included cash outflow for
acquisition of land use rights and construction in progress of RMB291 million (US$47 million). Free cash
flow, a non-GAAP measurement of liquidity, in the quarter ended December 31, 2014 was RMB22,924
million (US$3,695 million), an increase of 34% compared to RMB17,163 million in the same quarter of
2013. A reconciliation of net cash provided by operating activities to free cash flow, a non-GAAP measure of
liquidity, is included at the end of this release.
Net cash used in investing activities – During the quarter ended December 31, 2014, net cash used in
investing activities of RMB4,817 million (US$776 million) mainly included disbursements for short-term
investments of RMB1,944 million (US$313 million), capital expenditure of RMB1,513 million (US$244
million) as well as investment and acquisition activities of RMB2,657 million (US$428 million) primarily in
mobile and logistics related businesses.
Employee number – As of December 31, 2014, we had a total of 34,081 employees, compared to 33,239 as
of September 30, 2014 and 20,884 as of December 31, 2013.
Webcast and Conference Call Information
A live webcast of the earnings conference call, which will be held shortly following the release of this
announcement, can be accessed at http://www.alibabagroup.com/en/ir/earnings. An archived webcast will be
available through the same link following the call. A replay of the conference call will be available for one
week (dial-in number: +1 646-254-3697; conference ID: 65377381).
Please visit Alibaba Group’s Investor Relations website at http://www.alibabagroup.com/en/ir/home on
January 29, 2015 to view the earnings release and accompanying slides prior to the conference call.
About Alibaba Group

9
Alibaba Group’s mission is to make it easy to do business anywhere. The company is the largest online and
mobile commerce company in the world in terms of gross merchandise volume. Founded in 1999, the
company provides the fundamental technology infrastructure and marketing reach to help businesses
leverage the power of the Internet to establish an online presence and conduct commerce with hundreds of
millions of consumers and other businesses.
Alibaba Group’s major businesses include:
• Taobao Marketplace (www.taobao.com), China’s largest online shopping destination
• Tmall.com (www.tmall.com), China’s largest third-party platform for brands and retailers
• Juhuasuan (www.juhuasuan.com), China’s most popular online group buying marketplace
• Alitrip (www.alitrip.com), a leading online travel booking platform
• AliExpress (www.aliexpress.com), a global online marketplace for consumers to buy directly from
China
• Alibaba.com (www.alibaba.com), China’s largest global online wholesale platform for small
businesses
• 1688.com (www.1688.com), a leading online wholesale marketplace in China
• Alibaba Cloud Computing (www.aliyun.com), a provider of cloud computing services to businesses
and entrepreneurs
Alibaba Group also provides payment and/or escrow services on its marketplaces through its contractual
arrangements with Ant Financial Services Group, a related company of Alibaba Group that operates Alipay
(www.alipay.com).
Through China Smart Logistics (or Zhejiang Cainiao Supply Chain Management Co., Ltd.), a 48%-owned
affiliate, Alibaba Group operates a central logistics information system that connects a network of express
delivery companies in China.
Contact
Investor Relations Contacts
Grace Wong
Media Contacts
Robert Christie
Safe Harbor Statements
This announcement contains forward-looking statements. These statements are made under the “safe harbor”
provisions of the U.S. Private Securities Litigation Reform Act of 1995. These forward-looking statements
can be identified by terminology such as “will,” “expects,” “anticipates,” “future,” “intends,” “plans,”
“believes,” “estimates,” “potential,” “continue,” “ongoing,” “targets” and similar statements. Among other
things, statements that are not historical facts, including statements about Alibaba’s beliefs and expectations,
the business outlook and quotations from management in this announcement, as well as Alibaba’s strategic
and operational plans, are or contain forward-looking statements. Alibaba may also make written or oral
forward-looking statements in its periodic reports to the U.S. Securities and Exchange Commission (the
“SEC”), in press releases and other written materials and in oral statements made by its officers, directors or
10
employees to third parties. Forward-looking statements involve inherent risks and uncertainties. A number of
factors could cause actual results to differ materially from those contained in any forward-looking statement,
including but not limited to the following: Alibaba’s goals and strategies; Alibaba’s future business
development; Alibaba’s ability to maintain the trusted status of its ecosystem, reputation and brand;
Alibaba’s ability to retain or increase engagement of buyers, sellers and other participants in its ecosystem
and enable new offerings; Alibaba’s ability to successfully monetize traffic on its mobile platform; risks
associated with limitation or restriction of services provided by Alipay; risks associated with increased
investments in Alibaba’s business; risks associated with acquisitions; privacy and regulatory concerns;
competition; security breaches; the continued growth of the e-commerce market in China and globally; and
fluctuations in general economic and business conditions in China and globally and assumptions underlying
or related to any of the foregoing. Further information regarding these and other risks is included in
Alibaba’s filings with the SEC. All information provided in this press release and in the attachments is as of
the date of this press release and are based on assumptions that we believe to be reasonable as of this date,
and Alibaba does not undertake any obligation to update any forward-looking statement, except as required
under applicable law.
Non-GAAP Financial Measures
To supplement its consolidated financial statements, which are prepared and presented in accordance with
GAAP, Alibaba Group uses the following non-GAAP financial measures: non-GAAP EBITDA (including
non-GAAP EBITDA margin), non-GAAP net income, non-GAAP diluted EPS and free cash flow. For more
information on these non-GAAP financial measures, please refer to the table captioned “Reconciliations of
Non-GAAP Measures to the Nearest Comparable GAAP Measures” in this press release.
Alibaba Group believes that non-GAAP EBITDA, non-GAAP net income and non-GAAP diluted EPS help
identify underlying trends in its business that could otherwise be distorted by the effect of the expenses that
Alibaba Group includes in income from operations, net income and diluted EPS. Alibaba Group believes that
non-GAAP EBITDA, non-GAAP net income and non-GAAP diluted EPS provide useful information about
its operating results, enhance the overall understanding of its past performance and future prospects and
allow for greater visibility with respect to key metrics used by our management in its financial and
operational decision-making. Alibaba Group considers free cash flow to be a liquidity measure that provides
useful information to management and investors about the amount of cash generated by its business that can
be used for strategic corporate transactions, including investing in its new business initiatives, making
strategic investments and acquisitions and strengthening its balance sheet. Non-GAAP EBITDA, non-GAAP
net income, non-GAAP diluted EPS and free cash flow should not be considered in isolation or construed as
an alternative to net income, diluted EPS, cash flows or any other measure of performance or as an indicator
of Alibaba Group’s operating performance. These non-GAAP financial measures presented here may not be
comparable to similarly titled measures presented by other companies. Other companies may calculate
similarly titled measures differently, limiting their usefulness as comparative measures to our data.
Non-GAAP EBITDA represents income from operations (which excludes interest and investment income,
net, interest expense, other income, net, income tax expenses and share of results of equity investees) before
certain non-cash expenses, consisting of share-based compensation expense, amortization, depreciation and
impairment of goodwill and intangible assets, and an equity-settled donation expense that Alibaba Group
does not believe are reflective of its core operating performance during the periods presented.
Non-GAAP net income represents net income before share-based compensation expense, amortization,
impairment of goodwill, intangible assets and investments, gain (loss) on deemed
disposals/disposals/revaluation of investments, amortization of excess value receivable arising from the
restructuring of commercial arrangements with Ant Financial, and one-time expense items consisting of the

11
expenses relating to the sale of shares by existing shareholders in our initial public offering, equity-settled
donation expense and charge for financing-related fees as a result of early repayment of bank borrowings.
Non-GAAP diluted EPS represents non-GAAP net income attributable to ordinary shareholders divided by
the weighted average number of shares outstanding during the periods on a diluted basis, including
accounting for the effects of the assumed conversion of convertible preference shares.
Free cash flow represents net cash provided by operating activities as presented in Alibaba Group’s
consolidated cash flow statement less purchases of property and equipment and intangible assets (excluding
acquisition of land use rights and construction in progress) and adjusted for changes in loan receivables
relating to micro loans of its SME loan business. Alibaba Group presents the adjustment for changes in loan
receivables because such receivables are reflected under cash flow from operating activities, whereas the
secured borrowings and other bank borrowings used to finance them are reflected under cash flows from
financing activities, and accordingly, the adjustment is made to show cash flows from operating activities net
of the effect of changes in loan receivables.
The tables captioned “Reconciliations of Non-GAAP Measures to the Nearest Comparable GAAP Measures”
in this press release has more details on the non-GAAP financial measures that are most directly comparable
to GAAP financial measures and the related reconciliations between these financial measures.

12
ALIBABA GROUP HOLDING LIMITED UNAUDITED INTERIM CONSOLIDATED INCOME STATEMENTS
Three months ended December 31, Nine months ended December 31,
2013 2014 2013 2014
RMB RMB US$ RMB RMB US$
(in millions, except per share data) (in millions, except per share data)
Revenue 18,745 26,179 4,219 40,473 58,779 9,473
Cost of revenue (4,171) (7,520) (1,212) (9,899) (17,701) (2,853) Product development expenses (1,707) (3,083) (497) (3,893) (7,616) (1,227)
Sales and marketing expenses (1,897) (3,021) (487) (3,267) (5,982) (964)
General and administrative expenses (2,046) (2,419) (390) (3,704) (5,323) (858) Amortization of intangible assets (123) (614) (99) (197) (1,446) (233)
Impairment of goodwill and intangible
assets — (175) (28) (44) (175) (28)
Income from operations 8,801 9,347 1,506 19,469 20,536 3,310 Interest and investment income, net 296 313 51 1,080 7,609 1,226
Interest expense (387) (1,344) (216) (1,842) (2,275) (367)
Other income, net 548 901 145 1,178 1,990 321
Income before income tax and share of results of equity investees 9,258 9,217 1,486 19,885 27,860 4,490
Income tax expenses (741) (2,429) (392) (1,969) (5,213) (840) Share of results of equity investees (160) (805) (130) (174) (1,196) (193)
Net income 8,357 5,983 964 17,742 21,451 3,457
Net income attributable to
noncontrolling interests (31) (47) (7) (29) (83) (13)
Net income attributable to Alibaba Group Holding Limited 8,326 5,936 957 17,713 21,368 3,444
Accretion of Convertible Preference
Shares (8) — — (24) (15) (2)
Dividends accrued on Convertible
Preference Shares (52) — — (156) (97) (16)
Net income attributable to ordinary
shareholders 8,266 5,936 957 17,533 21,256 3,426
Earnings per share attributable to
ordinary shareholders
Basic 3.79 2.42 0.39 8.08 9.26 1.49
Diluted 3.55 2.29 0.37 7.63 8.66 1.40
Weighted average number of share
used in calculating net income
per ordinary share
Basic 2,180 2,450 2,170 2,295
Diluted 2,343 2,588 2,320 2,467
Share-based compensation expense
by function: Cost of revenue 226 1,413 228 624 3,161 509
Product development expenses 248 1,266 204 588 2,211 356
Sales and marketing expenses 55 402 65 146 637 103 General and administrative expenses 130 1,232 198 561 2,387 385
Total 659 4,313 695 1,919 8,396 1,353

13
ALIBABA GROUP HOLDING LIMITED REVENUE
The following table sets forth the principal components of our revenue for the periods indicated:
Three months ended December 31, Nine months ended December 31,
2013 2014 2013 2014
RMB RMB US$ RMB RMB US$
(in millions) (in millions)
China commerce Retail (i) 16,149 21,275 3,429 33,461 46,683 7,524
Wholesale (ii) 612 860 139 1,706 2,359 380
Total China commerce 16,761 22,135 3,568 35,167 49,042 7,904
International commerce
Retail (iii) 264 554 89 653 1,331 215 Wholesale (iv) 1,000 1,209 195 2,904 3,518 567
Total international commerce 1,264 1,763 284 3,557 4,849 782
Cloud computing and Internet
infrastructure (v) 196 362 58 560 883 142
Others (vi) 524 1,919 309 1,189 4,005 645
Total 18,745 26,179 4,219 40,473 58,779 9,473
_____________________________
(i) Revenue from China commerce retail is primarily generated from our China retail marketplaces.
(ii) Revenue from China commerce wholesale is primarily generated from 1688.com.
(iii) Revenue from International commerce retail is primarily generated from AliExpress.
(iv) Revenue from International commerce wholesale is primarily generated from Alibaba.com.
(v) Revenue from cloud computing and Internet infrastructure is primarily generated from the provision of services, such as data storage, elastic computing,
database and large scale computing services, as well as web hosting and domain name registration.
(vi) Other revenue mainly represents interest income generated from micro loans and revenue generated by UCWeb and AutoNavi.

14
ALIBABA GROUP HOLDING LIMITED UNAUDITED INTERIM CONSOLIDATED BALANCE SHEETS
As of
March 31, As of December 31,
2014 2014
RMB RMB US$
(in millions)
Assets
Current assets:
Cash and cash equivalents 33,045 107,050 17,253
Short-term investments 10,587 23,691 3,818
Restricted cash and escrow receivables 4,921 2,220 358
Loan receivables 13,159 23,679 3,817
Investment securities 1,442 2,570 414
Prepayments, receivables and other assets 4,679 10,986 1,771
Total current assets 67,833 170,196 27,431
Investment in equity investees 17,666 25,864 4,169
Investment securities 3,023 11,285 1,819
Prepayments, receivables and other assets 2,087 3,177 512
Property and equipment, net 5,581 9,028 1,455
Land use rights 1,660 2,963 477
Intangible assets 1,906 6,803 1,096
Goodwill 11,793 40,677 6,556
Total assets 111,549 269,993 43,515
Liabilities, Mezzanine Equity and Shareholders’ Equity
Current liabilities:
Current bank borrowings 1,100 4,835 779
Secured borrowings 9,264 14,303 2,305
Income tax payable 1,267 2,281 368
Escrow money payable 2,659 — —
Accrued expenses, accounts payable and other liabilities 11,887 21,240 3,423
Merchant deposits 4,711 12,712 2,049
Deferred revenue and customer advances 6,496 7,729 1,246
Total current liabilities 37,384 63,100 10,170
Deferred revenue 428 555 89
Deferred tax liabilities 2,136 4,337 699
Non-current bank borrowings 30,711 1,285 207
Unsecured senior notes — 48,803 7,866
Other liabilities 72 2,101 339
Total liabilities 70,731 120,181 19,370

15
ALIBABA GROUP HOLDING LIMITED UNAUDITED INTERIM CONSOLIDATED BALANCE SHEETS (CONTINUED)
As of
March 31, As of December 31,
2014 2014
RMB RMB US$
(in millions)
Commitments and contingencies — — —
Mezzanine equity:
Convertible Preference Shares 10,284 — —
Others 117 358 57
Total mezzanine equity 10,401 358 57
Alibaba Group Holding Limited shareholders’ equity:
Ordinary shares, US$0.000025 par value; 2,797,400,000 and
4,000,000,000 shares authorized; 2,226,810,660 and 2,487,314,208
shares issued and outstanding as of March 31, 2014 and December 31,
2014, respectively 1 1 —
Additional paid-in capital 27,043 112,436 18,121
Treasury shares at cost — — —
Restructuring reserve — (1,217) (196)
Subscription receivables (540) (351) (55)
Statutory reserves 2,474 2,522 406
Accumulated other comprehensive income (823) 1,569 253
Retained earnings 1,183 22,141 3,568
Total Alibaba Group Holding Limited shareholders’ equity 29,338 137,101 22,097
Noncontrolling interests 1,079 12,353 1,991
Total equity 30,417 149,454 24,088
Total liabilities, mezzanine equity and equity 111,549 269,993 43,515
16
ALIBABA GROUP HOLDING LIMITED UNAUDITED INTERIM CONDENSED CONSOLIDATED STATEMENTS OF CASH FLOWS
Three months ended December 31, Nine months ended December 31,
2013 2014 2013 2014
RMB RMB US$ RMB RMB US$
(in millions) (in millions)
Net cash provided by operating activities 14,922 19,408 3,128 24,579 35,450 5,714
Net cash used in investing activities (5,540) (4,817) (776) (22,192) (47,782) (7,701) Net cash provided by financing activities 4,227 4,508 727 9,046 86,462 13,935
Effect of exchange rate changes on cash and cash
equivalents (14) (138) (23) (115) (125) (21)
Increase in cash and cash equivalents 13,595 18,961 3,056 11,318 74,005 11,927 Cash and cash equivalents at beginning of period 28,119 88,089 14,197 30,396 33,045 5,326
Cash and cash equivalents at end of period 41,714 107,050 17,253 41,714 107,050 17,253

17
ALIBABA GROUP HOLDING LIMITED RECONCILIATIONS OF NON-GAAP MEASURES TO THE NEAREST COMPARABLE GAAP MEASURES
The table below sets forth a reconciliation of our income from operations to non-GAAP EBITDA for the periods indicated:
Three months ended December 31, Nine months ended December 31,
2013 2014 2013 2014
RMB RMB US$ RMB RMB US$
(in millions) (in millions)
Income from operations 8,801 9,347 1,506 19,469 20,536 3,310
Add: Share-based compensation expense 659 4,313 695 1,919 8,396 1,353
Add: Amortization of intangible
assets 123 614 99 197 1,446 233 Add: Depreciation and
amortization of property
and equipment and land use rights 394 654 106 947 1,617 261
Add: Impairment of goodwill and
intangible assets — 175 28 44 175 28
Add: Equity-settled donation
expense 1,269 — — 1,269 — —
Non-GAAP EBITDA 11,246 15,103 2,434 23,845 32,170 5,185
The table below sets forth a reconciliation of our net income to non-GAAP net income for the periods indicated:
Three months ended December 31, Nine months ended December 31
2013 2014 2013 2014
RMB RMB US$ RMB RMB US$
(in millions) (in millions)
Net income 8,357 5,983 964 17,742 21,451 3,457
Add: Share-based compensation
expense 659 4,313 695 1,919 8,396 1,353
Add: Amortization of intangible assets 123 614 99 197 1,446 233
Add: Impairment of goodwill,
intangible assets and investments 55 1,032 166 124 1,032 166
Add: (Gain) loss on deemed
disposals/disposals/ revaluation of investments — 241 39 (312) (6,247) (1,006)
Add: Amortization of excess
value receivable arising from the restructuring of
commercial arrangements
with Ant Financial — 66 11 — 101 16 Add: Expenses relating to the
sale of shares by existing
shareholders in initial
public offering — 36 6 — 231 37
Add: Equity-settled donation
expense 1,269 — — 1,269 — — Add: One-time charge for
financing-related fees as a
result of early repayment of bank borrowings — 830 134 664 830 134
Non-GAAP net income 10,463 13,115 2,114 21,603 27,240 4,390

18
ALIBABA GROUP HOLDING LIMITED RECONCILIATIONS OF NON-GAAP MEASURES TO THE NEAREST COMPARABLE GAAP MEASURES
(CONTINUED)
The table below sets forth a reconciliation of our diluted EPS to non-GAAP diluted EPS for the periods indicated:
Three months ended December 31, Nine months ended December 31,
2013 2014 2013 2014
RMB RMB US$ RMB RMB US$
(in millions, except per share data) (in millions, except per share data)
Net income attributable to
ordinary shareholders 8,266 5,936 957 17,533 21,256 3,426
Add: Reversal of accretion
upon assumed conversion of Convertible Preference
Shares 8 — — 24 15 2
Add: Dividend eliminated upon assumed conversion of
Convertible Preference
Shares 52 — — 156 97 16
Net income attributable to
ordinary shareholders for
computing diluted EPS 8,326 5,936 957 17,713 21,368 3,444
Add: Non-GAAP adjustments to net income(a) 2,106 7,132 1,150 3,861 5,789 933
Non-GAAP net income
attributable to ordinary
shareholders for
computing non-GAAP
diluted EPS 10,432 13,068 2,107 21,574 27,157 4,377
Weighted average number
of shares on a diluted
basis 2,343 2,588 2,320 2,467
Diluted EPS(b) 3.55 2.29 0.37 7.63 8.66 1.40
Add: Non-GAAP adjustments to net income per share(c) 0.90 2.76 0.44 1.67 2.35 0.37
Non-GAAP diluted EPS(d) 4.45 5.05 0.81 9.30 11.01 1.77
_______________________
(a) See the table above about the reconciliation of net income to non-GAAP net income for more information of these non-GAAP adjustments.
(b) Diluted EPS is derived from net income attributable to ordinary shareholders for computing diluted EPS divided by weighted average number of shares on a diluted
basis.
(c) Non-GAAP adjustments to net income per share is derived from non-GAAP adjustments to net income divided by weighted average number of shares on a diluted
basis.
(d) Non-GAAP diluted EPS is derived from non-GAAP net income attributable to ordinary shareholders for computing non-GAAP diluted EPS divided by weighted
average number of shares on a diluted basis.
The table below sets forth a reconciliation of net cash provided by operating activities to free cash flow for the periods indicated:
Three months ended December 31, Nine months ended December 31,
2013 2014 2013 2014
RMB RMB US$ RMB RMB US$
(in millions) (in millions)
Net cash provided by operating
activities 14,922 19,408 3,128 24,579 35,450 5,714
Less: Purchase of property and
equipment and intangible
assets (excluding land use rights and construction in
progress) (1,187) (1,222) (197) (3,010) (4,070) (656)
Add: Changes in loan receivables, net 3,428 4,738 764 8,367 11,076 1,785
Free cash flow 17,163 22,924 3,695 29,936 42,456 6,843

19
ALIBABA GROUP HOLDING LIMITED SELECTED OPERATING DATA
GMV
The table below sets forth the GMV transacted on our China retail marketplaces and mobile GMV as a percentage of GMV for the periods indicated:
Three months ended
Mar 31,
2013
Jun 30,
2013
Sep 30,
2013
Dec 31,
2013
Mar 31,
2014
Jun 30,
2014
Sep 30,
2014
Dec 31,
2014
(in billions of RMB except percentages)
GMV
Taobao Marketplace GMV 223 257 275 346 295 342 380 494
Tmall GMV 71 88 99 183 135 159 176 293
Total GMV 294 345 374 529 430 501 556 787
Mobile GMV (as a percentage of total
GMV) 11% 12% 15% 20% 27% 33% 36% 42%
Annual active buyers
The table below sets forth the number of active buyers on our China retail marketplaces for the periods indicated:
Twelve months ended
Mar 31,
2013
Jun 30,
2013
Sep 30,
2013
Dec 31,
2013
Mar 31,
2014
Jun 30,
2014
Sep 30,
2014
Dec 31,
2014
(in millions)
Annual active buyers 172 185 202 231 255 279 307 334
Mobile
The table below sets forth information with respect to mobile GMV, mobile revenue and mobile rates of monetization realized in respect of our China retail
marketplaces for the periods presented:
Three months ended
Mar 31,
2013
Jun 30,
2013
Sep 30,
2013
Dec 31,
2013
Mar 31,
2014
Jun 30,
2014
Sep 30,
2014
Dec 31,
2014
(in millions of RMB, except percentages)
China retail marketplaces:
GMV 294,184 345,134 373,659 528,709 430,085 500,916 555,666 787,047
Mobile GMV 31,507 41,299 54,823 104,391 118,001 164,428 199,054 326,889
as a percentage of GMV 11% 12% 15% 20% 27% 33% 36% 42%
Revenue 6,754 8,667 8,645 16,149 9,371 12,639 12,769 21,275
Mobile revenue 147 240 332 1,171 1,162 2,454 3,719 6,420 as a percentage of revenue 2% 3% 4% 7% 12% 19% 29% 30%
Monetization rate 2.30% 2.51% 2.31% 3.05% 2.18% 2.52% 2.30% 2.70% Mobile monetization rate 0.47% 0.58% 0.61% 1.12% 0.98% 1.49% 1.87% 1.96%