AMERICA’S BEHAVIORAL HEALTH€™S BEHAVIORAL HEALTH . ... had a substance use disorder in the...
12
2016 NSDUH REPORT AMERICA’S BEHAVIORAL HEALTH CHANGES & CHALLENGES WWW.SAMHSA.GOV/DATA
AMERICA’S BEHAVIORAL HEALTH€™S BEHAVIORAL HEALTH . ... had a substance use disorder in the pas\൴ year. About 1 in 3 \⠀㌀㜀 瀀攀爀挀 ... 2015. 2016. HEROIN PAST YEAR
2016 NSDUH REPORT AMERICA’S BEHAVIORAL HEALTH CHANGES & CHALLENGES WWW.SAMHSA.GOV/DATA
NATIONAL SURVEY ON DRUG USE AND HEALTH (NSDUH)
• 67,500 Americans make this survey possible every year. • We thank the participants who shared their time with surveyors
and who had the courage and honesty to share sensitive information to help shed light on these important issues.
Presenter
Presentation Notes
67,500 Americans step forward out of the shadows to share sensitive information regarding their behavioral health and create the data collected in SAMHSA’s National Survey on Drug Use and Health.
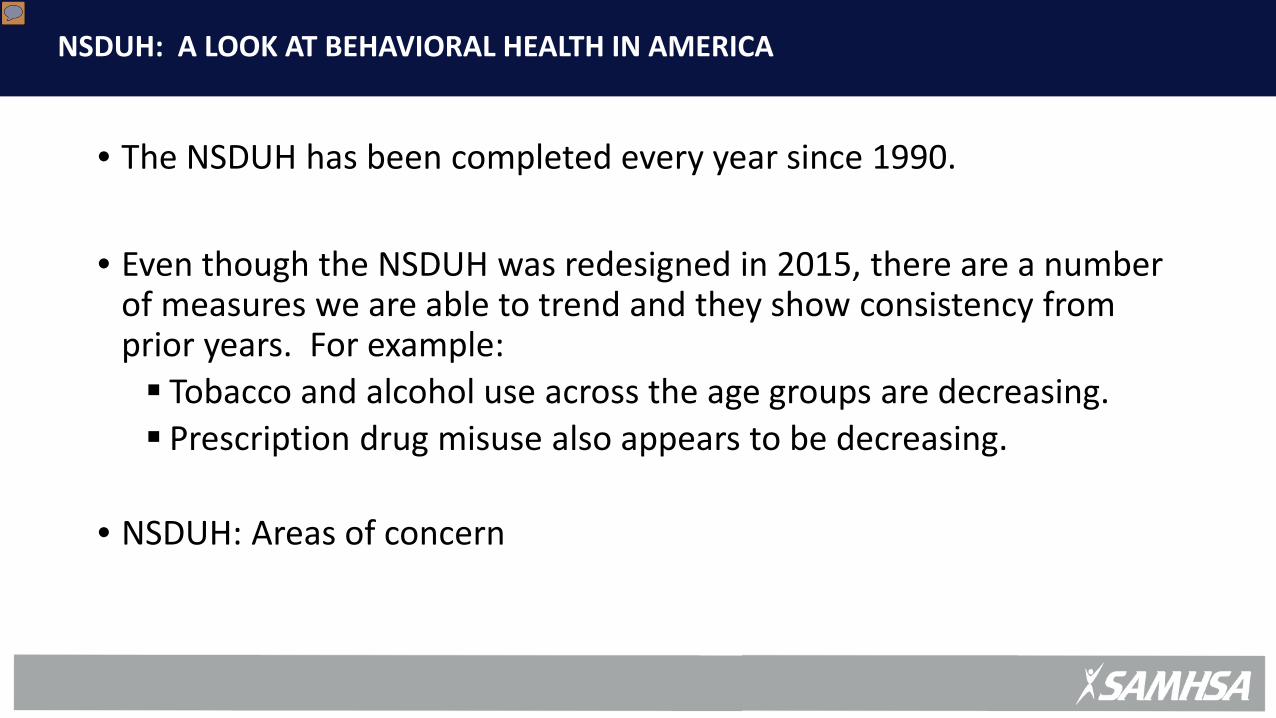
• The NSDUH has been completed every year since 1990. • Even though the NSDUH was redesigned in 2015, there are a number
of measures we are able to trend and they show consistency from prior years. For example: Tobacco and alcohol use across the age groups are decreasing. Prescription drug misuse also appears to be decreasing.
• NSDUH: Areas of concern
NSDUH: A LOOK AT BEHAVIORAL HEALTH IN AMERICA
Presenter
Presentation Notes
Trend data collected over previous years indicate some measures remain stable from year to year demonstrating consistency while others show increases and decreases. Among the decreases are: Rates of tobacco and alcohol use across age groups, and prescription drug misuse. Other measures have risen and denote areas of concern.
PAST YEAR, 2016, 12+
.2%
.3%
.4%
Among those with a substance use disorder about: • 1 IN 3 (37%) struggled with illicit drugs • 3 IN 4 (75%) struggled with alcohol use • 1 IN 9 (12%) struggled with illicit drugs and alcohol
7.5% (20.1 MILLION)
People aged 12 or older had a
substance use disorder
18.3% (44.7 MILLION)
People aged 18 or older had a
mental illness
3.4% (8.2 MILLION)
18+ HAD BOTH substance use disorder
and a mental illness
Among those with a mental illness about: • 1 IN 4 (23%) had a serious mental illness
No statistically different changes from 2015
MENTAL AND SUBSTANCE USE DISORDERS IN AMERICA: 2016
Presenter
Presentation Notes
In 2016, 7.5 percent of Americans aged 12 or older— approximately 20.1 million people— had a substance use disorder in the past year. About 1 in 3 (37 percent) struggled with illicit drug use; about 3 in 4 (75 percent) struggled with alcohol use; and about 1 in 9 (12 percent) had both an alcohol use disorder and an illicit drug use disorder. 18.3 percent of adults aged 18 or older had a mental illness in the past year which equates to approximately 44.7 million adults. About 1 in 4 – 23 percent – had a serious mental illness. And, 3.4 percent of adults aged 18 or older— 8.2 million adults— had both a substance use disorder and a mental illness in the past year.
PAST YEAR, 2016, 12+
.2%
.3%
.4% 20.1
MILLION People aged 12 or
older had a substance use disorder
0.4%
0.5%
0.6%
1.8%
1.9%
6.9%
13.9%
Heroin
Methamphetamines
Inhalants
Hallucinogens
Cocaine
Misuse of PsychotherapeuticRx Drugs
Marijuana
37.6 MILLION
18.7 MILLION
5.1 MILLION
4.9 MILLION
1.4 MILLION
1.7 MILLION
948,000
0% 2% 4% 8% 10% 12% 14% 12% 6%
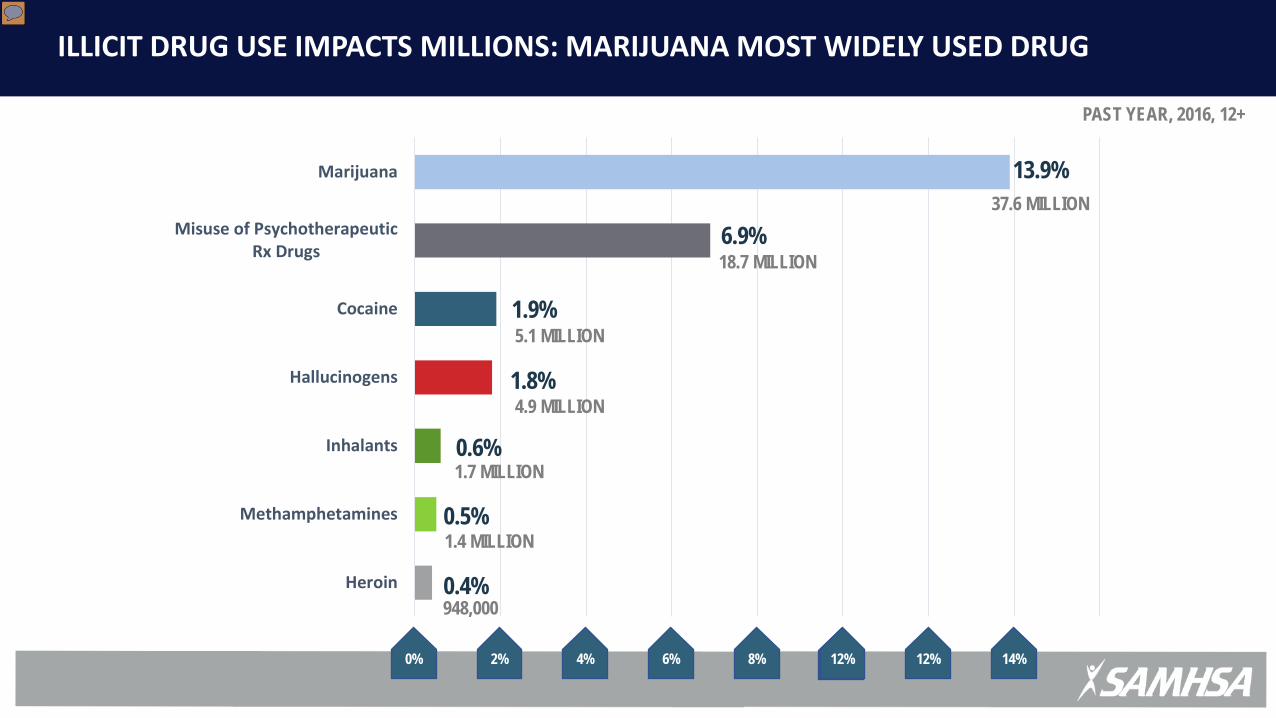
ILLICIT DRUG USE IMPACTS MILLIONS: MARIJUANA MOST WIDELY USED DRUG
Presenter
Presentation Notes
Marijuana remains the most widely used illicit drug accounting for 13.9 percent of the total U.S. population aged 12 or older or 37.6 million people. Prescription psychotherapeutics are the next most widely misused substance, with 6.9 percent of the total US population aged 12 or older or 18.7 million people. Prescription pain relievers – opioids – were the most commonly misused. Cocaine trails at 1.9 percent, followed by hallucinogens at 1.8 percent. Inhalants, methamphetamines and heroin use were less than one percent at .06, .05 and .04 percent respectively.
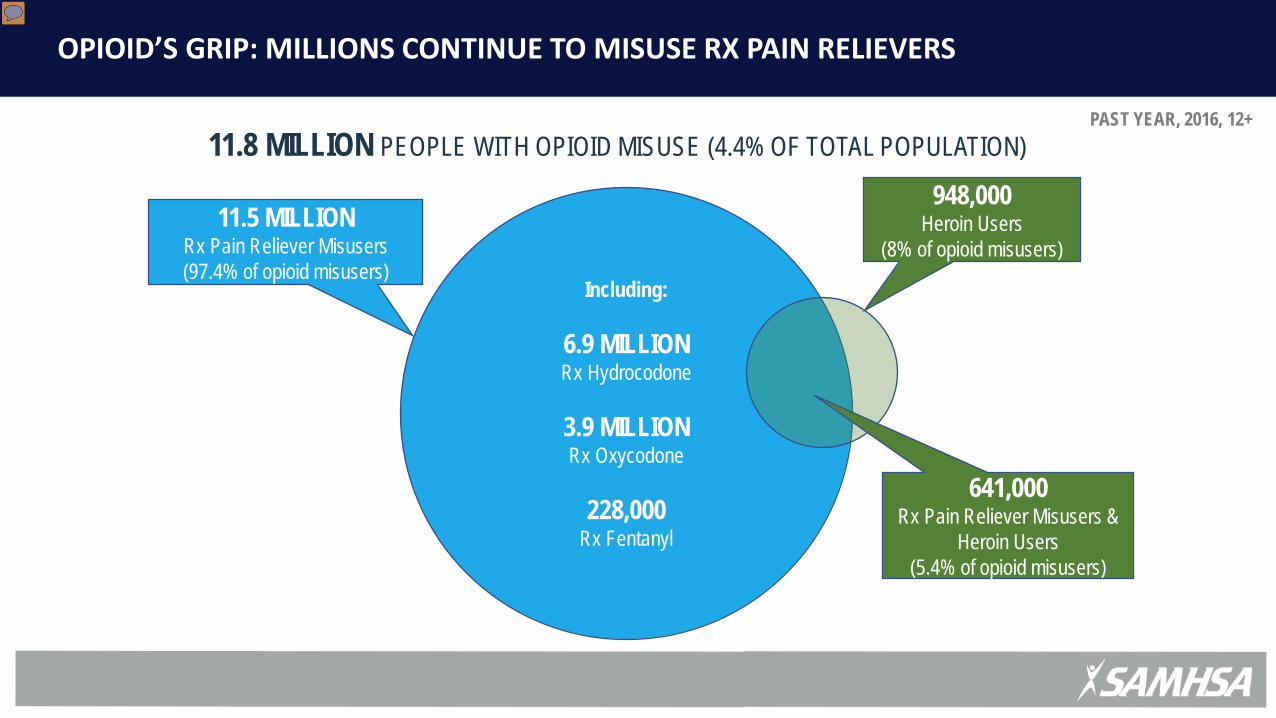
OPIOID’S GRIP: MILLIONS CONTINUE TO MISUSE RX PAIN RELIEVERS
11.8 MILLION PEOPLE WITH OPIOID MISUSE (4.4% OF TOTAL POPULATION)
Including:
6.9 MILLION Rx Hydrocodone
3.9 MILLION Rx Oxycodone
228,000
Rx Fentanyl
11.5 MILLION Rx Pain Reliever Misusers (97.4% of opioid misusers)
948,000 Heroin Users
(8% of opioid misusers)
641,000 Rx Pain Reliever Misusers &
Heroin Users (5.4% of opioid misusers)
PAST YEAR, 2016, 12+
Presenter
Presentation Notes
Opioid misuse has not loosened its grip – millions of Americans continue to misuse prescription pain relievers. There were approximately 11.8 million past year opioid misusers in 2016. This represents 4.4 percent of the total U.S. population aged 12 or older. Of the 11.8 million Americans who misused opioids in 2016, the vast majority – 11.5 million – or 97.4 percent misused prescription pain relievers. Prescription hydrocodone products, prescription oxycodone products and prescription fentanyl products were among the prescription pain relievers commonly misused by Americans. 948,000 Americans used heroin in 2016 totaling eight percent of opioid misusers. While 641,000 Americans misused both prescription pain relievers and used heroin – accounting for 5.4 percent of opioid misusers.
PAST YEAR NEWMISUSERS
PAST YEARMISUSERS
PAST YEARDISORDER
4.3%
PAST YEAR NEWUSERS
PAST YEAR USERS PAST YEARDISORDER
0.4%
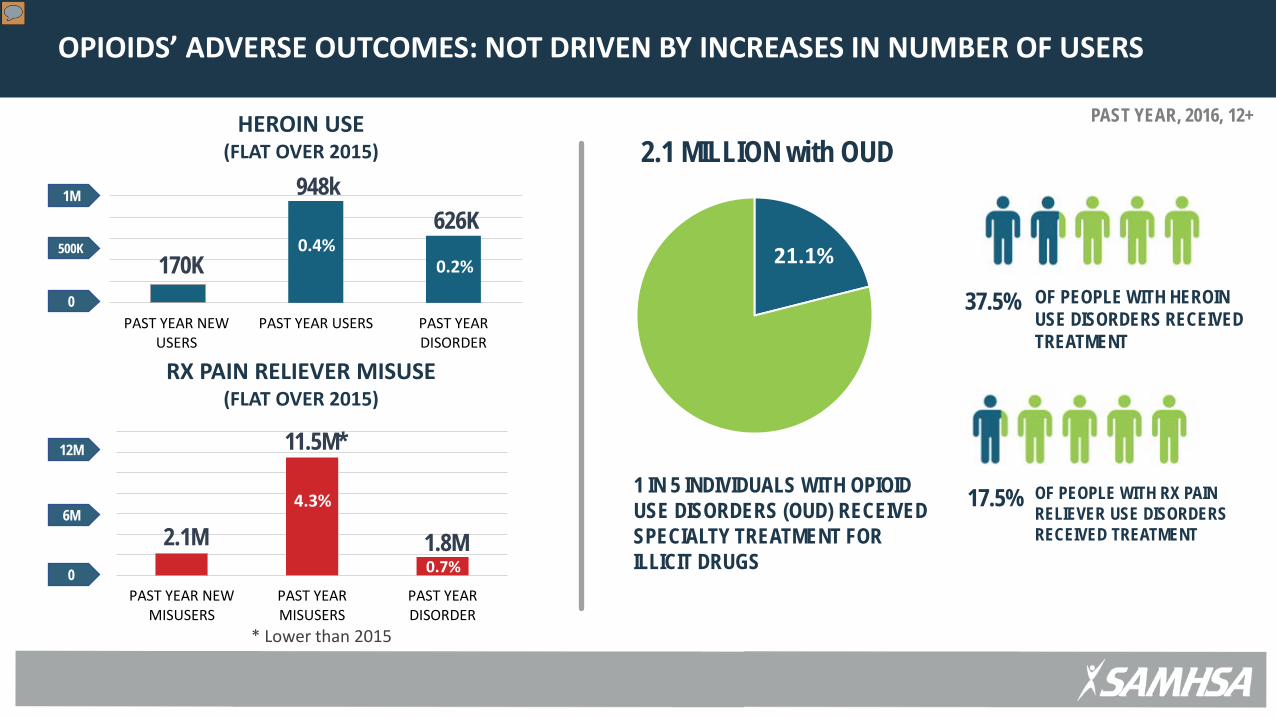
OPIOIDS’ ADVERSE OUTCOMES: NOT DRIVEN BY INCREASES IN NUMBER OF USERS
PAST YEAR, 2016, 12+
948k
0
1M
500K
0.2%
HEROIN USE (FLAT OVER 2015)
626K
11.5M*
1 IN 5 INDIVIDUALS WITH OPIOID USE DISORDERS (OUD) RECEIVED SPECIALTY TREATMENT FOR ILLICIT DRUGS
12M
0
12M
6M
0.7%
RX PAIN RELIEVER MISUSE (FLAT OVER 2015)
1.8M
OF PEOPLE WITH HEROIN USE DISORDERS RECEIVED TREATMENT
37.5%
OF PEOPLE WITH RX PAIN RELIEVER USE DISORDERS RECEIVED TREATMENT
17.5% 6M
0
1M
500K
0
170K
2.1M
21.1%
2.1 MILLION with OUD
* Lower than 2015
Presenter
Presentation Notes
The NSDUH is not indicating increases in new heroin users, numbers of past year heroin users, or an increase in the number of Americans with a past year heroin use disorder – there are no statistically different changes from 2015. The numbers of past year new prescription pain reliever misusers and the number of Americans with past year prescription pain reliever disorders have remained flat over 2015. In 2016, the number of past year prescription pain reliever misusers decreased by one million from 12.5 million in 2015 to 11.5 million in 2016. Of the 948,000 past year heroin users, 626,000 had a past year heroin use disorder in comparison to only 1.8 million of the 11.5 million past year prescription pain reliever misusers having a disorder. Under a quarter of those with an opioid use disorder (or 21.1 percent) received treatment for their illicit drug use at a specialty treatment facility in the past year. The rate of those receiving past year specialty treatment for a heroin use disorder again outpaces the rate of those receiving treatment for a prescription pain reliever disorder – 37.5 percent compared to 17.5 percent.
HEROIN DEATHS HAVE SKYROCKETED
404,000
828,000
2002 2015 2016
HEROIN PAST YEAR USE 948,000
300K
600K
900K
0
0.3%
0.2%
0.4%
The number of heroin users increased 2.35 fold (135%) The number of heroin deaths increased 6.33 fold (533%) Source: SAMHSA Source: CDC National Vital Statistics System (NCHS)
2,089
13,101 13,219
2002 2015 2016
HEROIN DEATHS
4K
8K
12k
0 *Estimated
*
Presenter
Presentation Notes
While past year heroin use has more than doubled since 2002, it has stabilized from 2015 to 2016. At the same time, the number of heroin deaths has grown from an estimated 2,089 deaths in 2002 to an estimated 13,219 deaths in 2016 according to data from the Centers for Disease Control and Prevention. From the period 2002 through 2016, the U.S. has witnessed a 2.35 fold (135 percent) increase in the number of heroin users while the nation has been jolted by a 6.33 fold (533 percent) increase in the number of deaths attributable to heroin.
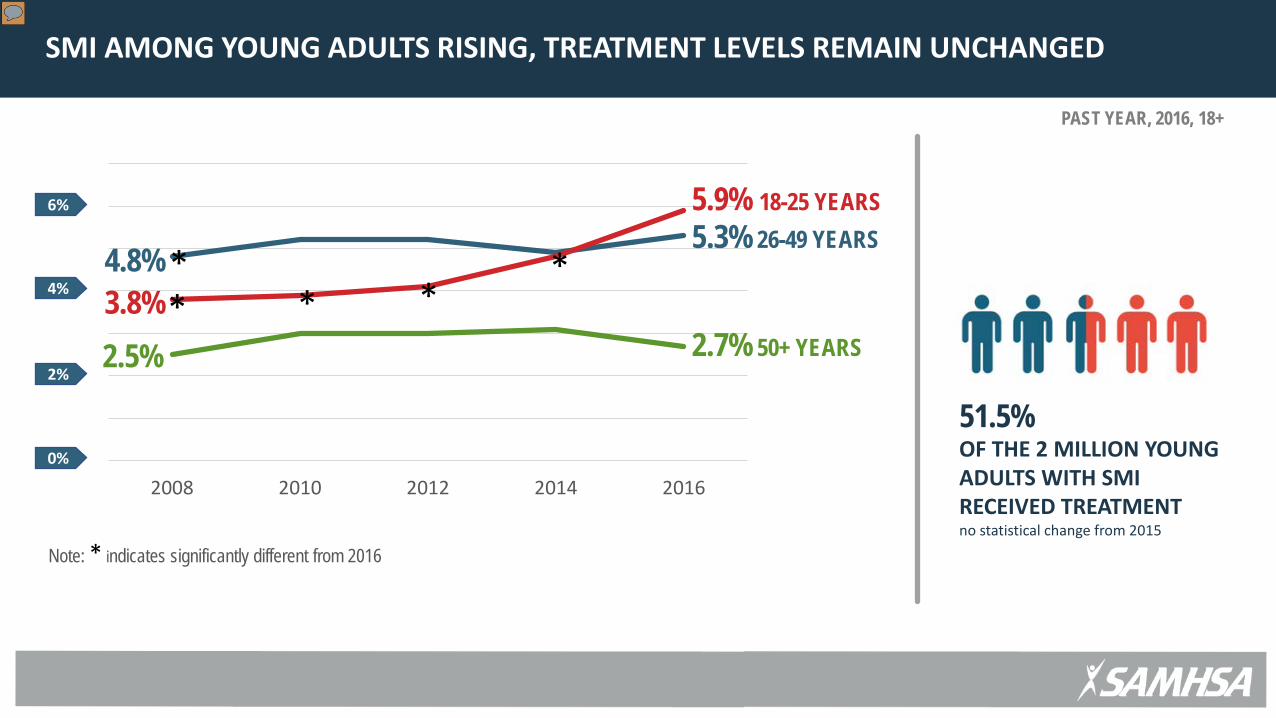
SMI AMONG YOUNG ADULTS RISING, TREATMENT LEVELS REMAIN UNCHANGED
PAST YEAR, 2016, 18+
.2%
.3%
.4%
2008 2010 2012 2014 2016
51.5% OF THE 2 MILLION YOUNG ADULTS WITH SMI RECEIVED TREATMENT no statistical change from 2015
5.9% 18-25 YEARS 5.3% 26-49 YEARS
2.7% 50+ YEARS 3.8% 4.8%
2.5%
0%
2%
6%
4%
* * * * *
Note: * indicates significantly different from 2016
Presenter
Presentation Notes
Since 2008, prevalence rates of SMI among young adults aged 18 to 25 has increased from 3.8 percent to 5.9 percent. 2016 was higher than estimates from all previous years. The rise in past year SMI since 2008 is unique to young adults and is not seen among adults aged 26 to 49 or adults aged 50 or older. 51.5 percent of these young adults who experienced SMI in the past year, received mental health services.
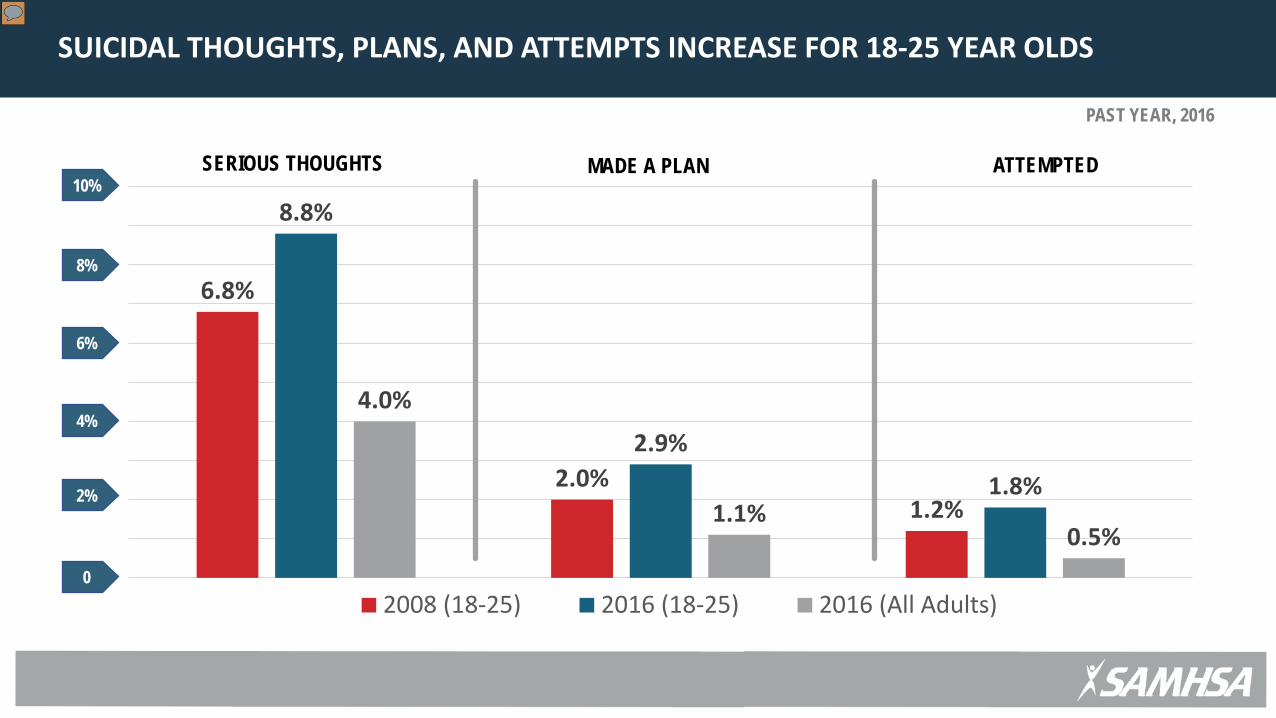
6.8%
2.0% 1.2%
8.8%
2.9%
1.8%
4.0%
1.1% 0.5%
2008 (18-25) 2016 (18-25) 2016 (All Adults)
SERIOUS THOUGHTS MADE A PLAN
SUICIDAL THOUGHTS, PLANS, AND ATTEMPTS INCREASE FOR 18-25 YEAR OLDS
ATTEMPTED
PAST YEAR, 2016
2%
0
4%
6%
10%
8%
Presenter
Presentation Notes
The percentages of the total adult population aged 18 or older with serious thoughts of suicide, who made a plan, or who have attempted suicide in the past year are typically about the same from year to year. However, estimates from 2015 and 2016 for young adults have been higher compared to each year 2008 to 2014 while it has remained stable for those aged 26-49 and 50 or older.
SUBSTANCE USEDISORDER (SUD), 12+
ANY MENTAL ILLNESS(AMI), 18+
SERIOUS MENTALILLNESS, 18+
CO-OCCURRING AMI &SUD, 18+
MAJOR DEPRESSIVEEPISODE, 12-17
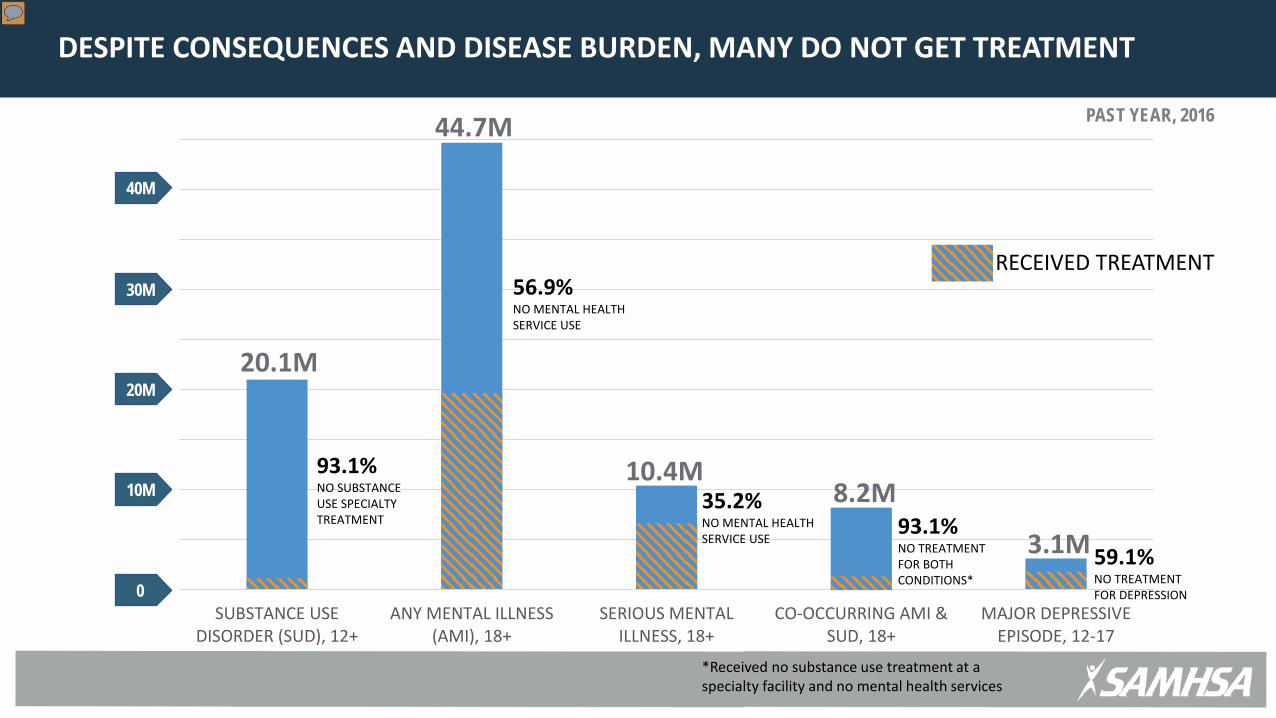
DESPITE CONSEQUENCES AND DISEASE BURDEN, MANY DO NOT GET TREATMENT
10M
0
20M
30M
40M
20.1M
44.7M
RECEIVED TREATMENT
93.1% NO SUBSTANCE USE SPECIALTY TREATMENT
56.9% NO MENTAL HEALTH SERVICE USE
35.2% NO MENTAL HEALTH SERVICE USE
93.1% NO TREATMENT FOR BOTH CONDITIONS*
59.1% NO TREATMENT FOR DEPRESSION
10.4M 8.2M
3.1M
PAST YEAR, 2016
*Received no substance use treatment at a specialty facility and no mental health services
Presenter
Presentation Notes
Only 6.9 percent of those aged 12 or older with past year SUD received treatment at a specialty treatment facility – leaving 93.1 percent of Americans without the specialty treatment they need. Only 43.1 percent of adults with AMI received mental health services – leaving close to 60 percent (56.9 percent) of Americans without the mental health services they need. 64.8 percent of adults aged 18 or older with SMI received treatment – leaving over 35 percent (35.2 percent) without needed mental health services. Only 6.9 percent of adults with co-occurring AMI and SUD received both substance use treatment at a specialty facility and mental health services. However, 48.1 percent of adults with co-occurring AMI and SUD received some kind of treatment – either substance use treatment at a specialty facility or mental health services. Among the 3.1 million adolescents aged 12 to 17 who had a past year MDE, less than half received treatment for depression.