Embed Size (px)
Citation preview
AN ECONOMIC ANALYSIS OF BROWNFIELD MIGRATION: COAX TO THE HOME (CTTH) VS. FIBER TO THE HOME (FTTH)
AUTHOR: MICHAEL EMMENDORFER

Copyright 2016 – ARRIS Enterprises Inc. All rights reserved. 2
TABLE OF CONTENTS ABSTRACT ....................................................................................................... 3 OVERVIEW ...................................................................................................... 3 DATA CAPACITY COMPARISONS ...................................................................... 5 GREENFIELD VS. BROWNFIELD ...................................................................... 6 NETWORK MIGRATIONS METHODS FOR CABLE BROWNFIELD ...................... 7 NETWORK BUILD APPROACHES FOR CABLE BROWNFIELD ............................ 9 BROWNFIELD MIGRATION USE CASES ......................................................... 11 SYSTEM WIDE USE CASES FOR BROWNFIELD MIGRATION ........................... 13 SUCCESS BASED USE CASES FOR BROWNFIELD MIGRATION ....................... 23 BROWNFIELD USE CASES SUMMARIES ........................................................ 27 CONCLUSIONS .............................................................................................. 31 RECOMMENDATIONS ................................................................................... 32 Questions: What are the Economics of CTTH & FTTH brownfield migration options to support: ........................................................................................................................ 33
DISCLAIMER ................................................................................................. 34 ACKNOWLEDGEMENTS ................................................................................ 34 RELATED READINGS ...................................................................................... 35
Copyright 2016 – ARRIS Enterprises Inc. All rights reserved. 3
ABSTRACT Cable service providers are interested in the network technology options and the economics to meet the highly competitive high-‐speed data and video delivery market needs. Many cable operators are facing fiber to the home (FTTH) competitors that are offering or capable of offering gigabit per second data services or higher. Many cable operators have determined that new build or greenfield areas, where coax to the home (CTTH) does not exist, will use FTTH. The majority of the cable network is brownfield, which already has Hybrid Fiber Coax (HFC) to the neighborhood and CTTH. Throughout the cable industry there is interest in understanding the options for the brownfield migration. Cable operators are wondering if they should continue investments in HFC and DOCSIS or forego the current brownfield coaxial network and build FTTH using passive optical network (PON) technologies.
This paper focuses on some of the network technologies choices and the economics of the brownfield migration. The paper expands the analysis that was published at the 2015 SCTE Cable Tech EXPO, which examined brownfield migration options for a specific set of network topology assumptions [EMM]. The SCTE paper examined systems that had high spectrum (750 MHz or higher), 75 homes per mile and one hundred percent aerial network topologies, though this is representative of some MSO deployments, like those found in suburban areas, there are many cable operators that have different network topologies. This paper addresses different brownfield migration networks like those found in urban areas. In urban areas for example, the cable operator will likely have much higher homes per mile, such as over 100 homes per mile, and have a mix of aerial and underground networks, these change the economics. The impacts of urban brownfield migrations may yield far different results than those found in typical suburban topologies. Typically, the approaches examined from brownfield migration are system wide build outs meaning that all customers in the serving area may have access to the upper tier services and capacity needs for the business. The paper will analyze another build out approach, called success based network builds. The success based approach does not build out high capacity networks across the entire serving area like the system wide approach, but rather is a targeted success based network build for addressing the competitive challenge of gigabit or multi-‐gigabit symmetrical service offering to residential consumers.
OVERVIEW The 2015 SCTE companion paper is not an apple-‐to-‐apple comparison to this paper for the reason cited in the section above where the SCTE paper used 75 homes per mile and this paper uses 114 homes per mile. The 2015 SCTE paper assumes 14.1 miles of total plant in the 1060 HHP serving area and this paper assumed 8.4 miles of total plant in a
Copyright 2016 – ARRIS Enterprises Inc. All rights reserved. 4
960 HHP serving area, the difference in total miles and not much difference in total HHP serving area is because the variance in the HHP per mile between the markets. The SCTE paper may represent a suburban market and this paper may align with urban environments. The presumed reduction in costs for a market that has greater HHP density, fewer network elements, fewer plant miles, while maintaining a similar sized serving area should translate to lower costs if labor rates are the same. Though another difference between the SCTE paper and this paper is the aerial versus underground plant. The SCTE paper used 100% aerial, which is far cheaper to build out than underground plant. This was selected in an effort to show that even under the most ideal environments for overlaying plant, especially for FTTH builds, the cost comparison between leveraging existing plant versus overbuilding new plant is vast. This paper assumes a 73% aerial / 27% underground mix, this could see higher costs if all the variables were the same against 100% aerial plant. This paper also assumes newer constructions and slicing techniques than the SCTE paper. Overall we observed marginal savings when considering the two outside plant builds. The DOCSIS capacity in the 2015 SCTE paper assumed 64 DOCSIS downstream channel equivalents for 2.4 Gbps of capacity and this paper used 48 channels, both papers continued to use the price per channel of $399.00, which is based on the Infonetics report from Q4/2014. The actual price per channel an MSO may pay could be less when assuming the licensing channel capacity for existing systems or perhaps even new systems. The papers are not meant to be an apples-‐to-‐apples comparison of suburban versus urban build out, because not all factors are consistent between both market samples.
The analyses are meant to show that under similar network assumptions we can illustrate relative difference for a particular set of use case migration options and should be used for discussion purposes only. All economic estimates may not represent actual build and equipment costs. The estimates expressed in this material are subject to change without notice. Reasonable people may disagree about the opinions expressed in our analysis and results. There are many other factors that were not considered that may impact the estimates and illustrate a significantly different result. It is strongly recommended that individuals and companies perform their own analysis based on their environment and costs.
Purpose of the Analysis
Should MSOs continue with HFC/DOCSIS investment?
Should MSOs overlay the existing HFC network with FTTH and PON?
What are the economics both from a financial and capacity perspective?
What are the Economics of CTTH & FTTH brownfield migration options to support:
• 1 Gbps downstream service to be available to 100% of the HHP in brownfield networks?

Copyright 2016 – ARRIS Enterprises Inc. All rights reserved. 5
• 1 Gbps symmetrical service to be available to 100% of the HHP in brownfield networks?
• 1 Gbps symmetrical service to be available to 30-‐50% of the HHP in brownfield networks?
Scope of the Analysis
• Leverage existing brownfield investments
• Brownfield Capital Assessment from the headend, outside plant, and CPE
• Brownfield Migration of CTTH vs. FTTH in the single family unit (SFU) market
• Consider the service drivers of video and data services as well as the typical take rates
The scope of this paper is to provide an economic and capability analysis of several brownfield single-‐family unit (SFU) brownfield migration options, thus greenfield and multiple dwelling units are out of scope for this analysis. The analysis considers several HFC and DOCSIS migrations and several 10G EPON deployment architectures depending on the topology constraints of the MSO. The paper will summarize the economics and capabilities of several brownfield CTTH and FTTH migration options. We will conclude with summary and a set of recommendations.
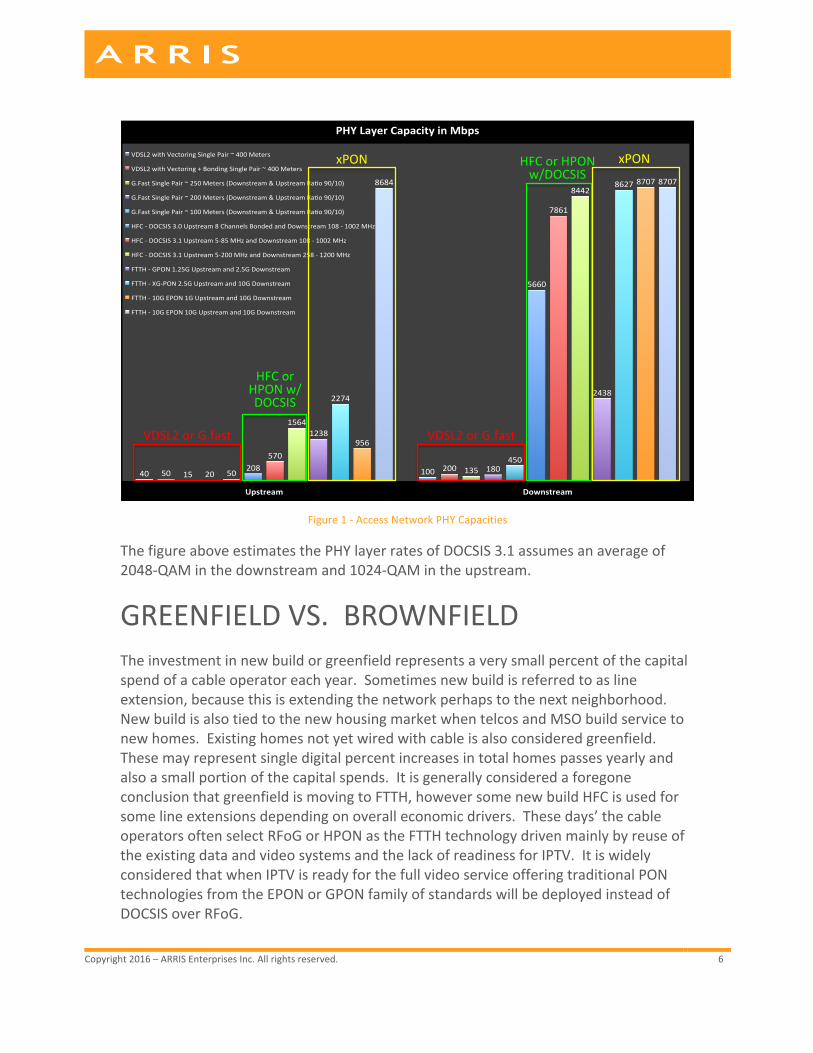
DATA CAPACITY COMPARISONS In terms of the data capacity capabilities there can be vast differences depending on the media and technology evolution. Currently there is work underway in all the technology areas to expand the capacity over each media, copper, coax, and fiber. There are also different access architectures underway to maximize the reach and capacity as well. Please consider the image below a snapshot in time and under a given set of assumptions of the capacities of different technologies. The figure below provides a comparison from the current leading technologies, as with most technologies. These estimates account for physical layer (PHY layer) overheads after encoding and forward error correction (FEC) overhead if used and no other overhead is assumed.
Copyright 2016 – ARRIS Enterprises Inc. All rights reserved. 6
Figure 1 -‐ Access Network PHY Capacities
The figure above estimates the PHY layer rates of DOCSIS 3.1 assumes an average of 2048-‐QAM in the downstream and 1024-‐QAM in the upstream.
GREENFIELD VS. BROWNFIELD The investment in new build or greenfield represents a very small percent of the capital spend of a cable operator each year. Sometimes new build is referred to as line extension, because this is extending the network perhaps to the next neighborhood. New build is also tied to the new housing market when telcos and MSO build service to new homes. Existing homes not yet wired with cable is also considered greenfield. These may represent single digital percent increases in total homes passes yearly and also a small portion of the capital spends. It is generally considered a foregone conclusion that greenfield is moving to FTTH, however some new build HFC is used for some line extensions depending on overall economic drivers. These days’ the cable operators often select RFoG or HPON as the FTTH technology driven mainly by reuse of the existing data and video systems and the lack of readiness for IPTV. It is widely considered that when IPTV is ready for the full video service offering traditional PON technologies from the EPON or GPON family of standards will be deployed instead of DOCSIS over RFoG.
40# 100#50# 200#15# 135#20# 180#50#
450#208#
5660#
570#
7861#
1564#
8442#
1238#
2438#2274#
8627#
956#
8707#8684# 8707#
Upstream) Downstream)
PHY)Layer)Capacity)in)Mbps)
VDSL2#with#Vectoring#Single#Pair#~#400#Meters#
VDSL2#with#Vectoring#+#Bonding#Single#Pair#~#400#Meters#
G.Fast#Single#Pair#~#250#Meters#(Downstream#&#Upstream#RaLo#90/10)#
G.Fast#Single#Pair#~#200#Meters#(Downstream#&#Upstream#RaLo#90/10)#
G.Fast#Single#Pair#~#100#Meters#(Downstream#&#Upstream#RaLo#90/10)#
HFC#Q#DOCSIS#3.0#Upstream#8#Channels#Bonded#and#Downstream#108#Q#1002#MHz#
HFC#Q#DOCSIS#3.1#Upstream#5Q85#MHz#and#Downstream#108#Q#1002#MHz#
HFC#Q#DOCSIS#3.1#Upstream#5Q200#MHz#and#Downstream#258#Q#1200#MHz#
FTTH#Q#GPON#1.25G#Upstream#and#2.5G#Downstream#
FTTH#Q#XGQPON#2.5G#Upstream#and#10G#Downstream#
FTTH#Q#10G#EPON#1G#Upstream#and#10G#Downstream#
FTTH#Q#10G#EPON#10G#Upstream#and#10G#Downstream#
VDSL2orG.fastVDSL2orG.fast
HFCorHPONw/DOCSIS
HFCorHPONw/DOCSIS
xPONxPON
Copyright 2016 – ARRIS Enterprises Inc. All rights reserved. 7
The largest network investments are directed to sustain and expand the capacity of the existing brownfield network. Most cable operators are leveraging their existing coax to the home (CTTH) network rather than overbuilding FTTH in the single-‐family unit (SFU) market. In highly competitive SFU markets some MSOs have built fiber to the home. The brownfield overbuild is mainly targeted at the highly competitive multiple dwelling units (MDUs) market, generally driven by the MDU property owner’s desire to market Fiber to the Unit (FTTU). So MSOs overbuilding existing HFC in the SFU market are extremely rare. Most telcos worldwide want to leverage their existing copper network.
Many telcos worldwide are continuing to invest in their brownfield copper network rather than building FTTH. They expand capacity in the twisted pair copper network by pushing fiber closer to the subscriber, which enables higher data rates to each subscriber. Some telephone operators decided to overbuild their existing copper network with fiber to the home, due to concerns over the capacity of the twisted pair network (refer to figure 1) supporting high bit rate video and very high speed internet service tiers. The telcos overbuilding their existing copper networks may have selected GPON technology capable of more than 2 Gbps downstream and 1 Gbps upstream, as seen in Figure 1. The evolution of GPON includes NG-‐PON2 with capabilities of 10 Gbps symmetrical (not accounting for PHY overheads) and this may co-‐exist with GPON on the same fiber separated by wavelength. The build out of FTTH by some telcos and overbuilders created competitive pressures for the MSOs. Some MSOs are wondering if continued investment in brownfield markets with DOCSIS and HFC is the best path or should they too overbuild their network with fiber to the home. The situation is certainly not the same for the telco with copper twisted pair faced with the capacities of cable competitor with fiber to the neighborhood and coaxial cable to the home. The capacities are very different between twisted pair and coax as seen in figure 1 and explored in detail in the companion paper [EMM].
NETWORK MIGRATIONS METHODS FOR CABLE BROWNFIELD There are many different methods used to create capacity in the cable networks. Network optimization is a very popular approach because this allows the operator to place more capacity in the same amount of spectrum. Reducing the amount of customers sharing a data link also creates more capacity. Essentially this is just building another highway, and splitting the traffic, node splits, node segmentation, and fiber deep all reduce the number of subscribers sharing the link. Some methods increase the size of the data link by replacing network equipment to expand spectrum, called a system upgrade and in some cases moving to fiber deep is an opportunity to expand spectrum. Another approach is to overbuild the network with FTTH to increase

Copyright 2016 – ARRIS Enterprises Inc. All rights reserved. 8
capacity, as seen in the following sections this is very costly. The list below captures the network migration options for cable brownfield.
• Network Optimization
o Improve the efficiency of the network (encoding and more b/s/Hz)
o Spectrum Reclamation to better network delivery technology Analog ! Digital ! IP/DOCSIS
• Node Splits / Segmentation “Business as Usual (BAU)
o Maintain existing spectrum
o Targeted Node Splits (smaller service groups to address capacity)
• System Upgrade
o Spectrum Expansion (perhaps different spectrum split)
o “Drop in Upgrade”
o Maintains node and amplifier spacing
o Approach typically good for an extra 200-‐250 MHz of spectrum from the originally designed system
o “Rebalancing System Upgrade” new node and amplifier location and change in direction signals travel is possible
• Fiber Deep
o Places fiber close enough to the customer often to remove all amplifiers in order to reduces the number of actives
o Removing amplifiers drivers households passed per node way down (125 -‐ 30 HHP per node)
o May include spectrum expansion and perhaps spectrum split change
• Fiber to the Home/Unit Overbuild
o System Wide Network Build to FTTH/U
o Success Based Network Build to FTTH/U

Copyright 2016 – ARRIS Enterprises Inc. All rights reserved. 9
NETWORK BUILD APPROACHES FOR CABLE BROWNFIELD There are two types of network build outs examined in this paper, the first is known as system wide and the second is known as success based builds. The system wide approach is used for greenfield builds and may also be used from brownfield overbuilds.
This method builds out the network from the facility, headend or central office, to the curb or backyard of possible subscribers, perhaps within 150 feet of the home; this portion of the carrier build out is called enablement capital. The carrier is making a massive investment upfront in placing the network so close to the home that may not ever become a customer. The carrier makes this upfront enablement capital investment in the belief that a suitable number of homes will become customers. Additionally, having the network very close to the home will reduce the initial service installation times, to perhaps a day.
The paper also analyzes success based network builds. The success-‐based approach does not build out the network to pass all the homes but rather to actual customers. The success-‐based approach has been used to overlay an existing HFC network for the support of commercial services applications for nearly two decades. This is used when the HFC may not be able to sustain or economically justify the capacity allocation for a particular service, which may also have just a few customers. Though many commercial customers are supported on the HFC and DOCSIS network, when service speed tiers exceed the current capacity allocation of HFC/DOCSIS the MSO then builds fiber directly to those commercial customers, using a success based build approach. The success based network build can addresses the competitive challenge of gigabit or multi-‐gigabit symmetrical service offering to residential consumers. In an effort for MSOs to maintain a leadership position in the residential speed tier wars, some MSOs have adopted this approach for the residential customers. This paper examines both the system wide based and success based network build approaches. The figures below illustrate both the system wide based builds and the success base builds, highlighting some the characteristics of each.
Copyright 2016 – ARRIS Enterprises Inc. All rights reserved. 10
Figure 2 -‐ System Wide Based Approach
System Wide Based Approach
• Proactive investment that is not targeted to any single customer
• New Build, Rebuild, or Upgrade that happen across a wide serving area
• Generally is assumed to be service that will have good take rate
• System wide approaches places the network to within 150 feet of all homes in the serving area
• Connecting an actual customer requires a drop installation for the remaining 150 feet to the home
• Service Turn up can be same day
Figure 3 -‐ Success Based “Targeted Capital” Approach
Success Based “Targeted Capital” Approach
• Reactive investment that is targeted to a single customer
• Network Build happens when a customer signs up for the service
• Success Based Capital often defines limit to the build from the “existing” fiber location
EnablementCapital SuccessCapital
fiberNewFiberDropatInstallfiber
Headend
10GEPONOLT
OutsidePlantFacility Subscriber
fiberEPONGW
Fiber
10GEPONExtenderAggregaFon
fiber fiber
Headend
10GEPONOLT
OutsidePlantFacility Subscriber
fiber
Exis6ng(HFC)Node
FiberLoca6on
EPONGWFiber
Buildhappensonlywhenacustomersignsupfortheservice
SuccessCapitalSuccessCapital
10GEPONExtenderAggrega6on
NewNetworkBuild

Copyright 2016 – ARRIS Enterprises Inc. All rights reserved. 11
• Cost effective reachability depends on many factors (Aerial, Underground, other build cost impacts)
• Success Based approaches often requires very long service turn up window (plan, build, install, etc.)
• Service Turn up can be weeks to over a month
• Approach used for Business Services (Network Builds are targeted to a customer)
• Approach used by some MSOs to offer the very highest residential service tiers
• Some MSOs may have a HHP Serviceable range of 30% to 50% within 1/3 of a mile of a node, depending node location and the number of HHP per mile.
BROWNFIELD MIGRATION USE CASES The analysis is a capital expenditure estimates and no operational costs have been included in this analysis. The capital estimates will assume leveraging the existing fiber to the node and HFC where applicable. This paper focuses completely on the existing “brownfield” network migration options for single family units (SFUs) “homes” and the only the access network build from the CCAP or OLT in the headend, outside plant to the customer premise equipment (CPE). The economics of the multiple dwelling Unit (MDU) market is very different than the SFU market. Competition in the MDU market may drive the business to replace coax to the unit (CTTU) with Fiber to the Unit (FTTU) and the costs are extremely different as well as the business relationships with the MDU owners and end users. The new build “Greenfield” is not the focus of this material but some data comparisons could be leveraged from this material to illustrate cost differences.
This paper will examine five use cases for using the system wide build approach and three use cases using the success based build approach.
System Wide Approach
1. HFC 2G DOCSIS
2. HFC 2G x 200M DOCSIS
3. HFC Mid-‐split 2G x 500M DOCSIS
4. FTTH 10G EPON
5. FTTH 10G EPON + PON Extender
Copyright 2016 – ARRIS Enterprises Inc. All rights reserved. 12
Success Based “Targeted Capital” Approach
1. FTTH 10G EPON
2. FTTH 10G EPON + PON Extender
3. FTTH 1G/10G P2P Ethernet
Key Assumptions:
• Please read the disclaimer regarding the analysis
• The use cases examine a single area with the following characteristics:
• Total plant (miles): 8.4
• Total serving Area: 960 HHP
• Subscriber Penetration (% of HHP): 50%
• HFC optical serving area: 480 HHP or 240 HHP
• DOCSIS Service Group: 2 at 480 HHP with 240 Subs (use case 1 and 2)
• DOCSIS Service Group: 4 at 240 HHP with 120 subs (use case 3)
• 10G EPON Service Group: 8 at 120 HHP with 60 Subs (use case 4)
• 10G EPON PON Extender SG: 4 at 240 HHP with 120 subs (use case 5)
• Homes per mile: 114
• Aerial / Underground: 73% / 27%
The use cases requiring DOCSIS capacity assume 48 DOCSIS downstream channel equivalents for 2.0 Gbps of capacity and the SCTE 2015 paper used 64 channels, both papers continued to use the price per channel of $399.00, which is based on the Infonetics Q4/2014. The Infonetics price may not represent the actual price per channel an MSO may pay for a 48 downstream and mid-‐split upstream fully loaded system. The DOCSIS use cases 1, 2 and 3 all assumed that 48 downstream channel equivalents include support for mid-‐split upstream. The 48 downstream channels are purchased for each DOCSIS Service Group. Use Cases 1 and 2 cannot utilize the mid-‐split spectrum, but both use cases assumes this is part of the 48 channel downstream purchase. Certainly some MSOs would explore ways of purchasing the upstream capacity that was needed since these DOCSIS use cases have different upstream DOCSIS needs.
This paper added more labor costs for the CPE installation due to the time for the wireless service activation. The 2015 SCTE paper and this paper are not meant to be an
Copyright 2016 – ARRIS Enterprises Inc. All rights reserved. 13
apples-‐to-‐apples comparison of suburban versus urban build out, because not all factors are consistent between both market samples as mentioned in the overview section. This is intended to show a comparison of each use cases against each other in a particular serving area.
SYSTEM WIDE USE CASES FOR BROWNFIELD MIGRATION The system wide use cases enable the services to be available to 100% percent of the homes passed and the paper assumes a 50% take rate of the data service. The 50% take rate primarily applies to PON because optical budget and a certain threshold of users per port drive the OLT sizing. The enablement capital for the PON used cases we used the estimated 50% subscriber take rate. The DOCSIS CCAP sizing on the other hand can support many subscribers per port and cable operators manage the number of subscribers per port based on traffic load and service tiers supported. The use cases state the DOCSIS service group HHP served. In the use cases, the success capital is based on a per subscriber basis. An important point to understand about the models is that the enablement capital is shown on a per HHP basis and the success capital is shown on a per customer basis, this is a very important distinction.
The brownfield HFC and DOCSIS use cases, 1 through 3, provide the estimated enablement capital to allow the service to be available to all homes in the service area. The cable operator would not need to consider the replacement of all of the cable modems, but rather just the for their estimated take rate of the 1 Gbps service. The success capital number includes estimates equipment and labor for DOCSIS 1 Gbps downstream and several upstream speeds. Additionally, the DOCSIS use cases 1 and 2 assumes that 48 six MHz channels are available and did not allocate capital to opening up spectrum if all 48 channels were not available. The HFC and DOCSIS use case 3 assumes 48 six MHz channels of DOCSIS capacity.
However, this did assume a spectrum expansion from 750 MHz to 1 GHz, thus creating 250 MHz of new spectrum that presumably is used to support DOCSIS service. The use case also assumed a node split since a portion of the downstream would be consumed for the mode to mid-‐split. In the sample 480 HHP were sharing a downstream spectrum range of 54 MHz -‐750 MHz and the enablement investment 240 HHP were sharing a downstream spectrum range of 108 MHz -‐1002 MHz. This use case was an effort to show a path of finding room for the 48 six MHz channels of DOCSIS capacity needed for the service.
The PON use cases assume that the HFC network remains in service even though the fiber is built to within 150 feet of every home. We assume the HFC network remains in service as part of a transition strategy. The system wide build out approach for PON

Copyright 2016 – ARRIS Enterprises Inc. All rights reserved. 14
illustrates the enablement capital to offer 5 Gbps or higher symmetrical services across the entire market. The OLTs and PON extenders were sized for 50% penetration as part of the enablement capital. The success capital includes the 10G EPON symmetrical equipment, drop builds, and labor. The existing HFC network and set-‐top boxes provide the video services for the 10G EPON customers as well. None of the models included the capital for the transition to IPTV.
Use Case 1: HFC 2G DOCSIS
Summary of Use Case 1:
• Existing HFC and Spectrum Split
• Total serving Area: 960 HHP
• HFC optical serving area: 480 HHP
• DOCSIS Service Group: 480 HHP
• DOCSIS Downstream: 32 D3.0 + 96 MHz OFDM
• DOCSIS Upstream: 4 ATDMA
• DOCSIS Cost:
o Assume 48 Downstream DOCSIS channels equivalents and 5-‐80 MHz of SC-‐QAM and OFDMA upstream are assumed using the Infonetics report from Q4/2014 price per channel rate of $399.00
• Service Tier Support
o 1 Gbps Downstream Service Tier Supported
o 1 Gbps Upstream Service Tier (not possible for this use case)
o 40 Mbps Upstream Service Tier Supported
Figure 4 -‐ Use Case 1: HFC 2G DOCSIS
$40EnablementCapitalPerHouseholdsPassed $235SuccessCapital
fiber coax
HybridFiberCoax(HFC)Node
HFCAmplifiersandPassives
CoaxDrop
Telephone
fiber
Headend
coax
DOCSISCMTS
OpKcalTransport
coax
OutsidePlantFacility Subscriber
BrownfieldassumesexisKngvideodeliverynetworkused
EMTAGW
EmbeddedMulKmediaTerminalAdapter(EMTA)&Gateway(GW)BrownfieldAssumesLeveragingExisKngDigitalCableSTB
DOCSIS3.032x8
Copyright 2016 – ARRIS Enterprises Inc. All rights reserved. 15
Enablement Capital (Cost to Pass a Home)
• Capital Components
o Assumes existing HFC network, spectrum split, and 480 HHP node
o Assumed preexisting: fiber optical cable and coaxial cable costs, HFC nodes, coax amplifiers, coax passives, connectors
o Assumes no existing CCAP chassis
o The price per channel rate of $399.00, which is based on the Infonetics report from Q4/2014.
o The actual price per channel an MSO may pay could be less when assuming all of the licensing channel capacity is activated.
o Fully Load Chassis is added configured with D3.0/3.1 CCAP with 32 SC QAM + 96 MHz D3.1 (equivalent to 48 Channels)
o It is assumed that the $399.00 Infonetics price assumed a fully loaded chassis and the channel pricing included a mid-‐split capable upstream configurations
o Assumes 5-‐42 spectrum
o Use of Four DOCSIS 3.0 upstream
o DOCSIS 3.1 OFDMA upstream is not assumed
• Variables Impacting Capital
o Enabling all channels per port and move to D3.1 will likely see lower price per channel & megabit
o Excellent cost per sub
o Leveraging existing outside plant and spectrum thus there are no variables to consider on the OSP.
Success Capital (Cost to Connect a Home)
• Capital Components
o $0 drop cable / labor (assumed existing)
o $0 digital cable STB assumed 3 per home (assumed existing)
o $0 cable modem for non 1 Gbps subs (assumed existing)
Copyright 2016 – ARRIS Enterprises Inc. All rights reserved. 16
o $235 Includes cost for 1 Gbps cable modem residential gateway and installation labor
• Variables Impacting Capital
o CPE equipment type, selection & costs
o Amplifier equipment needs
o Variable installation time and labor rates
Use Case 2: HFC 2G x 200M DOCSIS
Summary of Use Case 2:
• Existing HFC and Spectrum Split
• Total serving Area: 960 HHP
• HFC optical serving area: 480 HHP
• DOCSIS Service Group: 480 HHP
• DOCSIS Downstream: 32 D3.0 + 96 MHz OFDM
• DOCSIS Cost:
o Assume 48 Downstream DOCSIS channels equivalents and 5-‐80 MHz of SC-‐QAM and OFDMA upstream are assumed using the Infonetics report from Q4/2014 price per channel rate of $399.00
• Service Tier Support
o 1 Gbps Downstream Service Tier Supported
o 1 Gbps Upstream Service Tier (not possible for this use case)
Key Differences for Use Case 1:
• DOCSIS Upstream: 4 ATDMA and 5-‐42 MHz OFDMA
• Use of DOCSIS 3.0 and DOCSIS 3.1 upstream is assumed
• Frequency or Time and Frequency Multiplexing (TaFDM) is assumed
• Full 5-‐42 MHz upstream spectrum may be used
• 100 Mbps Upstream Service Tier Supported
Copyright 2016 – ARRIS Enterprises Inc. All rights reserved. 17
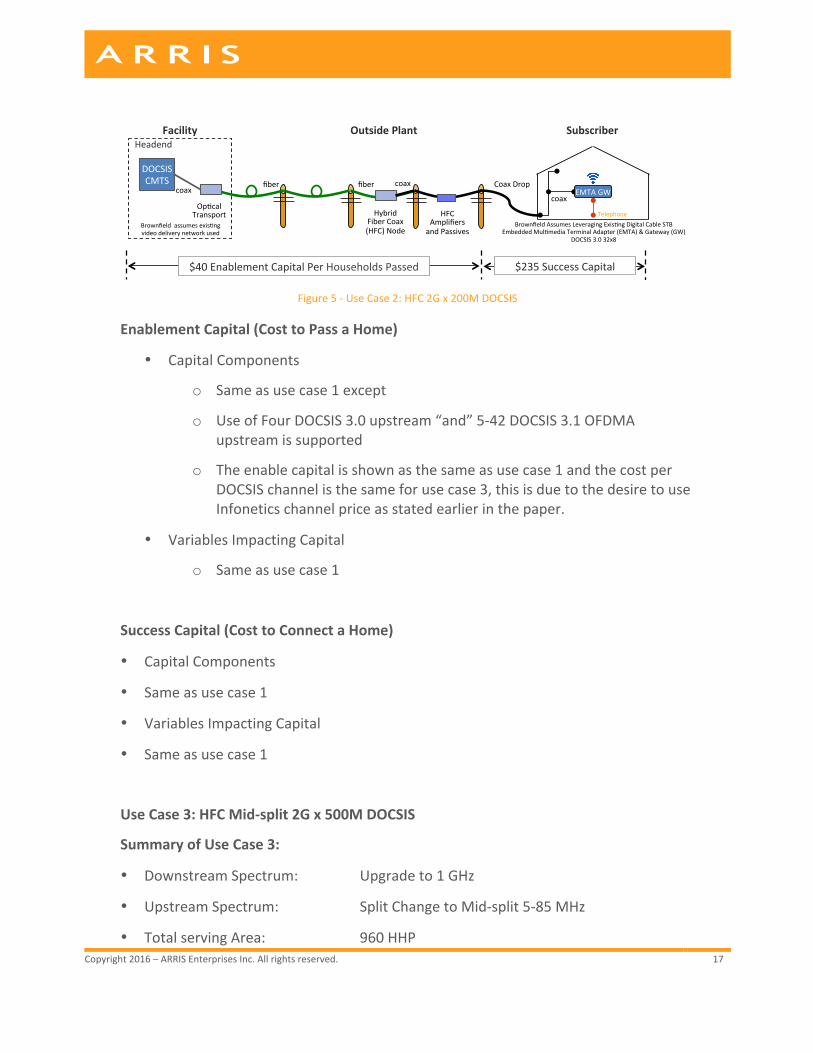
Figure 5 -‐ Use Case 2: HFC 2G x 200M DOCSIS
Enablement Capital (Cost to Pass a Home)
• Capital Components
o Same as use case 1 except
o Use of Four DOCSIS 3.0 upstream “and” 5-‐42 DOCSIS 3.1 OFDMA upstream is supported
o The enable capital is shown as the same as use case 1 and the cost per DOCSIS channel is the same for use case 3, this is due to the desire to use Infonetics channel price as stated earlier in the paper.
• Variables Impacting Capital
o Same as use case 1
Success Capital (Cost to Connect a Home)
• Capital Components
• Same as use case 1
• Variables Impacting Capital
• Same as use case 1
Use Case 3: HFC Mid-‐split 2G x 500M DOCSIS
Summary of Use Case 3:
• Downstream Spectrum: Upgrade to 1 GHz
• Upstream Spectrum: Split Change to Mid-‐split 5-‐85 MHz
• Total serving Area: 960 HHP
$40EnablementCapitalPerHouseholdsPassed $235SuccessCapital
fiber coax
HybridFiberCoax(HFC)Node
HFCAmplifiersandPassives
CoaxDrop
Telephone
fiber
Headend
coax
DOCSISCMTS
OpKcalTransport
coax
OutsidePlantFacility Subscriber
BrownfieldassumesexisKngvideodeliverynetworkused
EMTAGW
EmbeddedMulKmediaTerminalAdapter(EMTA)&Gateway(GW)BrownfieldAssumesLeveragingExisKngDigitalCableSTB
DOCSIS3.032x8

Copyright 2016 – ARRIS Enterprises Inc. All rights reserved. 18
• HFC optical serving area: Moves from 480 to 240 HHP
• DOCSIS Service Group: Moves from 480 to 240 HHP
• DOCSIS Downstream: 32 D3.0 + 96 MHz OFDM
• DOCSIS Upstream: 4 ATDMA and 5-‐80 MHz OFDMA
• DOCSIS Cost:
o Assume 48 Downstream DOCSIS channels equivalents and 5-‐80 MHz of SC-‐QAM and OFDMA upstream are assumed using the Infonetics report from Q4/2014 price per channel rate of $399.00
• Service Tier Support
o 1 Gbps Downstream Service Tier Supported
o 1 Gbps Upstream Service Tier (not possible for this use case)
o 400 Mbps Upstream Service Tier Supported
Figure 6 -‐ Use Case 3: HFC Mid-‐split 2G x 500M DOCSIS
Enablement Capital (Cost to Pass a Home)
• Capital Components
o Same as use case 1 except
o Assumes spectrum expansion to 1 GHz and upstream Mid-‐split change
o Assumed Node splits and fiber build to new node serving area
o figurations
o Assumes 5-‐85 spectrum
o Use of Four DOCSIS 3.0 upstream “and” 5-‐85 DOCSIS 3.1 OFDMA upstream is supported
$145EnablementCapitalPerHouseholdsPassed $235SuccessCapital
fiber coax
HybridFiberCoax(HFC)Node
HFCAmplifiersandPassives
fiber
Headend
DOCSISCMTS
OpKcalTransport
coax
OutsidePlantFacility Subscriber
BrownfieldassumesexisKngvideodeliverynetworkused
CoaxDrop
EmbeddedMulKmediaTerminalAdapter(EMTA)&Gateway(GW)BrownfieldAssumesLeveragingExisKngDigitalCableSTB
DOCSIS3.032x8andDOCSIS3.1DS2x192MHzandUS2x96MHz
Telephone
coaxEMTAGW
Copyright 2016 – ARRIS Enterprises Inc. All rights reserved. 19
• Variables Impacting Capital
o Same as use case 1
Success Capital (Cost to Connect a Home)
• Capital Components
o Same as use case 1
• Variables Impacting Capital
o Same as use case 1
Use Case 4: FTTH 10G EPON
Summary of Use Case 4:
• Assumes existing HFC remains in service to support video
• Overbuild FTTH using 10G EPON
• All passive ODN
• Serving Area 960 HHP (Tied to Enablement Capital)
• 8 PON Ports with 64 Subs
• 10 km is assumed to support 64 Subs per Port
• 8 fibers to the serving area exist with PON wavelengths available
• 8 Gbps Symmetrical Capacity
• Leverage Existing HFC for Video Service
• Service Tier Support
o 5+ Gbps Downstream Service Tier Supported
o 5+ Gbps Upstream Service Tier (not possible for this use case)
Copyright 2016 – ARRIS Enterprises Inc. All rights reserved. 20
Figure 7 -‐ Use Case 4: FTTH 10G EPON
Enablement Capital (Cost to Pass a Home)
• Capital Components
o Includes 10G EPON OLT
o Assumes 8 fibers per service group (if enough fibers do not exist at the service group the MSO should consider Use Case 5
o Leverage existing DOCSIS back office
o EPON is sized for 50% take rate
o Assumed a fiber will be pre run to all existing tap location as part of enablement capital, this could be termed as fiber-‐to-‐the-‐curb
o Running fiber from the tap location to the home is success capital
• Variables Impacting Capital
o Migration to all IP video over 10G EPON
o Some video equipment may be repurposed like bulk encryption
o Aerial / Underground
Success Capital (Cost to Connect a Home)
• Capital Components
o Existing digital cable set-‐top box used over HFC
o Fiber drop cable
o IEEE based 10 Gbps x 10G ONU
$338EnablementCapitalPerHouseholdsPassed $565SuccessCapital
fiber NewFiberDropfiber
Headend
10GEPONOLT
OutsidePlantFacility Subscriber
fiber
ExisHng(HFC)Node
ExisHngHFCAmplifiersandPassives
ExisHngCoaxBrownfieldassumesexisHngvideo
&VoIPdeliverynetworkused
EPONGWFiber
10GSymmetricalOpHcs
BrownfieldAssumesLeveragingExisHngEMTAVoIPBrownfieldAssumesLeveragingExisHngDigitalCableSTB
IEEE10x10GEPONONU(E-ONU)&Gateway(GW)
10kmSupporHng64SubsperPort

Copyright 2016 – ARRIS Enterprises Inc. All rights reserved. 21
o Installation for all components
• Variables Impacting Capital
o Migration to IP set-‐tops will increase connect costs but reduces if IP-‐STB are in place
o Material and equipment costs vary
o Variable drop length (Assumed 150 feet)
o Aerial / Underground
o Variable installation time and labor rates
Use Case 5: FTTH 10G EPON + PON Extender
Summary of Use Case 5:
• Assumes existing HFC remains in service to support video
• Overbuild FTTH using 10G EPON
• All passive ODN
• Serving Area 960 HHP (Tied to Enablement Capital)
• 4 PON Ports with 128 Subs
• Up to 60 km is assumed to support 128 Subs per Port
• 1 fiber to the serving area exist with PON wavelengths available
• 8 Gbps Symmetrical Internet Services
• Leverage Existing HFC for Video Service
• Service Tier Support
o 5+ Gbps Downstream Service Tier Supported
o 5+ Gbps Upstream Service Tier
Copyright 2016 – ARRIS Enterprises Inc. All rights reserved. 22
Figure 8 -‐ Use Case 5: FTTH 10G EPON + PON Extender
Enablement Capital (Cost to Pass a Home)
• Capital Components
o Same as use case 4 except
o No requirement for 8 fibers per service group
o 1 Fiber is required for the trunk between the facility and the headend
o Four separate 10G PONs are required
o 2 km distance between the four PON extender fiber nodes
• Variables Impacting Capital
o Migration to all IP video over 10G EPON
o Some video equipment may be repurposed like bulk encryption
o Aerial / Underground
Success Capital (Cost to Connect a Home)
• Capital Components
o Existing digital cable set-‐top box used over HFC
o Fiber drop cable
o IEEE based 10 Gbps x 10G ONU
o Installation for all components
• Variables Impacting Capital
o Migration to IP set-‐tops will increase connect costs but reduces if IP-‐STB are in place
$342EnablementCapitalPerHouseholdsPassed $565SuccessCapital
fiber fiber
Headend
10GEPONOLT
OutsidePlantFacility
Mux/Demux
fiber
BrownfieldassumesexisKngvideodeliverynetworkused
NewFiberDrop
Subscriber
ExisKng(HFC)Node
ExisKngHFCAmplifiersandPassives
ExisKngCoax
EPONGWFiber
10GEPONExtenderAggregaKon
10GSymmetricalOpKcs
BrownfieldAssumesLeveragingExisKngEMTAVoIPBrownfieldAssumesLeveragingExisKngDigitalCableSTB
IEEE10x10GEPONONU(E-ONU)&Gateway(GW)
Upto~60kmtoPONExtender ~2kmfor128SubsperPort
Copyright 2016 – ARRIS Enterprises Inc. All rights reserved. 23
o Material and equipment costs vary
o Variable drop length (Assumed 150 feet)
o Aerial / Underground
o Variable installation time and labor rates
SUCCESS BASED USE CASES FOR BROWNFIELD MIGRATION The residential success based approach addresses the competitive challenges of gigabit or multi-‐gigabit symmetrical services differently than the system wide based approached shown in the section. The system wide approach built out the network across the entire serving area. The system wide FTTH, use cases 5 and 6, illustrate the high upfront enablement capital per HHP. The total enablement build out costs is the number of homes in the build out area times the dollars per HHP. If subscriber take rates are low then the actual cost per customer are high, so when there is high enablement capital, this should be coupled with high service penetration rates to justify the investment. The customer take rates for gigabit or multi-‐gigabit symmetrical services are expected to be very low, perhaps single digit percent. Therefore, if the driver for FTTH is gigabit or multi-‐gigabit symmetrical services then high enablement capital build outs may be hard to justify.
The success based approach has been used for nearly two decades to overlay an existing HFC network with a fiber to the premise (FTTP) network in the support commercial services. This was used when the service speed tiers may have exceeded the capabilities of HFC and DOCSIS and there was also the likelihood that service take rates were low and therefore not economically justifiable to allocate HFC resources for just a few customers.
An advantage in the system wide approach enables the provider to market the service across 100% of the serving area, but this comes with high upfront cost, before a single customer signs up for the service. The success based approached may reduce the serving area to an acceptable range based on the economics and service turn up times.
Success based approaches extend the fiber for a single customers and this will also increase the service area coverage, because fiber was extended from the original location. Some cable operators deployed the HFC fiber deep architecture, which places a node to serve a smaller service group, this means that a larger percentage of homes passed are close to a fiber location. If we consider a serviceable range of 1/3 of a mile from an existing fiber location, likely a node.
Copyright 2016 – ARRIS Enterprises Inc. All rights reserved. 24
If we consider 114 homes per mile used in this paper and a 1/3 of a mile build out range for the success capital approach the home passed serviceable is about 38 (114 * .333 = 37.9). However, if we assume that it may be possible that a north, south, east and west fiber builds could exist, serviceability going in four directions, this is 152 HHP (38 * 4 = 152) from a fiber location, assuming 114 homes per mile. This may be an aggressive assumption, because not all fiber locations would have an option to build fiber in all four directions and at the average homes per mile. If we assume that fiber is located at a node location serving 400 HHP and network builds are possible in all four directions, while also assuming 114 HHP this could be 38% of the HHP are serviceable (152/400 = .38).
If we use the 2015 SCTE paper values of 75 homes per mile and a 1/3 of a mile build out range for the success capital approach the home passed serviceable is about 25 (75 * .333 = 24.9). Assuming a north, south, east and west fiber builds could exist, serviceability going in four directions, this is 100 HHP (25 * 4 = 100) from a fiber location, assuming 75 homes per mile. If we assume that fiber is located at a node location serving 400 HHP and network builds are possible in all four directions, while also assuming 75 HHP this could be 25% of the HHP are serviceable (152/400 = .38).
The smaller the homes passed per node the greater the percentage of customers that are close to fiber, assuming similar HHP per mile. Many cable operators were at 500 HHP in the early 2000s but in past decade or more, through node splits and new build practices that HHP per node number has dropped.
The success based approach has to examine the costs at a larger scale to provide better visibility of the costs because these use case assume extremely low takes rates. The success based approach must also consider a time horizon they will eventually reach the 1% and 5% take rates in our models. So, we scaled the assumptions up to a headend serving area and then sized the network for the eventually reach the estimated take rates. We assumed we could reach the customers within 1/3 of a mile and that this represented the serving area. This assumes existing network power and not additional battery suppliers includes. Please refer to the disclaimer for additional considerations.
Success Based Use Cases Assumptions:
• Average Headend Serving Area 80,352
• Average Number of Node per Facility 279
• Average Serving Area: 288 HHP
• Homes per mile: 114
• Aerial / Underground: 73% / 27%

Copyright 2016 – ARRIS Enterprises Inc. All rights reserved. 25
• Fiber Construction Cost Per Mile $15,000
• 1 Gbps Symmetrical Take Rate 5% or 1%
Use cases 6 through 8 illustrate the estimated costs a success based directed customer fiber build and equipment using 10G EPON, 10G EPON with PON Extender, and 1 Gbps point-‐to-‐point Ethernet.
Use Case 6: Success Based FTTH 10G EPON
• Assumes existing HFC remains in service to support video
• Overbuild FTTH using 10G EPON
• All passive ODN
• 10 km
• 8 fibers to the serving area exist with PON wavelengths available
• 8 Gbps Symmetrical Capacity
• Leverage Existing HFC for Video Service
• Service Tier Support
o 5+ Gbps Downstream Service Tier Supported
o 5+ Gbps Upstream Service Tier (not possible for this use case)
Figure 9 -‐ Use Case 6: Success Based FTTH 10G EPON
fiber fiber
Headend
FTTH10GEPONOLT
OutsidePlantFacility Subscriber
fiber
Exis7ng(HFC)Node
Exis7ngHFCAmplifiersandPassives
Exis7ngCoaxBrownfieldassumesexis7ngvideo
&VoIPdeliverynetworkused
EPONGWFiber
10GSymmetricalOp7cs
BrownfieldAssumesLeveragingExis7ngDigitalCableSTB
$2,040CostPerCustomer
$4,265CostPerCustomer
5%TakeRate
1%TakeRate
Buildhappensonlywhenacustomersignsupfortheservice
SuccessCapitalSuccessCapital
NewNetworkBuild
NewFiberDrop

Copyright 2016 – ARRIS Enterprises Inc. All rights reserved. 26
Use Case 7: Success Based FTTH 10G EPON + PON Extender
• Assumes existing HFC remains in service to support video
• Overbuild FTTH using 10G EPON
• Up to 60 km is assumed
• 1 fiber to the serving area exist with PON wavelengths available
• 8 Gbps Symmetrical Internet Services
• Leverage Existing HFC for Video Service
• Service Tier Support
o 5+ Gbps Downstream Service Tier Supported
o 5+ Gbps Upstream Service Tier
Figure 10 -‐ Use Case 7: Success Based FTTH 10G EPON + PON Extender
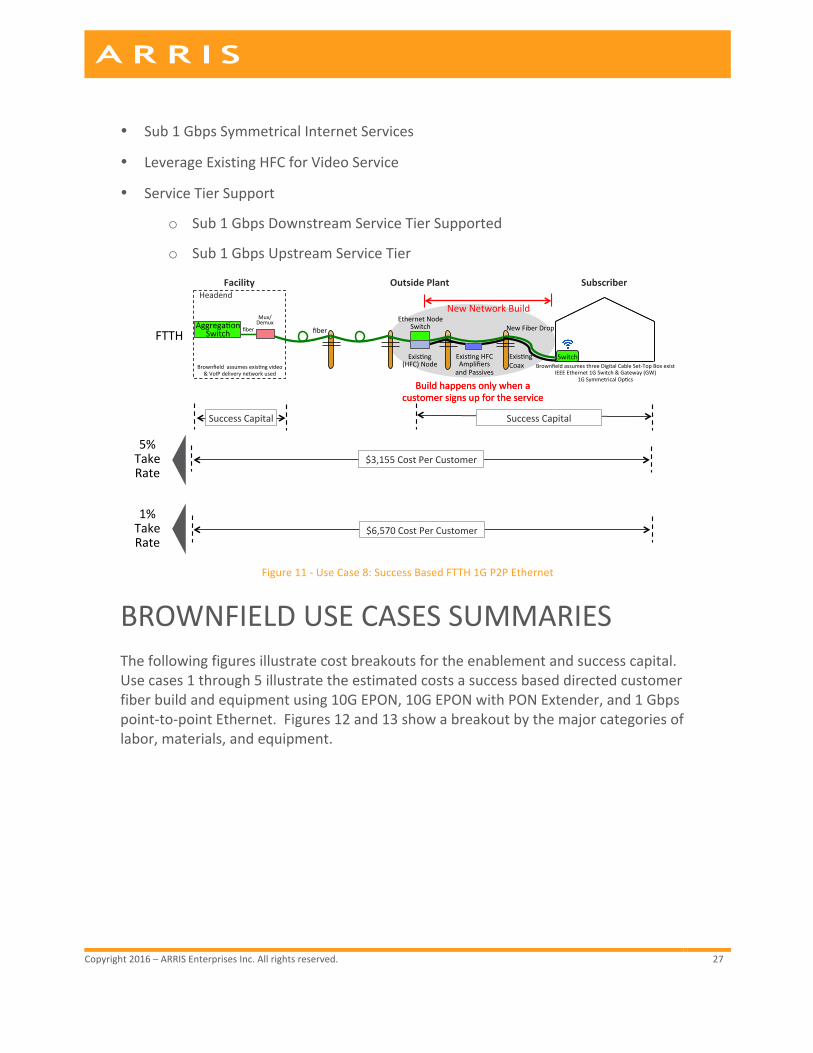
Use Case 8: Success Based FTTH 1G P2P Ethernet
• Assumes existing HFC remains in service to support video
• Overbuild FTTH using Point-‐to-‐Point 1 Gbps Ethernet
• Up to 60 km is assumed
• 1 fiber to the serving area exist with wavelengths available
fiber fiber
Headend
FTTH10GEPONOLT
OutsidePlantFacility
Mux/Demux
fiber NewFiberDrop
Subscriber
Exis?ng(HFC)Node
Exis?ngHFCAmplifiersandPassives
Exis?ngCoax
EPONGWFiber
10GEPONExtenderAggrega?on
10GSymmetricalOp?cs
BrownfieldAssumesLeveragingExis?ngEMTAVoIPBrownfieldAssumesLeveragingExis?ngDigitalCableSTB
IEEE10x10GEPONONU(E-ONU)&Gateway(GW)
5%TakeRate
1%TakeRate
Buildhappensonlywhenacustomersignsupfortheservice
SuccessCapitalSuccessCapital
NewNetworkBuild
$2,064CostPerCustomer
$4,235CostPerCustomer
Brownfieldassumesexis?ngvideo&VoIPdeliverynetworkused
Copyright 2016 – ARRIS Enterprises Inc. All rights reserved. 27
• Sub 1 Gbps Symmetrical Internet Services
• Leverage Existing HFC for Video Service
• Service Tier Support
o Sub 1 Gbps Downstream Service Tier Supported
o Sub 1 Gbps Upstream Service Tier
Figure 11 -‐ Use Case 8: Success Based FTTH 1G P2P Ethernet
BROWNFIELD USE CASES SUMMARIES The following figures illustrate cost breakouts for the enablement and success capital. Use cases 1 through 5 illustrate the estimated costs a success based directed customer fiber build and equipment using 10G EPON, 10G EPON with PON Extender, and 1 Gbps point-‐to-‐point Ethernet. Figures 12 and 13 show a breakout by the major categories of labor, materials, and equipment.
fiber
Headend
FTTH
OutsidePlantFacility Subscriber
Mux/Demux
fiber
Switch
Aggrega:onSwitch
IEEEEthernet1GSwitch&Gateway(GW)BrownfieldassumesthreeDigitalCableSet-TopBoxexist
1GSymmetricalOp:cs
5%TakeRate
1%TakeRate
Buildhappensonlywhenacustomersignsupfortheservice
SuccessCapitalSuccessCapital
$3,155CostPerCustomer
$6,570CostPerCustomer
NewFiberDrop
Exis:ng(HFC)Node
Exis:ngHFCAmplifiersandPassives
Exis:ngCoax
EthernetNodeSwitch
Buildhappensonlywhenacustomersignsupfortheservice
NewNetworkBuild
Brownfieldassumesexis:ngvideo&VoIPdeliverynetworkused

Copyright 2016 – ARRIS Enterprises Inc. All rights reserved. 28
Figure 12 -‐ Enablement Capital Composition (Per HHP)
Figure 13 -‐ Success Capital Composition (Per Customer)
Figures 13 and 14 examine the system wide network builds and separate the enablement and success cost among each use case. Figure 14, illustrates the impact of take rate, assumed at 50% and the real cost per customer served. Providers and/or services with low takes rates will have high cost per subscriber costs, especially when enablement costs are high. The key point is if a massive investment in enablement capital is required and high take rates are desirable to achieve acceptable return on investment.
$-
$100.00
$200.00
$300.00
$400.00
$500.00
$600.00
UseCase1:HFC2GDOCSIS
UseCase2:HFC2Gx200MDOCSIS
UseCase3:HFCMid-split2Gx500M
DOCSIS
UseCase4:FTTH10GEPON
UseCase5:FTTH10GEPON+PON
Extender
OSPLabor
OSPMaterials
OSPEquipment
FacilityLabor
FacilityEquipment
$-
$100.00
$200.00
$300.00
$400.00
$500.00
$600.00
UseCase1:HFC2GDOCSIS
UseCase2:HFC2Gx200MDOCSIS
UseCase3:HFCMid-split2Gx500M
DOCSIS
UseCase4:FTTH10GEPON
UseCase5:FTTH10GEPON+PON
Extender
DropLabor
DropMaterials
In-homeLabor
In-homeEquipment

Copyright 2016 – ARRIS Enterprises Inc. All rights reserved. 29
Figure 14 -‐ Use Case Enablement & Success Comparison
Figure 15 -‐ Use Case Cost Per Sub at 50% Take Rate of HHP
The following figures illustrate cost breakouts for the enablement and success capital. Use cases 1 through 8 illustrate the estimated costs a system wide versus success based. Figures 16 and 17 show the impact of building FTTH to within 150 feet of every home as seen in use cases 4 and 5 and low penetration of the service. The HFC and DOCSIS use cases as shown in use case 1 through 3 show low cost for low take rates, this proves to be a good solutions for high bit rate downstream services and even with reasonable upstream speeds. The 1 Gbps symmetrical services are higher are best served with success capital builds found on use cases 6, 7, and 8.
$40 $40$145
$338 $342$235 $235 $235
$565 $565
$0
$500
$1,000
$1,500
$2,000
$2,500
UseCase1:HFC2GDOCSIS UseCase2:HFC2Gx200MDOCSIS UseCase3:HFCMid-split2Gx500MDOCSIS
UseCase4:FTTH10GEPON UseCase5:FTTH10GEPON+PONExtender
EnablementCapital(CosttoPassaHome) SuccessCapital(CosttoConnectaHome)
$80 $80
$290
$676 $684
$235 $235 $235
$565 $565
$315 $315
$525
$1,241 $1,249
$0
$500
$1,000
$1,500
$2,000
$2,500
UseCase1:HFC2GDOCSIS UseCase2:HFC2Gx200MDOCSIS UseCase3:HFCMid-split2Gx500MDOCSIS
UseCase4:FTTH10GEPON UseCase5:FTTH10GEPON+PONExtender
EnablementCapital(CostPerSubat50%TakeRate) SuccessCapital(CosttoConnectaHome) CostPerSubscriberAt50%TakeRate
Copyright 2016 – ARRIS Enterprises Inc. All rights reserved. 30
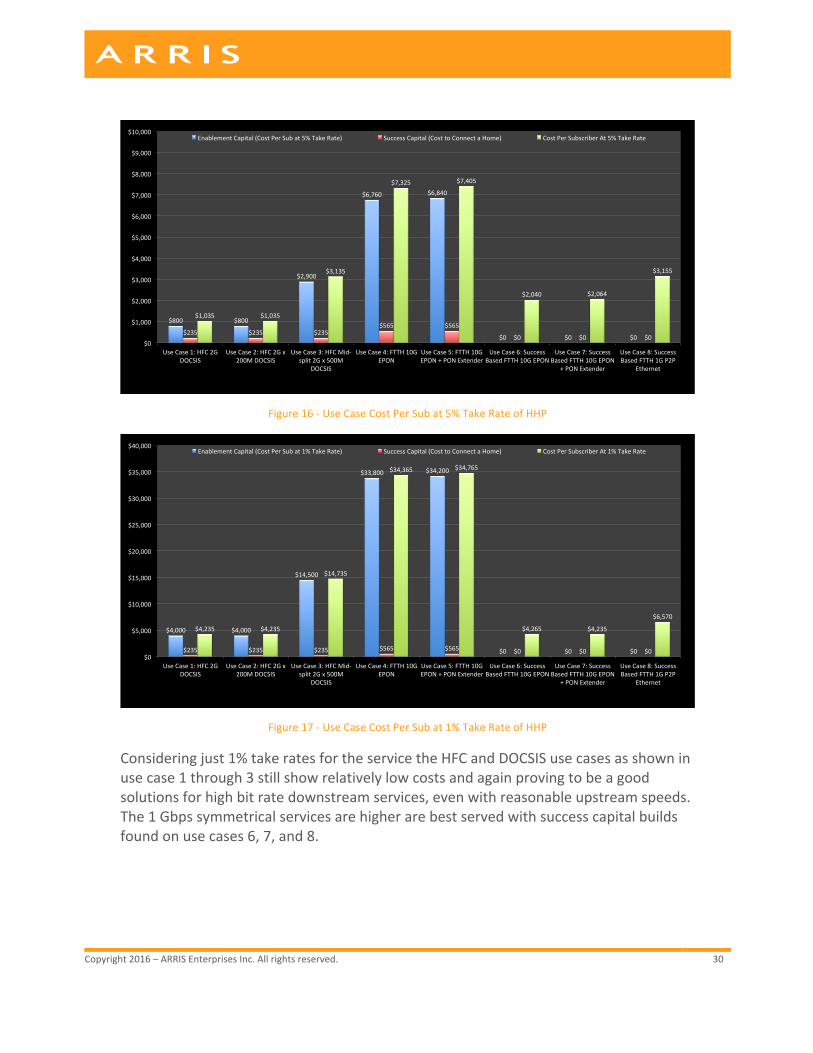
Figure 16 -‐ Use Case Cost Per Sub at 5% Take Rate of HHP
Figure 17 -‐ Use Case Cost Per Sub at 1% Take Rate of HHP
Considering just 1% take rates for the service the HFC and DOCSIS use cases as shown in use case 1 through 3 still show relatively low costs and again proving to be a good solutions for high bit rate downstream services, even with reasonable upstream speeds. The 1 Gbps symmetrical services are higher are best served with success capital builds found on use cases 6, 7, and 8.
$800 $800
$2,900
$6,760 $6,840
$0 $0 $0$235 $235 $235
$565 $565
$0 $0 $0
$1,035 $1,035
$3,135
$7,325 $7,405
$2,040 $2,064
$3,155
$0
$1,000
$2,000
$3,000
$4,000
$5,000
$6,000
$7,000
$8,000
$9,000
$10,000
UseCase1:HFC2GDOCSIS
UseCase2:HFC2Gx200MDOCSIS
UseCase3:HFCMid-split2Gx500M
DOCSIS
UseCase4:FTTH10GEPON
UseCase5:FTTH10GEPON+PONExtender
UseCase6:SuccessBasedFTTH10GEPON
UseCase7:SuccessBasedFTTH10GEPON
+PONExtender
UseCase8:SuccessBasedFTTH1GP2P
Ethernet
EnablementCapital(CostPerSubat5%TakeRate) SuccessCapital(CosttoConnectaHome) CostPerSubscriberAt5%TakeRate
$4,000 $4,000
$14,500
$33,800 $34,200
$0 $0 $0$235 $235 $235 $565 $565 $0 $0 $0
$4,235 $4,235
$14,735
$34,365 $34,765
$4,265 $4,235
$6,570
$0
$5,000
$10,000
$15,000
$20,000
$25,000
$30,000
$35,000
$40,000
UseCase1:HFC2GDOCSIS
UseCase2:HFC2Gx200MDOCSIS
UseCase3:HFCMid-split2Gx500M
DOCSIS
UseCase4:FTTH10GEPON
UseCase5:FTTH10GEPON+PONExtender
UseCase6:SuccessBasedFTTH10GEPON
UseCase7:SuccessBasedFTTH10GEPON
+PONExtender
UseCase8:SuccessBasedFTTH1GP2P
Ethernet
EnablementCapital(CostPerSubat1%TakeRate) SuccessCapital(CosttoConnectaHome) CostPerSubscriberAt1%TakeRate
Copyright 2016 – ARRIS Enterprises Inc. All rights reserved. 31
CONCLUSIONS System-‐wide based HFC and DOCSIS are the most cost effective solutions to support very high bit rate downstream and sufficient upstream capacity to support Internet and IPTV services.
Success Based FTTH will have lower enablement capital than System Wide Rebuild FTTH. Those uses cases drove fiber to within 150 feet of “all” homes increasing enablement. The capital benefit is reduced service delivery times and smaller success capital.
Lower enablement capital impacts:
• A majority of the capital is success based (typically desirable approach for low take rate services)
• Often serviceability is not the entire footprint (50% or less is typical)
• Service delivery times are often weeks/months from the time of order (will vary between MSOs)
• Service delivery times can be 6-‐8 weeks (instead of days for the higher enablement capital approaches)
A major benefit addressing the billboard speed was is that since most MSOs are targeting 1 Gbps symmetrical and higher speeds for FTTH Selective Service Tiers, this saves HFC for Video Service and DOCSIS for the majority of Internet Users.
Key Conclusions:
1. HFC data capacity remains competitive against modern xPON (upstream remains a challenge)
2. HFC serves more homes and customers with far less capital
3. HFC is extremely cost effective when compared to any access layer technology
4. Upgrade 1 GHz+ / 85 MHz with 2.5G DOCSIS is extremely cost effective
5. Of the FTTH paths 10G EPON has lowest enablement capital
6. Enablement and success cost per bit favors FTTH 10G EPON solutions
7. Cable could push fiber deeper and even to the to the last active (amplifier) to position fiber closer to customers enabling faster service activation for 10G EPON for selective customers
8. Important factor like operational costs were not considered
Copyright 2016 – ARRIS Enterprises Inc. All rights reserved. 32
RECOMMENDATIONS As stated in the beginning of this paper the purpose was to examine these key questions below to determine the best path. The recommendations are based on the assessment of the capital expense of the alternative network build methods, like system wide and success based. This is also based capital assessment of the technology and architectures assess within each build option. There are other technology and architecture options that exist today, but these are likely the leading candidates. There will be new technologies and architectures that could improve HFC and DOCSIS as well as 10G EPON, there may also be other technologies that will emerge as well. This is a snapshot in time based on a set of network assumptions and networking approaches, as seen in the SCTE 2015 paper with different assumptions and network approaches the recommendation could change. Another key point, this examines the capital cost but not the total cost of ownership costs. Additionally, the ongoing operational costs such as utility costs, equipment and network maintenance costs, labor rate differences between each technologies and architecture, and many other drivers for OPEX. The OPEX costs will vary widely between operators and suppliers based on many factors.
Question:
Should MSOs continue with HFC/DOCSIS investment?
Recommendation:
Yes, based on use cases 1 through 3 these provide a cost effective approach to offer high bit rate data and eventually IPTV services at a much lower cost point that other solutions. The capacity shown is 2 Gbps, which is very high capacity, but even much higher is possible over HFC and DOCSIS.
Question:
Should MSOs overlay the existing HFC network with FTTH and PON?
Recommendation:
No, in terms of performing a system wide investment because the existing HFC and DOCSIS network will meet the service needs for a majority of the customers. Considering spectrum and node split investment as shown in use case 3, additional capacity is achieved at a low cost and with node splits this can be a surgical investment made where and when needed.
Yes, in terms of performing a success based investment because MSOs can offer high symmetrical data rates, such as 2 Gbps x 2Gbps that will exceed the capacity of their competitors today and provide a solutions to meet the competitive needs in the future.
Copyright 2016 – ARRIS Enterprises Inc. All rights reserved. 33
Since take rates are extremely low for the highest Internet speed tiers success based approaches offer the most economical path.
Question:
What are the economics both from a financial and capacity perspective?
Recommendation:
The paper illustrates the capital comparison and HFC and DOCSIS has the lowest cost per customer however the lowest cost per megabit belongs to the 10G EPON solutions.
Questions: What are the Economics of CTTH & FTTH brownfield migration options to support: Question:
1 Gbps downstream service to be available to 100% of the HHP in brownfield networks?
Recommendation:
The economic comparison to offer 1 Gbps downstream is shown in use cases 1 through 5; with HFC/DOCSIS (use cases 1-‐3) as the lowest cost solution.
Question:
1 Gbps symmetrical service to be available to 100% of the HHP in brownfield networks?
Recommendation:
The economic comparison to offer 1 Gbps symmetrical is shown in only use cases 4 through 5; the EPON uses cases. Currently there is not a DOCSIS based network solution to model 1 Gbps symmetrical.
Question:
1 Gbps symmetrical service to be available to 30-‐50% of the HHP in brownfield networks?
Recommendation:
The use of success based network builds to offer 1 Gbps symmetrical services is the most cost effective path for low take rate offering. The use of 10G EPON and 1 Gbps Ethernet are the solutions available today and are the most cost effective.
Copyright 2016 – ARRIS Enterprises Inc. All rights reserved. 34
DISCLAIMER All economic estimates may not represent actual build and equipment costs. The cable HFC and FTTH economic estimates contain inputs from a third party and ARRIS for construction, installation, labor, materials, current and future equipment estimates as well as our assumptions of network architecture and topology. These use cases were compiled independent from the cable operators. The use cases are based on an extremely small sample size and actual build costs may vary widely market by market. This material is for information and illustrative purposes only and should not be considered or derived as actual results. It is not, and should not be regarded as actual cost estimates. In addition, all of these estimates assume to varying degree different starting points or rather previous investments, which may not be represented in these costs as these are sunk costs. The core purpose of this data is to show relative difference for a particular set of use case migration options and should be used for discussion purposes only. The estimates expressed in this material are subject to change without notice. Reasonable people may disagree about the opinions expressed in our analysis and results. There are many other factors that were not considered that may impact the estimates and illustrate a significantly different result. It is strongly recommended that individuals and companies perform their own analysis based on their environment and costs.
ACKNOWLEDGEMENTS The author would like to thank the following individuals and test teams: Fred Slowik, Jon Bordner, Stuart Eastman, Steve Hersey, Charles Cheevers, Venk Mutalik, Zoran Maricevic, John Ulm and the technical publishing team.
Copyright 2016 – ARRIS Enterprises Inc. All rights reserved. 35
RELATED READINGS • The Yin and the Yang of a Move to All Fiber: Transforming HFC to an All Fiber
Network While Leveraging the Deployed HFC Assets – this paper provides critical insights into the innovations that enable OBI Free RFoG transmissions and discusses intrinsic capabilities of Hybrid PON (HPON) technology, explaining how this technology works with existing HFC analog and QAM video and D3.0 and D3.1 signals while also being completely transparent the myriad of traditional PON standards such as the 10G EPON, 1G EPON, GPON, and XGPON1.
• Comparing the DOCSIS 3.1 and HFC Evolution to the FTTH Revolution – this paper describers the existing network migration options including different migration paths for the existing coax-‐to-‐the-‐home (CTTH) network supporting more IP/data capacity with DOCSIS 3.0/3.1 over HFC.
• Examining the Future Evolution of the Access Network – this paper focuses on the three core areas of the cable access network that are increasingly becoming an integral part for maximizing spectral capacity: RF video and data technologies, FTTN optical technologies and headend and node functionality.
MEET OUR EXPERT: Mike Emmendorfer Mike Emmendorfer serves as Senior Director, Systems Engineering and Architecture, in the Office of the CTO at ARRIS. In this role, he is responsible for forward‐looking architecture and strategy to determine the viability of new products and technologies. Projects have included DOCSIS enhancements, EPOC, EPON, Metro Ethernet Forum, Wireless, RFoG, Remote Access Architectures, and IPTV. The final release of his “Next Generation–Cable Access Network (NG–CAN)” series of papers and publications in February 2012 defined the core features set for what later become DOCSIS 3.1. Later, for the 2012 NCTA–Cable Show, Mike teamed up with technical leaders from Cisco, Intel, and Motorola to co-‐author “Mission is Possible: An Evolutionary Approach to Gigabit-‐Class DOCSIS”, and it was this joint paper that launched DOCSIS 3.1.
Copyright 2016 – ARRIS Enterprises Inc. All rights reserved. 36
REFERENCES (1) [EMM1] Emmendorfer, Michael J, “Comparing the DOCSIS® 3.1 and HFC Evolution to the FTTH Revolution”, 2015 SCTE Cable-‐Tec Expo., October 13-‐16, 2015