Embed Size (px)
Citation preview
U.S. Department of Education NCES 2008-440
An Exploratory Evaluation of the Data from the Pilot Teacher Compensation Survey: School Year 2005–06 Research and Development Report

U.S. Department of Education NCES 2008-440
An Exploratory Evaluation of the Data from the Pilot Teacher Compensation Survey: School Year 2005–06 Research and Development Report April 2008 Frank Johnson Stephen Q. Cornman National Center for Education Statistics Frank Johnson Project Officer National Center for Education Statistics
U.S. Department of Education Margaret Spellings Secretary Institute of Education Sciences Grover J. Whitehurst Director National Center for Education Statistics Mark Schneider Commissioner The National Center for Education Statistics (NCES) is the primary federal entity for collecting, analyzing, and reporting data related to education in the United States and other nations. It fulfills a congressional mandate to collect, collate, analyze, and report full and complete statistics on the condition of education in the United States; conduct and publish reports and specialized analyses of the meaning and significance of such statistics; assist state and local education agencies in improving their statistical systems; and review and report on education activities in foreign countries. NCES activities are designed to address high-priority education data needs; provide consistent, reliable, complete, and accurate indicators of education status and trends; and report timely, useful, and high-quality data to the U.S. Department of Education, the Congress, the states, other education policymakers, practitioners, data users, and the general public. Unless specifically noted, all information contained herein is in the public domain. We strive to make our products available in a variety of formats and in language that is appropriate to a variety of audiences. You, as our customer, are the best judge of our success in communicating information effectively. If you have any comments or suggestions about this or any other NCES product or report, we would like to hear from you. Please direct your comments to National Center for Education Statistics Institute of Education Sciences U.S. Department of Education 1990 K Street NW Washington, DC 20006-5651 April 2008 The NCES World Wide Web Home Page address is http://nces.ed.gov. The NCES World Wide Web Electronic Catalog address is http://nces.ed.gov/pubsearch. This publication is only available online. To download, view, and print the report as a PDF file, go to the NCES World Wide Web Electronic Catalog address shown above. Suggested Citation
Johnson, F. and Cornman, S.Q. (2008). An Exploratory Evaluation of the Data from the Pilot Teacher Compensation Survey: School Year 2005–06, Research and Development Report (NCES 2008-440). National Center for Education Statistics, Institute of Education Sciences, U.S. Department of Education. Washington, DC. Retrieved [date] from http://nces.ed.gov/pubsearch/pubsinfo.asp?pubid=2008440.
Content Contact Frank Johnson 202-502-7362 [email protected]
iii
Foreword The Research and Development (R&D) series of reports at NCES has been initiated to
• share studies and research that are developmental in nature. The results of such studies may be revised as the work continues and additional data become available;
• share the results of studies that are, to some extent, the “cutting edge” of methodological
developments. Emerging analytical approaches and new computer software development often permit new and sometimes controversial analyses to be done. By participating in “frontier research,” we hope to continue to the resolution of issues and improved analysis; and
• participate in discussions of emerging issues of interest to educational researchers, statisticians,
and the federal statistical community in general. Such reports may document workshops and symposia sponsored by NCES that address methodological and analytical issues or may share and discuss issues regarding NCES practices, procedures, and standards.
The common theme in all three goals is that these reports present results or discussions that do not reach definitive conclusions at this point in time, either because the data are tentative, the methodology is new and developing, or the topic is one on which there are divergent views. Therefore, the techniques and inferences made from the data are tentative and subject to revision. To facilitate the process of closure on the issues, we invite comment, criticism, and alternatives to what we have done. Such responses should be directed to:
Marilyn Seastrom Chief Statistician Statistical Standards Program National Center for Education Statistics Institute of Education Sciences 1990 K Street NW Washington, DC 20006-5651
iv
Acknowledgments Much of the work for this report was performed by staff at the Education Statistics Services Institute (ESSI), which is funded by the National Center for Education Statistics (NCES) and composed of staff from the American Institutes for Research (AIR) and a number of partner organizations. The authors would like to acknowledge the following individuals from ESSI for their assistance with technical support and editorial guidance: Lei Zhou of MacroSys Research and Technology, Jennifer Sable and Steve Honegger of AIR, and Nick Gaviola of Quality Information Partners. The authors would like to thank all of the professionals in state and local education agencies who track, record, and report the data used in this report. Particular thanks are owed to the Teacher Compensation Survey coordinators without whose efforts this collection would not exist. The U.S. Census Bureau, Governments Division, is responsible for collecting, processing, and editing the CCD survey data. Eunice Ave, Crecilla Cohen, Elizabeth Holland, and Brian Gordon should be recognized for the quality their efforts added to these data.
v
Contents Page
Foreword ................................................................................................................................................... iii
Acknowledgments ..................................................................................................................................... iv
List of Tables ............................................................................................................................................ vi
List of Figures ........................................................................................................................................... vi
Introduction .................................................................................................................................................1
Selected Findings: School Year 2005–06 ...................................................................................................2
References and Related Data Files .............................................................................................................3
Appendix A: Methodology and Technical Notes .....................................................................................16
Appendix B: Common Core of Data Glossary .........................................................................................18
vi
List of Tables
Table Page
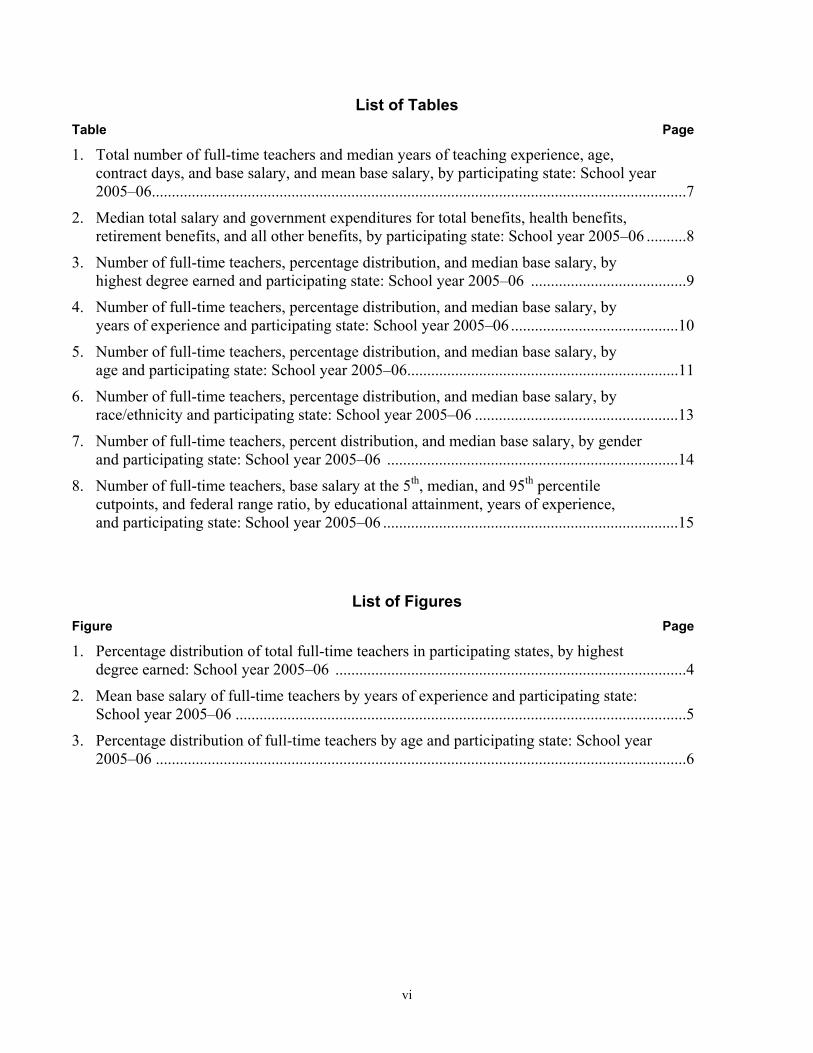
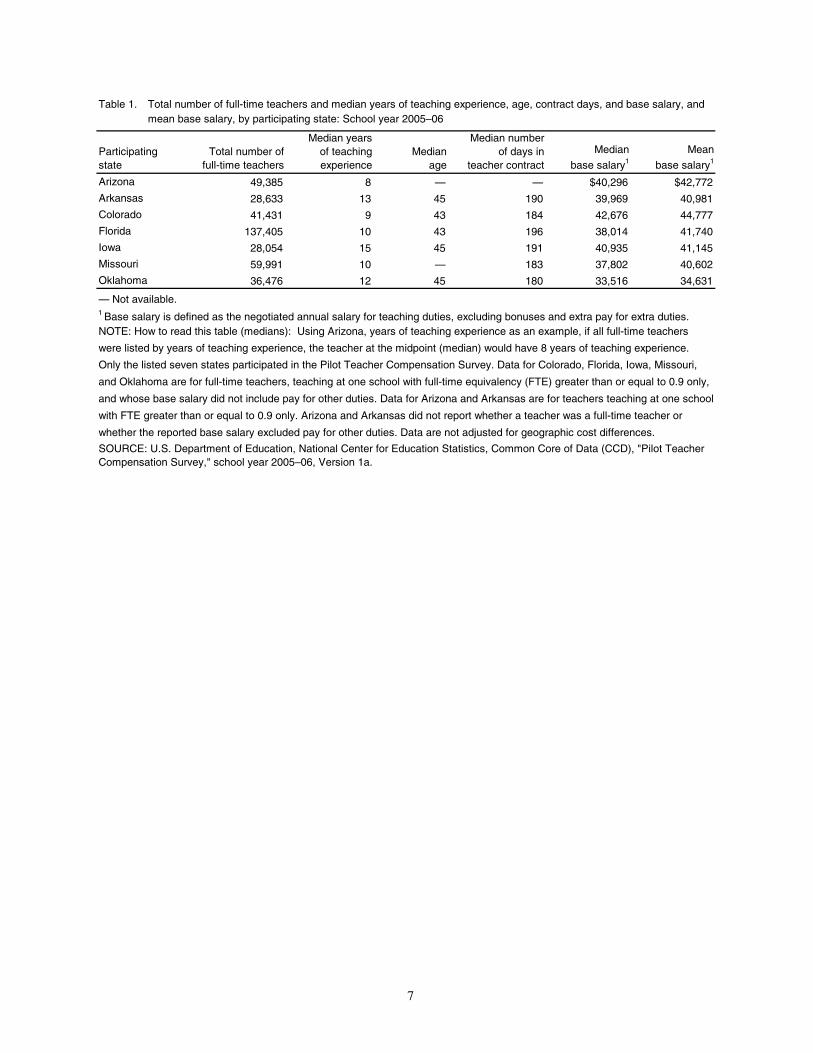
1. Total number of full-time teachers and median years of teaching experience, age, contract days, and base salary, and mean base salary, by participating state: School year 2005–06......................................................................................................................................7
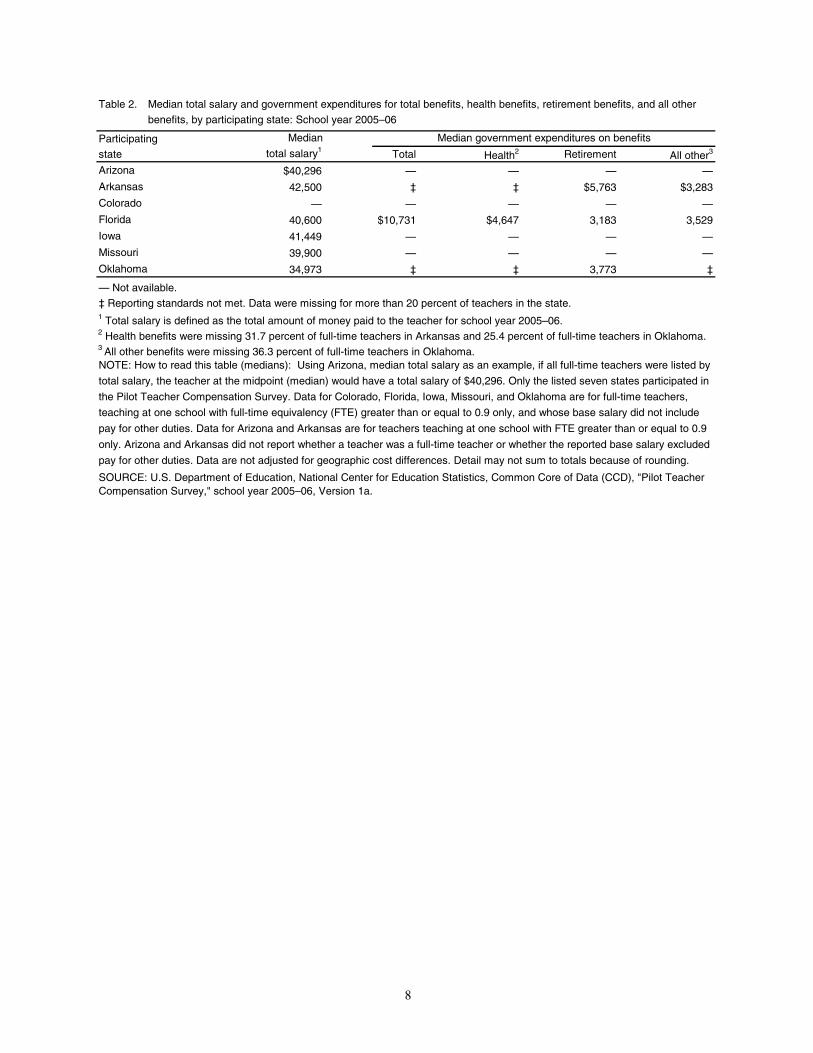
2. Median total salary and government expenditures for total benefits, health benefits, retirement benefits, and all other benefits, by participating state: School year 2005–06 ..........8
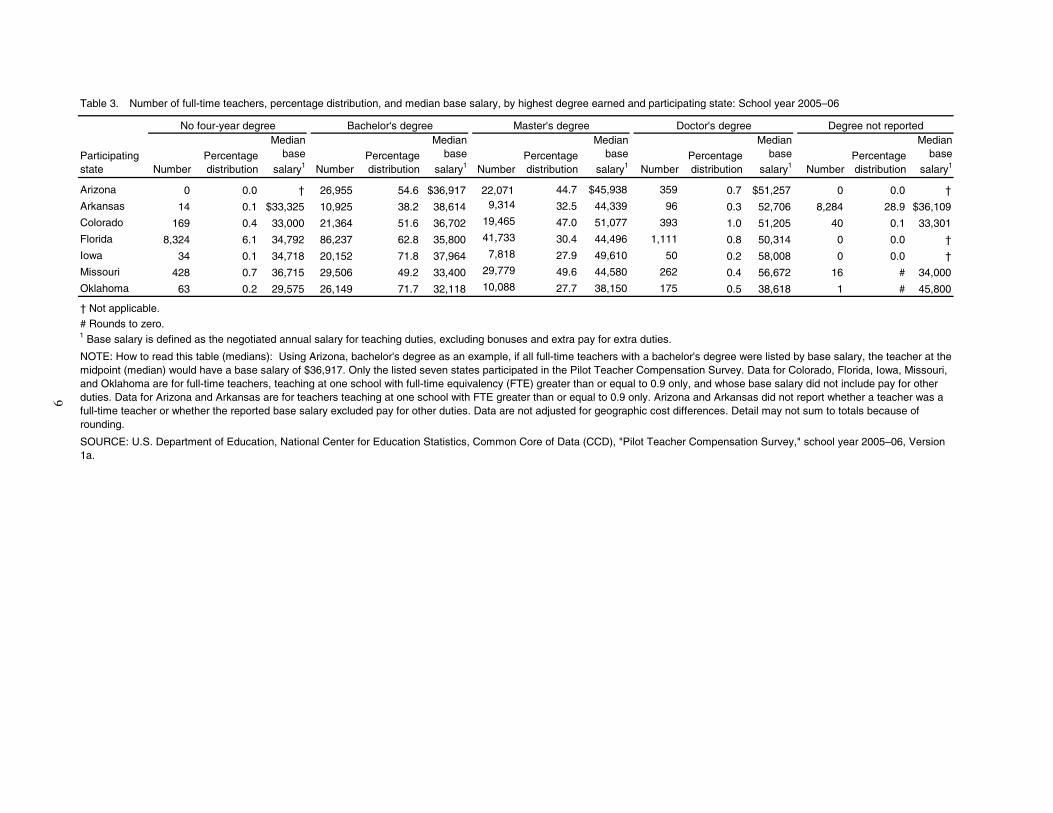
3. Number of full-time teachers, percentage distribution, and median base salary, by highest degree earned and participating state: School year 2005–06 .......................................9
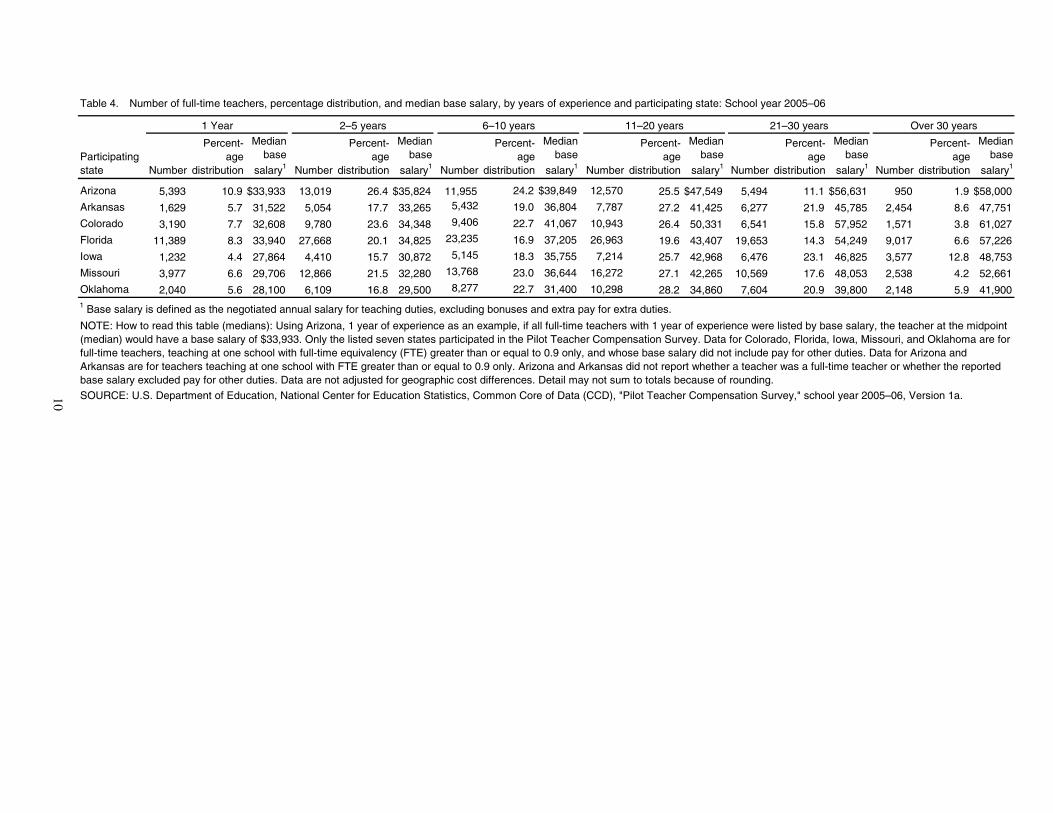
4. Number of full-time teachers, percentage distribution, and median base salary, by years of experience and participating state: School year 2005–06 ..........................................10
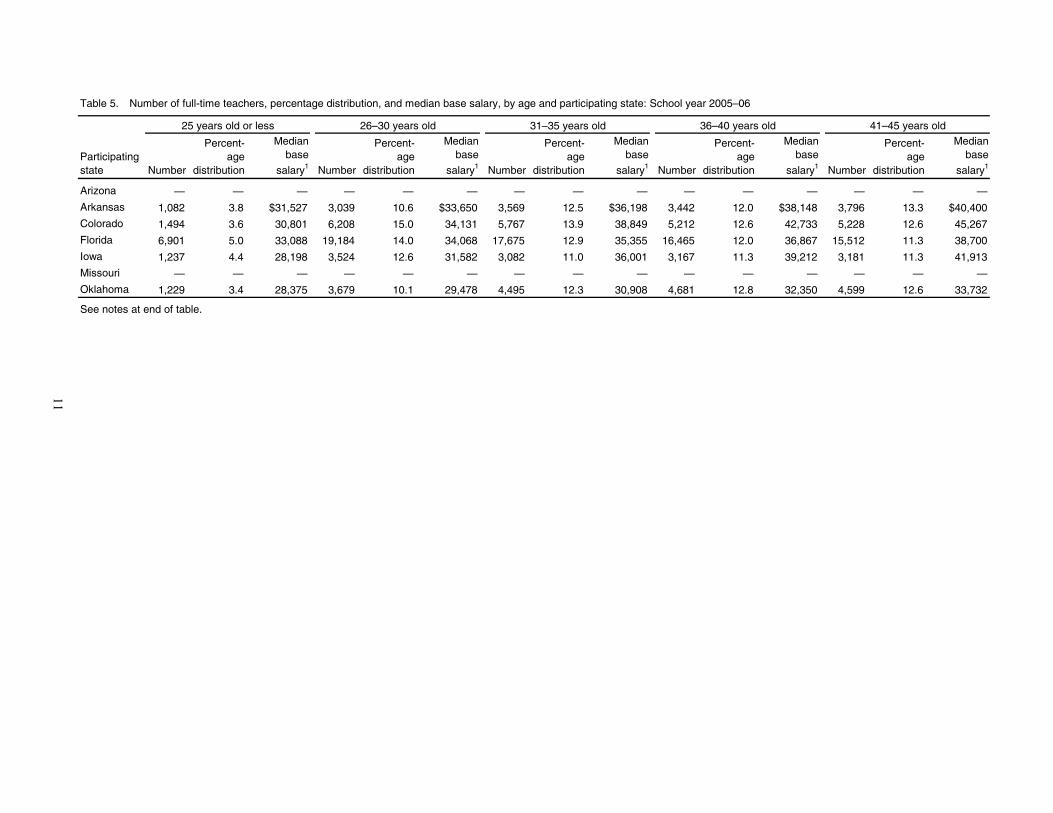
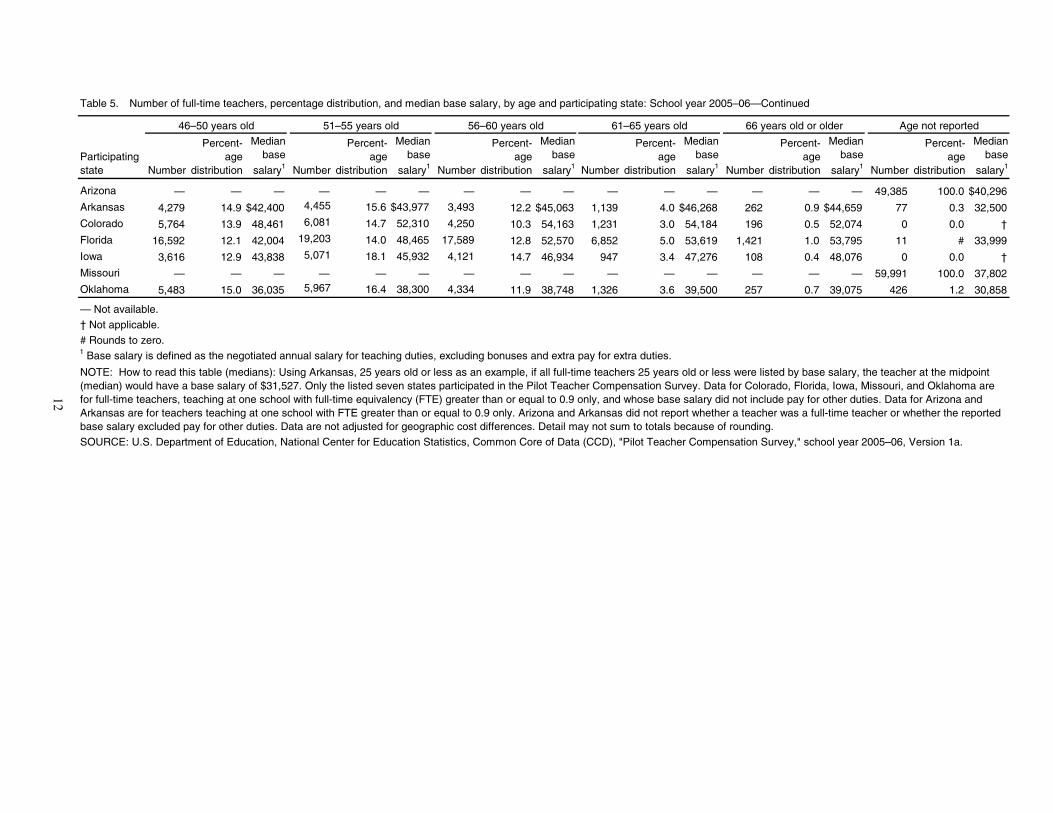
5. Number of full-time teachers, percentage distribution, and median base salary, by age and participating state: School year 2005–06....................................................................11
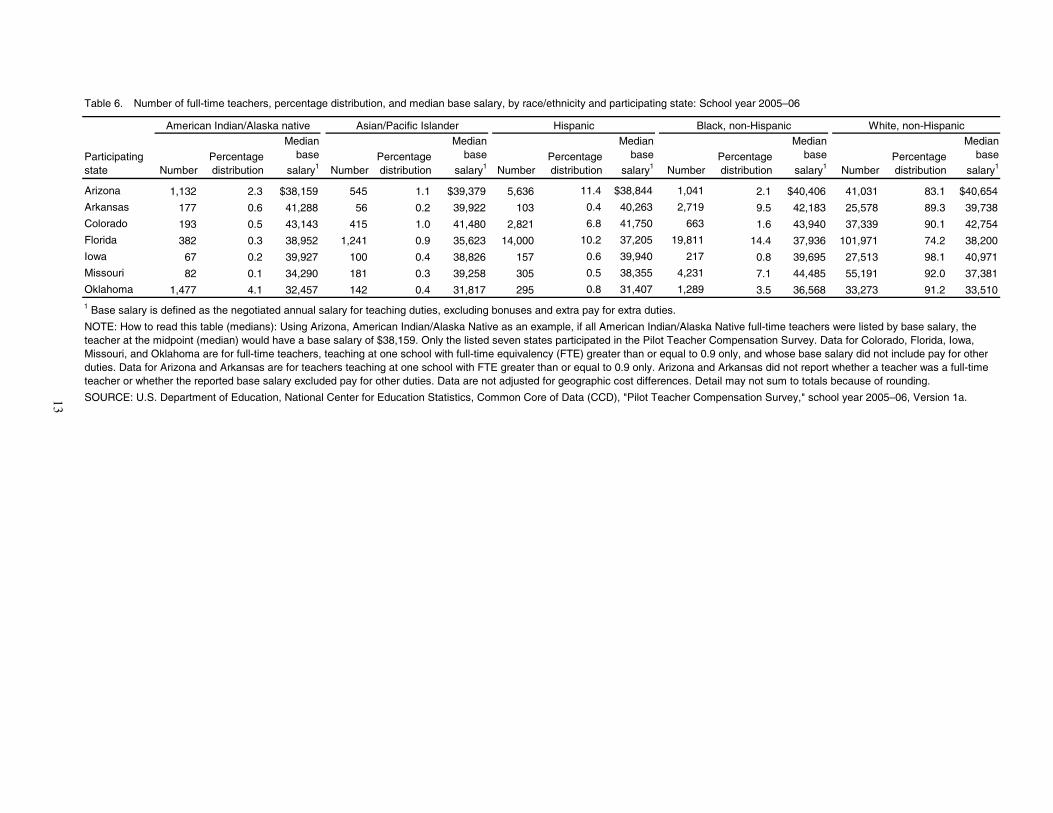
6. Number of full-time teachers, percentage distribution, and median base salary, by race/ethnicity and participating state: School year 2005–06 ...................................................13
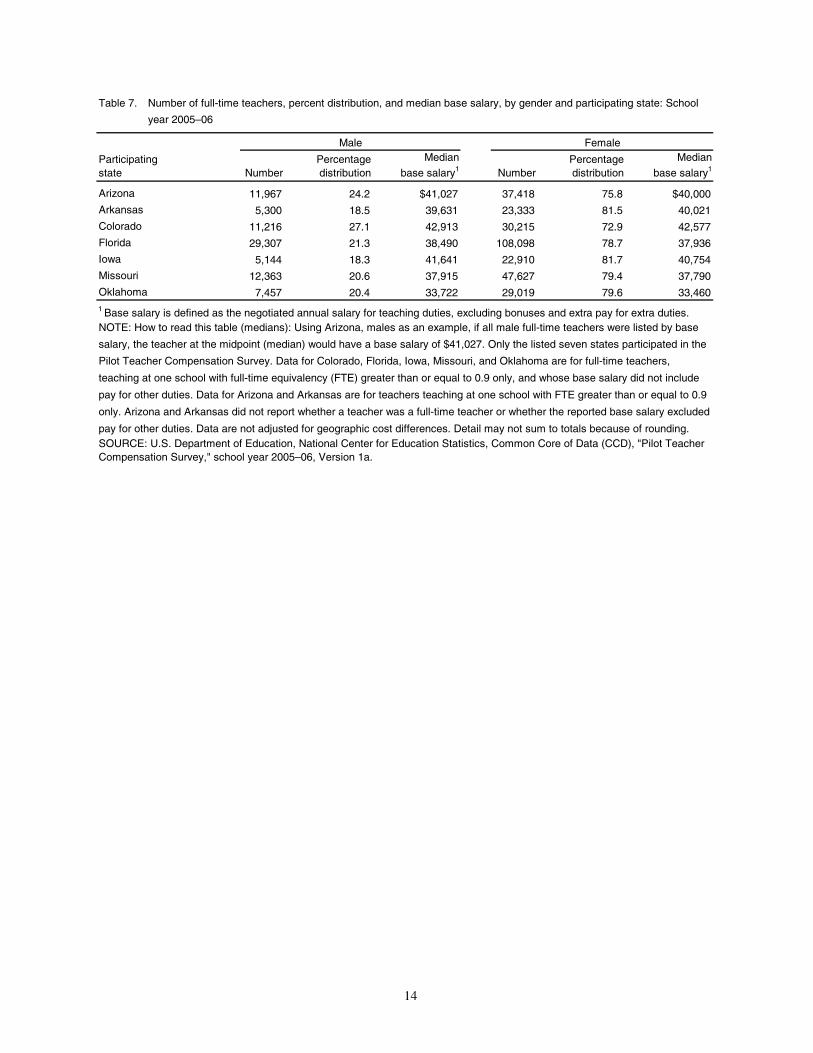
7. Number of full-time teachers, percent distribution, and median base salary, by gender and participating state: School year 2005–06 .........................................................................14
8. Number of full-time teachers, base salary at the 5th, median, and 95th percentile cutpoints, and federal range ratio, by educational attainment, years of experience, and participating state: School year 2005–06 ..........................................................................15
List of Figures
Figure Page
1. Percentage distribution of total full-time teachers in participating states, by highest degree earned: School year 2005–06 ........................................................................................4
2. Mean base salary of full-time teachers by years of experience and participating state: School year 2005–06 .................................................................................................................5
3. Percentage distribution of full-time teachers by age and participating state: School year 2005–06 .....................................................................................................................................6
1
Introduction
The Common Core of Data (CCD) is an annual collection of public elementary and secondary education data administered by the National Center for Education Statistics (NCES) and its collection agent, the U.S. Census Bureau. Data for CCD surveys are provided by state education agencies (SEAs). This report presents summary data from the Pilot Teacher Compensation Survey (TCS), which collected data for school year 2005–06. This pilot collection is a research and development effort to see if it is possible to collect and publish teacher-level data from the administrative records residing in state departments of education. Seven states participated in this survey: Arizona, Arkansas, Colorado, Florida, Iowa, Missouri, and Oklahoma. These states provided data on salaries, years of teaching experience, highest degree earned, race/ethnicity, and gender for each public school teacher. Data on government expenditures on employee benefits were also solicited, but only three states were able to provide even partial employee benefits data. Since this is a universe survey of administrative records for all teachers in participating states, no statistical testing was required. SEAs participate in the CCD voluntarily, following standard definitions for the data items they report. For more information on the data collection, methodology and definitions, readers should see appendixes A and B. The TCS is the first attempt to collect data, at this level, by NCES. The data presented here have been chosen to demonstrate the range of information available when using the TCS rather than to discuss all of the observed discoveries. The results are not meant to emphasize any particular issue.
2
Selected Findings: School Year 2005–06
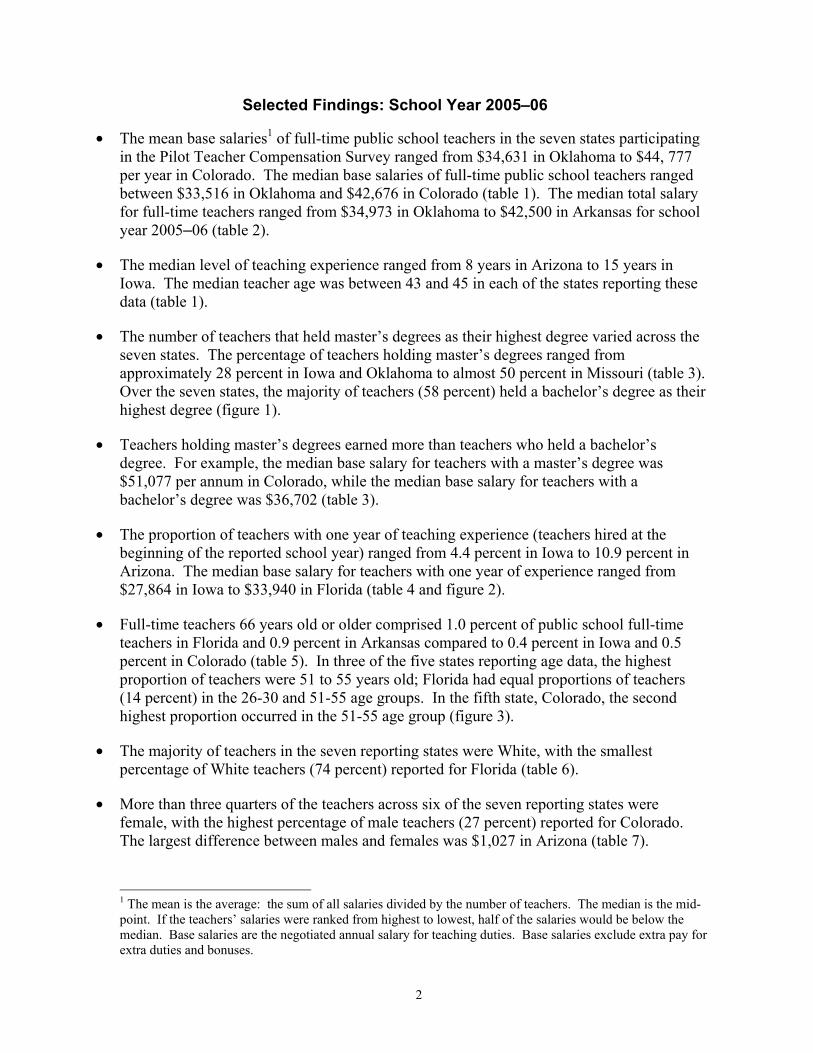
• The mean base salaries1 of full-time public school teachers in the seven states participating in the Pilot Teacher Compensation Survey ranged from $34,631 in Oklahoma to $44, 777 per year in Colorado. The median base salaries of full-time public school teachers ranged between $33,516 in Oklahoma and $42,676 in Colorado (table 1). The median total salary for full-time teachers ranged from $34,973 in Oklahoma to $42,500 in Arkansas for school year 2005–06 (table 2).
• The median level of teaching experience ranged from 8 years in Arizona to 15 years in
Iowa. The median teacher age was between 43 and 45 in each of the states reporting these data (table 1).
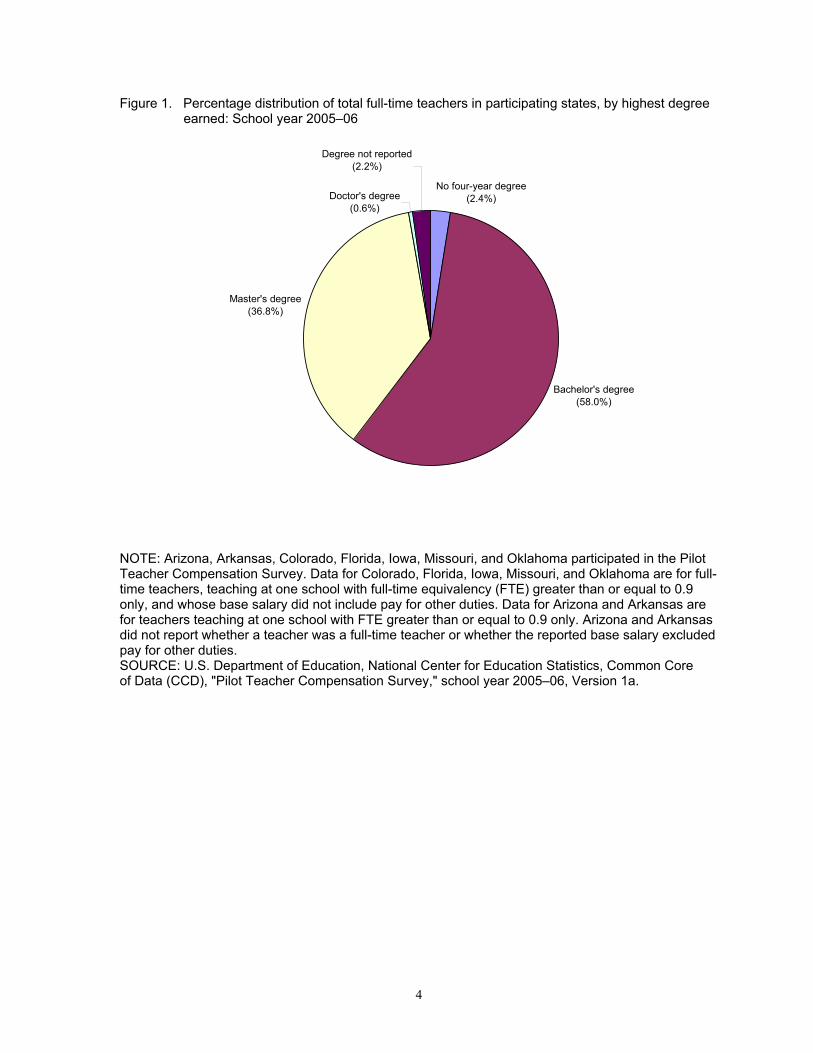
• The number of teachers that held master’s degrees as their highest degree varied across the
seven states. The percentage of teachers holding master’s degrees ranged from approximately 28 percent in Iowa and Oklahoma to almost 50 percent in Missouri (table 3). Over the seven states, the majority of teachers (58 percent) held a bachelor’s degree as their highest degree (figure 1).
• Teachers holding master’s degrees earned more than teachers who held a bachelor’s
degree. For example, the median base salary for teachers with a master’s degree was $51,077 per annum in Colorado, while the median base salary for teachers with a bachelor’s degree was $36,702 (table 3).
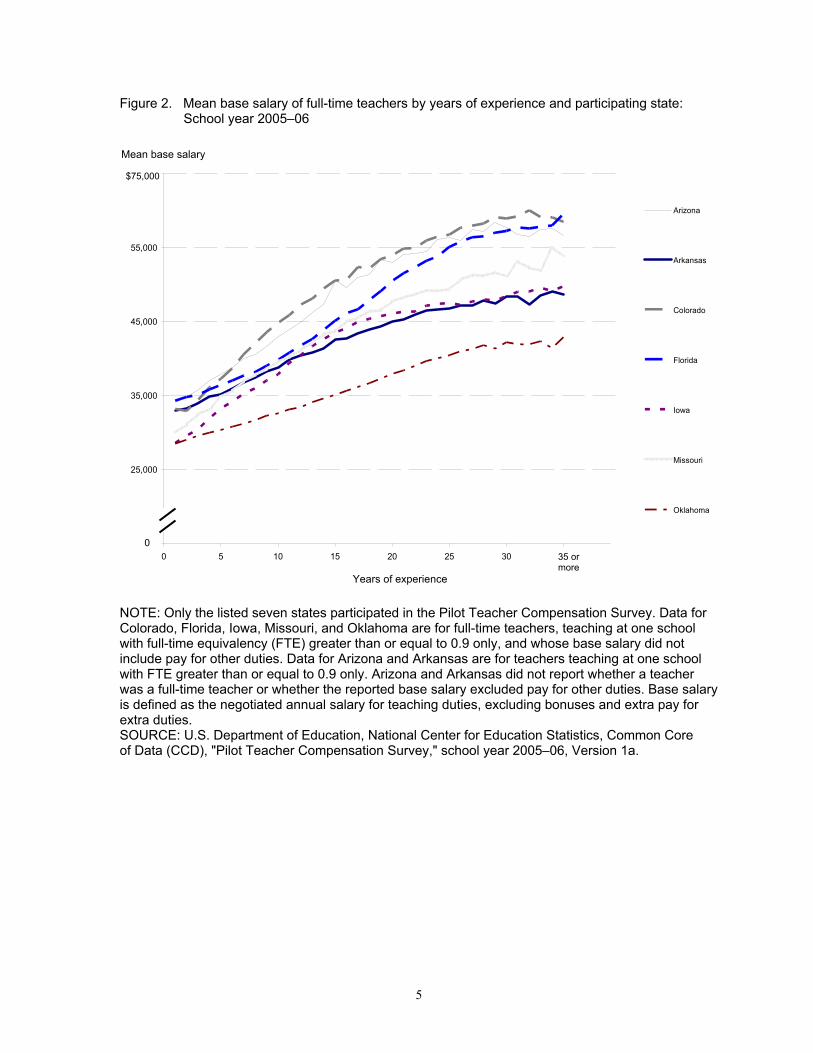
• The proportion of teachers with one year of teaching experience (teachers hired at the
beginning of the reported school year) ranged from 4.4 percent in Iowa to 10.9 percent in Arizona. The median base salary for teachers with one year of experience ranged from $27,864 in Iowa to $33,940 in Florida (table 4 and figure 2).
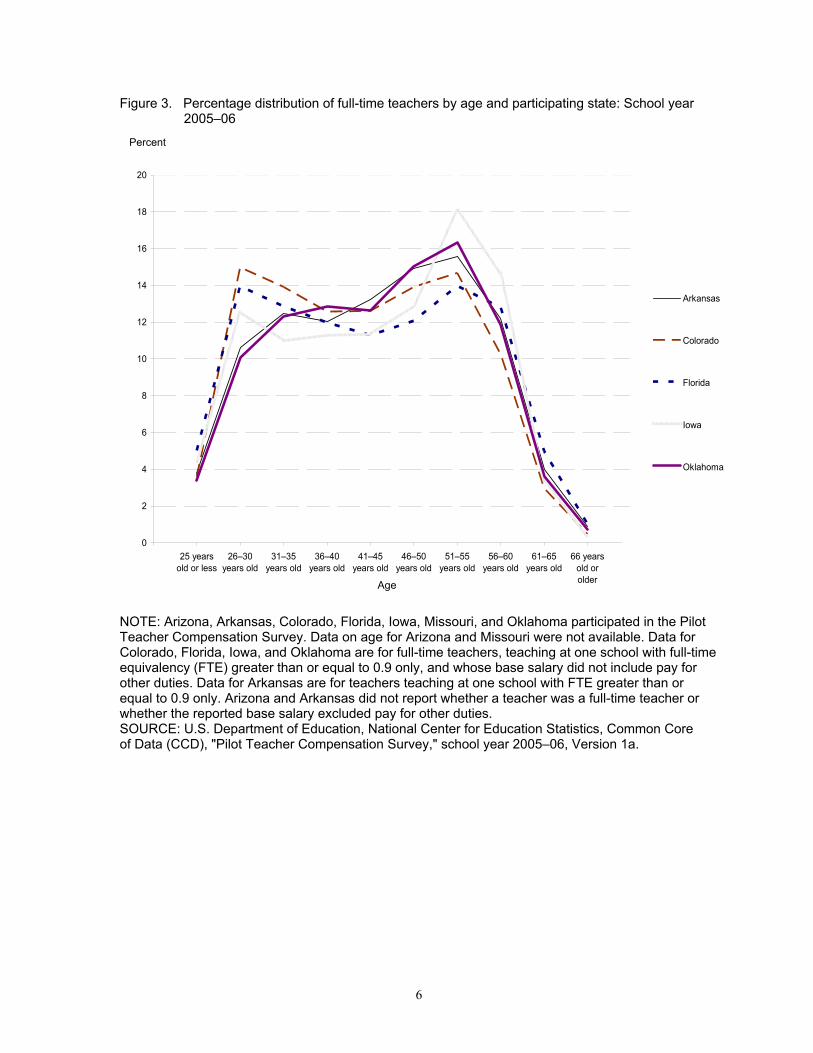
• Full-time teachers 66 years old or older comprised 1.0 percent of public school full-time
teachers in Florida and 0.9 percent in Arkansas compared to 0.4 percent in Iowa and 0.5 percent in Colorado (table 5). In three of the five states reporting age data, the highest proportion of teachers were 51 to 55 years old; Florida had equal proportions of teachers (14 percent) in the 26-30 and 51-55 age groups. In the fifth state, Colorado, the second highest proportion occurred in the 51-55 age group (figure 3).
• The majority of teachers in the seven reporting states were White, with the smallest
percentage of White teachers (74 percent) reported for Florida (table 6).
• More than three quarters of the teachers across six of the seven reporting states were female, with the highest percentage of male teachers (27 percent) reported for Colorado. The largest difference between males and females was $1,027 in Arizona (table 7).
1 The mean is the average: the sum of all salaries divided by the number of teachers. The median is the mid-point. If the teachers’ salaries were ranked from highest to lowest, half of the salaries would be below the median. Base salaries are the negotiated annual salary for teaching duties. Base salaries exclude extra pay for extra duties and bonuses.
3
References and Related Data Files References Ave, E.P., and Zhou, L. (2008). Documentation for the NCES Common Core of Data
Teacher Compensation Survey Restricted-use File, School Year 2005–06 [forthcoming 2008]. National Center for Education Statistics, Institute of Education Sciences, U.S. Department of Education. Washington, DC.
Berne, R., and Stiefel, L. (1984). The Measurement of Equity in School Finance: Conceptual,
Methodological, and Empirical Dimensions. Baltimore, MD: Johns Hopkins University Press.
Hussar, W., and Sonnenberg, W. (2000). Trends in Disparities in School District Level
Expenditures per Pupil (NCES 2000-020). U.S. Department of Education. Washington, DC: National Center for Education Statistics.
Parish, T.B., Matsumoto, C.S., and Fowler, W.J. (1995). Disparities in Public School District
Spending 1989–90 (NCES 95-300). U.S. Department of Education. Washington, DC: National Center for Education Statistics.
Related Data Files Data files for all CCD surveys may be found on the CCD data page of the CCD website at http://nces.ed.gov/ccd/ccddata.asp.
4
Figure 1. Percentage distribution of total full-time teachers in participating states, by highest degree earned: School year 2005–06
No four-year degree(2.4%)
Degree not reported(2.2%)
Doctor's degree(0.6%)
Master's degree(36.8%)
Bachelor's degree(58.0%)
NOTE: Arizona, Arkansas, Colorado, Florida, Iowa, Missouri, and Oklahoma participated in the Pilot Teacher Compensation Survey. Data for Colorado, Florida, Iowa, Missouri, and Oklahoma are for full-time teachers, teaching at one school with full-time equivalency (FTE) greater than or equal to 0.9 only, and whose base salary did not include pay for other duties. Data for Arizona and Arkansas are for teachers teaching at one school with FTE greater than or equal to 0.9 only. Arizona and Arkansas did not report whether a teacher was a full-time teacher or whether the reported base salary excluded pay for other duties. SOURCE: U.S. Department of Education, National Center for Education Statistics, Common Core of Data (CCD), "Pilot Teacher Compensation Survey," school year 2005–06, Version 1a.
5
Figure 2. Mean base salary of full-time teachers by years of experience and participating state: School year 2005–06
15,000
25,000
35,000
45,000
55,000
65,000
0 5 10 15 20 25 30 35 40
Arizona
Arkansas
Colorado
Florida
Iowa
Missouri
Oklahoma
NOTE: Only the listed seven states participated in the Pilot Teacher Compensation Survey. Data for Colorado, Florida, Iowa, Missouri, and Oklahoma are for full-time teachers, teaching at one school with full-time equivalency (FTE) greater than or equal to 0.9 only, and whose base salary did not include pay for other duties. Data for Arizona and Arkansas are for teachers teaching at one school with FTE greater than or equal to 0.9 only. Arizona and Arkansas did not report whether a teacher was a full-time teacher or whether the reported base salary excluded pay for other duties. Base salary is defined as the negotiated annual salary for teaching duties, excluding bonuses and extra pay for extra duties. SOURCE: U.S. Department of Education, National Center for Education Statistics, Common Core of Data (CCD), "Pilot Teacher Compensation Survey," school year 2005–06, Version 1a.
Mean base salary
Years of experience
0
$75,000
35 or more
6
Figure 3. Percentage distribution of full-time teachers by age and participating state: School year 2005–06
0
2
4
6
8
10
12
14
16
18
20
25 yearsold or less
26–30years old
31–35years old
36–40years old
41–45years old
46–50years old
51–55years old
56–60years old
61–65years old
66 yearsold orolder
Arkansas
Colorado
Florida
Iowa
Oklahoma
NOTE: Arizona, Arkansas, Colorado, Florida, Iowa, Missouri, and Oklahoma participated in the Pilot Teacher Compensation Survey. Data on age for Arizona and Missouri were not available. Data for Colorado, Florida, Iowa, and Oklahoma are for full-time teachers, teaching at one school with full-time equivalency (FTE) greater than or equal to 0.9 only, and whose base salary did not include pay for other duties. Data for Arkansas are for teachers teaching at one school with FTE greater than or equal to 0.9 only. Arizona and Arkansas did not report whether a teacher was a full-time teacher or whether the reported base salary excluded pay for other duties. SOURCE: U.S. Department of Education, National Center for Education Statistics, Common Core of Data (CCD), "Pilot Teacher Compensation Survey," school year 2005–06, Version 1a.
Percent
Age
Participating state
Total number of full-time teachers
Median years of teachingexperience
Median age
Median number of days in
teacher contract
Median
base salary1Mean
base salary1
Arizona 49,385 8 — — $40,296 $42,772
Arkansas 28,633 13 45 190 39,969 40,981
Colorado 41,431 9 43 184 42,676 44,777
Florida 137,405 10 43 196 38,014 41,740
Iowa 28,054 15 45 191 40,935 41,145
Missouri 59,991 10 — 183 37,802 40,602
Oklahoma 36,476 12 45 180 33,516 34,631
Table 1.—Total number of full-time teachers and median years of teaching experience, age, contract days, and base salary, and
SOURCE: U.S. Department of Education, National Center for Education Statistics, Common Core of Data (CCD), "Pilot Teacher Compensation Survey," school year 2005–06, Version 1a.
NOTE: How to read this table (medians): Using Arizona, years of teaching experience as an example, if all full-time teachers
were listed by years of teaching experience, the teacher at the midpoint (median) would have 8 years of teaching experience.
Only the listed seven states participated in the Pilot Teacher Compensation Survey. Data for Colorado, Florida, Iowa, Missouri,
and Oklahoma are for full-time teachers, teaching at one school with full-time equivalency (FTE) greater than or equal to 0.9 only,
and whose base salary did not include pay for other duties. Data for Arizona and Arkansas are for teachers teaching at one school
with FTE greater than or equal to 0.9 only. Arizona and Arkansas did not report whether a teacher was a full-time teacher or
whether the reported base salary excluded pay for other duties. Data are not adjusted for geographic cost differences.
Table 1.—mean base salary, by participating state: School year 2005–06
— Not available.1 Base salary is defined as the negotiated annual salary for teaching duties, excluding bonuses and extra pay for extra duties.
7
Participating Median
state total salary1 Total Health2 Retirement All other3
Arizona $40,296 — — — —
Arkansas 42,500 ‡ ‡ $5,763 $3,283
Colorado — — — — —
Florida 40,600 $10,731 $4,647 3,183 3,529
Iowa 41,449 — — — —
Missouri 39,900 — — — —
Oklahoma 34,973 ‡ ‡ 3,773 ‡
— Not available.
Table 2.—Median total salary and government expenditures for total benefits, health benefits, retirement benefits, and all other
Table 2.—benefits, by participating state: School year 2005–06
Median government expenditures on benefits
‡ Reporting standards not met. Data were missing for more than 20 percent of teachers in the state.
2 Health benefits were missing 31.7 percent of full-time teachers in Arkansas and 25.4 percent of full-time teachers in Oklahoma.
NOTE: How to read this table (medians): Using Arizona, median total salary as an example, if all full-time teachers were listed by
total salary, the teacher at the midpoint (median) would have a total salary of $40,296. Only the listed seven states participated in
the Pilot Teacher Compensation Survey. Data for Colorado, Florida, Iowa, Missouri, and Oklahoma are for full-time teachers,
teaching at one school with full-time equivalency (FTE) greater than or equal to 0.9 only, and whose base salary did not include
pay for other duties. Data for Arizona and Arkansas are for teachers teaching at one school with FTE greater than or equal to 0.9
only. Arizona and Arkansas did not report whether a teacher was a full-time teacher or whether the reported base salary excluded
pay for other duties. Data are not adjusted for geographic cost differences. Detail may not sum to totals because of rounding.
SOURCE: U.S. Department of Education, National Center for Education Statistics, Common Core of Data (CCD), "Pilot Teacher Compensation Survey," school year 2005–06, Version 1a.
3 All other benefits were missing 36.3 percent of full-time teachers in Oklahoma.
1 Total salary is defined as the total amount of money paid to the teacher for school year 2005–06.
8
Participating state Number
Percentage distribution
Median base
salary1 NumberPercentage distribution
Medianbase
salary1 NumberPercentage distribution
Medianbase
salary1 NumberPercentage distribution
Medianbase
salary1 NumberPercentage distribution
Medianbase
salary1
Arizona 0 0.0 † 26,955 54.6 $36,917 22,071 44.7 $45,938 359 0.7 $51,257 0 0.0 †
Arkansas 14 0.1 $33,325 10,925 38.2 38,614 9,314 32.5 44,339 96 0.3 52,706 8,284 28.9 $36,109
Colorado 169 0.4 33,000 21,364 51.6 36,702 19,465 47.0 51,077 393 1.0 51,205 40 0.1 33,301
Florida 8,324 6.1 34,792 86,237 62.8 35,800 41,733 30.4 44,496 1,111 0.8 50,314 0 0.0 †
Iowa 34 0.1 34,718 20,152 71.8 37,964 7,818 27.9 49,610 50 0.2 58,008 0 0.0 †
Missouri 428 0.7 36,715 29,506 49.2 33,400 29,779 49.6 44,580 262 0.4 56,672 16 # 34,000
Oklahoma 63 0.2 29,575 26,149 71.7 32,118 10,088 27.7 38,150 175 0.5 38,618 1 # 45,800
9
# Rounds to zero.1 Base salary is defined as the negotiated annual salary for teaching duties, excluding bonuses and extra pay for extra duties.
NOTE: How to read this table (medians): Using Arizona, bachelor's degree as an example, if all full-time teachers with a bachelor's degree were listed by base salary, the teacher at the midpoint (median) would have a base salary of $36,917. Only the listed seven states participated in the Pilot Teacher Compensation Survey. Data for Colorado, Florida, Iowa, Missouri, and Oklahoma are for full-time teachers, teaching at one school with full-time equivalency (FTE) greater than or equal to 0.9 only, and whose base salary did not include pay for other duties. Data for Arizona and Arkansas are for teachers teaching at one school with FTE greater than or equal to 0.9 only. Arizona and Arkansas did not report whether a teacher was a full-time teacher or whether the reported base salary excluded pay for other duties. Data are not adjusted for geographic cost differences. Detail may not sum to totals because of rounding.
SOURCE: U.S. Department of Education, National Center for Education Statistics, Common Core of Data (CCD), "Pilot Teacher Compensation Survey," school year 2005–06, Version 1a.
Doctor's degree Degree not reported
Table 3.—Number of full-time teachers, percentage distribution, and median base salary, by highest degree earned and participating state: School year 2005–06
† Not applicable.
No four-year degree Bachelor's degree Master's degree
Participating state Number
Percent-age
distribution
Median base
salary1 Number
Percent-age
distribution
Medianbase
salary1 Number
Percent-age
distribution
Medianbase
salary1 Number
Percent-age
distribution
Medianbase
salary1 Number
Percent-age
distribution
Medianbase
salary1 Number
Percent-age
distribution
Medianbase
salary1
Arizona 5,393 10.9 $33,933 13,019 26.4 $35,824 11,955 24.2 $39,849 12,570 25.5 $47,549 5,494 11.1 $56,631 950 1.9 $58,000
Arkansas 1,629 5.7 31,522 5,054 17.7 33,265 5,432 19.0 36,804 7,787 27.2 41,425 6,277 21.9 45,785 2,454 8.6 47,751
Colorado 3,190 7.7 32,608 9,780 23.6 34,348 9,406 22.7 41,067 10,943 26.4 50,331 6,541 15.8 57,952 1,571 3.8 61,027
Florida 11,389 8.3 33,940 27,668 20.1 34,825 23,235 16.9 37,205 26,963 19.6 43,407 19,653 14.3 54,249 9,017 6.6 57,226
Iowa 1,232 4.4 27,864 4,410 15.7 30,872 5,145 18.3 35,755 7,214 25.7 42,968 6,476 23.1 46,825 3,577 12.8 48,753
Missouri 3,977 6.6 29,706 12,866 21.5 32,280 13,768 23.0 36,644 16,272 27.1 42,265 10,569 17.6 48,053 2,538 4.2 52,661
Oklahoma 2,040 5.6 28,100 6,109 16.8 29,500 8,277 22.7 31,400 10,298 28.2 34,860 7,604 20.9 39,800 2,148 5.9 41,900
10
11–20 years 21–30 years Over 30 years
Table 4.—Number of full-time teachers, percentage distribution, and median base salary, by years of experience and participating state: School year 2005–06
1 Year 2–5 years 6–10 years
1 Base salary is defined as the negotiated annual salary for teaching duties, excluding bonuses and extra pay for extra duties.
NOTE: How to read this table (medians): Using Arizona, 1 year of experience as an example, if all full-time teachers with 1 year of experience were listed by base salary, the teacher at the midpoint (median) would have a base salary of $33,933. Only the listed seven states participated in the Pilot Teacher Compensation Survey. Data for Colorado, Florida, Iowa, Missouri, and Oklahoma are for full-time teachers, teaching at one school with full-time equivalency (FTE) greater than or equal to 0.9 only, and whose base salary did not include pay for other duties. Data for Arizona and Arkansas are for teachers teaching at one school with FTE greater than or equal to 0.9 only. Arizona and Arkansas did not report whether a teacher was a full-time teacher or whether the reported base salary excluded pay for other duties. Data are not adjusted for geographic cost differences. Detail may not sum to totals because of rounding.
SOURCE: U.S. Department of Education, National Center for Education Statistics, Common Core of Data (CCD), "Pilot Teacher Compensation Survey," school year 2005–06, Version 1a.
Participating state Number
Percent-age
distribution
Median base
salary1 Number
Percent-age
distribution
Medianbase
salary1 Number
Percent-age
distribution
Median base
salary1 Number
Percent-age
distribution
Medianbase
salary1 Number
Percent-age
distribution
Medianbase
salary1
Arizona — — — — — — — — — — — — — — —
Arkansas 1,082 3.8 $31,527 3,039 10.6 $33,650 3,569 12.5 $36,198 3,442 12.0 $38,148 3,796 13.3 $40,400
Colorado 1,494 3.6 30,801 6,208 15.0 34,131 5,767 13.9 38,849 5,212 12.6 42,733 5,228 12.6 45,267
Florida 6,901 5.0 33,088 19,184 14.0 34,068 17,675 12.9 35,355 16,465 12.0 36,867 15,512 11.3 38,700
Iowa 1,237 4.4 28,198 3,524 12.6 31,582 3,082 11.0 36,001 3,167 11.3 39,212 3,181 11.3 41,913
Missouri — — — — — — — — — — — — — — —
Oklahoma 1,229 3.4 28,375 3,679 10.1 29,478 4,495 12.3 30,908 4,681 12.8 32,350 4,599 12.6 33,732
31–35 years old
11
See notes at end of table.
36–40 years old 41–45 years old
Table 5.—Number of full-time teachers, percentage distribution, and median base salary, by age and participating state: School year 2005–06
25 years old or less 26–30 years old
Participating state Number
Percent-age
distribution
Median base
salary1 Number
Percent-age
distribution
Medianbase
salary1 Number
Percent-age
distribution
Medianbase
salary1 Number
Percent-age
distribution
Medianbase
salary1 Number
Percent-age
distribution
Medianbase
salary1 Number
Percent-age
distribution
Medianbase
salary1
Arizona — — — — — — — — — — — — — — — 49,385 100.0 $40,296
Arkansas 4,279 14.9 $42,400 4,455 15.6 $43,977 3,493 12.2 $45,063 1,139 4.0 $46,268 262 0.9 $44,659 77 0.3 32,500
Colorado 5,764 13.9 48,461 6,081 14.7 52,310 4,250 10.3 54,163 1,231 3.0 54,184 196 0.5 52,074 0 0.0 †
Florida 16,592 12.1 42,004 19,203 14.0 48,465 17,589 12.8 52,570 6,852 5.0 53,619 1,421 1.0 53,795 11 # 33,999
Iowa 3,616 12.9 43,838 5,071 18.1 45,932 4,121 14.7 46,934 947 3.4 47,276 108 0.4 48,076 0 0.0 †
Missouri — — — — — — — — — — — — — — — 59,991 100.0 37,802
Oklahoma 5,483 15.0 36,035 5,967 16.4 38,300 4,334 11.9 38,748 1,326 3.6 39,500 257 0.7 39,075 426 1.2 30,858
NOTE: How to read this table (medians): Using Arkansas, 25 years old or less as an example, if all full-time teachers 25 years old or less were listed by base salary, the teacher at the midpoint (median) would have a base salary of $31,527. Only the listed seven states participated in the Pilot Teacher Compensation Survey. Data for Colorado, Florida, Iowa, Missouri, and Oklahoma are for full-time teachers, teaching at one school with full-time equivalency (FTE) greater than or equal to 0.9 only, and whose base salary did not include pay for other duties. Data for Arizona and Arkansas are for teachers teaching at one school with FTE greater than or equal to 0.9 only. Arizona and Arkansas did not report whether a teacher was a full-time teacher or whether the reported base salary excluded pay for other duties. Data are not adjusted for geographic cost differences. Detail may not sum to totals because of rounding.
SOURCE: U.S. Department of Education, National Center for Education Statistics, Common Core of Data (CCD), "Pilot Teacher Compensation Survey," school year 2005–06, Version 1a.
12
— Not available.
† Not applicable.
# Rounds to zero.1 Base salary is defined as the negotiated annual salary for teaching duties, excluding bonuses and extra pay for extra duties.
61–65 years old 66 years old or older Age not reported
Table 5.—Number of full-time teachers, percentage distribution, and median base salary, by age and participating state: School year 2005–06—Continued
46–50 years old 51–55 years old 56–60 years old
Participating state Number
Percentage distribution
Median base
salary1 NumberPercentage distribution
Medianbase
salary1 NumberPercentage distribution
Median base
salary1 NumberPercentage distribution
Medianbase
salary1 NumberPercentage distribution
Medianbase
salary1
Arizona 1,132 2.3 $38,159 545 1.1 $39,379 5,636 11.4 $38,844 1,041 2.1 $40,406 41,031 83.1 $40,654
Arkansas 177 0.6 41,288 56 0.2 39,922 103 0.4 40,263 2,719 9.5 42,183 25,578 89.3 39,738
Colorado 193 0.5 43,143 415 1.0 41,480 2,821 6.8 41,750 663 1.6 43,940 37,339 90.1 42,754
Florida 382 0.3 38,952 1,241 0.9 35,623 14,000 10.2 37,205 19,811 14.4 37,936 101,971 74.2 38,200
Iowa 67 0.2 39,927 100 0.4 38,826 157 0.6 39,940 217 0.8 39,695 27,513 98.1 40,971
Missouri 82 0.1 34,290 181 0.3 39,258 305 0.5 38,355 4,231 7.1 44,485 55,191 92.0 37,381
Oklahoma 1,477 4.1 32,457 142 0.4 31,817 295 0.8 31,407 1,289 3.5 36,568 33,273 91.2 33,5101 Base salary is defined as the negotiated annual salary for teaching duties, excluding bonuses and extra pay for extra duties.
NOTE: How to read this table (medians): Using Arizona, American Indian/Alaska Native as an example, if all American Indian/Alaska Native full-time teachers were listed by base salary, the teacher at the midpoint (median) would have a base salary of $38,159. Only the listed seven states participated in the Pilot Teacher Compensation Survey. Data for Colorado, Florida, Iowa, Missouri, and Oklahoma are for full-time teachers, teaching at one school with full-time equivalency (FTE) greater than or equal to 0.9 only, and whose base salary did not include pay for other duties. Data for Arizona and Arkansas are for teachers teaching at one school with FTE greater than or equal to 0.9 only. Arizona and Arkansas did not report whether a teacher was a full-time teacher or whether the reported base salary excluded pay for other duties. Data are not adjusted for geographic cost differences. Detail may not sum to totals because of rounding.
SOURCE: U.S. Department of Education, National Center for Education Statistics, Common Core of Data (CCD), "Pilot Teacher Compensation Survey," school year 2005–06, Version 1a.13
White, non-Hispanic
Table 6.—Number of full-time teachers, percentage distribution, and median base salary, by race/ethnicity and participating state: School year 2005–06
American Indian/Alaska native Asian/Pacific Islander Hispanic Black, non-Hispanic
Participating state Number
Percentage distribution
Median
base salary1 NumberPercentage distribution
Median
base salary1
Arizona 11,967 24.2 $41,027 37,418 75.8 $40,000
Arkansas 5,300 18.5 39,631 23,333 81.5 40,021
Colorado 11,216 27.1 42,913 30,215 72.9 42,577
Florida 29,307 21.3 38,490 108,098 78.7 37,936
Iowa 5,144 18.3 41,641 22,910 81.7 40,754
Missouri 12,363 20.6 37,915 47,627 79.4 37,790
Oklahoma 7,457 20.4 33,722 29,019 79.6 33,460
Table 7.—Number of full-time teachers, percent distribution, and median base salary, by gender and participating state: School
NOTE: How to read this table (medians): Using Arizona, males as an example, if all male full-time teachers were listed by base
salary, the teacher at the midpoint (median) would have a base salary of $41,027. Only the listed seven states participated in the
Pilot Teacher Compensation Survey. Data for Colorado, Florida, Iowa, Missouri, and Oklahoma are for full-time teachers,
teaching at one school with full-time equivalency (FTE) greater than or equal to 0.9 only, and whose base salary did not include
pay for other duties. Data for Arizona and Arkansas are for teachers teaching at one school with FTE greater than or equal to 0.9
only. Arizona and Arkansas did not report whether a teacher was a full-time teacher or whether the reported base salary excluded
pay for other duties. Data are not adjusted for geographic cost differences. Detail may not sum to totals because of rounding. SOURCE: U.S. Department of Education, National Center for Education Statistics, Common Core of Data (CCD), "Pilot Teacher Compensation Survey," school year 2005–06, Version 1a.
Male Female
Table 7.—year 2005–06
1 Base salary is defined as the negotiated annual salary for teaching duties, excluding bonuses and extra pay for extra duties.
14
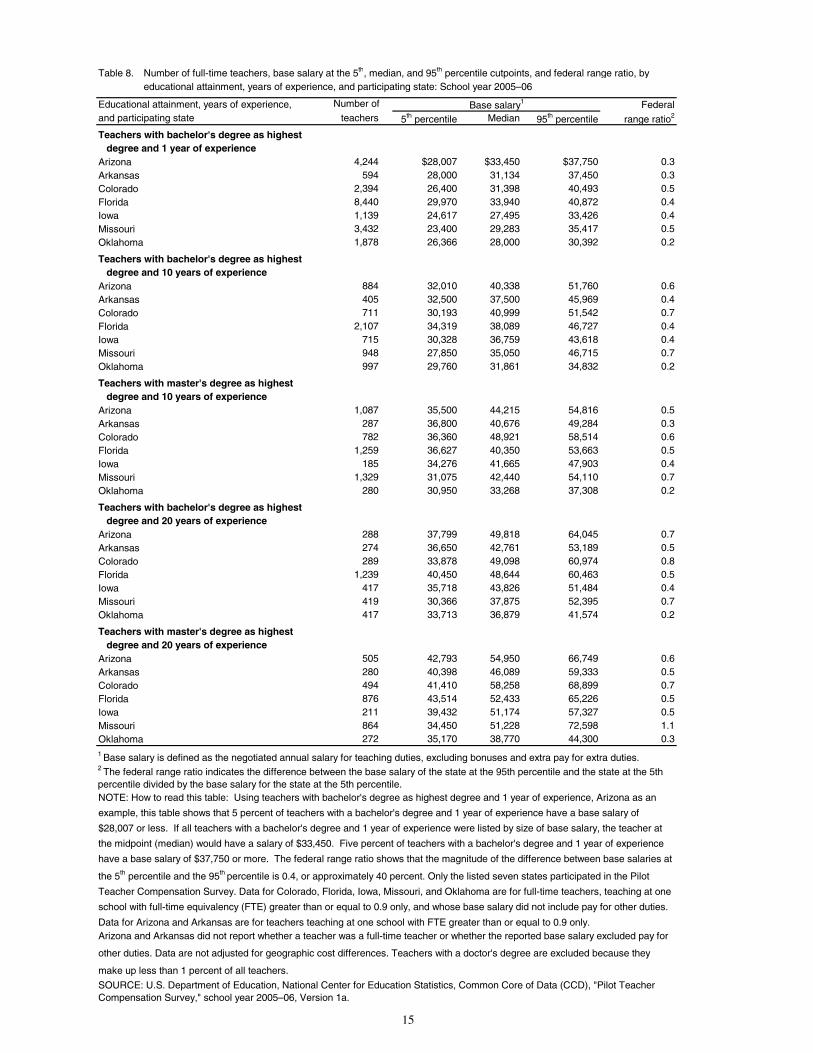
Table 8.—Number of full-time teachers, base salary at the 5th, median, and 95th percentile cutpoints, and federal range ratio, by Table 8.—educational attainment, years of experience, and participating state: School year 2005–06
Educational attainment, years of experience, Number of Federaland participating state teachers 5th percentile Median 95th percentile range ratio2
Teachers with bachelor's degree as highest degree and 1 year of experienceArizona 4,244 $28,007 $33,450 $37,750 0.3Arkansas 594 28,000 31,134 37,450 0.3Colorado 2,394 26,400 31,398 40,493 0.5Florida 8,440 29,970 33,940 40,872 0.4Iowa 1,139 24,617 27,495 33,426 0.4Missouri 3,432 23,400 29,283 35,417 0.5Oklahoma 1,878 26,366 28,000 30,392 0.2
Teachers with bachelor's degree as highest degree and 10 years of experienceArizona 884 32,010 40,338 51,760 0.6Arkansas 405 32,500 37,500 45,969 0.4Colorado 711 30,193 40,999 51,542 0.7Florida 2,107 34,319 38,089 46,727 0.4Iowa 715 30,328 36,759 43,618 0.4Missouri 948 27,850 35,050 46,715 0.7Oklahoma 997 29,760 31,861 34,832 0.2
Teachers with master's degree as highest degree and 10 years of experienceArizona 1,087 35,500 44,215 54,816 0.5Arkansas 287 36,800 40,676 49,284 0.3Colorado 782 36,360 48,921 58,514 0.6Florida 1,259 36,627 40,350 53,663 0.5Iowa 185 34,276 41,665 47,903 0.4Missouri 1,329 31,075 42,440 54,110 0.7Oklahoma 280 30,950 33,268 37,308 0.2
Teachers with bachelor's degree as highest degree and 20 years of experienceArizona 288 37,799 49,818 64,045 0.7Arkansas 274 36,650 42,761 53,189 0.5Colorado 289 33,878 49,098 60,974 0.8Florida 1,239 40,450 48,644 60,463 0.5Iowa 417 35,718 43,826 51,484 0.4Missouri 419 30,366 37,875 52,395 0.7Oklahoma 417 33,713 36,879 41,574 0.2
Teachers with master's degree as highest degree and 20 years of experienceArizona 505 42,793 54,950 66,749 0.6Arkansas 280 40,398 46,089 59,333 0.5Colorado 494 41,410 58,258 68,899 0.7Florida 876 43,514 52,433 65,226 0.5Iowa 211 39,432 51,174 57,327 0.5Missouri 864 34,450 51,228 72,598 1.1Oklahoma 272 35,170 38,770 44,300 0.3
SOURCE: U.S. Department of Education, National Center for Education Statistics, Common Core of Data (CCD), "Pilot Teacher Compensation Survey," school year 2005–06, Version 1a.
1 Base salary is defined as the negotiated annual salary for teaching duties, excluding bonuses and extra pay for extra duties.
Arizona and Arkansas did not report whether a teacher was a full-time teacher or whether the reported base salary excluded pay for
other duties. Data are not adjusted for geographic cost differences. Teachers with a doctor's degree are excluded because they
make up less than 1 percent of all teachers.
Base salary1
2 The federal range ratio indicates the difference between the base salary of the state at the 95th percentile and the state at the 5th percentile divided by the base salary for the state at the 5th percentile.NOTE: How to read this table: Using teachers with bachelor's degree as highest degree and 1 year of experience, Arizona as an
example, this table shows that 5 percent of teachers with a bachelor's degree and 1 year of experience have a base salary of
$28,007 or less. If all teachers with a bachelor's degree and 1 year of experience were listed by size of base salary, the teacher at
the midpoint (median) would have a salary of $33,450. Five percent of teachers with a bachelor's degree and 1 year of experience
have a base salary of $37,750 or more. The federal range ratio shows that the magnitude of the difference between base salaries at
the 5th percentile and the 95th percentile is 0.4, or approximately 40 percent. Only the listed seven states participated in the Pilot
Teacher Compensation Survey. Data for Colorado, Florida, Iowa, Missouri, and Oklahoma are for full-time teachers, teaching at one
school with full-time equivalency (FTE) greater than or equal to 0.9 only, and whose base salary did not include pay for other duties.
Data for Arizona and Arkansas are for teachers teaching at one school with FTE greater than or equal to 0.9 only.
15
16
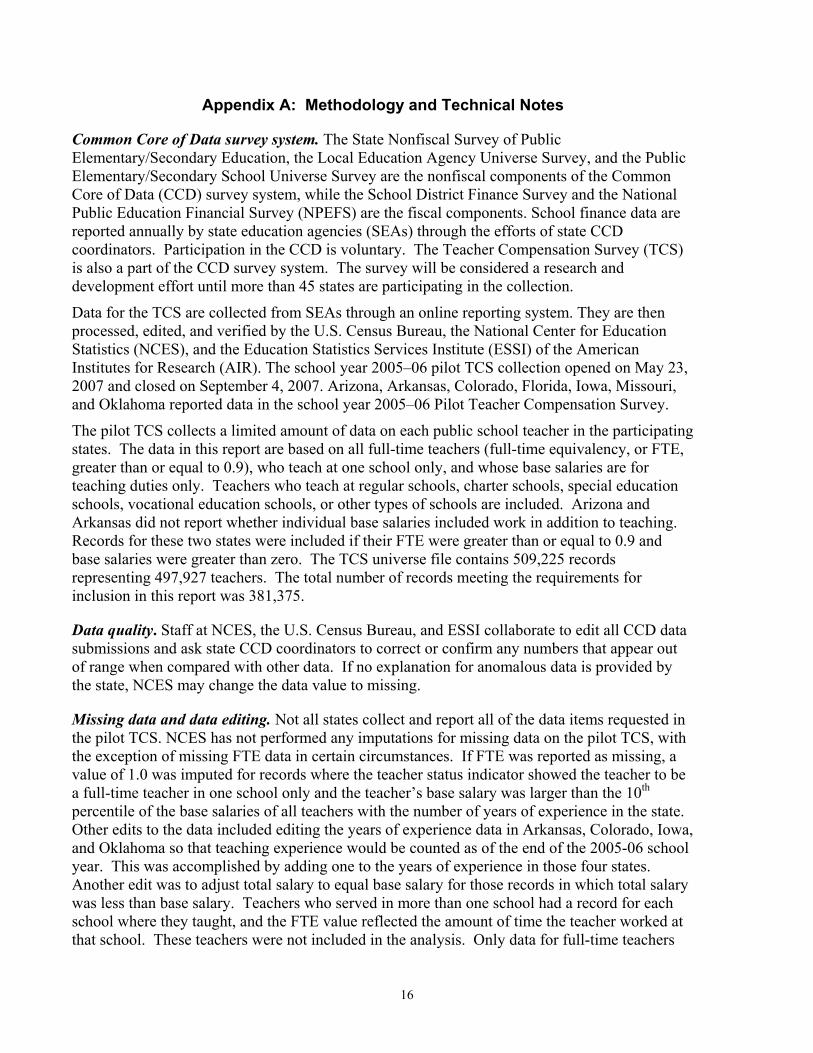
Appendix A: Methodology and Technical Notes
Common Core of Data survey system. The State Nonfiscal Survey of Public Elementary/Secondary Education, the Local Education Agency Universe Survey, and the Public Elementary/Secondary School Universe Survey are the nonfiscal components of the Common Core of Data (CCD) survey system, while the School District Finance Survey and the National Public Education Financial Survey (NPEFS) are the fiscal components. School finance data are reported annually by state education agencies (SEAs) through the efforts of state CCD coordinators. Participation in the CCD is voluntary. The Teacher Compensation Survey (TCS) is also a part of the CCD survey system. The survey will be considered a research and development effort until more than 45 states are participating in the collection.
Data for the TCS are collected from SEAs through an online reporting system. They are then processed, edited, and verified by the U.S. Census Bureau, the National Center for Education Statistics (NCES), and the Education Statistics Services Institute (ESSI) of the American Institutes for Research (AIR). The school year 2005–06 pilot TCS collection opened on May 23, 2007 and closed on September 4, 2007. Arizona, Arkansas, Colorado, Florida, Iowa, Missouri, and Oklahoma reported data in the school year 2005–06 Pilot Teacher Compensation Survey.
The pilot TCS collects a limited amount of data on each public school teacher in the participating states. The data in this report are based on all full-time teachers (full-time equivalency, or FTE, greater than or equal to 0.9), who teach at one school only, and whose base salaries are for teaching duties only. Teachers who teach at regular schools, charter schools, special education schools, vocational education schools, or other types of schools are included. Arizona and Arkansas did not report whether individual base salaries included work in addition to teaching. Records for these two states were included if their FTE were greater than or equal to 0.9 and base salaries were greater than zero. The TCS universe file contains 509,225 records representing 497,927 teachers. The total number of records meeting the requirements for inclusion in this report was 381,375.
Data quality. Staff at NCES, the U.S. Census Bureau, and ESSI collaborate to edit all CCD data submissions and ask state CCD coordinators to correct or confirm any numbers that appear out of range when compared with other data. If no explanation for anomalous data is provided by the state, NCES may change the data value to missing.
Missing data and data editing. Not all states collect and report all of the data items requested in the pilot TCS. NCES has not performed any imputations for missing data on the pilot TCS, with the exception of missing FTE data in certain circumstances. If FTE was reported as missing, a value of 1.0 was imputed for records where the teacher status indicator showed the teacher to be a full-time teacher in one school only and the teacher’s base salary was larger than the 10th percentile of the base salaries of all teachers with the number of years of experience in the state. Other edits to the data included editing the years of experience data in Arkansas, Colorado, Iowa, and Oklahoma so that teaching experience would be counted as of the end of the 2005-06 school year. This was accomplished by adding one to the years of experience in those four states. Another edit was to adjust total salary to equal base salary for those records in which total salary was less than base salary. Teachers who served in more than one school had a record for each school where they taught, and the FTE value reflected the amount of time the teacher worked at that school. These teachers were not included in the analysis. Only data for full-time teachers
17
teaching at one school were used in this report. The age of a teacher was derived from the birth year data reported by the state. Age was calculated by subtracting the birth year from 2006.
Fifth, median, and 95th percentile cutpoints. The 5th percentile is a value such that 5 percent of the observations are less than this value and that 95 percent are greater. The 95th percentile is a value such that 95 percent of the observations are less than this value and that 5 percent are greater. The 5th and 95th percentile cutpoints have been chosen to exclude any outlier data. A median is a number dividing the higher half of a population from the lower half. The median can be found by arranging all the observations from lowest value to highest value and picking the middle one.
Federal range ratio. The federal range ratio is used in this report as an indicator of the difference between teachers with relatively high base salaries and teachers with relatively low base salaries. As used by Berne and Stiefel (1984) and in previous NCES publications (Parish, Matsumoto, and Fowler 1995; Hussar and Sonnenberg 2000), the federal range ratio excludes the top and bottom 5 percent of districts in order to reduce the influence of extreme values. The federal range ratio is the difference between the base salaries of the teacher at the 95th percentile and the teacher at the 5th percentile divided by the amount for the teacher at the 5th percentile.
Comparability of data across states. There are some issues affecting the comparability of these data that have not been resolved. These include inconsistencies in the reported data themselves and differences in reporting. NCES continues to identify these inconsistencies and will work with state education agencies to reduce them as much as possible. A major factor regarding the comparability of the data is differences in salaries and other costs in different areas within states and across the country, i.e., it costs more to hire a teacher in one part of the country than it does to hire a teacher with the same qualifications in another part of the country. This report does not take into account cost differences across the states or within states.
Confidentiality protection. In order to prevent the identification of an individual teacher with certainty, some data items were swapped between records. These changes resulted in a minimal amount of change to the file overall.
18
Appendix B: Common Core of Data Glossary all other benefits—All the other benefits (excluding retirement and health insurance) paid by the school district and other government agencies for teachers. American Indian/Alaska Native—A person having origins in any of the original peoples of North and South America (including Central America), and who maintains tribal affiliation or community attachment. Asian/Pacific Islander—A person having origins in any of the original peoples of the Far East, Southeast Asia, or the Indian subcontinent, including, for example, Cambodia, China, India, Japan, Korea, Malaysia, Pakistan, the Philippine Islands, Thailand, and Vietnam.
bachelor’s degree—An award (baccalaureate or equivalent degree, as determined by the Secretary, U.S. Department of Education) that normally requires at least four but not more than five years of full-time equivalent college-level work. This includes all bachelor's degrees conferred in a five-year cooperative (work-study) program. A cooperative plan provides for alternate class attendance and employment in business, industry, or government; thus, it allows students to combine actual work experience with their college studies. Also includes bachelor's degrees in which the normal four years of work are completed in three years. base salary—The negotiated annual salary for teaching duties for school year 2005–06. The base salary excludes pay for additional duties, such as supervising or directing after-school activities, school administration activities, and or teaching summer school or adult education classes. Bonuses and other incentives are not included in base salaries. Black or African American—A person having origins in any of the black racial groups of Africa, and who is not Hispanic. doctor’s degree—The highest award a student can earn for graduate study. The doctor's degree classification includes such degrees as Doctor of Education, Doctor of Juridical Science, Doctor of Public Health, and the Doctor of Philosophy degree in any field such as agronomy, food technology, education, engineering, public administration, ophthalmology, or radiology. full-time equivalency (FTE)—State (or district’s) FTE value for this teacher. The amount of time required to perform teaching assignment stated as a proportion of a full-time position. FTE is computed by dividing the amount of time employed by the time normally required for a full-time position. gender—Indicates whether the teacher is female or male. health benefits—All amounts paid by school district and other government agencies for teachers’ health insurance.
19
highest degree earned—A degree is an award conferred by a college, university, or other postsecondary education institution as official recognition for the successful completion of a program of studies. Hispanic or Latino—A person of Cuban, Mexican, Puerto Rican, Cuban, South or Central American, or other Spanish culture or origin, regardless of race.
master’s degree—An award that normally requires the successful completion of a program of study of at least the full-time equivalent of one or two academic years of work beyond the bachelor's degree. race/ethnicity—Categories used to describe groups with which individuals identify, or to which they belong in the eyes of the community. The categories do not denote scientific definitions of anthropological origins. A person may be counted in only one group. retirement benefits—All amounts paid by the school district, municipal, state, and other governments towards a teacher’s retirement plan. teacher—A professional school staff member who provides instructions to prekindergarten, kindergarten, grades 1 through 12, or ungraded classes and maintains daily student attendance records. total benefits—Sum of retirement, health, and all other benefits, or total benefits paid by the district and/or state if unable to break out retirement and health benefits. total salary—The total amount of money paid to a teacher by the school district (for school year 2005–06). White—A person having origins in any of the original peoples of Europe, the Middle East, or North Africa, and who is not Hispanic. years of experience—Years of teaching experience recognized by the school district or state education agency as of the end of the school year. New full-time teachers, hired at the beginning of the school year (with no previous experience), are reported as having one year of experience.