Embed Size (px)
Citation preview
Aa
TDKa
b
c
d
4e
f
h
�
�
�
�
a
ARRAA
KCCIC
7
0h
Analytica Chimica Acta 751 (2012) 176– 181
Contents lists available at SciVerse ScienceDirect
Analytica Chimica Acta
jou rn al hom epa ge: www.elsev ier .com/ locate /aca
nalysis of cytokinin nucleotides by capillary zone electrophoresis with dioderray and mass spectrometric detection in a recombinant enzyme in vitro reaction
ibor Béresa,b,1, Markéta Gemrotováa,b,1, Petr Tarkowskib, Markus Ganzerac, Vítezslav Maierd,avid Friedeckye, Marco A. Dessoyf, Ludger A. Wessjohannf, Lukás Spíchala,b,∗, Miroslav Strnada,b,arel Dolezal a,b
Laboratory of Growth Regulators, Institute of Experimental Botany ASCR, Slechtitelu 11, 783 71 Olomouc, Czech RepublicCentre of the Region Haná for Biotechnological and Agricultural Research, Faculty of Science, Palacky University, Slechtitelu 11, 783 71 Olomouc, Czech RepublicInstitute of Pharmacy, Pharmacognosy, University of Innsbruck, Innrain 52, 6020 Innsbruck, AustriaRegional Centre for Advanced Technologies and Materials, Department of Analytical Chemistry, Faculty of Science, Palacky University in Olomouc, 17. listopadu 12, Olomouc 7716, Czech RepublicDepartment of Clinical Biochemistry, Laboratory for Inherited Metabolic Disorders, University Hospital and Palacky University, I.P. Pavlova 6, 775 20 Olomouc, Czech RepublicLeibniz Institute of Plant Biochemistry, Department of Bioorganic Chemistry, Weinberg 3, D-06120 Halle (Saale), Germany
i g h l i g h t s
We describe a capillary elec-trophoresis based enzymaticassay.Cytokinin mono-, di- and triphos-phates were separated by CE for thefirst time.The products of enzymatic reac-tions were unambigously identifiedby HPLC-QqTOF-MS.Undesirable changes in sub-strates/products were observed.
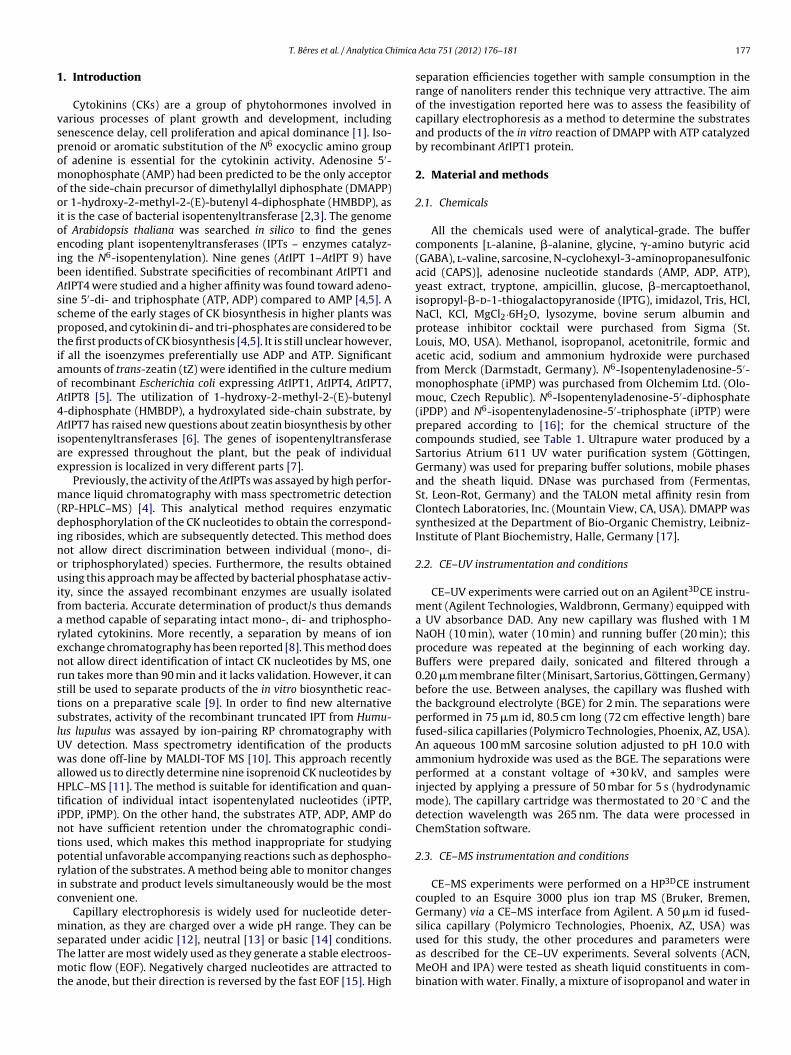
g r a p h i c a l a b s t r a c t
r t i c l e i n f o
rticle history:eceived 27 June 2012eceived in revised form 20 August 2012ccepted 22 August 2012vailable online 5 September 2012
eywords:
a b s t r a c t
A capillary zone electrophoresis (CZE) method for separation of adenosine and N6-isopentenyladenosine(cytokinin) nucleotides was developed, optimized and validated. Aqueous solutions of several aminoacids were evaluated as the background electrolyte constituents. Separation of six nucleotides in lessthan 20 min with high theoretical plate number (up to 400 000 for isopentenyladenosine triphosphate)was achieved using a 100 mM sarcosine/ammonia buffer at pH 10.0. The detection limits of the CZE-UVmethod are in the low micromolar range (0.69–1.27 �mol L−1). Good repeatability of migration times
2
ytokinin nucleotidesapillary electrophoresissopentenyltransferaseytokinin biosynthesis
(within 1.3%), peak areas (within 1.8%) and linearity (R > 0.999) was achieved over the concentrationrange 5–1000 �mol L−1. The method was used to assay the activity of the recombinant Arabidopsisthaliana isopentenyltransferase 1 (AtIPT1). Baseline separation of isopentenylated nucleotides by CE–ESI-MS using a volatile buffer (30 mM ammonium formate; pH 10.0) was accomplished. The identities of thereaction products – isopentenyladenosine di- and triphosphate were confirmed by HPLC-QqTOF-MS.
Dephosphorylation of ATP was∗ Corresponding author at: Centre of the Region Haná for Biotechnological and Agricult83 71 Olomouc, Czech Republic. Tel.: +420 585634855; fax: +420 585634870.
E-mail address: [email protected] (L. Spíchal).1 These authors contributed equally.
003-2670/$ – see front matter © 2012 Elsevier B.V. All rights reserved.ttp://dx.doi.org/10.1016/j.aca.2012.08.049
observed as a parallel reaction.© 2012 Elsevier B.V. All rights reserved.
ural Research, Faculty of Science, Palacky University, Slechtitelu 11,
imica
1
vspomooioeibAssptiaoA4Aiae
m(dinouifarenrstslUwaHtintpric
msTmt
T. Béres et al. / Analytica Ch
. Introduction
Cytokinins (CKs) are a group of phytohormones involved inarious processes of plant growth and development, includingenescence delay, cell proliferation and apical dominance [1]. Iso-renoid or aromatic substitution of the N6 exocyclic amino groupf adenine is essential for the cytokinin activity. Adenosine 5′-onophosphate (AMP) had been predicted to be the only acceptor
f the side-chain precursor of dimethylallyl diphosphate (DMAPP)r 1-hydroxy-2-methyl-2-(E)-butenyl 4-diphosphate (HMBDP), ast is the case of bacterial isopentenyltransferase [2,3]. The genomef Arabidopsis thaliana was searched in silico to find the genesncoding plant isopentenyltransferases (IPTs – enzymes catalyz-ng the N6-isopentenylation). Nine genes (AtIPT 1–AtIPT 9) haveeen identified. Substrate specificities of recombinant AtIPT1 andtIPT4 were studied and a higher affinity was found toward adeno-ine 5′-di- and triphosphate (ATP, ADP) compared to AMP [4,5]. Acheme of the early stages of CK biosynthesis in higher plants wasroposed, and cytokinin di- and tri-phosphates are considered to behe first products of CK biosynthesis [4,5]. It is still unclear however,f all the isoenzymes preferentially use ADP and ATP. Significantmounts of trans-zeatin (tZ) were identified in the culture mediumf recombinant Escherichia coli expressing AtIPT1, AtIPT4, AtIPT7,tIPT8 [5]. The utilization of 1-hydroxy-2-methyl-2-(E)-butenyl-diphosphate (HMBDP), a hydroxylated side-chain substrate, bytIPT7 has raised new questions about zeatin biosynthesis by other
sopentenyltransferases [6]. The genes of isopentenyltransferasere expressed throughout the plant, but the peak of individualxpression is localized in very different parts [7].
Previously, the activity of the AtIPTs was assayed by high perfor-ance liquid chromatography with mass spectrometric detection
RP-HPLC–MS) [4]. This analytical method requires enzymaticephosphorylation of the CK nucleotides to obtain the correspond-
ng ribosides, which are subsequently detected. This method doesot allow direct discrimination between individual (mono-, di-r triphosphorylated) species. Furthermore, the results obtainedsing this approach may be affected by bacterial phosphatase activ-
ty, since the assayed recombinant enzymes are usually isolatedrom bacteria. Accurate determination of product/s thus demands
method capable of separating intact mono-, di- and triphospho-ylated cytokinins. More recently, a separation by means of ionxchange chromatography has been reported [8]. This method doesot allow direct identification of intact CK nucleotides by MS, oneun takes more than 90 min and it lacks validation. However, it cantill be used to separate products of the in vitro biosynthetic reac-ions on a preparative scale [9]. In order to find new alternativeubstrates, activity of the recombinant truncated IPT from Humu-us lupulus was assayed by ion-pairing RP chromatography withV detection. Mass spectrometry identification of the productsas done off-line by MALDI-TOF MS [10]. This approach recently
llowed us to directly determine nine isoprenoid CK nucleotides byPLC–MS [11]. The method is suitable for identification and quan-
ification of individual intact isopentenylated nucleotides (iPTP,PDP, iPMP). On the other hand, the substrates ATP, ADP, AMP doot have sufficient retention under the chromatographic condi-ions used, which makes this method inappropriate for studyingotential unfavorable accompanying reactions such as dephospho-ylation of the substrates. A method being able to monitor changesn substrate and product levels simultaneously would be the mostonvenient one.
Capillary electrophoresis is widely used for nucleotide deter-ination, as they are charged over a wide pH range. They can be
eparated under acidic [12], neutral [13] or basic [14] conditions.he latter are most widely used as they generate a stable electroos-otic flow (EOF). Negatively charged nucleotides are attracted to
he anode, but their direction is reversed by the fast EOF [15]. High
Acta 751 (2012) 176– 181 177
separation efficiencies together with sample consumption in therange of nanoliters render this technique very attractive. The aimof the investigation reported here was to assess the feasibility ofcapillary electrophoresis as a method to determine the substratesand products of the in vitro reaction of DMAPP with ATP catalyzedby recombinant AtIPT1 protein.
2. Material and methods
2.1. Chemicals
All the chemicals used were of analytical-grade. The buffercomponents [l-alanine, �-alanine, glycine, �-amino butyric acid(GABA), l-valine, sarcosine, N-cyclohexyl-3-aminopropanesulfonicacid (CAPS)], adenosine nucleotide standards (AMP, ADP, ATP),yeast extract, tryptone, ampicillin, glucose, �-mercaptoethanol,isopropyl-�-d-1-thiogalactopyranoside (IPTG), imidazol, Tris, HCl,NaCl, KCl, MgCl2·6H2O, lysozyme, bovine serum albumin andprotease inhibitor cocktail were purchased from Sigma (St.Louis, MO, USA). Methanol, isopropanol, acetonitrile, formic andacetic acid, sodium and ammonium hydroxide were purchasedfrom Merck (Darmstadt, Germany). N6-Isopentenyladenosine-5′-monophosphate (iPMP) was purchased from Olchemim Ltd. (Olo-mouc, Czech Republic). N6-Isopentenyladenosine-5′-diphosphate(iPDP) and N6-isopentenyladenosine-5′-triphosphate (iPTP) wereprepared according to [16]; for the chemical structure of thecompounds studied, see Table 1. Ultrapure water produced by aSartorius Atrium 611 UV water purification system (Göttingen,Germany) was used for preparing buffer solutions, mobile phasesand the sheath liquid. DNase was purchased from (Fermentas,St. Leon-Rot, Germany) and the TALON metal affinity resin fromClontech Laboratories, Inc. (Mountain View, CA, USA). DMAPP wassynthesized at the Department of Bio-Organic Chemistry, Leibniz-Institute of Plant Biochemistry, Halle, Germany [17].
2.2. CE–UV instrumentation and conditions
CE–UV experiments were carried out on an Agilent3DCE instru-ment (Agilent Technologies, Waldbronn, Germany) equipped witha UV absorbance DAD. Any new capillary was flushed with 1 MNaOH (10 min), water (10 min) and running buffer (20 min); thisprocedure was repeated at the beginning of each working day.Buffers were prepared daily, sonicated and filtered through a0.20 �m membrane filter (Minisart, Sartorius, Göttingen, Germany)before the use. Between analyses, the capillary was flushed withthe background electrolyte (BGE) for 2 min. The separations wereperformed in 75 �m id, 80.5 cm long (72 cm effective length) barefused-silica capillaries (Polymicro Technologies, Phoenix, AZ, USA).An aqueous 100 mM sarcosine solution adjusted to pH 10.0 withammonium hydroxide was used as the BGE. The separations wereperformed at a constant voltage of +30 kV, and samples wereinjected by applying a pressure of 50 mbar for 5 s (hydrodynamicmode). The capillary cartridge was thermostated to 20 ◦C and thedetection wavelength was 265 nm. The data were processed inChemStation software.
2.3. CE–MS instrumentation and conditions
CE–MS experiments were performed on a HP3DCE instrumentcoupled to an Esquire 3000 plus ion trap MS (Bruker, Bremen,Germany) via a CE–MS interface from Agilent. A 50 �m id fused-silica capillary (Polymicro Technologies, Phoenix, AZ, USA) was
used for this study, the other procedures and parameters wereas described for the CE–UV experiments. Several solvents (ACN,MeOH and IPA) were tested as sheath liquid constituents in com-bination with water. Finally, a mixture of isopropanol and water in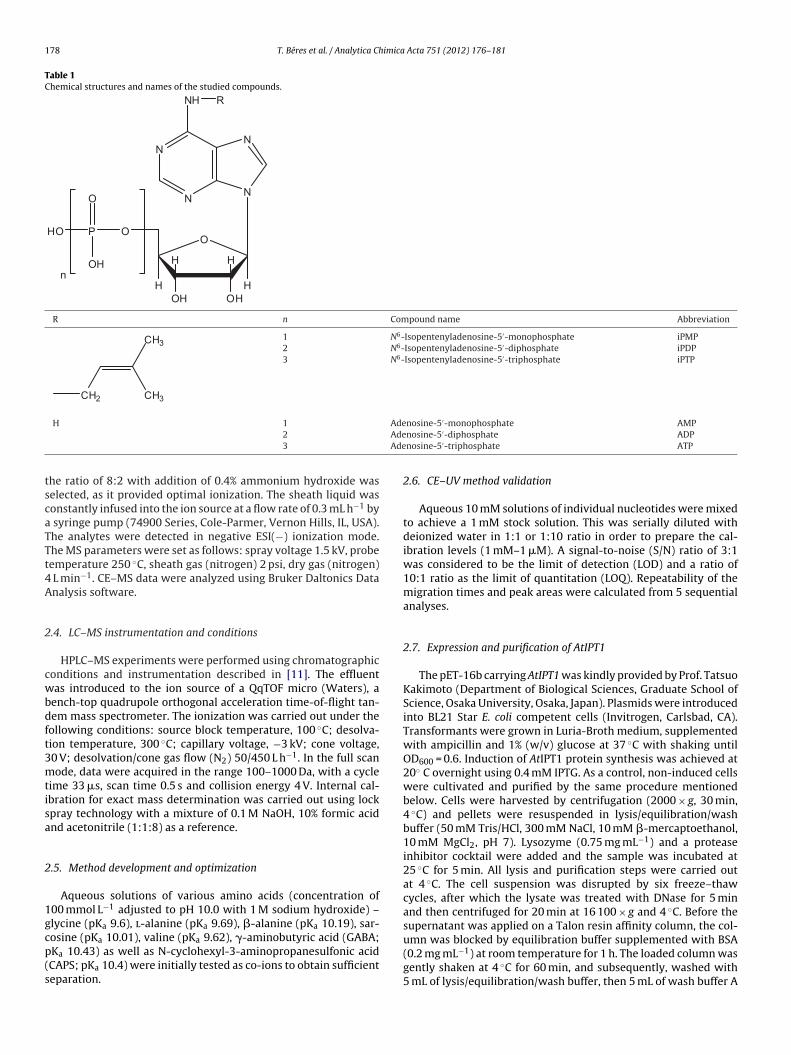
178 T. Béres et al. / Analytica Chimica Acta 751 (2012) 176– 181
Table 1Chemical structures and names of the studied compounds.
N
NN
N
NH
O
OHOH
HH
HH
OPHO
OH
O
n
R
R n Compound name Abbreviation
CH2
CH3
CH3
1 N6-Isopentenyladenosine-5′-monophosphate iPMP2 N6-Isopentenyladenosine-5′-diphosphate iPDP3 N6-Isopentenyladenosine-5′-triphosphate iPTP
Ade ′
AdeAde
tscaTTt4A
2
cwbdft3mtisa
2
1gcp(s
H 12
3
he ratio of 8:2 with addition of 0.4% ammonium hydroxide waselected, as it provided optimal ionization. The sheath liquid wasonstantly infused into the ion source at a flow rate of 0.3 mL h−1 by
syringe pump (74900 Series, Cole-Parmer, Vernon Hills, IL, USA).he analytes were detected in negative ESI(−) ionization mode.he MS parameters were set as follows: spray voltage 1.5 kV, probeemperature 250 ◦C, sheath gas (nitrogen) 2 psi, dry gas (nitrogen)
L min−1. CE–MS data were analyzed using Bruker Daltonics Datanalysis software.
.4. LC–MS instrumentation and conditions
HPLC–MS experiments were performed using chromatographiconditions and instrumentation described in [11]. The effluentas introduced to the ion source of a QqTOF micro (Waters), a
ench-top quadrupole orthogonal acceleration time-of-flight tan-em mass spectrometer. The ionization was carried out under theollowing conditions: source block temperature, 100 ◦C; desolva-ion temperature, 300 ◦C; capillary voltage, −3 kV; cone voltage,0 V; desolvation/cone gas flow (N2) 50/450 L h−1. In the full scanode, data were acquired in the range 100–1000 Da, with a cycle
ime 33 �s, scan time 0.5 s and collision energy 4 V. Internal cal-bration for exact mass determination was carried out using lockpray technology with a mixture of 0.1 M NaOH, 10% formic acidnd acetonitrile (1:1:8) as a reference.
.5. Method development and optimization
Aqueous solutions of various amino acids (concentration of00 mmol L−1 adjusted to pH 10.0 with 1 M sodium hydroxide) –lycine (pKa 9.6), l-alanine (pKa 9.69), �-alanine (pKa 10.19), sar-
osine (pKa 10.01), valine (pKa 9.62), �-aminobutyric acid (GABA;Ka 10.43) as well as N-cyclohexyl-3-aminopropanesulfonic acidCAPS; pKa 10.4) were initially tested as co-ions to obtain sufficienteparation.nosine-5 -monophosphate AMPnosine-5′-diphosphate ADPnosine-5′-triphosphate ATP
2.6. CE–UV method validation
Aqueous 10 mM solutions of individual nucleotides were mixedto achieve a 1 mM stock solution. This was serially diluted withdeionized water in 1:1 or 1:10 ratio in order to prepare the cal-ibration levels (1 mM–1 �M). A signal-to-noise (S/N) ratio of 3:1was considered to be the limit of detection (LOD) and a ratio of10:1 ratio as the limit of quantitation (LOQ). Repeatability of themigration times and peak areas were calculated from 5 sequentialanalyses.
2.7. Expression and purification of AtIPT1
The pET-16b carrying AtIPT1 was kindly provided by Prof. TatsuoKakimoto (Department of Biological Sciences, Graduate School ofScience, Osaka University, Osaka, Japan). Plasmids were introducedinto BL21 Star E. coli competent cells (Invitrogen, Carlsbad, CA).Transformants were grown in Luria-Broth medium, supplementedwith ampicillin and 1% (w/v) glucose at 37 ◦C with shaking untilOD600 = 0.6. Induction of AtIPT1 protein synthesis was achieved at20◦ C overnight using 0.4 mM IPTG. As a control, non-induced cellswere cultivated and purified by the same procedure mentionedbelow. Cells were harvested by centrifugation (2000 × g, 30 min,4 ◦C) and pellets were resuspended in lysis/equilibration/washbuffer (50 mM Tris/HCl, 300 mM NaCl, 10 mM �-mercaptoethanol,10 mM MgCl2, pH 7). Lysozyme (0.75 mg mL−1) and a proteaseinhibitor cocktail were added and the sample was incubated at25 ◦C for 5 min. All lysis and purification steps were carried outat 4 ◦C. The cell suspension was disrupted by six freeze–thawcycles, after which the lysate was treated with DNase for 5 minand then centrifuged for 20 min at 16 100 × g and 4 ◦C. Before thesupernatant was applied on a Talon resin affinity column, the col-
umn was blocked by equilibration buffer supplemented with BSA(0.2 mg mL−1) at room temperature for 1 h. The loaded column wasgently shaken at 4 ◦C for 60 min, and subsequently, washed with5 mL of lysis/equilibration/wash buffer, then 5 mL of wash buffer A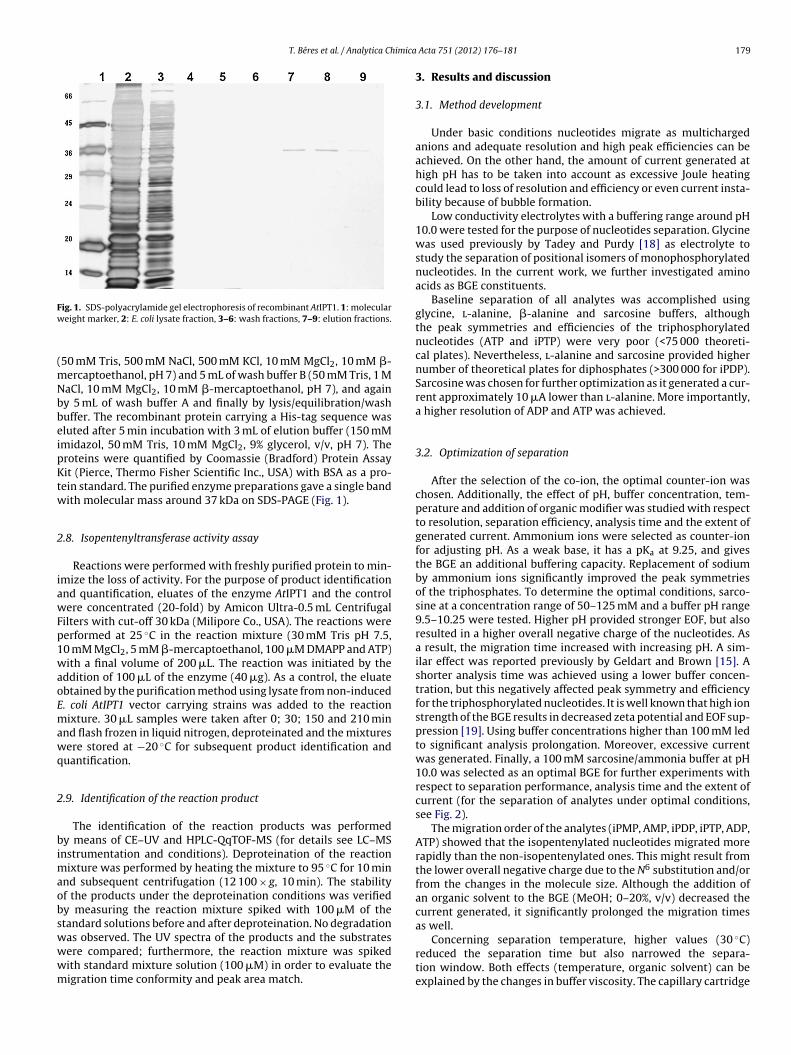
T. Béres et al. / Analytica Chimica
Fw
(mNbbeipKtw
2
iawFp1waoEmawq
2
bimaobswwwm
Concerning separation temperature, higher values (30 ◦C)
ig. 1. SDS-polyacrylamide gel electrophoresis of recombinant AtIPT1. 1: moleculareight marker, 2: E. coli lysate fraction, 3–6: wash fractions, 7–9: elution fractions.
50 mM Tris, 500 mM NaCl, 500 mM KCl, 10 mM MgCl2, 10 mM �-ercaptoethanol, pH 7) and 5 mL of wash buffer B (50 mM Tris, 1 MaCl, 10 mM MgCl2, 10 mM �-mercaptoethanol, pH 7), and againy 5 mL of wash buffer A and finally by lysis/equilibration/washuffer. The recombinant protein carrying a His-tag sequence wasluted after 5 min incubation with 3 mL of elution buffer (150 mMmidazol, 50 mM Tris, 10 mM MgCl2, 9% glycerol, v/v, pH 7). Theroteins were quantified by Coomassie (Bradford) Protein Assayit (Pierce, Thermo Fisher Scientific Inc., USA) with BSA as a pro-
ein standard. The purified enzyme preparations gave a single bandith molecular mass around 37 kDa on SDS-PAGE (Fig. 1).
.8. Isopentenyltransferase activity assay
Reactions were performed with freshly purified protein to min-mize the loss of activity. For the purpose of product identificationnd quantification, eluates of the enzyme AtIPT1 and the controlere concentrated (20-fold) by Amicon Ultra-0.5 mL Centrifugal
ilters with cut-off 30 kDa (Milipore Co., USA). The reactions wereerformed at 25 ◦C in the reaction mixture (30 mM Tris pH 7.5,0 mM MgCl2, 5 mM �-mercaptoethanol, 100 �M DMAPP and ATP)ith a final volume of 200 �L. The reaction was initiated by the
ddition of 100 �L of the enzyme (40 �g). As a control, the eluatebtained by the purification method using lysate from non-induced. coli AtIPT1 vector carrying strains was added to the reactionixture. 30 �L samples were taken after 0; 30; 150 and 210 min
nd flash frozen in liquid nitrogen, deproteinated and the mixturesere stored at −20 ◦C for subsequent product identification and
uantification.
.9. Identification of the reaction product
The identification of the reaction products was performedy means of CE–UV and HPLC-QqTOF-MS (for details see LC–MS
nstrumentation and conditions). Deproteination of the reactionixture was performed by heating the mixture to 95 ◦C for 10 min
nd subsequent centrifugation (12 100 × g, 10 min). The stabilityf the products under the deproteination conditions was verifiedy measuring the reaction mixture spiked with 100 �M of thetandard solutions before and after deproteination. No degradationas observed. The UV spectra of the products and the substrates
ere compared; furthermore, the reaction mixture was spikedith standard mixture solution (100 �M) in order to evaluate theigration time conformity and peak area match.Acta 751 (2012) 176– 181 179
3. Results and discussion
3.1. Method development
Under basic conditions nucleotides migrate as multichargedanions and adequate resolution and high peak efficiencies can beachieved. On the other hand, the amount of current generated athigh pH has to be taken into account as excessive Joule heatingcould lead to loss of resolution and efficiency or even current insta-bility because of bubble formation.
Low conductivity electrolytes with a buffering range around pH10.0 were tested for the purpose of nucleotides separation. Glycinewas used previously by Tadey and Purdy [18] as electrolyte tostudy the separation of positional isomers of monophosphorylatednucleotides. In the current work, we further investigated aminoacids as BGE constituents.
Baseline separation of all analytes was accomplished usingglycine, l-alanine, �-alanine and sarcosine buffers, althoughthe peak symmetries and efficiencies of the triphosphorylatednucleotides (ATP and iPTP) were very poor (<75 000 theoreti-cal plates). Nevertheless, l-alanine and sarcosine provided highernumber of theoretical plates for diphosphates (>300 000 for iPDP).Sarcosine was chosen for further optimization as it generated a cur-rent approximately 10 �A lower than l-alanine. More importantly,a higher resolution of ADP and ATP was achieved.
3.2. Optimization of separation
After the selection of the co-ion, the optimal counter-ion waschosen. Additionally, the effect of pH, buffer concentration, tem-perature and addition of organic modifier was studied with respectto resolution, separation efficiency, analysis time and the extent ofgenerated current. Ammonium ions were selected as counter-ionfor adjusting pH. As a weak base, it has a pKa at 9.25, and givesthe BGE an additional buffering capacity. Replacement of sodiumby ammonium ions significantly improved the peak symmetriesof the triphosphates. To determine the optimal conditions, sarco-sine at a concentration range of 50–125 mM and a buffer pH range9.5–10.25 were tested. Higher pH provided stronger EOF, but alsoresulted in a higher overall negative charge of the nucleotides. Asa result, the migration time increased with increasing pH. A sim-ilar effect was reported previously by Geldart and Brown [15]. Ashorter analysis time was achieved using a lower buffer concen-tration, but this negatively affected peak symmetry and efficiencyfor the triphosphorylated nucleotides. It is well known that high ionstrength of the BGE results in decreased zeta potential and EOF sup-pression [19]. Using buffer concentrations higher than 100 mM ledto significant analysis prolongation. Moreover, excessive currentwas generated. Finally, a 100 mM sarcosine/ammonia buffer at pH10.0 was selected as an optimal BGE for further experiments withrespect to separation performance, analysis time and the extent ofcurrent (for the separation of analytes under optimal conditions,see Fig. 2).
The migration order of the analytes (iPMP, AMP, iPDP, iPTP, ADP,ATP) showed that the isopentenylated nucleotides migrated morerapidly than the non-isopentenylated ones. This might result fromthe lower overall negative charge due to the N6 substitution and/orfrom the changes in the molecule size. Although the addition ofan organic solvent to the BGE (MeOH; 0–20%, v/v) decreased thecurrent generated, it significantly prolonged the migration timesas well.
reduced the separation time but also narrowed the separa-tion window. Both effects (temperature, organic solvent) can beexplained by the changes in buffer viscosity. The capillary cartridge
180 T. Béres et al. / Analytica Chimica Acta 751 (2012) 176– 181
Table 2Repeatability of the migration times and peak areas, linearity and sensitivity of the developed CZE-UV method for determination of CK and adenylate nucleotides.
tm Peak area Determination coefficient R2 Regression equation LOD LOQ Dynamic rangeRSD (n = 5)% (�mol L−1)
iPMP 0.43 0.42 0.999 y = 0.340x + 0.454 0.84 2.80 5–1000AMP 0.31 1.14 0.999 y = 0.389x + 0.411 1.27 4.23 5–1000iPDP 0.53 0.83 0.999 y = 0.398x + 0.069 0.81 2.70 5–1000
tt
3
t(rAn5bpc
3
imnmwcoonnt0r
Fit7Bs
iPTP 1.09 1.25 0.999
ADP 0.55 1.60 0.999
ATP 1.28 1.79 0.999
emperature was therefore maintained at 20 ◦C. Sufficient separa-ion performance was achieved without any BGE additives.
.3. CE–UV method validation
The developed method was subsequently validated. Sensi-ivity (LOD, LOQ), linearity and repeatability were determinedTable 2). The limits of detection are in the low micromolarange (0.69–1.27 �M). Similar detection limits for ATP, ADP andMP were reported previously [12,14]. Linearity for the studieducleotides (R2 > 0.999) was obtained in the concentration range of–1000 �mol L−1. Repeatability (RSD %) of the migration times waselow 1.3% and for peak areas below 1.8%. Comparable values wereublished for the CE–MS method for quantifying CK nucleotides inoconut water [20].
.4. CE–MS experiments
CE–MS has been already used in the identification ofntact cytokinin nucleotides, but the previous study focused on
onophosphates only [20]. To investigate the potential of this tech-ique to additionally identify intact CK di- and triphosphates, a newethod was developed. Ammonium acetate and formate at pH 10.0ere compared as the volatile BGE. The latter was selected at a con-
entration of 30 mM as it was able to provide baseline separationf iPMP, iPDP and iPTP with high peak efficiency; yet, the amountf current generated (30 �A) at a constant voltage of +30 kV didot exceeded the upper limit of the instrumentation (50 �A) (dataot shown). Isopropanol was chosen as the organic component of
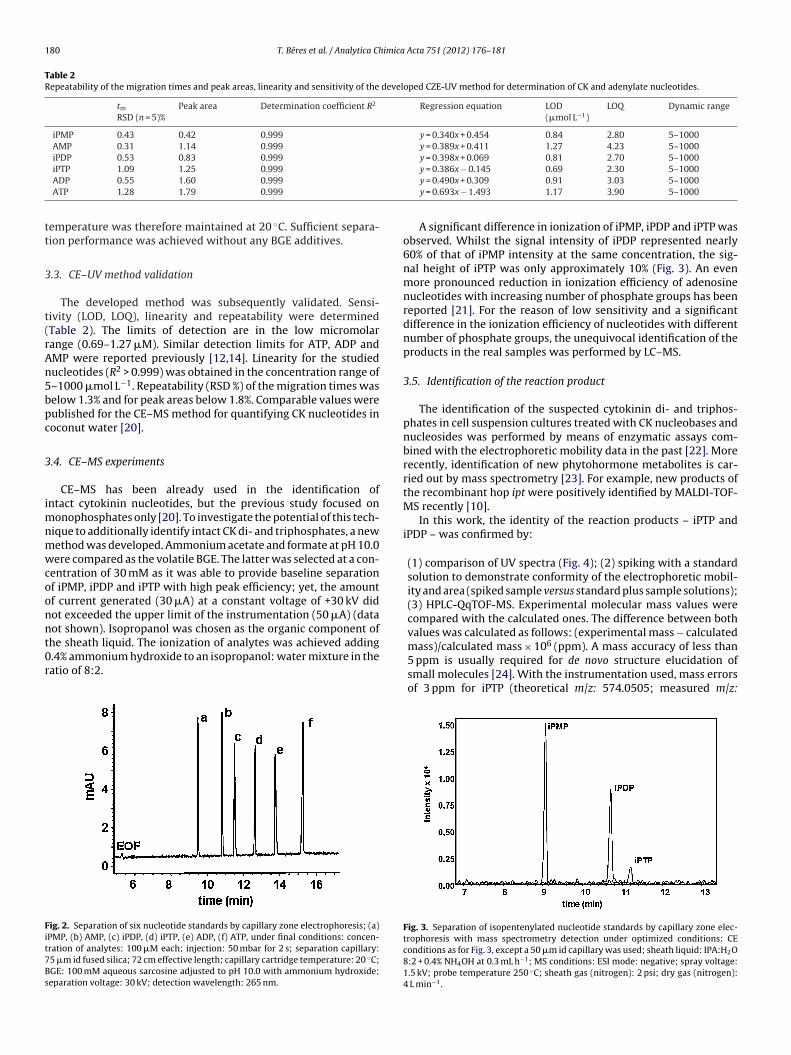
he sheath liquid. The ionization of analytes was achieved adding.4% ammonium hydroxide to an isopropanol: water mixture in theatio of 8:2.ig. 2. Separation of six nucleotide standards by capillary zone electrophoresis; (a)PMP, (b) AMP, (c) iPDP, (d) iPTP, (e) ADP, (f) ATP, under final conditions: concen-ration of analytes: 100 �M each; injection: 50 mbar for 2 s; separation capillary:5 �m id fused silica; 72 cm effective length; capillary cartridge temperature: 20 ◦C;GE: 100 mM aqueous sarcosine adjusted to pH 10.0 with ammonium hydroxide;eparation voltage: 30 kV; detection wavelength: 265 nm.
y = 0.386x − 0.145 0.69 2.30 5–1000y = 0.490x + 0.309 0.91 3.03 5–1000y = 0.693x − 1.493 1.17 3.90 5–1000
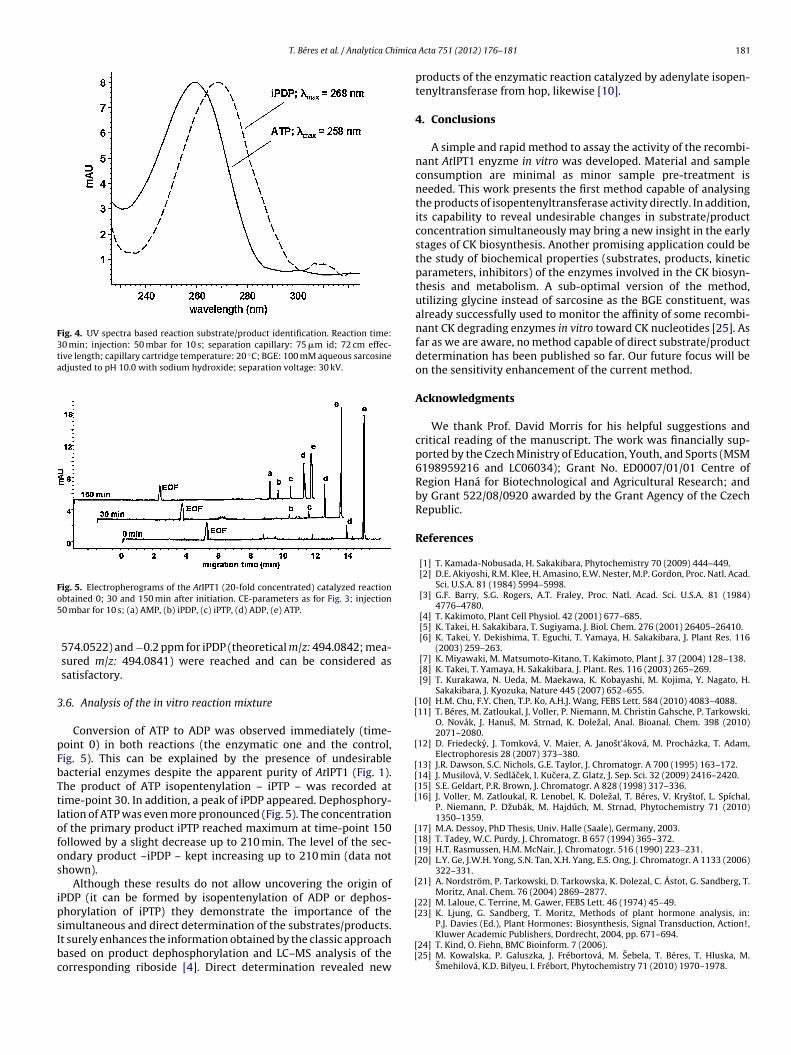
A significant difference in ionization of iPMP, iPDP and iPTP wasobserved. Whilst the signal intensity of iPDP represented nearly60% of that of iPMP intensity at the same concentration, the sig-nal height of iPTP was only approximately 10% (Fig. 3). An evenmore pronounced reduction in ionization efficiency of adenosinenucleotides with increasing number of phosphate groups has beenreported [21]. For the reason of low sensitivity and a significantdifference in the ionization efficiency of nucleotides with differentnumber of phosphate groups, the unequivocal identification of theproducts in the real samples was performed by LC–MS.
3.5. Identification of the reaction product
The identification of the suspected cytokinin di- and triphos-phates in cell suspension cultures treated with CK nucleobases andnucleosides was performed by means of enzymatic assays com-bined with the electrophoretic mobility data in the past [22]. Morerecently, identification of new phytohormone metabolites is car-ried out by mass spectrometry [23]. For example, new products ofthe recombinant hop ipt were positively identified by MALDI-TOF-MS recently [10].
In this work, the identity of the reaction products – iPTP andiPDP – was confirmed by:
(1) comparison of UV spectra (Fig. 4); (2) spiking with a standardsolution to demonstrate conformity of the electrophoretic mobil-ity and area (spiked sample versus standard plus sample solutions);(3) HPLC-QqTOF-MS. Experimental molecular mass values werecompared with the calculated ones. The difference between bothvalues was calculated as follows: (experimental mass − calculated
mass)/calculated mass × 106 (ppm). A mass accuracy of less than5 ppm is usually required for de novo structure elucidation ofsmall molecules [24]. With the instrumentation used, mass errorsof 3 ppm for iPTP (theoretical m/z: 574.0505; measured m/z:Fig. 3. Separation of isopentenylated nucleotide standards by capillary zone elec-trophoresis with mass spectrometry detection under optimized conditions: CEconditions as for Fig. 3, except a 50 �m id capillary was used; sheath liquid: IPA:H2O8:2 + 0.4% NH4OH at 0.3 mL h−1; MS conditions: ESI mode: negative; spray voltage:1.5 kV; probe temperature 250 ◦C; sheath gas (nitrogen): 2 psi; dry gas (nitrogen):4 L min−1.
T. Béres et al. / Analytica Chimica
Fig. 4. UV spectra based reaction substrate/product identification. Reaction time:30 min; injection: 50 mbar for 10 s; separation capillary: 75 �m id; 72 cm effec-tive length; capillary cartridge temperature: 20 ◦C; BGE: 100 mM aqueous sarcosineadjusted to pH 10.0 with sodium hydroxide; separation voltage: 30 kV.
Fig. 5. Electropherograms of the AtIPT1 (20-fold concentrated) catalyzed reactiono5
3
pFbTtlofos
ipsIbc
[[
[
[[[[
[[[[
[
[[
btained 0; 30 and 150 min after initiation. CE-parameters as for Fig. 3; injection0 mbar for 10 s; (a) AMP, (b) iPDP, (c) iPTP, (d) ADP, (e) ATP.
574.0522) and −0.2 ppm for iPDP (theoretical m/z: 494.0842; mea-sured m/z: 494.0841) were reached and can be considered assatisfactory.
.6. Analysis of the in vitro reaction mixture
Conversion of ATP to ADP was observed immediately (time-oint 0) in both reactions (the enzymatic one and the control,ig. 5). This can be explained by the presence of undesirableacterial enzymes despite the apparent purity of AtIPT1 (Fig. 1).he product of ATP isopentenylation – iPTP – was recorded atime-point 30. In addition, a peak of iPDP appeared. Dephosphory-ation of ATP was even more pronounced (Fig. 5). The concentrationf the primary product iPTP reached maximum at time-point 150ollowed by a slight decrease up to 210 min. The level of the sec-ndary product –iPDP – kept increasing up to 210 min (data nothown).
Although these results do not allow uncovering the origin ofPDP (it can be formed by isopentenylation of ADP or dephos-horylation of iPTP) they demonstrate the importance of the
imultaneous and direct determination of the substrates/products.t surely enhances the information obtained by the classic approachased on product dephosphorylation and LC–MS analysis of theorresponding riboside [4]. Direct determination revealed new[[
Acta 751 (2012) 176– 181 181
products of the enzymatic reaction catalyzed by adenylate isopen-tenyltransferase from hop, likewise [10].
4. Conclusions
A simple and rapid method to assay the activity of the recombi-nant AtIPT1 enyzme in vitro was developed. Material and sampleconsumption are minimal as minor sample pre-treatment isneeded. This work presents the first method capable of analysingthe products of isopentenyltransferase activity directly. In addition,its capability to reveal undesirable changes in substrate/productconcentration simultaneously may bring a new insight in the earlystages of CK biosynthesis. Another promising application could bethe study of biochemical properties (substrates, products, kineticparameters, inhibitors) of the enzymes involved in the CK biosyn-thesis and metabolism. A sub-optimal version of the method,utilizing glycine instead of sarcosine as the BGE constituent, wasalready successfully used to monitor the affinity of some recombi-nant CK degrading enzymes in vitro toward CK nucleotides [25]. Asfar as we are aware, no method capable of direct substrate/productdetermination has been published so far. Our future focus will beon the sensitivity enhancement of the current method.
Acknowledgments
We thank Prof. David Morris for his helpful suggestions andcritical reading of the manuscript. The work was financially sup-ported by the Czech Ministry of Education, Youth, and Sports (MSM6198959216 and LC06034); Grant No. ED0007/01/01 Centre ofRegion Haná for Biotechnological and Agricultural Research; andby Grant 522/08/0920 awarded by the Grant Agency of the CzechRepublic.
References
[1] T. Kamada-Nobusada, H. Sakakibara, Phytochemistry 70 (2009) 444–449.[2] D.E. Akiyoshi, R.M. Klee, H. Amasino, E.W. Nester, M.P. Gordon, Proc. Natl. Acad.
Sci. U.S.A. 81 (1984) 5994–5998.[3] G.F. Barry, S.G. Rogers, A.T. Fraley, Proc. Natl. Acad. Sci. U.S.A. 81 (1984)
4776–4780.[4] T. Kakimoto, Plant Cell Physiol. 42 (2001) 677–685.[5] K. Takei, H. Sakakibara, T. Sugiyama, J. Biol. Chem. 276 (2001) 26405–26410.[6] K. Takei, Y. Dekishima, T. Eguchi, T. Yamaya, H. Sakakibara, J. Plant Res. 116
(2003) 259–263.[7] K. Miyawaki, M. Matsumoto-Kitano, T. Kakimoto, Plant J. 37 (2004) 128–138.[8] K. Takei, T. Yamaya, H. Sakakibara, J. Plant. Res. 116 (2003) 265–269.[9] T. Kurakawa, N. Ueda, M. Maekawa, K. Kobayashi, M. Kojima, Y. Nagato, H.
Sakakibara, J. Kyozuka, Nature 445 (2007) 652–655.10] H.M. Chu, F.Y. Chen, T.P. Ko, A.H.J. Wang, FEBS Lett. 584 (2010) 4083–4088.11] T. Béres, M. Zatloukal, J. Voller, P. Niemann, M. Christin Gahsche, P. Tarkowski,
O. Novák, J. Hanus, M. Strnad, K. Dolezal, Anal. Bioanal. Chem. 398 (2010)2071–2080.
12] D. Friedecky, J. Tomková, V. Maier, A. Janost’áková, M. Procházka, T. Adam,Electrophoresis 28 (2007) 373–380.
13] J.R. Dawson, S.C. Nichols, G.E. Taylor, J. Chromatogr. A 700 (1995) 163–172.14] J. Musilová, V. Sedlácek, I. Kucera, Z. Glatz, J. Sep. Sci. 32 (2009) 2416–2420.15] S.E. Geldart, P.R. Brown, J. Chromatogr. A 828 (1998) 317–336.16] J. Voller, M. Zatloukal, R. Lenobel, K. Dolezal, T. Béres, V. Krystof, L. Spíchal,
P. Niemann, P. Dzubák, M. Hajdúch, M. Strnad, Phytochemistry 71 (2010)1350–1359.
17] M.A. Dessoy, PhD Thesis, Univ. Halle (Saale), Germany, 2003.18] T. Tadey, W.C. Purdy, J. Chromatogr. B 657 (1994) 365–372.19] H.T. Rasmussen, H.M. McNair, J. Chromatogr. 516 (1990) 223–231.20] L.Y. Ge, J.W.H. Yong, S.N. Tan, X.H. Yang, E.S. Ong, J. Chromatogr. A 1133 (2006)
322–331.21] A. Nordström, P. Tarkowski, D. Tarkowska, K. Dolezal, C. Åstot, G. Sandberg, T.
Moritz, Anal. Chem. 76 (2004) 2869–2877.22] M. Laloue, C. Terrine, M. Gawer, FEBS Lett. 46 (1974) 45–49.23] K. Ljung, G. Sandberg, T. Moritz, Methods of plant hormone analysis, in:
P.J. Davies (Ed.), Plant Hormones: Biosynthesis, Signal Transduction, Action!,Kluwer Academic Publishers, Dordrecht, 2004, pp. 671–694.
24] T. Kind, O. Fiehn, BMC Bioinform. 7 (2006).25] M. Kowalska, P. Galuszka, J. Frébortová, M. Sebela, T. Béres, T. Hluska, M.
Smehilová, K.D. Bilyeu, I. Frébort, Phytochemistry 71 (2010) 1970–1978.