Embed Size (px)
Citation preview

Analysis of the Metro South/West
Job Referral Process Final Report
Prepared By: LMI Works June 2015
Prepared For:

TABLE OF CONTENTS Page SECTION I: INTRODUCTION ………………………………………………… 1
1. Background ………………………………………………………………….. 1 2. Methods Used For the Analysis of the Job Referral Process.. 3 3. Purpose of the Report ………………………………………………………. 4 SECTION II: CAREER CENTERS, JOB SEEKERS AND EMPLOYERS…. 5 1. Career Center Service Provision ……………………………………………. 5
• Integrated Team Approach to Service Provision …………………. 5 • Team Composition …………………………………………………………… 6 • Team Implementation and Activities…………………………………. 6 • Perceptions of Teams’ Strengths and Weaknesses …………….. 8
2. Job Seeker Customers …………………………………………………………. 8 • Job Seeker Demographic Characteristics ……………………………. 9 • Job Seeker Employment Profiles ………………………………………. 10 • Career Center Services Provided to Customers ………………….. 12 • Job Referrals/Entered Employments …………………………………. 14
3. Employer Customers ………………………………………………………….. 19 • Employer Characteristics in Metro South/West ………………… 19 • ETR Employer Services FY 2015 (July 2014 – March 2015)…. 22 • Employer Feed-Back ………………………………………………………… 23
4. Massachusetts One-Stop Employment System (MOSES)……. 27 • MOSES Overview ……………………………………………………………… 27 • MOSES/JobQuest Function ………………………………………………. 28 • Staff Perspectives and Experiences with JobQuest …………… 30
Section III: SUMMARY AND RECOMMENDATIONS…………………….. 31 1. Two Questions …………………………………………………………………….. 31
• Question Number One …………………………………………………….. 31 • Question Number Two …………………………………………………….. 32
2. Conclusions ………………………………………………………………………….. 33 3. Recommendations ……………………………………………………………….. 34 APPENDICES
• References ………………………………………………………………………. 38

Analysis of the Job Referral Process Final Report Page 1
I. INTRODUCTION
In December 2014, the Partnerships for a Skilled Workforce (PSW) commissioned an independent analysis of the Metro South/West workforce development job referral process. This report provides the results of the analysis. The introduction includes a brief overview of the Metro South/West workforce area so as to provide a context for the analytic findings and the methodology including the questions that guided the analysis. 1. BACKGROUND 1.1 Description of Area
Among the 16 Workforce Investment Areas in Massachusetts, Metro South/West is the largest in the state in terms of population, employment and the labor force. In addition, according to the Labor Market Trends in the Metro South/West Region report prepared by the Commonwealth Corporation and Federal Reserve Bank of Boston (June 2012), the area’s population is the most highly educated in the state; by 2010 more than one-half of the working age residents (53.9%) had a Bachelor’s Degree or higher compared with approximately one-third (35.6%) of Massachusetts residents. The report also indicated the area’s population is older; in 2010, more than one-half (55%) of the area’s population was 45 years old or older. Only the Berkshires and the Cape and Islands have populations older than Metro South/West.
The highly educated Metro South/West workforce has been an important factor in why the region’s unemployment rate has been consistently below the statewide average. At the height of the last recession in 2009, the Metro South/West unemployment rate rose to 6.4 percent which was much lower than the statewide rate of 8.1 percent. By 2014, the unemployment rate in the region had fallen to 4.4 percent, which again was lower than the statewide average of 5.8 percent (Commonwealth Corporation, 2012).
Despite the reduced unemployment rate, long term unemployment persists. In June
2013, nearly 40 percent of all Unemployment Insurance claimants had been out of work for 27 weeks or longer, according to the most recent data available from the Department of Labor and Workforce Development (DLWD). In addition, among all of the 16 Workforce Areas, Metro South/West had the highest share of UI claimants with at least a bachelor’s degree: 52.7 percent versus 27.7 percent for the entire Commonwealth. With regard to age, nearly 60 percent of the region’s UI claimants are 45 years old or older with one third at least 55 years old.
This highly educated workforce, in conjunction with the long-term unemployed and
older workers, presents unique challenges for the Metro South/West workforce development system. The public responsibility for ensuring a vital workforce to meet employer needs while simultaneously assisting unemployed persons regain full employment rests with the Partnerships for a Skilled Workforce (PSW) and its partners: the Employment and Training Resources (ETR), the Metro South/West Employment and Training Administration, and the

Analysis of the Job Referral Process Final Report Page 2
Massachusetts Department of Labor and Workforce Development (DLWD). The Career Centers in Framingham and Norwood operationalize the partners’ vision, goals and policies (ETR, 2014)
1.2 Ongoing Review and Assessment of Workforce Services
PSW is the designated Workforce Investment Board (WIB) for the Metro South/West region and has oversight responsibility for the ETR Career Centers in Norwood and Framingham. The Career Center Initiative Board (CCIB) is the sub- committee designated by PSW to review and assess performance of the two ETR Career Centers. In carrying out their respective responsibilities, PSW and the CCIB commissioned an assessment of Career Center operations every two to three years. In 2010, the Center for Labor Market Studies (CLMS) conducted an analysis of services received by the Metro South/West job seekers that revealed that only 4 percent of Career Center job seekers received one or more job referrals. Meanwhile, other local and national studies had found that Career Center clients who received job referrals had a significantly increased probability of finding a job. In its own analysis, CLMS determined that within the Metro South/West Career Centers, the provision of 2 or more job referrals was associated with an increased probability of obtaining employment (Sum, 2010).
In response to these analytic findings, the CCIB requested that ETR develop and implement a job placement model to guide and improve the Career Center operations. The ETR FY 2012 Transition Plan Monitoring Report stated that FY 2012 job referrals had increased significantly from the FY 2011 job referral rates; “there was an 89 percent improvement (107 FY11 referrals compared to 203 FY12 referrals) due to the increasing emphasis on job referrals and improved data entry procedures.” The Monitoring Report also reflected, however, that the rate of “entered employments” had not increased (ETR 2012).
Despite the policy and operational emphasis on the importance of job referrals, the
Career Centers’ performance measures indicated that job referrals had not been resulting in job placements. As a result an RFP was issued by PSW in September, 2014.
According to information included in the RFP, 243 intensive services customers were
provided with job referrals in FY2014. Fifteen of the 243 customers (6.2%) obtained jobs. During the same time period, Metro South/West area employers submitted 11,322 job orders to which Career Center staff referred 622 people. This apparent lack of connection between Career Center job seekers and employer job listings reinforced concerns among CCIB Board members and PSW about Career Center performance. Some of the specific concerns that had been raised in previous evaluation efforts which appear relevant include:
• The need for strategic thinking to address changing labor market dynamics—for
example, what steps are necessary to facilitate matching the needs of job seekers and employers in a more timely fashion?

Analysis of the Job Referral Process Final Report Page 3
• The need for stronger partnerships and relationships with employers and business organizations.
• Federal performance measures that may not accurately reflect the effectiveness of
the services provided to job seekers and employers • Data Systems that are antiquated and do not provide timely performance data,
particularly with regard to job matching and customer outcomes.
Ultimately the RFP issued by PSW in September 2014 focused on answering the following two questions:
• Why have so few applicants been referred to existing job orders? • Why have so few referrals been hired for jobs that appear to match the applicants’
qualifications?
2. METHODS USED FOR THE ANALYSIS OF THE JOB REFERRAL PROCESS
The design for the Job Referral Process Analysis incorporated three components: • Implementation Assessment of the recently formed multi-functional teams to
determine (1) if the teams were implemented as planned and (2) the level of integration, including shared goals among team members. This approach assisted in distinguishing between Career Center staff actions (e.g., number of job offers processed; number of job seekers placed in training) rather than outcomes (number of job seekers who found jobs; number of employers helped to find employees). The findings from this investigation have provided the foundation for the job referral analysis.
• Operations and Services Assessment: A second line of inquiry provided an in-depth
review of all services offered by team members to employers and to job seekers.
• Job Referral Process Analysis: Thirdly, the analysis examined the job order process by reviewing job referrals for job seekers and the results of the referrals as well as all other follow-up efforts. To support this analytic component, the integrity of the available data for measuring employment placement outcomes was reviewed including the MOSES data definitions and sources.
The Job Referral Process Analysis drew from multiple data sources, which together with
data collection methods are listed below:
• Staff Interviews: A total of 29 interviews were conducted with Executive Staff (5) and Career Center Managers (4); Career Advisors (13); Business Services Representatives (5);

Analysis of the Job Referral Process Final Report Page 4
Job Developers (2), a BSR Administrator and a Veterans Representative. We conducted one-on-one interviews with these staff using semi-structured interview guides to ensure collecting consistent data across all interviews and to seek individual staff insights.
• Job Seeker Focus Group and Employer Interviews: Information was obtained from
employers who had posted job orders with the ETR Career Centers. Business Services Representatives identified employers with whom they had worked in the past year. A total of 18 employers were nominated and 14 telephone interviews were successfully completed using a structured questionnaire. The Catalyst Club, a pilot program that provides career center services to 15 selected customers in a group setting, was used to obtain information about job seekers’ experiences with the career centers.
• Massachusetts One-Stop Employment System (MOSES): The MIS Director provided the
analysis team numerous tailored data runs together with systems documentation, including definitions, and extensive support for interpretation of data findings.
• Documents: PSW and ETR provided numerous reports, including the CLMS Final Report
and the ETR 2012 Monitoring Report, which assisted with background information; PSW reports on the Metro South/West workforce area provided the backdrop for local labor market information; DLWD makes labor market databases available for independent analyses; literature of best practices in local workforce areas provided substantiated methods for improving service delivery.
Data Analysis: The use of qualitative and quantitative data analysis methods was essential
to developing a full understanding of the job order and job seeker referral processes. The analysis of the job referral process data included: (1) an implementation assessment of the integrated team approach; (2) a comprehensive analysis of client services and employer contacts and the outcomes of these services; and (3) a listing of factors that contribute to or impede successful job placement. 3. PURPOSE OF THE REPORT
The purpose of this report is to present the findings from the Analysis of the Job Referral
Process. The report describes the organizational environment of the Career Centers including the recently implemented Integrated Team approach to service delivery. Findings from the Career Center team interviews together with information obtained from job seekers and employers are then presented with particular emphasis placed on the job referral process and outcomes. Collectively, information obtained from Career Center staff and customers supports a set of recommendations pertaining to Career Center operations.

Analysis of the Job Referral Process Final Report Page 5
II: CAREER CENTERS, JOB SEEKERS AND EMPLOYERS
Partnerships for a Skilled Workforce (PSW) is one of sixteen Workforce Investment Boards in Massachusetts. Together with its partners (Employment and Training Resources (ETR), Metro South/West Employment and Training Administration, and the Massachusetts Department of Labor and Workforce Development) PSW operates the labor exchange, via the Career Centers, for the Metro South/West region. The Career Centers are located in Framingham and Norwood.
To better understand the job referral process as it operates within the Career Centers,
the Job Referral Process Analysis Study (hereafter referred to as “the Study”) collected information from the PSW Executive Director, the Chair of the Career Center Initiative Board (CCIB), the Executive Director and Deputy Director of ETR, the MIS Director, the Career Center Managers, and twenty-one Career Advisors, Business Services Representatives, and Job Developers. Information also was collected from groups of employers and job seekers. The qualitative interview data were augmented with information from the Massachusetts One-Stop Employment System (MOSES). Data collection focused on the provision of customer services and the relationship of services to the positive outcomes of job placements. This section of the report presents the Study findings for the job seeking customers and the employers. 1. CAREER CENTER SERVICE PROVISION
The Workforce Investment Act (1998) legislatively mandates that Career Centers provide universal access to anyone who needs services. The basic or core services may include job search assistance, labor market information, Resource Room assistance, an initial assessment, and workshops. For adults meeting eligibility criteria, including Title I Adults and Title I Dislocated Workers, Career Centers provide intensive services, which may include comprehensive assessment and testing, case management, and an individual employment plan that leads to training, On-the-Job-Training (OJT), and/or internships.
Almost 18 percent ($1.27 million) of the Metro South/West FY 2015 $7.280 million
Allocation is provided by the Wagner Peyser funds, which support universal access to Career Center services. Approximately 42 percent ($3.7 million) of the total Allocation is WIA Title I (Adult, Dislocated Workers, and Youth1) funding, which supports the Career Center intensive services. In addition, 25 percent of the funding was tied to National Emergency Grants (NEGs) with the remainder associated with state funding sources. The primary focus of the Study was on the intensive services supported by WIA Title I Adult and Dislocated Worker funds. 1.1 Integrated Team Approach to Service Provision
Traditionally, Career Center services have been divided between job seeker customers and employer customers. Job seekers worked with Career Advisors, who used a counselling 1 Youth Programs were not included in the Study

Analysis of the Job Referral Process Final Report Page 6
format to conduct assessments and create job search plans while the Business Services Representatives worked (mostly) independently, conducting employer outreach and providing Career Center employer services (e.g., job fairs, recruitments, OJTs, etc.) In July 2012, representatives from ETR went together with other Massachusetts workforce area representatives to explore an “Integrated Team” approach that was developed by a New York City workforce imitative. ETR then introduced this approach as a pilot project within the Norwood Career Center in July 2013, followed by full implementation in both Career Centers in July 2014.
In 2003, New York City aligned its training and small business services in a system
operated collectively by the city’s Department of Small Business Services, the New York State Department of Labor and the City University of New York. The centerpiece of the system is a network of so-called Workforce1 Career Centers. The centers are in all five boroughs. There are seven traditional career centers, and several more sector focused centers, such as those that focus on hiring and training within the manufacturing and healthcare fields.
The delegation from Massachusetts visited the Workforce1 Healthcare Career Center at
LaGuardia Community College in Queens, which opened in 2009 with funding under the American Recovery and Reinvestment Act. As its name suggests, the career center focus was to provide job seekers training and job placement in the healthcare industry. A Norwood Career Center supervisor who was part of the delegation later wrote that ETR’s team concept “was created around the model of seamless service…This framework uses and integrates existing methods and techniques to help teams deliver ever improving services by having additional expertise and avoid gaps in services by offering multiple contacts for the customer.” A major takeaway from the trip was the working arrangement used in the New York Career Center: “In New York the model had people working in quads so that they could communicate and work efficiently as a team. This model was adopted (at ETR) by creating quads for each team.” 1.2 Team Composition
The Teams are comprised of two or three Career Advisors and one Business Services
Representative. Three teams operate in the Framingham Career Center and two teams are based in Norwood. The teams report to the two managers in each of the Career Centers. Team members are highly qualified, with all but two having college degrees and eight, or 45 percent, of the team members having Master’s Degrees. All of the team members have extensive and appropriate professional experience. In addition to the experience gained while working in the Career Centers, these professionals have worked for private recruitment firms, university career counseling offices, training and other educational services, and private industry in information technology, banking and finance, and retail services (ETR, 2014). 1.3 Team Implementation and Activities
The overall goal of the teams is to provide a seamless integration of services to each job seeking customer including: (1) development of a job search plan with full team input; (2) a full

Analysis of the Job Referral Process Final Report Page 7
team assessment of the customer’s “job readiness;” and (3) specific, targeted job referrals based on the Business Services Representative’s judgment that the customer is appropriate for an employer’s job opening and is “job-ready” (ETR, 2014). The following summarizes the team-related work activities:
• Customer enters Resource Room • If customer requests additional service, Resource Room completes a form containing
basic customer identification information and sends it to the Career Center Manager • Career Center Manager assigns customer to a Career Advisor within a team who
completes the initial assessment, including a determination of the customer’s eligibility for a Career Center Program/intensive service
• Career Center Manager schedules team meeting to complete a detailed assessment • A full team meeting is held with the customer to determine career goals and to assess
“job readiness” • A job search plan is developed depending on the customer’s “job readiness;” this may
include referrals to resume writing, interviewing, and/or basic computer skills workshops.
• When appropriate, customer is assessed for training or an OJT slot. • Following the detailed assessment, the lead Career Advisor follows up with the
customer with job referrals and tracks progress with employment search. The Career Advisor also assists customer with JobQuest searches
• As needed, the team meets to provide case management • The team’s Business Service Representative provides direct employer referrals as
employment opportunities/job listings become available. • The lead Career Advisor ensures that all contacts are recorded in MOSES.
The Career Advisors and Business Services Representatives have responsibilities in
addition to working as a team. The Career Advisors are responsible for staffing all of the workshops and several Career Advisors work on special projects. The Business Services Representatives are responsible for employer outreach, providing employer services, and participating in local and state-wide networking groups such as MERLOT and Chambers of Commerce. Team members also may be called upon to staff the reception desk, cover the phones and fill in for staff that is absent.
There was limited opportunity to obtain job seeker feed-back about the team approach
to delivering services, given the Study’s resource constraints. The job seeker focus group did, however, provide some information about the team impact. In terms of the process, the job seekers’ experiences coincided with the staff descriptions. Job seekers reported that everybody got assigned to two Career Advisors as part of joining the Catalyst Club. The focus group described the process as “half the group was assigned to one Career Advisor and half the group was assigned to the other Career Advisor but Catalyst Club members can go to either Career Advisor.” In terms of the advantages of the team approach, a job seeker who went through the process at the Norwood Career Center for the first time in 2012 described his experience as

Analysis of the Job Referral Process Final Report Page 8
having “no connection to anyone. Services were accessed in an ả la carte fashion. This time around, the experience at the Norwood Career Center was completely different. Someone was assigned to [him]. [He] felt completely connected.” 1.4 Perceptions of Teams’ Strengths and Limitations
The team approach offers several distinct and valuable advantages. All of the Career
Center representatives who were interviewed identified job seeking customers as the primary beneficiaries, since the teams offer a comprehensive job readiness assessment and the teams afford the customers direct contact with the Business Services Representatives. The teams offer the Career Advisors better access to employers, through the Business Services Representatives, both in terms of better understanding the requirements of specific job openings and a better sense of the types of jobs that may be appropriate for specific customers. Enhanced communication and the ability to share knowledge and expertise have been greatly facilitated by the team structure. Individual team members embody in-depth knowledge of technical Career Center programs (e.g., Trade) and/or knowledge of the technical aspects of specific job openings (such as specialized computer technologies). The customers have multiple points of contact at the Career Centers given that each Team member is knowledgeable about the customers’ job search needs.
The primary limitation of the team approach, from the staff perspective, is time; having three to four staff members participate in a meeting for one customer has negatively impacted the amount of work time available for other responsibilities. Business Services Representatives must meet with employers when the employers are available, which had frequently created scheduling conflicts. The scheduling issue has been largely addressed via increasing the flexibility of team meeting times and reducing the requirement that all team members be present at all meetings with a customer.
Another shortcoming of the team implementation process, identified by senior
management as well as several team members, is that the teams were not designed so that each team member was able to prepare for the new role. The job content for each team position was insufficiently analyzed at the beginning, when the team concept was first designed, in terms of the specific skills each team member would need to fulfill the job responsibilities. Without defining the skill sets needed in light of the existing staff capabilities, the training that was provided proved to be too general and, according to many team members, not useful. One staff member stated that “to improve [operations] there needs to be hard core training for all team members; both skills training and team-building training.”
2. JOB SEEKER CUSTOMERS
Over 10,000 job seekers sought some type of assistance from the Metro South/West
Career Centers during FY 2014, according the MOSES One-Stop Career Center Activity Reports (OSCCAR). The primary focus of the Study, however, has been on the job seekers who received intensive services and are part of the case management/Team customer group. The following
Analysis of the Job Referral Process Final Report Page 9
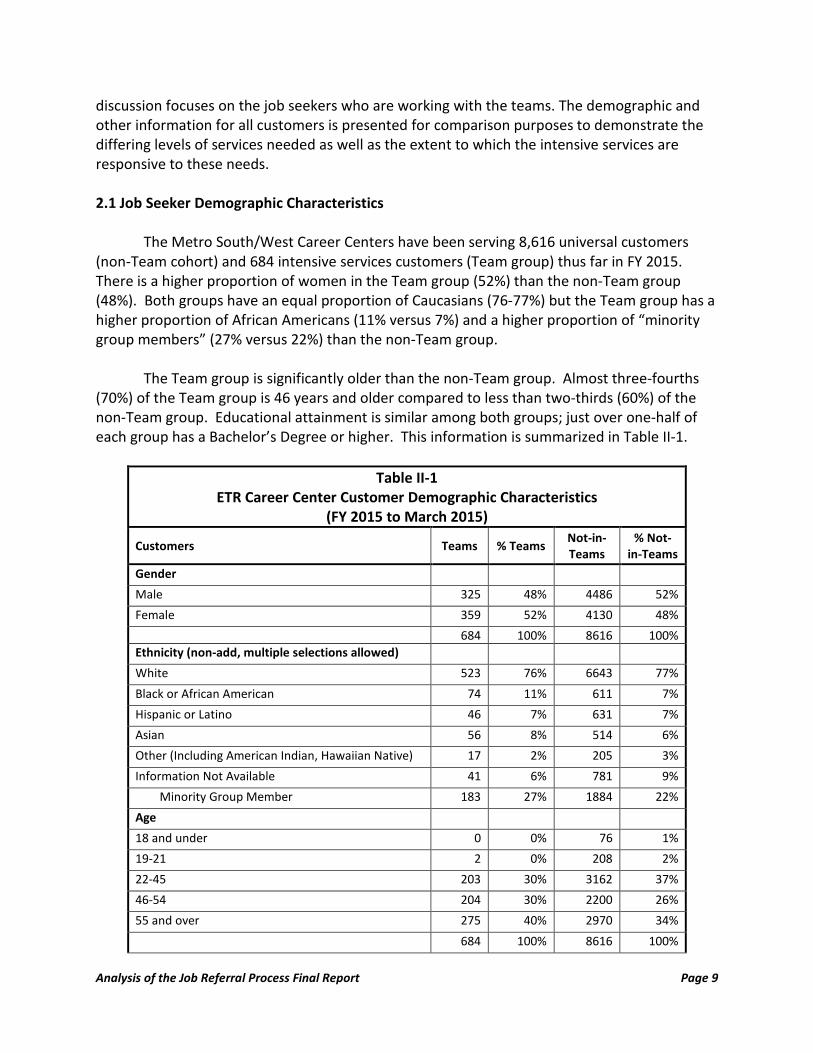
discussion focuses on the job seekers who are working with the teams. The demographic and other information for all customers is presented for comparison purposes to demonstrate the differing levels of services needed as well as the extent to which the intensive services are responsive to these needs. 2.1 Job Seeker Demographic Characteristics
The Metro South/West Career Centers have been serving 8,616 universal customers (non-Team cohort) and 684 intensive services customers (Team group) thus far in FY 2015. There is a higher proportion of women in the Team group (52%) than the non-Team group (48%). Both groups have an equal proportion of Caucasians (76-77%) but the Team group has a higher proportion of African Americans (11% versus 7%) and a higher proportion of “minority group members” (27% versus 22%) than the non-Team group.
The Team group is significantly older than the non-Team group. Almost three-fourths
(70%) of the Team group is 46 years and older compared to less than two-thirds (60%) of the non-Team group. Educational attainment is similar among both groups; just over one-half of each group has a Bachelor’s Degree or higher. This information is summarized in Table II-1.
Table II-1 ETR Career Center Customer Demographic Characteristics
(FY 2015 to March 2015)
Customers Teams % Teams Not-in-Teams
% Not-in-Teams
Gender Male 325 48% 4486 52% Female 359 52% 4130 48% 684 100% 8616 100% Ethnicity (non-add, multiple selections allowed) White 523 76% 6643 77% Black or African American 74 11% 611 7% Hispanic or Latino 46 7% 631 7% Asian 56 8% 514 6% Other (Including American Indian, Hawaiian Native) 17 2% 205 3% Information Not Available 41 6% 781 9% Minority Group Member 183 27% 1884 22% Age 18 and under 0 0% 76 1% 19-21 2 0% 208 2% 22-45 203 30% 3162 37% 46-54 204 30% 2200 26% 55 and over 275 40% 2970 34% 684 100% 8616 100%

Analysis of the Job Referral Process Final Report Page 10
Table II-1 ETR Career Center Customer Demographic Characteristics
(FY 2015 to March 2015)
Customers Teams % Teams Not-in-Teams
% Not-in-Teams
Education Less than High School 3 0% 367 4% High School Diploma/GED 108 16% 1692 20% Some College/Vocation Degrees 110 16% 1025 12% Associate Degree 78 11% 774 9% Bachelor’s Degree 233 34% 2802 33% Advanced Degree 152 22% 1744 20% Information Not Available 0 0% 212 2% 684 100% 8616 100%
Source: OSCCAR MOSES
2.2 Job Seeker Employment Profiles
To obtain a clearer understanding of the Metro South/West job seeker characteristics, the Study reviewed the industries for which job seekers have worked and their most recent occupations. To determine if there are any noteworthy differences between the job seekers assigned to the teams and all job seekers, industry and occupations of these two groups are compared below.
The industry attachments of team customers and all customers are presented in Table
II-2. As shown, team customers are much more concentrated in Manufacturing as compared to all customers. Specifically, nearly 3 in 10 team customers had worked in Manufacturing in their last job, compared to just 1 in 10 for all customers. This finding is likely influenced by a relatively large share of team customers connected to National Emergency Grants (NEGs) which are firm and thus industry specific. Professional and Technical Services comprise 15 percent of all team customers and approximately 14 percent of all customers. Significantly close to half of the team customers come from Manufacturing and Professional Services which could suggest the need for targeting employers in these two industries as a potential source of job openings appropriate for Team customers. A somewhat surprising finding is the representation of Health Care and Social Assistance. This industry is the third largest industry employer of all customers (8.9%) and fourth largest for Team Customers (8.1%).
Beyond the three industries discussed above, team customers and all customers are
dispersed across a wide range of industries. The relatively large category “Unknown” for all customers (15.4%) combined with a sizeable miscellaneous category (21.0%) makes any further comparisons between team customers and all customers quite limited.

Analysis of the Job Referral Process Final Report Page 11
Table II-2 Industry Attachments of Team Customers and All Customers
Metro South/West Workforce Area Calendar Year 2014
Industry Group Team Customers Percent All
Customers Percent
Manufacturing NAICS 31-33 222 29.7% 1,049 9.7% Professional and Technical NAICS 54 111 15.0% 1,505 13.9% Finance NAICS 52 70 9.4% 674 6.2% Health Care and Social Assistance NAICS 62 60 8.1% 962 8.9% Admin Support NAICS 56 58 7.8% 926 8.6% Retail Trade NAICS 44-45 55 7.4% 831 7.6% Education NAICS 61 26 3.5% 409 3.8% Wholesale Trade NAICS 42-43 24 3.2% 520 4.8% Miscellaneous 106 14.3% 2,268 21.0% Unknown 9 1.2% 1,671 15..4% TOTAL 741 100.0% 10,815 100.0%
Source: ETR MOSES
A review of the occupational attachments, as shown in Table II-3, reveals that the Management Occupations category is by far the largest category for both team customers and all customers. This group accounts for approximately 1 in 5 team customers and slightly more than 1 in 5 of all customers.
A second important factor illustrated in Table II-3 is, with the exception of Office and Administration; the next four largest occupational groups (Computer and Mathematics, Health Practitioners, Business and Financial, and Architecture and Engineering) are large users of highly educated personnel. This finding is consistent with FY 2015 demographic data that indicated over one half (55%) of team customers and of all customers have a Bachelor’s Degree, and slightly more than 20 percent have advanced degrees. The two occupational groups represented among the Career Center customers that often require less education are Office and Administration and Sales. Collectively these two groups account for approximately 1 in 5 of team customers’ as well as all customers’ occupational attachments.

Analysis of the Job Referral Process Final Report Page 12
Table II-3 Occupational Attachments of Team Customers and All Customers
Metro South/West Workforce Area Calendar Year 2014
Occupational Group Team Customers Percent All
customers Percent
Management 140 18.9% 2,268 21.0% Office and Administrative 117 15.8% 1,489 13.8% Computer and Mathematical 89 12.0% 629 5.8% Health Practitioner 59 8.0% 460 4.3% Business and Financial 52 7.0% 762 7.0% Architecture and Engineering 48 6.5% 462 4.3% Sales 40 5.4% 894 8.3% Arts and Entertainment 39 .5.3% 380 3.3% Production 34 4.6% 329 3.1% Life and Physical sciences 28 3.8% 297 2.7% Transport, Material Moving/Construction 15 2.0% 639 5.9% Miscellaneous 78 10.5% 1,708 16.6% Unknown 2 0.3% 408 3.8% TOTAL 741 100.0% 10,815 100.0%
Source: ETR MOSES Note: The actual number of Team Customers was 747 and All Customer was 10,815. Customers can have previous jobs in multiple industries in MOSES
2.3 Career Center Services Provided to Customers
The Career Center services (core services) provided to all customers (universal access) and the intensive services provided to the Team customers were described earlier. The purpose of this section is to demonstrate the frequency of participation in each of the specific Career Center services. The participation rates for the Team customers, separate from all customers, is not available. Menu of Specific Career Center Services
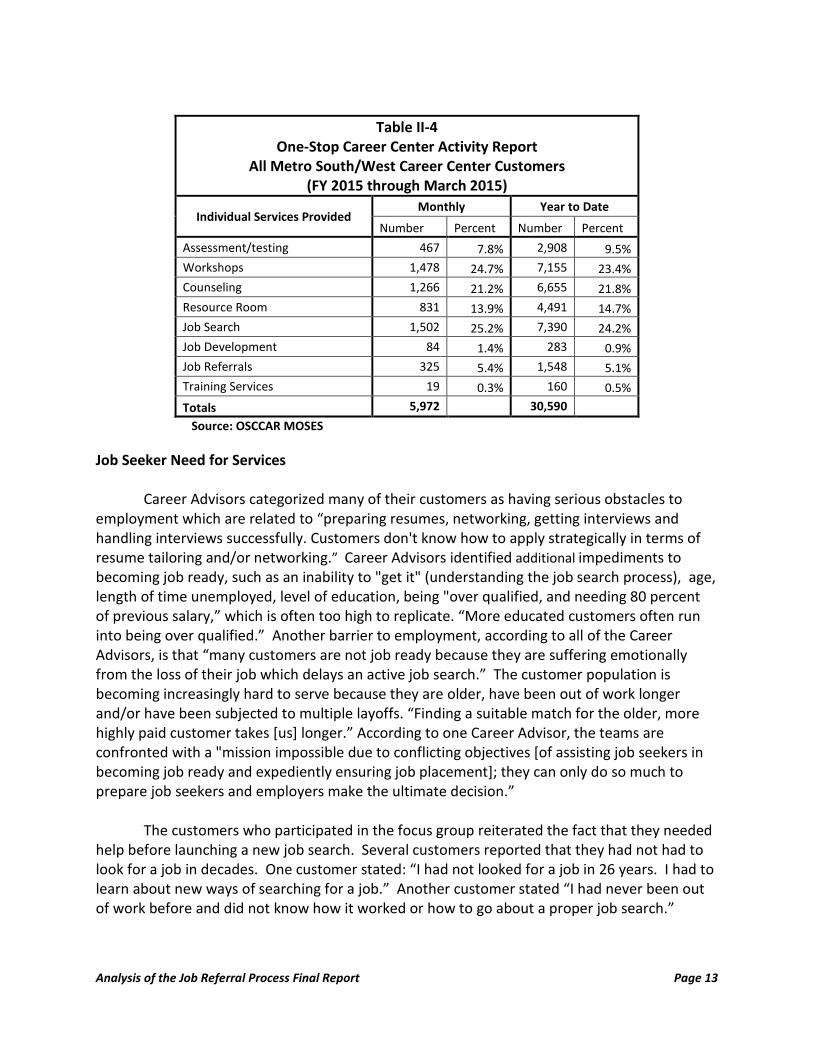
As shown in Table II-4, the total monthly participation amount was almost 6,000
separate activities and the year-to-date participation exceeded 30,000 activity events. The services with the highest usage were workshops, counseling, and the job search activity. Given that particular services are offered primarily as part of the intensive program and are mostly offered by the teams, it appears reasonable to suppose that Team customers are the primary users of specific services, such as training, which had a monthly participation rate of 19 and a year-to-date rate of 160. A second example is the assessment/testing activity; while some assessment is available to all customers; detailed assessments are provided mostly to Team customers. The area of major interest, job referrals, is discussed in detail in Section 2.4.
Analysis of the Job Referral Process Final Report Page 13
Table II-4
One-Stop Career Center Activity Report All Metro South/West Career Center Customers
(FY 2015 through March 2015)
Individual Services Provided Monthly Year to Date
Number Percent Number Percent Assessment/testing 467 7.8% 2,908 9.5% Workshops 1,478 24.7% 7,155 23.4% Counseling 1,266 21.2% 6,655 21.8% Resource Room 831 13.9% 4,491 14.7% Job Search 1,502 25.2% 7,390 24.2% Job Development 84 1.4% 283 0.9% Job Referrals 325 5.4% 1,548 5.1% Training Services 19 0.3% 160 0.5% Totals 5,972 30,590
Source: OSCCAR MOSES Job Seeker Need for Services
Career Advisors categorized many of their customers as having serious obstacles to
employment which are related to “preparing resumes, networking, getting interviews and handling interviews successfully. Customers don't know how to apply strategically in terms of resume tailoring and/or networking.” Career Advisors identified additional impediments to becoming job ready, such as an inability to "get it" (understanding the job search process), age, length of time unemployed, level of education, being "over qualified, and needing 80 percent of previous salary,” which is often too high to replicate. “More educated customers often run into being over qualified.” Another barrier to employment, according to all of the Career Advisors, is that “many customers are not job ready because they are suffering emotionally from the loss of their job which delays an active job search.” The customer population is becoming increasingly hard to serve because they are older, have been out of work longer and/or have been subjected to multiple layoffs. “Finding a suitable match for the older, more highly paid customer takes [us] longer.” According to one Career Advisor, the teams are confronted with a "mission impossible due to conflicting objectives [of assisting job seekers in becoming job ready and expediently ensuring job placement]; they can only do so much to prepare job seekers and employers make the ultimate decision.”
The customers who participated in the focus group reiterated the fact that they needed help before launching a new job search. Several customers reported that they had not had to look for a job in decades. One customer stated: “I had not looked for a job in 26 years. I had to learn about new ways of searching for a job.” Another customer stated “I had never been out of work before and did not know how it worked or how to go about a proper job search.”
Analysis of the Job Referral Process Final Report Page 14
Specific needs for help mentioned by the customers were assistance in developing a resume and assistance with practicing interviewing, given the lack of recent job interviewing experience. Several customers requested help with career counseling, either because the customers wanted to explore a new field of employment or wanted to better understand differing requirements to qualify for other jobs within the same field of employment. Job Seeker Experiences with Services
The customer focus group participants described the types of services they received from the Career Centers, including sitting down with a Career Advisor to review a resume; attending workshops, getting one-on-one counseling, participating in assessment sessions, and practicing job interview skills. Not all of the customers’ experiences with Career Center services were positive. According to several customers, the logistics for registering for workshops were cumbersome, requiring calling in from outside the facility as opposed to registering at the reception desk. One customer found that the quality of the individual workshops was high but overall the workshops were disconnected. Others lauded individual workshops by comparing the workshops to college courses; for example, one customer stated, “The LinkedIn workshop was by far the best workshop,” but the wait lists are long, suggesting a need for more sessions.
The focus group participants expressed a positive opinion of the overall quality of the Career Center services. Several customers had had previous non-ETR Career Center experiences which were unsatisfactory. These led to low expectations but after participating in the services these customers were “thrilled with the Norwood Career Center and its classes.” Many of the customers reported that the services were helpful and one customer stated: “[the Career Center experience] was excellent. The advice, cover letter and resume assessment, the workshops, the Career Catalyst Club were all terrific resources. I used much of their advice and information in my job search.” Another customer said, “Losing a job is not easy but the support, advice, assessments, and [Career Center] process were all very helpful.”
2.4 Job Referrals/Entered Employments
The crux of the Study (the Job Referral Process Analysis) is the “job referral” as
indicated by the staff records of this action in MOSES and the subsequent MOSES reports of job referral counts. The exploration of the job referral term and the job referral process with Career Advisors and Business Services Representatives revealed a source of confusion for the Study team as to what is meant by job referrals and what the reasonable expectations of the referral action might be. The Study therefore sought clarification as to the definition of “referral” with the following results:
According to the MOSES instructions, the term “job referral” is “used when [staff members] have discussed an available job (in person, on the phone, via email, etc.) and the customer indicates an interest in that job.” This is the precise definition the Career Advisors provided during the data collection interviews. The MOSES instructions also provide the following definitions:

Analysis of the Job Referral Process Final Report Page 15
• “Job Order Referral: used no matter how staff person or the customer locates the job;”
this category of referral counts as a referral on Career Advisor MOSES activity reports and this category is primarily used by Career Advisors to record a referral once it is completed.
• “Job Development Referral: used if staff person or the customer found the job on the
Internet or any other location;” this category of referral counts as a referral on Career Advisor MOSES activity reports and this definition also is used by Career Advisors during this type of event.
A third category of “referral,” according to the MOSES instructions, is:
• “Job Seeker Job Development Referral: this category is used if [a] job development effort results in an actual referral to the company;” this category of referral counts as an “Administrative Activity” on the ETR Employer Services in the MOSES Report.
The CLMS evaluation determined a small statistical relationship between job referrals
and entered employments. The ensuing ETR policy and operational directives instructed staff to increase the number of referrals made with customers and ensure that each referral activity is recorded in MOSES. It is clear from MOSES reports that beginning in FY 2012 this directive was followed. As shown in the ETR Monitoring Report (March 16, 2012), referrals increased from 107 to 203 for an 89 percent increase. What had not increased during this time period was the number of entered employments; in fact, the number of entered employments decreased by 6 percent (Sum, 2010).
This raises the question: What did the CLMS evaluation define as a job referral? The
Career Center staff reported the following: • Career Advisors reported understanding “job referral” to mean that a customer agrees
with the Career Advisor to apply for a specific job; this is recorded as a referral to a job order in MOSES. This also means that there is not a direct contact between Career Center staff and the employers.
• Business Services Representatives reported understanding job referral to mean the Job
Development Referral process as defined above.
And each of the team members reported making job referrals in accordance with their understanding of the definition.
Meanwhile, during this analysis of the job referral process, It became clear that both the PSW Executive Director and the CCIB Chair assumed that a job referral represented a direct connection between Career Center staff and an employer on behalf of a job seeker. This

Analysis of the Job Referral Process Final Report Page 16
assumption further highlights the confusion between PSW and ETR as to the meaning of a referral. To estimate the effect of Career Center services for the customers, information was assembled for four MOSES events: visits, referrals, entered employments, and hired from referrals. These numbers of events were calculated separately for the Team and the Non-Team customers. The data are presented for two parallel time periods; FY 2014 for the months July 2013 through March 2014, and FY 2015 for the months July 2014 through March 2015. These time periods were selected so as to specifically highlight the months that the Teams were first implemented and then compared to the months that the Teams were most complete and active. (While all agree that a full assessment of Team performance is premature, at this time, these comparisons potentially indicate initial effects.) As shown in Table II-5, the total number of customers declined between the two time periods; there were 15 percent fewer Team customers with services and 11 percent fewer Non-Team customers with services during the first part of FY 2015. (These differences are presumably due to the overall improvements in the local economy.) Without exception, however, the Team customers experienced more visits, with an average of 11.6 visits per customer in FY 2015 compared to 9.3 visits in FY 2014. The average visits per Non-Team customers remained the same at 3.9. The proportion of Team customers who entered employment increased from 37 percent to 41 percent. The Non-Team customers, who had lower entered employment rates than team customers in both time periods, realized an increase from approximately 16 percent in FY 2014 to 20 percent in FY 2015.
The picture that emerges from the job referral rates is less clear. The referral rates for both groups increased in FY 2015. Team customer referral rates increased from 26 percent to 37 percent, while Non-Team customer referral rates increased from six to 11 percent. Similarly, the proportion of customers who were hired from a referral increased for both groups. However, the data suggest that the job referral process is less critical to getting a job than other factors, since only 30 (9.7%) Team member employments and 35 (4.1%) Non-Team member employments resulted from a referral.

Analysis of the Job Referral Process Final Report Page 17
Table II-5 Metro South/West Career Center Customers
Visits, Referrals, Entered Employments, Hired from Referrals FY 2015 through March 2015
FY 2014 YTD FY 2015 YTD Change
Totals Average/% Totals Average/% Absolute Change
Percent Change
Team Customers
Total with service 974 824 -150 -15%
Visits 9,048 9.3 9,591 11.6 543 2%*
Entered Employments 364 37% 339 41% -25 3.6%
Customers with Job Referral 250 26% 308 37% 58 23%
Hired from Referrals 12 5% 30 10% 18 150% Non-Team Customers
Total with service 9,542 8,476 -1,066 -11.2%
Visits 36,924 3.9 32,420 3.8 -4,504 -0.1%*
Entered Employments 1,518 16% 1,729 20% 4% NA
Customers with Job Referral 597 6% 894 11% 297 50%
Hired from Referrals 26 3% 35 4% 9 35% WIA Customers
Title I Adult
Total Enrolled 28 49 21 75%
New FY 2014 Enrollments 9 32% 30 61% 21 233%
FY 2014 Entered Employments 12 43% 24 49% 12 100% Title I Dislocated Workers
Total Enrolled 436 429 -7 -2%
New FY 2014 Enrollments 122 28% 235 55% 113 92.6%
FY 2014 Entered Employments 183 42% 212 49% 29 16% Source: MOSES *For total visits, percent change is a function of the number of visits per proportion of customers
To further explore the relationship of the job referral process to a customer getting a job, the results of the two types of referrals were examined and the analysis is presented in Table II-6. As shown, the job development referrals for Team members resulted in an entered employment rate of 16 percent. This result is a considerable improvement over the Team member “referrals to job orders” and all of the results for the Non-Team members. This suggests that a better match is being made with the Team customers through the job development referrals, perhaps because the team process enables the Career Center staff to better understand both the employer needs and the job seeker’s “job readiness” and skills. The

Analysis of the Job Referral Process Final Report Page 18
data further suggest that the process of responding to a job order without any direct contact with an employer is less effective.
Table II-6
Metro South/West Career Center Customers Breakout of Referrals by Type of Referral and Entered Employments
FY 2015 through March 2015
Referrals and Entered Employments Totals Entered
Employment Rate
Team Customers Total Customers with Job Referral 315 Total Entered Employments 30 10%
• Job Development Referral 124
• Entered Employments 20 16%
• Referral to Job Order 278
• Entered Employments 10 4% • Customers with both types referral 87
Non-Team Customers
Total Customers with Job Referral 937
Total Entered Employments 35 4%
• Job Development Referral 156
• Entered Employments 8 5% • Referral to Job Order 877 • Entered Employments 28 3%
• Customers with both types referral 46 Source: MOSES Note: Slight variations from previous table due to MOSES processing protocols.
The Team Career Advisors reflected their understanding of the job order referral process when they reported that there has been “too much emphasis on referrals, given that they are very time consuming and not very productive.” They also reported that customers might say they are interested in a job order referral and then pursue it on their own without reporting back to the Career Advisor for MOSES accountability. Job order referrals are not appropriate for all team customers, according to the Career Advisors; many who are being case managed have the greatest barriers to re-employment and are not always job ready. Business Services Representatives agreed with these comments; “a bad referral can spoil an employer relationship that has taken months to establish.” One Career Advisor stated that, after the most recent evaluation (Monitoring Report, March 2012), “the goal became to increase job referrals; the problem is that the overall goal is to increase ’back-to-works’ (entered employments). These are not the same thing.”

Analysis of the Job Referral Process Final Report Page 19
Customers’ Experience with Referrals
All of the focus group customers had had some experiences with referrals. Most of these experiences were similar; a Career Advisor provided numerous leads (either in face-to-face meetings or via emails) with the customers following up on the leads by attempting to schedule an interview. The results of the referrals were mixed. Half of the group obtained a job interview from the Career Advisor referral but the efforts did not result in a job offer; another customer got a part-time job after pursuing several of the Career Advisor leads. One customer worked with a Business Services Representative, who made the employer contact and provided the customer’s resume to the employer. It did not “lead to an interview because the position was put on hold,” but the customer stated that it was very “helpful meeting with the BSR.” 3. EMPLOYER CUSTOMERS
This section provides a description of the Metro South/West employers, including sizes and industries, Career Center services received, and employer feedback obtained through telephone interviews.
3.1 Employer Characteristics in the Metro South/West Workforce Area
Given the renewed emphasis on serving employers within the context of a labor exchange system, a fundamental tenet of employer characteristics is the distribution of employers by size and the distribution of employers across major industry categories. The information provided in the following tables measures the number of jobs located at individual establishments within the Metro South/West area.
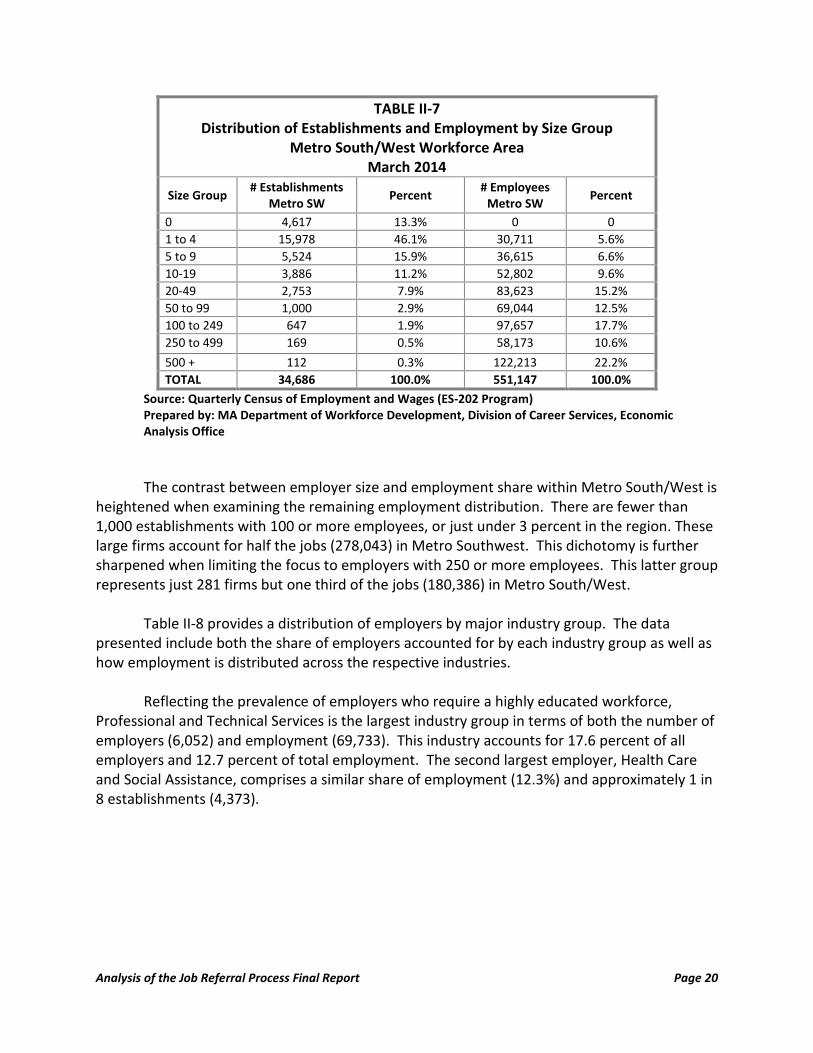
As Table II-7 indicates, there were 34,686 establishments located in the Metro South/West region as of March 2014, representing 551,147 jobs. Among the 16 Workforce Areas in Massachusetts, Metro South/West has the largest number of establishments by a wide margin, with the next largest being Metro North (23,052) and Boston (22,864).
Within Metro South/West, 1 in 6 employers (13.3%) have no employees. This group
represents individual sole proprietors without any employees. Employers with between 1 and 4 employees account for almost 16,000, or 46.1 percent of establishments in Metro South/West. In total, these two categories represent nearly 6 in 10 establishments (20,595) in the region, but just 5.6 percent (30,711) of all jobs. When establishments with 5 to 19 employees are included, the number of establishment rises to just over 30,000, representing 86.5 percent of all employers, but just over 20 percent (120,128) of the jobs. The number of mid-size (20-99 employees) firms in the region comprises slightly more than 10 percent of all establishments (3,753). Their share of employment, however, exceeds 25 percent and represents more than 150,000 jobs.
Analysis of the Job Referral Process Final Report Page 20
TABLE II-7 Distribution of Establishments and Employment by Size Group
Metro South/West Workforce Area March 2014
Size Group # Establishments Metro SW Percent # Employees
Metro SW Percent
0 4,617 13.3% 0 0 1 to 4 15,978 46.1% 30,711 5.6% 5 to 9 5,524 15.9% 36,615 6.6% 10-19 3,886 11.2% 52,802 9.6% 20-49 2,753 7.9% 83,623 15.2% 50 to 99 1,000 2.9% 69,044 12.5% 100 to 249 647 1.9% 97,657 17.7% 250 to 499 169 0.5% 58,173 10.6% 500 + 112 0.3% 122,213 22.2% TOTAL 34,686 100.0% 551,147 100.0%
Source: Quarterly Census of Employment and Wages (ES-202 Program) Prepared by: MA Department of Workforce Development, Division of Career Services, Economic Analysis Office
The contrast between employer size and employment share within Metro South/West is heightened when examining the remaining employment distribution. There are fewer than 1,000 establishments with 100 or more employees, or just under 3 percent in the region. These large firms account for half the jobs (278,043) in Metro Southwest. This dichotomy is further sharpened when limiting the focus to employers with 250 or more employees. This latter group represents just 281 firms but one third of the jobs (180,386) in Metro South/West.
Table II-8 provides a distribution of employers by major industry group. The data presented include both the share of employers accounted for by each industry group as well as how employment is distributed across the respective industries.
Reflecting the prevalence of employers who require a highly educated workforce,
Professional and Technical Services is the largest industry group in terms of both the number of employers (6,052) and employment (69,733). This industry accounts for 17.6 percent of all employers and 12.7 percent of total employment. The second largest employer, Health Care and Social Assistance, comprises a similar share of employment (12.3%) and approximately 1 in 8 establishments (4,373).

Analysis of the Job Referral Process Final Report Page 21
TABLE II-8 Distribution of Establishments and Employment by Size Group
Metro South/West Workforce Area Annual 2013
Industry Group # Establishments Metro SW Percent # Employees
Metro SW Percent
Professional and Technical NAICS 54 6,052 17.6% 69,733 12.7% Health Care and Social Assistance NAICS 62 4,373 12.7% 67,556 12.3% Other Services NAICS 81 4,219 12.3% 16,383 3.0% Retail Trade NAICS 44-45 3,425 10.0% 55,487 10.1% Construction NAICS 23 2,660 7.7% 21,001 3.8% Accommodation and Food Service NAICS 72 2,110 6.1% 37,664 6.8%
Wholesale Trade NAICS 43 2,062 6.0% 25,629 4.7% Administration and Waste Services NAICS 56 1,952 5.7% 32,090 5.8% Finance and Insurance NAICS 52 1,680 4.9& 20,229 3.7% Real Estate and Leasing NAICS 53 1,123 3.3% 7,484 1.3% Manufacturing NAICS 31-33 1,080 3.1% 51,720 9.4% Information NAICS 51 888 2.6% 26,794 4.8% Educational Services NAICS 61 764 2.2% 55,763 10.1% Arts and Recreation NAICS 71 610 1.8% 11,054 2.0% All Other 1,330 4.0%% 52,610 9.5% TOTAL 34,328 100.0% 551,147 100.0%
Source: Quarterly Census of Employment and Wages (ES-202 Program) Prepared by: MA Department of Workforce Development, Division of Career Services, Economic Analysis Office
An important contrast exists with regard to Other Services. This industry includes nearly the same number of establishments as Health Care and Social Assistance, with 4,219. Its share of total employment, however, is a mere 3.0 percent. This industry includes Repair Services, Personal Services, and Membership Organizations where small businesses are prevalent. In addition, Private Households, which represent half the employers in this industry, include individuals employed in the operation of a household such as cooks, maids, maintenance workers and caretakers. The fourth largest industry employer both in terms of the number of establishments and share of employment is Retail Trade. This industry accounts for 10 percent of all establishments (3,425) and employment (5,487). Two important industries that account for a small share of the employers but a much larger share of employment are Manufacturing and Educational Services. Manufacturing comprises just 3.1 percent of all establishments in the region (1,080) but nearly 10 percent of the jobs (51,720). This sector is especially critical to Team customers, among whom more than 20 percent had previously worked in this sector. Similarly, Educational Services represents a relatively small share of total employers (2.2%) but accounts for 10 percent of the region’s employment (55,763). Both secondary and post-secondary institutions are most commonly found to be large employers.

Analysis of the Job Referral Process Final Report Page 22
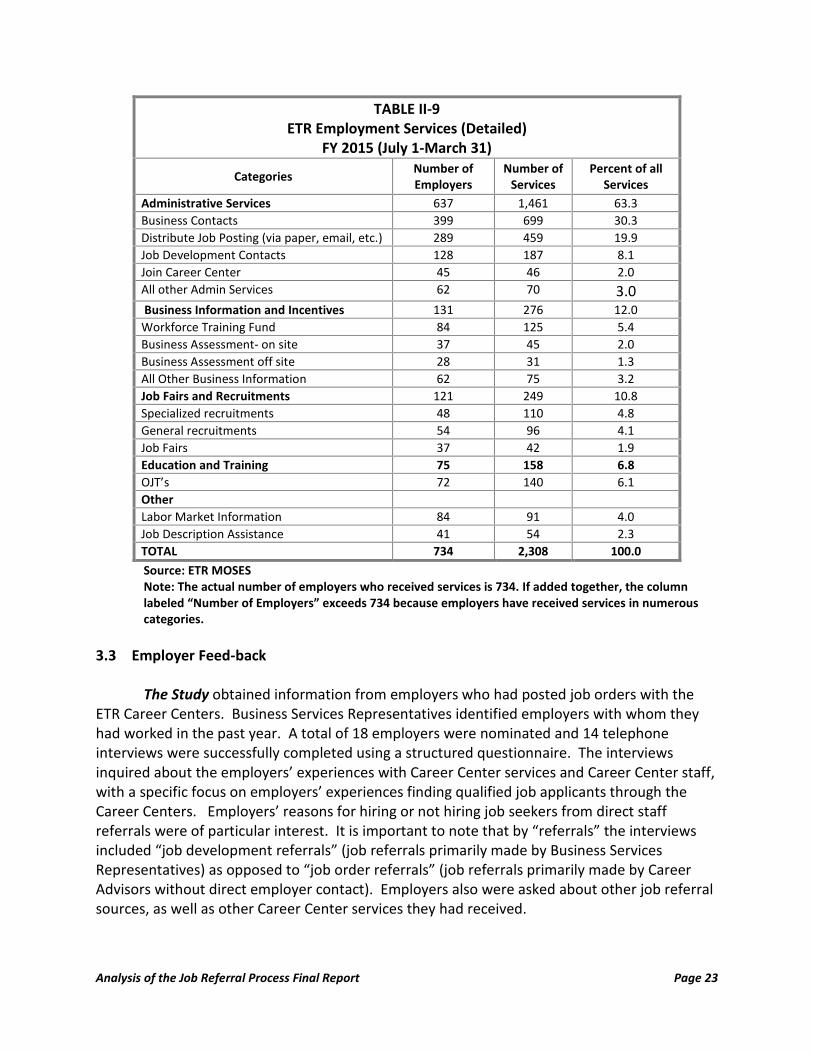
These two tables were presented to help guide and develop a targeting strategy for employer outreach. We believe an understanding of the industry and size makeup of the 34,000 establishments in Metro South/West is a critical step in helping focus staff efforts in matching the job seekers served by the Career Centers with employer needs. 3.2 ETR Employer Services FY 2015 (July 1, 2014-March 31, 2015) Table II-9 provides information on the services provided to employers by ETR staff during FY 2015. The information presented indicates the services by the major categories used in MOSES. Within each category the largest specific services are identified to provide a clearer picture of the disparate services employers received from ETR staff. Table II-9 also is intended to provide greater clarity as to the specific services most employers received. It should be noted that MOSES counts over 30 specific employer services; it is the intent of this section to highlight those services that are most commonly provided. The Administrative Service category accounted for almost two thirds of the 2,308 services received by employers. The two most frequently provided services within this category were “business contacts” (30.3% of all employer services) and “job postings” via paper, email, and social media (19.9%). Business contacts are made primarily by Business Services Representatives, who reach out to a business for the purpose of establishing or maintaining a relationship. These two services accounted for half the services received by employers. A third service in this category, job development contacts (which include “job development referrals”), comprised 8.1 percent of all employer services. As noted in the previous section, job development referrals play a very important role in increasing the chances that job seekers, especially individuals who are Team customers, will be hired from these contacts. It should also be noted that job development contacts rank third as the largest specific employer service. Business Information and Incentives represented 12.0 percent of all employer services, with “Information about the Workforce Training Fund” given to 84 employers and accounting for 5.4 percent of all services. The number of on-site business assessments, which is a critical tool for learning about a firm’s overall operation and staffing needs, was quite small, comprising just 2.0 percent of all employer services. Job Fairs and Recruitments comprised just over 10 percent of all services. This category of services includes “specialized recruitments,” which were provided to 48 employers. Among the remaining services presented in Table II-9, OJT information, which includes providing help in writing OJT contacts, represented approximately 6 percent of employer services. Labor market information (4.0%) and job description assistance (2.3%) also represented relatively small shares of all services.
Analysis of the Job Referral Process Final Report Page 23
TABLE II-9 ETR Employment Services (Detailed)
FY 2015 (July 1-March 31)
Categories Number of Employers
Number of Services
Percent of all Services
Administrative Services 637 1,461 63.3 Business Contacts 399 699 30.3 Distribute Job Posting (via paper, email, etc.) 289 459 19.9 Job Development Contacts 128 187 8.1 Join Career Center 45 46 2.0 All other Admin Services 62 70 3.0 Business Information and Incentives 131 276 12.0 Workforce Training Fund 84 125 5.4 Business Assessment- on site 37 45 2.0 Business Assessment off site 28 31 1.3 All Other Business Information 62 75 3.2 Job Fairs and Recruitments 121 249 10.8 Specialized recruitments 48 110 4.8 General recruitments 54 96 4.1 Job Fairs 37 42 1.9 Education and Training 75 158 6.8 OJT’s 72 140 6.1 Other Labor Market Information 84 91 4.0 Job Description Assistance 41 54 2.3 TOTAL 734 2,308 100.0 Source: ETR MOSES Note: The actual number of employers who received services is 734. If added together, the column labeled “Number of Employers” exceeds 734 because employers have received services in numerous categories.
3.3 Employer Feed-back The Study obtained information from employers who had posted job orders with the ETR Career Centers. Business Services Representatives identified employers with whom they had worked in the past year. A total of 18 employers were nominated and 14 telephone interviews were successfully completed using a structured questionnaire. The interviews inquired about the employers’ experiences with Career Center services and Career Center staff, with a specific focus on employers’ experiences finding qualified job applicants through the Career Centers. Employers’ reasons for hiring or not hiring job seekers from direct staff referrals were of particular interest. It is important to note that by “referrals” the interviews included “job development referrals” (job referrals primarily made by Business Services Representatives) as opposed to “job order referrals” (job referrals primarily made by Career Advisors without direct employer contact). Employers also were asked about other job referral sources, as well as other Career Center services they had received.
Analysis of the Job Referral Process Final Report Page 24
The inherent bias introduced by the Business Services Representatives selection of employers for the interviews was somewhat off-set by employers’ candid responses to the interview questions. A number of insights about employers’ experiences with the ETR Career Centers have been gleaned and provide a strong foundation, including specific suggestions, for recommendations to improve Career Center services.
Employer Characteristics: The employers interviewed were representative of the total
Metro South/West employers in terms of industries and size categories. The following industries were represented in the employer interviews: Manufacturing, including consumer products and high tech/defense; Retail including Health and Personal Care; Telecommunications; Finance/Banking; Service/Repair; High Tech Sales; Information/Software Publisher; and Leisure and Hospitality. Variations in employer size were also reflected among the employers contacted, including:
• Very small – 10 or fewer employees (4 employers) • Small – 20-99 employees (4 employers) • Mid-size – 100-249 employees (3 employers) • Large – 250+ (3 employers).
How Employers Learned about Career Centers: The telephone interview began with a
question as to how employers learned about the Career Centers. Four employers reported knowing about Career Centers from their own experiences when they were unemployed and two had worked with other Career Centers when they were in another job. One had actually worked at a Career Center. Two employers had been contacted directly by Business Services Representatives, and the remaining employers learned about the Career Centers in various ways, including Chambers of Commerce presentations.
Career Center Services: Employers expressed appreciation for the Career Center services and with Career Center staff assistance in accessing information and other services: These services included:
• Assistance in writing job descriptions (two small employers) • Posting jobs • TABE (Basic education testing) • Developing 2 OJT’s • Assistance in obtaining Workforce Training Fund and Hiring Incentive Training Grants • Making connections with Government agencies to assist their small business • Information about Work Sharing, which an employer almost used until business
picked up • Clarifying new laws and regulations.
Working with Career Center Business Services Representatives: When working with
Career Centers, employers expressed a strong preference for working with a single point of contact, and for many employers this was a must. The primary reason cited was as a
Analysis of the Job Referral Process Final Report Page 25
relationship developed with a Career Center staff member, the person becomes familiar with the hiring needs and the specific characteristics, preferences and requirements that are important to the business. Two large employers worked with multiple Career Centers but had a primary contact at each center. In one coordinated effort across different areas, ETR was the primary contact and on-site recruitments were the main source of Career Center applicants.
Hiring Career Center Job Seekers: Among the 14 employers, nine had hired a job seeker as a result of a Career Center service, including hiring directly from a job development referral (four employers); from on-site recruitments (three employers); and from a Career Center referral in a previous year (two employers). The remaining five employers had not hired Career Center job seekers. Several employers who said they had not hired anyone from the Career Centers noted that if an applicant was not directly related to a job development referral, they had no way of knowing how the applicant had found out about the job, even if the applicant learned about it from JobQuest.
The three large employers reported a preference for on-site recruitments since these employers typically had multiple openings for multiple positions. The employers stated that the Career Center pre-screening service had been useful and was an important reason for using this service. One employer specifically found that the pre-screening yielded high quality applicants and reported filling approximately 80 percent of their job openings with Career Center applicants.
Employers were asked about their reasons for not hiring Career Center job seekers. In
general, the responses centered on selecting applicants that had better qualifications and more specific experience than the Career Center applicants. Specific comments included “[applicant] was not a good fit” and/or “did not fit into the prevailing corporate culture.” Two employers stated that the improved labor market conditions had adversely affected the quality of Career Center applicants and now preferred hiring individuals who were already employed, suggesting a bias against unemployed job applicants.
There were several instances in which the employer was not pleased with a specific
referral. Being unprepared for an interview, even after the questions had been provided in advance, was noted. In another instance, a candidate had a job offer rescinded after the employer found that the candidate did not meet the minimum qualifications. One employer felt a more aggressive and proactive approach was needed. When the Career Center was contacted with job postings it was not clear who at the Career Center was responsible for the job match. “Getting the word out” was seen as passive and inadequate. In their experience, the loop between potential job seekers and the employer was not closed. Employers suggested ways to increase the probability of Career Center job seekers finding employment:
• Better interview preparation • Better preparation for Job Fairs. (One employer noted that some job seekers came
without a resume.) • Better advertising and marketing of available services
Analysis of the Job Referral Process Final Report Page 26
• Assistance in developing training – both longer term (Apprenticeship) and short term (QuickBooks).
Two employers reported deep frustration with JobQuest, specifically when they
searched resumes and found that the job seekers chose to be anonymous. In this situation, the employer is required to make a list of job seeker ID numbers, contact a Career Center staff person who then looks up the number in MOSES and contacts the job seeker. The Career Center staff then reports back to the employer to let them know if the job seeker wishes to be contacted. The employers found this process tedious and inefficient. One employer noted that the anonymous candidates are often the ones in which they have the most interest.
Despite some disappointing Career Center experiences, employers anticipate continuing to work with the Business Services Representatives to fill staffing needs. Almost universally, employers commented that the labor market has improved significantly, especially in the last year and, therefore, employers will have increasing numbers of job openings. One large employer noted that they have eased hiring and entry requirements for entry level positions. Most of the employers are expanding and a common refrain was the need for more applicants. Several employers noted that turnover has increased and a greater emphasis is being placed on retention.
Alternative Recruiting Sources: Job Boards, including Indeed, Craig’s List, LinkedIn and
Monster were all identified by employers as additional ways to find workers. Indeed was noted for being user friendly, especially when compared to JobQuest for posting jobs. Low cost was cited as a reason for using Craig’s List while LinkedIn was referenced as being useful for higher level positions. Staffing agencies were mentioned by three employers as an important recruitment tool for higher level and niche positions. One employer reported considering the use of a staffing agency with the belief that a better caliber of job applicants would be provided. Employers also reported using a smattering of other recruitment sources, including Job Fairs (both Career Center and other providers), other workforce organizations for targeted populations, working directly with schools for entry positions, and newspaper advertisements.
Satisfaction with Career Center Services: When asked about their satisfaction with the
services received and whether expectations were met, employers were almost unanimous in their praise for the staff. The consistent theme that emerged was the importance that employers place on having a relationship with a specific staff person over a period of time. This is especially true for small and mid-size employers. It is ultimately what contributes to both employer satisfaction and a willingness to use the Career Center on a continuous basis.
Several factors were cited by employers for using the Career Center beyond the obvious reason of needing qualified applicants. The free services were seen as very helpful, especially when compared to the costs associated with private staffing agencies. The pre-screening done by Business Services Representatives before making direct referrals was specifically mentioned by four employers, even when a hire did not result. A number of small and mid-size companies

Analysis of the Job Referral Process Final Report Page 27
placed a real value on having a direct contact when questions about other services or informational needs arise.
4. MASSACHUSETTS ONE-STOP EMPLOYMENT SYSTEM (MOSES)
MOSES stands for Massachusetts One-Stop Employment System which is the proprietary management information system maintained by the state Executive Office of Labor and Workforce Development (EOLWD). MOSES is a restricted computer system that can be accessed only by individuals who have been trained by Department of Career Services on the use of MOSES and who have signed a confidentiality agreement. 4.1 MOSES Overview
MOSES contains records with unique identification numbers assigned to hundreds of
thousands of job seekers and employers who are members of a Massachusetts One-Stop Career Center. Each record contains a number of tabs that open a cascading series of windows with additional tabs that open templates where users, primarily Career Center staff, can enter information. A job seeker record contains basic information such as name, age, address and contact information, as well as background information, including demographic data, educational attainment and work experience. Information about a job seeker’s eligibility for various programs and services provided to the individual are also recorded in MOSES. An employer record includes basic information about the company, including associated industry sectors (e.g. retail, manufacturing, pharmaceutical, etc.), contact information for individuals involved in hiring, and background information, such as the benefits the employer provides to employees. Job orders can be entered and tracked through the employer record in MOSES.
Within Metro South/West, MOSES supports numerous work activities including (1)
management reports of all Career Center activities; (2) case management reports used by Career Advisors and Business Services Representatives and other staff to track activities at the job seeker, employer and Team levels; and (3) job matching reports via an interface with the Massachusetts job matching system: JobQuest. Information in MOSES also is used to generate the performance measures contained in the monthly One-Stop Career Center Activity Reports (OSCCAR), which can frame activity data on various levels, including individual Career Centers, Local Workforce Investment Areas, and statewide. The system was originally implemented in 2000 with periodic generational systems improvements. Data in MOSES can be analyzed in a variety of ways using Crystal Reports, a business intelligence computer application marketed by SAP SE, based in Germany. This is the source of the regular Dashboard reports ETR provides to PSW.
As a system, MOSES is viewed by senior management as well as the Career Advisors and Business Services Representatives as cumbersome and “antiquated” with the exception of the management reports, which provide accurate and timely regular reports, as well as responses to management queries. Career Advisors and Business Services Representatives reported that the case management information is useful in helping staff track all of the customer activities.
Analysis of the Job Referral Process Final Report Page 28
The perceived disadvantages of the MOSES case management function include the amount of time staff must spend, daily and weekly, updating the information in the system, since every activity must be recorded. Several Career Advisors and Business Services Representatives have had experience (in previous jobs) with more contemporary case management systems, which they found to be more efficient and “user friendly.” The MOSES function that generates the most frustration among staff members at all levels throughout the organization is the job matching function. A fuller description of this function is provided below. 4.2 MOSES/JobQuest Function A job matching system connects a job seeker to a job order. The quality of the information that populates these two system components is dependent on the sources and accuracy of the information. The utility of the job matching system is dependent on the ability of the automation to create appropriate matches.
According to MOSES, there were more than 23,000 open job orders in Metro South/West in April 2015 of which over 21,000 (90.9% of the total) were provided by us.jobs, the national job bank, and 1,826 (7.8% of the total) were created directly by employers through JobQuest, the Massachusetts job bank. The remaining job orders were entered into MOSES by Career Center staff. The large majority of job orders available to the Career Center staff and customers were added to the database via the MOSES computerized connections to us.jobs. (This process is termed “spidering,” since MOSES reaches out to the us.jobs system and downloads the information in spider web fashion. There is no human interface and therefore no ability to verify the legitimacy of the job orders.) The MOSES/JobQuest job orders created in calendar year 2014 include: (1) job orders created by Career Center staff; (2) job orders created by employers with ETR services; and (3) job orders created by employers with no ETR services. Among these job orders, 4,306 or 34 percent (of the total 12,665) were created by ETR staff or by employers with ETR services. The JobQuest job orders and job seeker identifiers are classified by the Standard Occupational Classification System (SOC) codes, which are obtained from the U.S. government system for classifying occupations. The SOC is designed to cover all occupations in which work is performed for pay or profit, reflecting the current occupational structure in the United States. The 2010 SOC includes 840 occupational types. When a job matching task is initiated, the MOSES system “looks” at the job seeker’s job code (e.g., “15-1130” for “Software Developers and Programmers”) and “matches” this code to job orders that contain the same code. This process appears straight-forward on the surface, and, yet, as exemplified in the PSW RFP for this study, “employers submitted 11,322 job orders” to which “622 people were referred…this meant no referrals were made to 10,928 orders.” This apparent disconnect between job orders and job referrals was a major factor in the decision to conduct the Study.

Analysis of the Job Referral Process Final Report Page 29
Some technical issues with JobQuest are reflected in this RFP example. Firstly, the use of the SOC codes for job matching is inadequate because there is insufficient detail in so many of the occupational codes. For example, a recent search for a “landscape architect” job yielded hundreds of listings for landscapers. Also, there are no SOC codes for many of the specialized professional occupations appropriate to the Metro South/West job seekers. An example of this shortcoming occurs when a search for a job seeker with a background in construction project management produced over 500 job orders for “project manager” in any field.
The Career Advisors with whom the Study met provided a real life case example of a job matching activity in January 2015. This case illustrates the multiple problems associated with JobQuest. Job Seeker A is a 52 year old woman with a Master’s Degree in Mathematics and Computer Science. She has 30 years of experience in the fields of finance and computer systems. Her work history includes multiple experiences in professional positions with increasing technical and management responsibilities. Her position, prior to job layoff, was as the Project Manager for the creation of a specialized computerized financial accounting system. The results of a JobQuest search for job matches yielded 82 pages, with 30 listings per page, for a total of 2,500 job orders. The information provided for each job order included the Job Number (for MOSES tracking), the listing date, the Job Title (e.g., “Senior Business Intelligence Analyst”), the Company (e.g., Mathworks), the Location (e.g., Natick), columns for minimum and maximum salary (which were empty for 99% of the job orders), and the Hours per Week. The list of job orders on the computer print-out was organized by the following categories:
• Possible job matches based on work experience Computer and Mathematical Occupations Management Occupations Managers, all other
• Possible job matches based on training Computer and Information Systems Managers Computer hardware engineers Computer network support specialists Computer systems analysts Computer user support specialists Construction managers Employment, Recruitment and Placement Specialists General and Operations Managers Industrial Engineers Operations Research Analyst Program Directors, Social and Community Service Managers, Software Developers
The challenges confronting Job Seeker A and the Career Advisor included: (1) the huge
number of job orders was unmanageable; (2) with only the job title available, there was insufficient information with which to cull through the list and make a reasonable assessment

Analysis of the Job Referral Process Final Report Page 30
of which jobs might be appropriate; (3) a selection of several potentially promising job orders, based on best guesses, led to multiple broken links with the employers; (4) among the job orders with live employer links, Job Seeker A discovered that frequently there was no job (either it had been filled or it did not exist). This example of a job matching experience reflects frequent similar occurrences especially among the older, more experienced professional workers who make up the majority of the Metro South/West job seekers.
4.3 Staff Perspectives and Experiences with JobQuest
The Career Advisors, Business Services Representatives, Supervisors and Managers who participated in this analysis had little good to say about MOSES. Most important, they agreed almost to a person that MOSES was virtually useless performing one of its key functions – matching qualified job seekers to job orders posted by employers. Much of the fault lies with the system’s lack of precision both in collecting data about the skills of job seekers and in establishing the requirements of jobs posted by employers. The concerns about MOSES, generally, and JobQuest specifically, focused on data quality and systems limitations.
Data Quality: Most of the Career Advisors and Business Services Representatives reported that the “JobQuest data quality is a huge problem; information is not current and too frequently the links are broken; MOSES is cumbersome and not useful for tracking employer contacts.” The locations identified in JobQuest also are frequently misleading. For example, “job location may reflect corporate headquarters, not the location where the person would be working.” The lack of salary information, mentioned above in the case study, is highly problematic for JobQuest users, since salary information is a useful discriminator for identifying a good job match. A related data quality issue was identified; the lack of specific information about job openings, including required qualifications and descriptions of duties, reinforces the inadequacies of JobQuest.
Systems Limitations: The staff interviewed for the Study expressed enormous frustration with JobQuest. As one staff member reported, “the job matching system requires force-fitting job seekers and job orders into categories that are not always reasonable or accurate. The frequent dead links result from MOSES pulling in jobs from us.jobs.” The JobQuest matching process is time consuming and not very helpful, according to several Career Advisors. One Career Advisor described getting “pages of matches to pour through and typically [she] winds up with a lot of dead links and very few real matches.” But mostly, according to one staff member, “nothing connects to anything else. For example, employers have different identification numbers on different reports and systems.”
Alternatives to JobQuest: The Business Services Representatives reporting using alternative job matching systems with the most frequently cited example being LinkedIn. Again, these staff members reported knowing that there are better “software systems out there that would be better than JobQuest at matching job seekers and job opportunities.”

Analysis of the Job Referral Process Final Report Page 31
III. SUMMARY AND RECOMMENDATIONS
The Analysis of the Job Referral Process broadly examined the Metro South/West Career Center service delivery process in light of the recently implemented integrated teams. The focus of the analysis, however, was on job referrals and job orders. The purpose of this section is two-fold; firstly, to summarize the major findings from the Study related to the two key questions outlined in the RFP and secondly, to provide policy and operational suggestions which are supported by the Study findings. 1. TWO QUESTIONS 1.1 Question Number One
The first question addressed by the Study is: Why has ETR referred so few qualified applicants to job orders? Earlier research (2010) suggested a positive relationship between the number of Career Center referrals and the number of customers who entered employment. This research finding provided the impetus for Career Center management and staff to concentrate additional effort on making job referrals. A subsequent ETR Monitoring Report (2012) found that the number of job referrals had significantly increased without a related rise in the number of entered employments. This quandary led to the current analysis. To better understand the job referral process, the Study team explored the definition of “job referral” and found that there are two separate and distinct types of job referrals:
• “Job Order Referral: used no matter how a staff person or the customer locates the job;” this category of referral counts as a referral on Career Advisor MOSES activity reports and is primarily used by Career Advisors to record a referral once it is completed.
• “Job Development Referral: this category is used if [a] job development effort results in
an actual referral to the company;” this category of referral counts as an “Administrative Activity” on the ETR Employer Services in the MOSES Report.
To further explore the relationship of the job referral process and a customer getting a
job, the results of the two types of referrals were examined for FY 2015 through March, 2015. The comparison found that the job development referrals for Team customers resulted in an entered employment rate of 16 percent. This result is a considerable improvement over the Team customer job order referrals and all Non-Team customer referrals which resulted in an entered employment rate, which ranged from three to five percent. It appears that a better job match is being made with the Team customers through the job development referrals, perhaps because the team process enables the Career Center staff to better understand both the
Analysis of the Job Referral Process Final Report Page 32
employer needs and the job seekers’ “job readiness” and skills. The data further suggest that the process of responding to a job order without any direct contact with an employer is much less effective. 1.2 Question Number Two
The second question addressed by the Study is: Why have so few ETR referrals been
hired for jobs that match applicants’ qualifications? To address this question, the Study first examined the Career Center and employer
relationships and the process through which job orders are listed within the job banks. According to MOSES, there were over 23,000 open job orders in April 2015. This number suggests a staggering set of opportunities that should be of benefit to all of the Metro South/West job seekers. A closer review, however, demonstrates that over 21,000 (90.9% of the total) job orders were provided by us.jobs, the national job bank, and 1,826 (7.8% of the total) were provided by MOSES/JobQuest, the Massachusetts job bank. Career Center staff and job seekers alike testified that the us.jobs job order listings often do not represent real employment opportunities. The study then concentrated on the MOSES/JobQuest job orders which included: (1) job orders created by Career Center staff; (2) job orders created by employers with ETR services; and (3) job orders created by employers with no ETR services. Among these job orders, 4,306 or 34 percent were created by ETR staff or by employers with ETR services.
The next step in the analysis was the review of the job matching process which involves
a computerized search that matches the job seeker’s occupational code (e.g., “15-1130” for “software Developers and Programmers”) to job orders with the same occupational designation. While this process seems straight forward, there is a relatively low rate of entered employments. This raises the question “Why?” Some technical issues with MOSES/JobQuest are salient, as indicated above.
Several other factors are affecting the number of entered employments resulting from referrals.
• Job Search Issues: Career Advisors categorized many customers as having serious obstacles to finding employment, including their inability to “prepare resumes, network, get interviews and handle interviews successfully.” Relatedly, these customers may have unrealistic professional aspirations.
• Job Readiness Issues: Career Advisors identified additional impediments to becoming
job ready, such as age, length of time unemployed, level of education, being over-qualified, and needing "80 percent of previous salary” which is often too high to replicate. “More educated customers often run into being overqualified.” The customer population is becoming increasingly hard to serve because they are older,

Analysis of the Job Referral Process Final Report Page 33
have been out of work longer and/or have been subjected to multiple layoffs. “Finding a suitable match for the older, more highly paid customer takes [us] longer.”
• Psychological Issues: Another barrier to employment, according to all of the Career
Advisors, is that many customers are not job ready because they are suffering emotionally as a result of their job loss and are not yet ready to begin an active job search process.
• Challenges associated with customer follow-up: While Career Advisors maintain ongoing communication with the “case-managed” customers, including obtaining information about the results of job referrals, there is limited follow-up with Non-Team customers, who may be getting employment as a result of Career Center services.
• Difficulty in Counting ETR Referrals that Result in Entered Employments: There is
universal agreement among Career Center staff and employers that it is not possible to account for every Career Center referral that results in a hire. Employers frequently do not know that a job seeker was a Career Center referral; on-line job applications (a process used by many large employers) provide no mechanism for this type of accountability. The primary source of the entered employment data results from small and medium sized employers who have on-going relationships with the Career Centers together with the entered employment results obtained by the Career Advisors from follow-up activities.
2. CONCLUSIONS
The Study made every effort to specifically address the two guiding questions; this process has led to the recognition of the ultimate question: what service strategies improve the chances of Career Center customers finding jobs that meet both the needs of job seekers and the needs of employers? It appears, from the findings presented in the report, that an emphasis on job referrals does not fully capture all of the factors critical to the Career Centers’ mission. It also is apparent that not all job referrals are created equally. Other concluding comments include:
• Relationships still matter, although perhaps not as much as in the past. Our findings
suggest that a direct connection with an employer, especially with a Business Services Representatives, increases the chances that a “meaningful” referral will be made. In addition, a “meaningful” referral has a much better chance of resulting in a hire. This is especially true for small and medium size employers. It appears that some strides have been made in this regard with the hiring of two new Business Services Representatives in the past 6 months.
• Distinguishing between the types of referral is critical. Job referrals initiated by either a job seeker or Career Advisor appear to be much less effective than a job development

Analysis of the Job Referral Process Final Report Page 34
referral that results from a contact with a Business Services Representative to an employer.
• Conversely, reliance on automated matching often lacks adequate information for both the job seeker and employer. Sifting through hundreds of “matches” does not appear to be especially fruitful in terms of job seekers finding jobs.
• The reliance on online applications, particularly among larger employers, however, does mitigate the impact of a relationship between the staff and employer. Although we did not obtain hard evidence, it does appear that applying on line, without any personal connection to the employers, reduces the chances of a Career Center job seeker getting hired, since the employer has no special knowledge of the candidates qualifications.
• Onsite recruitments are valued by many employers, especially larger firms. The advantage is that many job seekers have an opportunity to apply directly for a job once they get past the pre-screening process. The downside of on-site recruitments is that typically only a small fraction the referrals will result in a hire, since there are typically many candidates for each position.
The findings from the Study support a set of recommendations, described below. 3. RECOMMENDATIONS
The first recommendation is designed to address the process of identifying specific employers by Business Services Representatives for job development referrals together with the process for pointedly directing job seekers to specific job opportunities. This recommendation is described in two parts and is numbered 1.a and 1.b below. 1.a. Create a targeted approach to job development which would include all activities associated with building employer relationships, obtaining appropriate job orders, and making job order referrals that offer a truly “good fit” between employer and job seeker.
Profiles of Metro South/West employers, including employer size and the industry and occupations associated with these employers, was presented earlier in this report. These profiles represent a good starting point for creating a targeted approach to developing employer relationships and identifying job openings. Targeting types of employers by size and industries would provide a mechanism for sorting the 35,000 employers into more manageable groups. A first sort might be employer size; it is clear that the most fruitful employer relationships occur among the small and mid-size employers, who truly need and appreciate the services offered through the Career Centers. A second sort might be by industry. The Business Services Representatives are already using targeting as a means for building their relationships. By formalizing this approach through operational policies and resources, the

Analysis of the Job Referral Process Final Report Page 35
work of the Business Services Representatives would become increasingly cohesive, thereby providing a firm foundation for an inclusive employer network.
In developing a strategy for targeting employers, the expertise that exists among the Business Services Representatives should be featured and incorporated; the BSR Group which meets weekly with the BSR manager would be a logical vehicle for developing such a strategy in conjunction with the Executive Director, Deputy Director, and the Career Center Managers. In supporting these efforts, consideration should be given to the purchase of relatively low cost employer name and address listings from a vendor such as Info USA. These databases have valuable contact information and can typically be sorted by industry, size and location. 1. b. Create a targeted approach to help job seekers identify employers that are aligned with job seekers’ professional experiences and education.
A targeted approach to referrals for job seekers is the “other side of the coin” to the targeted employer approach. As mentioned above, the majority of Metro South/West job seekers span specific professional areas such as information technology, education, finance, and health care. For example, many of the job seekers interviewed in the focus group had professional interests and experience in higher education. Metro South/West includes numerous employers associated with higher education. Job seekers could be assigned to a team that has experience working within specific occupational and/or industry sectors. Again, the Career Centers have adopted this approach to some extent with the Catalyst Club, which is not industry specific but does focus on supporting a group of similar professionals. Extending this approach to include job seekers with similar backgrounds would increase efficiencies already being experienced among the integrated teams. .
In summary, a strategy which considers the industry and occupational background of Career Center job seekers as well as the size and industry distribution of local employers would hopefully result in identifying employers who could both hire Career Center customers and benefit from the range of services available to them. 2. Provide Business Services Representatives and Career Advisors with the strategies and tools they need to improve the job matching process.
Business Services Representatives are providing critical services to employers and to job seekers. It is especially clear that the implementation of the integrated teams has increased the Business Services Representatives’ knowledge of specific job seekers’ situations, which allows for better referrals to known job openings. The full appreciation of Career Advisors, together with job seekers, for the added value of including the Business Services Representatives in individual job seeker strategies and in case management discussions is clear. Similarly, Career Advisors are supporting the job seekers with the services needed to become “job ready.”

Analysis of the Job Referral Process Final Report Page 36
These highly committed professionals are working at a disadvantage because they lack some vital tools. A more streamlined, efficient automated case management system would greatly improve Career Advisors’ ability to ensure that job seekers are progressing with the job search plan. The case management system also would facilitate customer follow-up efforts which are a major source of information about job seeker outcomes, especially entered employments.
Another essential “tool” for the Career Advisors and Business Services Representatives is a cutting-edge job matching system. This report includes a case study of a job seeker’s experiences with the MOSES/JobQuest job matching report; namely the list of 2,500 job listings with only the job title appearing on the list. As demonstrated, this approach was not helpful to the job seeker. Career Advisors and Business Services Representatives all spoke knowledgably about alternative tools, such as those used by private job search companies, to support the job matching process. Conducting an investigation into other, better, job matching systems is highly recommended.
At a minimum, ETR should consider limiting job matching to those job orders posted in
MOSES/JobQuest by employers and ETR staff. Including job orders from us.jobs, which account for 90 percent of all available job orders, detracts from a targeted job search by generating pages and pages of meaningless job listings. Job seekers would still be able to search us.jobs if they believed that possible matches had been overlooked.
The posting on Job/Quest of resumes without contact information for Career Center
customers is a source of consternation to both job seekers and employers. The multi-layered process for contacting a job seeker, via JobQuest, by employers with relevant job openings is especially frustrating and appears to run counter to good customer service. Subsequent to preparation of the final report, we learned that this anonymous posting is a requirement and not an option for the job seeker due to confidentiality issues. We are revising our original recommendation and now strongly encourage PSW and ETR representatives to notify the Department of Labor and Workforce Development (DLWD) about the adverse impact of anonymous postings. We also believe this policy has a negative effect on meeting the Federal Performance Standards as it makes employers less inclined to contact job ready customers .It is our strong belief that DLWD should be urged to reconsider this policy and allow job seekers the option of including their contact information on a voluntary basis so that interested employers can contact these job seekers directly.
As part of a targeted job matching strategy, consideration should be given to including
neighboring workforce areas, specifically Central Mass and Metro North. The proximity of Worcester and Milford as well as towns along Route 128 represents reasonable commuting options for many of ETR’s customers, especially those served by the Framingham Career Center. In addition, workforce area boundaries are irrelevant to employers. Including these neighboring areas could be done either as part of an overall match or separately, depending on the preferences of the job seekers and Career Advisors. It is the authors’ contention that expanding the geographic areas and eliminating us.jobs in the matching process will result in a

Analysis of the Job Referral Process Final Report Page 37
much more efficient and targeted job matching process. At this point, it should be reinforced, however, that the automated job matching process is only one component of an effective job search process.
It must be emphasized that good tools are important as a complement and not a
replacement for developing relationships with employers. As part of the relationship development process, consideration should be given to increasing the number of onsite assessments, especially with new employers. The onsite assessments are another valuable “tool” in developing a more comprehensive understanding of an employer’s business and hiring needs.
3. Apply strategic planning to review current operations in light of WIOA
In addition to the current service delivery mix, the new Workforce Innovation and Opportunity Act (WIOA) provides an opportunity to review and revisit current service priorities. Developing a potentially revised service menu will require strategically thinking about a number of questions including: what should the service priorities be? How do the service priorities align with WIOA and other funding streams? What are some of the service options to be considered?
When reviewing different service options, there are always tradeoffs to be considered.
With regard to Career Center customers, should more effort be directed to providing the intensive services featured in the team approach? Such an approach appears to assist job seekers through more comprehensive and coordinated assessment and counseling as well as brokering between BSR’s and employers. These services, however, are much more staff and resource intensive. An enhanced focus on more intensive services may increase the likelihood that fewer customers could be served.
From an employer perspective, should services focus primarily or exclusively along the lines of a recruitment model, in which the priority is meeting employer hiring requirements? Such a focus would necessitate more direct employer interaction with staff and potentially reallocating staff resources. In addition, a recruitment emphasis typically focuses on finding applicants who are job ready, which often is not the case with many of the current Career Center customers, and especially Team customers.
It should be emphasized that there are no right or wrong answers as it pertains to service mix and priorities. It is ultimately up to the workforce partners in Metro South/West to develop strategies that connect the region’s workforce priorities with the funding streams required to deliver such services.
It is our hope that this concluding section will help foster a discussion among all the
relevant partners regarding optimal service delivery strategies to assist both job seekers and employers in the Metro South/West service area.

Analysis of the Job Referral Process Final Report Page 38
REFERENCES Commonwealth Corporation and New England Public Policy Center of the Federal Reserve Bank
of Boston. (2012). Labor Market Trends in the Metro South/West Region. www.bostonfed.org/neppc. Boston, MA.
Corporation for a Skilled Workforce. (2013). One-Stop Career Centers Must be Re-Invented to
Meet Today’s Labor Market Realities. Ann Arbor, MI. Dunham, Kate et al. (2004). Business as Partner and Customer under WIA: A Study of
Innovative Practices. Social Policy Research Associates. Oakland, CA. ETR. (January 2014). Career Center Initiative Board Business Plan. Project One: Enhancing the
Business Model with the Team Concept. Marlborough, MA. ETR. (2012). Metro South/West Employment and Training Resources; FY12 Transition Plan
Implementation Monitoring Project. Marlborough, MA. Eyster, Lauren et al. (2013) Innovations and Future Directions for Workforce Development in
the Post-Recession Era. Urban Institute. Washington, D.C. Mathematic Policy Research. (2011). Effective Case Management: Key Elements and Practices
from the Field. Washington, D.C. National Association of Counties. (2014). A Workforce that Works: County Innovations in
Workforce Development. Washington, D.C. Partnerships for a Skilled Workforce. (2014). Advancing the Metro Southwest Knowledge
Innovation Economy. Marlborough, MA. Partnerships for a Skilled Workforce. (2012). Knowledge Innovation Economy. Marlborough,
MA. Sum, Andrew et al. (2010). An Overview and Assessment of the Operations and Outcomes of
the WIA One-Stop Career Centers in the Metro South/West WIA Area. Center for Labor Market Studies. Northeastern University. Boston, MA.
Towards Employment. (2012). WorkAdvance Wins Excellence in Workforce Development.
Cleveland, OH.