Embed Size (px)
Citation preview
ANNUALREPORT 2015

2007
2010
Kanematsu’s post-restructuring medium-term business plans
Building strong business foundations
New KG 200 team KG120
S-Project
Progress in Reinforcing the Financial Base
Kanematsu’s Progress and Strengths
CREATING SUSTAINABLE With the resumption of dividend payments in fi scal 2014, the Kanematsu Group reached an important milestone in term of restructuring to strengthen its earnings base and improve its fi nancial position. In April 2014, we launched the VISION-130 medium-term vision aimed at “being a ‘Value Creator’ by continuing to build new businesses.” While striving to embody the Kanematsu Group’s traditional entrepreneurial spirit, we have embarked on a new era for the Group.
• April 2010 – March 2013Medium-Term Business Plan: “S-Project”
• April 2013 – March 2016Medium-Term Business Plan
—Jump to the next stage—• April 2004 – March 2007 Medium-Term Business Plan: “New KG200”• April 2007 – March 2010 Medium-Term Business Plan: “team KG120”
FY2000
Net sales ¥1,407.9 billion
Operating income ¥14.5 billion
Equity ratio 1.3 %
Net D/E ratio 47.1 times
FY2010
Net sales ¥861.3 billion
Operating income ¥12.2 billion
Equity ratio 7.3 %
Net D/E ratio 3.8 times
Electronics &Devices
Motor Vehicles &Aerospace
Net sales
(FY 2015)
24.8%
Other 0.5%5.3%
Steel, Materials &Plant 41.9% ¥1,117.1 billion
Semiconductor Equipment Industrial Electronics Semiconductors Electronic Components and
Materials ICT/Mobile Solutions
Motor Vehicles and Parts Aerospace
Steel Materials Plant
Foods & Grain 27.5%
Foods Meat and Marine Products Grain, Food Soybeans, Oilseeds Feedstuff Processed Agricultural Products Pet Products and Groceries
Business Areas

2013
2014 20152019
2016
Shifting to an aggressivemanagement stance
—Jump to the next stage—
VISION-130: Kanematsu takes on new challenges for further growth
1KANEMATSU ANNUAL REPORT 2015
FY2015
Net sales ¥1,117.1 billion
Operating income ¥22.1 billion
Equity ratio 19.6 %
Net D/E ratio 0.8 times
VALUE
• As a result of restructuring, we enhanced our business foundations and achieved a net D/E ratio of 0.9 times, improved the equity ratio to 16.7%, and paid dividends for the fi rst time in 15 years in fi scal 2014
• We further strengthened our fi nancial position in fi scal 2015
• VISION-130 medium-term vision unveiled in April 2014• Aiming for further growth leading up to fi scal 2019,
the Company’s 130th anniversary• Establishment of a clear edge in highly specialized fi elds
Reinforcing market competitiveness in six focus areas• New investment in business expansion and M&As
Investment capacity of up to ¥100 billion over fi ve years
FY2016
Net sales ¥1,200.0 billion
Operating income ¥24.0 billion
Equity ratio Over 20%
Net D/E ratio 1.0 level
1
Maintain financial soundness
Expand the earnings base
Being a “Value Creator” and continuing to build new businesses
VISION-130 Aspiration
2 KANEMATSU ANNUAL REPORT 2015
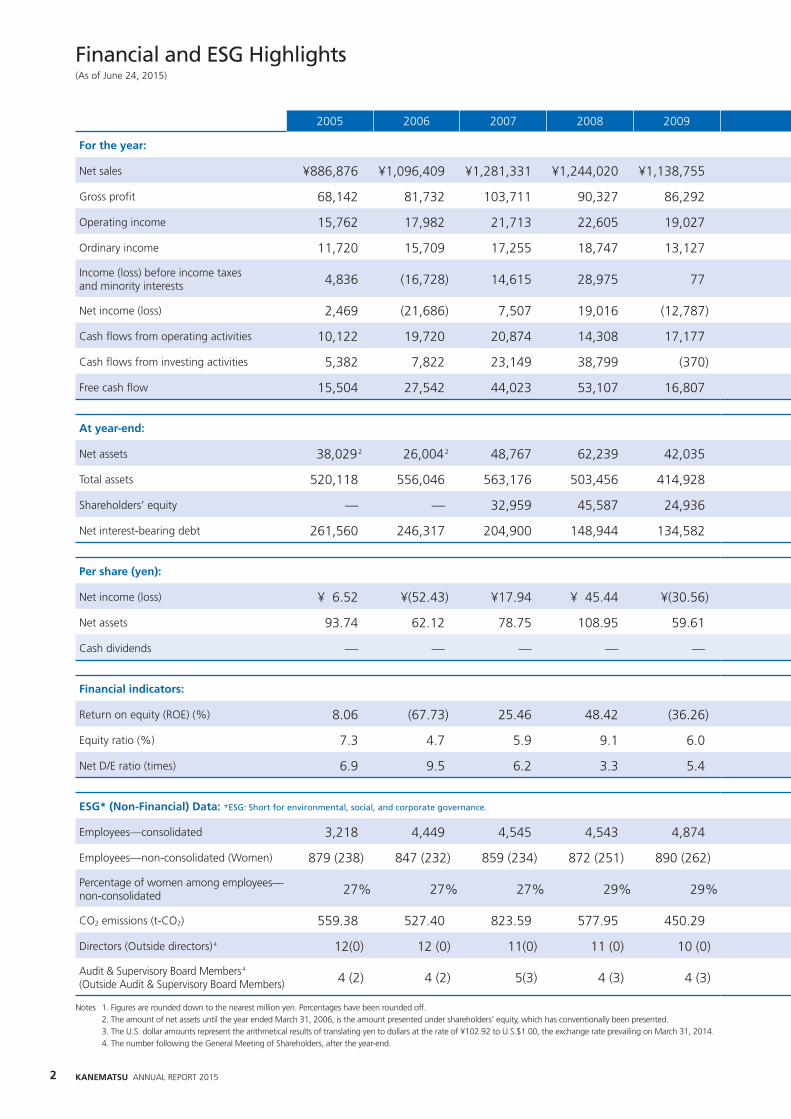
Financial and ESG Highlights(As of June 24, 2015)
2005 2006 2007 2008 2009
For the year:
Net sales ¥886,876 ¥1,096,409 ¥1,281,331 ¥1,244,020 ¥1,138,755
Gross profi t 68,142 81,732 103,711 90,327 86,292
Operating income 15,762 17,982 21,713 22,605 19,027
Ordinary income 11,720 15,709 17,255 18,747 13,127
Income (loss) before income taxes and minority interests 4,836 (16,728) 14,615 28,975 77
Net income (loss) 2,469 (21,686) 7,507 19,016 (12,787)
Cash fl ows from operating activities 10,122 19,720 20,874 14,308 17,177
Cash fl ows from investing activities 5,382 7,822 23,149 38,799 (370)
Free cash fl ow 15,504 27,542 44,023 53,107 16,807
At year-end:
Net assets 38,0292 26,0042 48,767 62,239 42,035
Total assets 520,118 556,046 563,176 503,456 414,928
Shareholders’ equity — — 32,959 45,587 24,936
Net interest-bearing debt 261,560 246,317 204,900 148,944 134,582
Per share (yen):
Net income (loss) ¥ 6.52 ¥(52.43) ¥17.94 ¥ 45.44 ¥(30.56)
Net assets 93.74 62.12 78.75 108.95 59.61
Cash dividends — — — — —
Financial indicators:
Return on equity (ROE) (%) 8.06 (67.73) 25.46 48.42 (36.26)
Equity ratio (%) 7.3 4.7 5.9 9.1 6.0
Net D/E ratio (times) 6.9 9.5 6.2 3.3 5.4
ESG* (Non-Financial) Data: *ESG: Short for environmental, social, and corporate governance.
Employees—consolidated 3,218 4,449 4,545 4,543 4,874
Employees—non-consolidated (Women) 879 (238) 847 (232) 859 (234) 872 (251) 890 (262)
Percentage of women among employees—non-consolidated 27% 27% 27% 29% 29%
CO2 emissions (t-CO2) 559.38 527.40 823.59 577.95 450.29
Directors (Outside directors) 4 12(0) 12 (0) 11(0) 11 (0) 10 (0)
Audit & Supervisory Board Members4
(Outside Audit & Supervisory Board Members) 4 (2) 4 (2) 5(3) 4 (3) 4 (3)
Notes 1. Figures are rounded down to the nearest million yen. Percentages have been rounded off. 2. The amount of net assets until the year ended March 31, 2006, is the amount presented under shareholders’ equity, which has conventionally been presented. 3. The U.S. dollar amounts represent the arithmetical results of translating yen to dollars at the rate of ¥102.92 to U.S.$1.00, the exchange rate prevailing on March 31, 2014. 4. The number following the General Meeting of Shareholders, after the year-end.

3KANEMATSU ANNUAL REPORT 2015
Millions of yen1
Thousands ofU.S. dollars3
2010 2011 2012 2013 2014 2015 2015
¥861,277 ¥936,891 ¥1,006,365 ¥1,019,232 ¥1,114,539 ¥1,117,096 $9,295,967
74,104 76,905 80,900 80,021 86,402 91,441 760,933
12,186 18,029 21,426 18,262 19,776 22,125 184,122
8,238 14,257 17,752 16,705 20,160 22,895 190,523
8,407 13,030 13,529 16,781 19,075 23,294 193,849
3,528 9,175 6,110 9,564 11,799 11,470 95,452
26,441 7,827 15,822 1,355 22,384 10,115 84,180
(19,149) 17,322 1,291 1,466 (1,111) (8,903) (74,094)
7,292 25,149 17,113 2,821 21,273 1,212 10,086
45,804 49,576 55,992 75,912 96,204 118,731 988,032
398,629 388,676 399,753 399,186 428,459 459,011 3,819,682
28,916 33,101 39,008 54,519 71,657 90,101 749,785
109,350 104,612 90,012 86,439 68,038 67,646 562,926
¥ 8.44 ¥21.93 ¥14.60 ¥ 22.80 ¥ 28.09 ¥ 27.30 $0.23
69.15 79.07 93.16 129.82 170.54 214.10 1.78
— — — — 3.00 4.00 0.03
13.10 29.59 16.95 20.45 18.70 14.18
7.3 8.5 9.8 13.7 16.7 19.6
3.8 3.2 2.3 1.6 0.9 0.8
4,871 4,770 4,770 5,522 5,747 6,002
850 (264) 832 (250) 795 (238) 782 (242) 800 (246) 813 (253)
31% 30% 30% 31% 31% 31%
368.25 482.36 376.92 365.37 414.58 387.80
10 (0) 10 (0) 10 (0) 10 (0) 6 (1) 7 (2)
4 (3) 4 (3) 4 (3) 4 (3) 4 (2) 4 (3)

4 KANEMATSU ANNUAL REPORT 2015
Forward-Looking StatementsThis annual report contains statements regarding Kanematsu Group’s plans, strategies, and expecta-tions for future performance. Such statements are inherently subject to risk and uncertainty. Actual results could diverge materially from the Group’s projections due to changes in the economic and market environment surrounding the Group’s busi-ness areas, such as exchange rate fl uctuation.
Kanematsu’s Progress and Strengths
Review of Operations
Special Feature: Realizing VISION-130
CSR and Corporate Governance
Financial Section and Company Information
1 Kanematsu’s Progress and Strengths
2 Financial and ESG Highlights
5 To Our Stakeholders
6 Top Message
20 Review of Operations
30 CSR (Corporate Social Responsibility)
34 Corporate Governance
37 Corporate Offi cers
38 Management’s Discussion and Analysis
40 Business Risks
42 Consolidated Financial Statements
48 Notes to Consolidated Financial Statements
77 Independent Auditor’s Report
78 Global Network
79 Major Group Companies
80 Network
82 Corporate Profi le
12 In Step with Developments in Society
VISION-130: Kanematsu Pushes Global Connections
Contents
P1 P20
P12 P30
P3814 ICT Solutions
15 Mobile
16 Asian Food Markets
17 North American Shale Oil and Gas Markets
18 Global Motorization
19 Overseas Expansion by Japanese Companies
22 Electronics & Devices Division
24 Foods & Grain Division
26 Steel, Materials & Plant Division
28 Motor Vehicles & Aerospace Division

5KANEMATSU ANNUAL REPORT 2015
Kanematsu’s Progress and
StrengthsReview
of Operations
Special Feature: Realizing VISIO
N-130
CSR and Corporate Governance
Financial Section and Com
pany Information
Corporate Principle
“Let us sow and nurture the seeds of prosperity for Japan”
“If we sow a seed, we can expect it to develop into a seedling that generates content and prosperity for Japan. Let us sow that seed now.” So spoke our founder Fusajiro Kanematsu at the establishment of the Company. Furthering the “public interest” of Japan was the guiding mission of all leading Japanese of the late nineteenth century (Meiji period) in develop-ing the national economy. Today, our founder’s ideal underlies all our company’s public benefi t and community activities and our contributions to nations and peoples generally. On the occasion of the merger in 1967 with The Gosho Company, the Company enshrined its founder’s ideals in a docu-ment titled Our Beliefs: Kanematsu’s Guiding Principles.
OUR BELIEFS (Kanematsu’s Guiding Principles)
1. We believe that we should achieve prosperity of our business through just and fair earnings in the pioneering spirit as fostered by our predecessors with the wisest use of our creative imagination and ingenuity.
2. We believe that our Company should justify its existence by promoting a sound and fl ourishing business which fulfi ls its responsibilities toward the welfare of society and also contributes to the security and well-being of us all.
3. We believe that each one of us should attend to business not as an individual but as a member of the organization abiding by Company rules, carrying out duties with a sense of loyalty to the Company and a spirit of cooperation and understanding toward all other members of the organization.
The Kanematsu Group celebrated the 125th anniversary of its founding on August 15, 2014.
It is by the grace of the tremendous support and cooperation of our stakeholders, including
shareholders, business partners, and employees, that we have been able to reach this mile-
stone.
In April 2014, aiming for further growth, we announced and launched initiatives under
VISION-130, our medium-term vision, which lays out the aspiration of “being a ‘Value
Creator’ by continuing to build new businesses” for 2019, the Company’s 130th anniversary.
At Kanematsu, we have codifi ed the entrepreneurial spirit of the Company’s founder,
Fusajiro Kanematsu, in our Corporate Principles. In accordance with these principles, we seek
to maintain a pioneering spirit and foster creative imagination and ingenuity in order to
contribute to ongoing economic development.
Rather than chasing after high-risk business in fi nance or investment in natural resources,
we strive to create value unique to the Kanematsu Group by honing our core functions as a
trading company. By doing so, we are moving closer to our aspiration for Kanematsu in its
130th year and increasing the value of Kanematsu as a company that grows together with
its business partners.
July, 2015
Masayuki Shimojima
President & CEO
To Our Stakeholders
Creating Value Unique to the Kanematsu Group

Fiscal 2016, ending March 31, 2016, is the fi nal year of the Kanematsu Group’s current medium-
term management plan, which it is carrying out under the banner “Jump to the next stage.”
Looking to take the next step forward, we have also established VISION-130, a fi ve-year medium-
term vision that lays out our aspirations for 2019—the 130th anniversary of the Company’s
founding—and have now completed its fi rst year. Having resumed dividend payments, a prior-
ity measure under the medium-term business plan, we are now shifting to an aggressive man-
agement stance. We are concentrating on our focus areas and endeavoring to create new
businesses to achieve further growth.
President & CEO
Masayuki Shimojima
6 KANEMATSU ANNUAL REPORT 2015
Top Message
7KANEMATSU ANNUAL REPORT 2015
Kanematsu’s Progress and
StrengthsSpecial Feature: Realizing VISIO
N-130
Review of O
perationsCSR and Corporate G
overnanceFinancial Section and Com
pany Information
We achieved the income targets of our medium-term management plan two years ahead of schedule in fi scal 2014, the fi rst year of the plan. In fi scal 2015, ended March 31, 2015, it became clear that our con-solidated earnings power is continuing to increase. Consolidated ordinary income reached a record high of ¥22.9 billion, and although net income decreased 2.8% as a result of a temporary increase in tax expenses due to tax system changes, at ¥11.5 billion it was still 4.3% higher than the forecast made at the
beginning of the fi scal year. In particular, factors behind these fi rm results included continued growth in the ICT solutions busi-ness of the Electronics & Devices Division; income contributed by Kanematsu-NNK Corp., which was made a consolidated subsidiary in December 2014; and the overall strong performance of the Motor Vehicles & Aerospace Division, especially in compo-nents trading.
Under the Group’s medium-term vision, VISION-130, we have clearly defi ned our aspiration for the Group as “being a ‘Value Creator’ by continuing to build new businesses” and are striving to adjust mindsets accord-ingly in the course of our daily operations. Through these efforts in fi scal 2015, as we sought to create a shared awareness and ambition throughout the Group, I feel that we made progress in that we began to con-sider a greater range of possibilities than we had before. Our management objective under VISION-130
is to both maintain fi nancial soundness and expand the earnings base. Accordingly, we are further developing businesses in our areas of expertise and investing in new business creation. We have defi ned six focus areas where we have expertise: 1) ICT solutions, 2) Mobile solutions, 3) Asian food markets, 4) North American shale oil and gas markets, 5) Global motorization, and 6) Overseas expansion by Japanese companies. Focusing on these business areas, we have established the following quantitative targets.
VISION-130 Medium-Term Vision Targets FY2019
Consolidated ordinary income ¥25 to ¥30 billion
Consolidated net income ¥15 billion (ROE: 15%)
Shareholders’ equity Over ¥100 billion
Net D/E ratio 1.0 level
Fiscal 2015 Results
Outline of the VISION-130 Medium-Term Vision and Review of its First Year
The Kanematsu Group has clearly defi ned “being a ‘Value Creator’ by continuing to build new business-es” as its vision. By sharing this aspiration across the entire Group and by achieving it, we hope to further enhance Kanematsu’s enterprise value. For the Kanematsu Group, business creation means aiming for more than simple expansion of scale. The Group’s greatest asset is its many valuable
business partners, with whom it has steadily built rela-tionships of trust through trading operations over the Company’s nearly 130-year history. Dealing in good faith with these business partners, that is, indentifying their needs and the challenges they face and offering solutions to pioneer new value as a business partner that grows with them, is the true essence of the Kanematsu Group’s business creation.
Creating New Businesses

8 KANEMATSU ANNUAL REPORT 2015
Looking at the six focus areas mentioned above, fi rst, we have made great progress in Asian food markets. In the past, we were mainly focused on procurement in these markets. Through initiatives in recent years, however, our business in this area has evolved into an infrastructure consisting of a value chain that encom-passes proposals, manufacturing, and supply, allowing one-stop business. In April 2015, we began full-fl edged operations of a food service company tailored to the halal system of Indonesia, the country with the world’s largest Muslim population. This accomplish-ment is an example of business development in Asia that draws on know-how cultivated in Japan, includ-ing in our R&D and manufacturing operations, as well as the Group network. Going forward, we aim for horizontal development in Vietnam and other ASEAN countries. Next, in the area of global motorization, we are focusing on providing such functions as sourcing, technological development, and logistics as part of the global supply chains of automakers and other
business partners. We have established overseas affi li-ates in Europe and the Americas as well as India and Mexico, and, in 2015, an offi ce in Detroit, thus expanding our network to meet customer needs with just-in-time capabilities. At the same time, this busi-ness is linked with the automobile equipment busi-ness unit of the Electronics & Devices Division, one of the Group’s mainstay businesses, to identify and sug-gest high-value-added performance materials and products. Success on this front has led to trading involving a wider range of OEM automobile compo-nents and the establishment of a value chain that is a real strength within this business area. In the ICT solutions area, the key to success lies in becoming deeply involved with business partners’ IT infrastructure. To that end, the Kanematsu Group has leveraged its advanced expertise, unparalleled know-how, and network strength to create one-stop IT infrastructure services that can completely satisfy cus-tomers. These services encompass everything from design, construction, and installation to operation and maintenance. Furthermore, as a vendor of multifacet-ed solutions, we suggest the best system devices for each customer. In fi scal 2015, Kanematsu Electronics Ltd. made Nippon Offi ce Systems Ltd. a wholly owned subsidiary. Building on this, going forward, we will work to spur human resource exchange within the Group as well as the provision of total IT services. I am confi dent that our efforts in the ICT solutions area will, by increasing our competitiveness and further developing our businesses, help us increase our enter-prise value and contribute signifi cantly to the stability of the Group’s earnings base.
While our results in fi scal 2015 were satisfactory, we must now look to our medium- and long-term growth strategies and identify the new management issues arising in the course of everyday operations in order to balance risk control and ambitious action. Our fi rst task is to make our areas of strength even stronger. Our business model is different from that of other companies in the same industry in that we do not invest in resource development. In the latter
half of 2014, changes in natural resource markets prompted our competitors to shift their focus away from natural resources and toward our mainstay areas. As such, the Kanematsu Group now needs to build on its accumulated know-how and track record and accel-erate business development to further increase its advantages and competitiveness. Our second task is to add two new focus areas to the abovementioned six in response to changes in the
Main Developments in Focus Areas
New Tasks as We Take the Next Step

9KANEMATSU ANNUAL REPORT 2015
Kanematsu’s Progress and
StrengthsSpecial Feature: Realizing VISIO
N-130
Review of O
perationsCSR and Corporate G
overnanceFinancial Section and Com
pany Information
business environment. These are technological sup-port, including the electronics manufacturing services (EMS) and camera businesses, and responding to the Trans-Pacifi c Partnership (TPP response), mainly with regard to the Foods & Grain Division’s operations. In the technological support area, we are working to more nimbly respond to the diverse needs of our busi-ness partners in automobile-related businesses and are considering reinforcing the EMS business, which entails the contracted manufacturing of electronic
devices. In addition, we are focusing efforts on meet-ing growing demand for security cameras, refl ecting rising security consciousness, as well as the design and manufacture of micro-lens units for smartphones and automobiles. In terms of TPP response, in the meat products and feedstuff businesses, areas of strength, we are enhancing functions in anticipation of changes in trade structure and intensifying competition while preparing for rapid industry reorganization.
New Initiatives under VISION-130
Fiscal 2015 Initiatives
ICT solution
Technologicalsupport
Mobile
Food market in Asia North Americanshale market
Global motorization Overseas expansion ofJapanese manufacturers, etc.
The Group in pursuing horizontal and vertical expansionby focusing on business areas in which it excels.
Key strategic 6 business area+innovation
Innovation
TPP Response/Pet products
Looking at medium-term prospects for the Group’s business environment, including such factors as the growing global population, the fi rmness of the U.S. economy, and rising consumption in ASEAN nations, I believe that we will be able to steadily execute our medium-term business plan. Furthermore, the Kanematsu Group’s business model is based mainly on providing added value and fulfi lling roles that are relatively insulated from fl uctuations in the global
economy. Major opportunities are also expected in the near future in the Group’s mainstay business areas, including motorization, electronic devices, and foods. Given these factors, I believe that the quantitative tar-gets of the VISION-130 medium-term vision are attainable.
Considering the Business Environment

10 KANEMATSU ANNUAL REPORT 2015
The key to Kanematsu’s strategy is to make invest-ments rooted in businesses in our areas of strength. In principle, we limit investment to the amount of cash provided by operating activities. Over the fi ve-year period of our medium-term vision, VISION-130, we estimate that we will have the capacity to invest up to ¥100 billion. However, at certain times, we may need to make major investments, such as large corporate acquisitions. To ensure the fl exibility to meet such cap-ital needs, in March 2015 we fi led a shelf registration of ¥30 billion in straight corporate bonds. This move was aimed at diversifying our means of capital pro-curement. Furthermore, to facilitate good investment deci-sions, we have adopted a more sophisticated risk management approach, formulating investment stan-dards that consider both entry and exit strategies. We
have also taken measures to ensure that investments are backed by the strength of the entire Company, including the formation of a task force charged with making quick management decisions. We furthermore established a follow-up system to monitor the status of investments that have been executed and thus pre-vent the recurrence of problems that have arisen in the past. These measures allow us to rapidly adjust course as necessary, even to call a temporary halt to business expansion, in markets that have high growth potential but also high volatility, such as the fi scal 2015 North American shale oil and gas market. While we are thus able to respond nimbly to risks, we are now also beginning to transition to a stage in which we can more precisely grasp business opportunities. I fi rmly believe that we are right on the verge of the next big step forward for Kanematsu.
Growth-oriented investment strategies
Growth-Oriented Investment Strategies
New investments using funds provided by operating activities
Improve financial stability through diversification of funding vehicles
Build a system to ensure the flexibility needed to fund future growth
Shelf registration of ¥30 billion in straight corporate bonds
Standards forentry
Standards forexit
Formulation of investment standards
Newly establish Companywide investment standards
Formulate standards for market entry and exit
At the same time, establish a system of following up on cases
Investments shall be monitored at the management level
Invest in the areas where the Company excels based on knowledge and experience; Do not invest in resource development or the real estate sector.
Qualitative standards:
Companywide minimum standards:Quantitative standards:
Formulate Companywide minimum standards
In addition, as before, specific standards will be established for each individual case

11KANEMATSU ANNUAL REPORT 2015
Kanematsu’s Progress and
StrengthsSpecial Feature: Realizing VISIO
N-130
Review of O
perationsCSR and Corporate G
overnanceFinancial Section and Com
pany Information
At the June 2015 General Meeting of Shareholders, we took steps to further strengthen the Group’s cor-porate governance. Specifi cally, we increased the number of Outside Directors and Outside Audit & Supervisory Board Members as well as the number of each that are Independent Offi cers as defi ned by the Tokyo Stock Exchange, thus reinforcing management oversight and supervision functions. Going forward, we will continue to work toward greater transparency to maintain the trust of all stakeholders. As expressed in the Company’s Corporate Principles, “Our beliefs: Kanematsu’s Guiding Principles,” we believe that the foundation of our business as a trading company lies in continually ask-ing ourselves what we can do to best serve our busi-ness partners and then doing it. We seek to develop
more human resources who can seriously engage with that foundation and look to create a brighter future while constantly thinking about how to provide added value. In terms of global human resource develop-ment, in addition to ordinary on-the-job training, we send young employees abroad early in their careers to experience overseas workplaces, the very front line of our operations as a trading company. Using such methods, made possible by the Group’s fi rm ground-ing in front-line business, we aim to nurture a sense of immediacy and connection with other parts of the Group. These methods not only benefi t the trainees, but are also stimulating for the employees at overseas sites, helping them to take a fresh look at their own roles. We are also creating opportunities for overseas employees to participate in long-term training in Japan, seeking to foster a shared sense of purpose and corporate culture. As for our corporate social responsibility (CSR), our basic approach is to conduct all business activities in line with our Corporate Principles and Code of Conduct. We have furthermore established a CSR Committee with a Companywide mandate to formu-late and execute policy on Groupwide CSR initiatives as necessary. In particular, to address CSR issues relat-ed to supply and procurement for our business part-ners’ supply chains, we have created a practical framework that includes the CSR Action Guidelines for Supply Chains.
By taking an aggressive management stance toward the achievement of the goals outlined in our medium-term vision, VISION-130, we are working to build a new era for the Kanematsu Group. In fi scal 2016, ending March 31, 2016, we expect consolidated net sales of ¥1,200.0 billion, up 7.4% year on year, operating income of ¥24.0 billion, up 8.5%, consolidated ordinary income of ¥23.0 bil-lion, up 0.5%, and net income attributable to Kanematsu Corporation of ¥12.5 billion, up 9.0%. We thus forecast increases in both sales and profi ts, including a second consecutive year of record-high consolidated ordinary income.
The Kanematsu Group regards providing returns to shareholders as one of its most important tasks and aims to pay stable, ongoing dividends at levels appro-priate to the Group’s results. Going forward, seeking to live up to the trust of our stakeholders, we will continue to do our utmost to increase Kanematsu’s enterprise value, remaining true to our Corporate Principles and striving ambi-tiously toward growth.
Strengthening Our Business Foundations
Fiscal 2016 Outlook

ICT Solutions
Mobile
Asian Food Markets
Expand the
Management
Maintain financial
Establish global value chain
Business investment and
New
Expand the systems business and improve efficiencies in the services and support business
Increase business scale through M&A
Develop business as a one-stop shop for concept development, manufacturing, and supplies, and build value-chain infrastructure
Electronics & Devices
Foods & Grain
page 14
page 15
page 16
In Step with Developments in Society
Kanematsu Pushes Global Con- VISION-130
12 KANEMATSU ANNUAL REPORT 2015
Special Feature: Realizing VISION-130

North American Shale Oil and Gas Markets
Global Motorization
Overseas Expansion by Japanese Companies
earnings base
objectives
soundness
Develop new technologies, new products
development through M&A
initiatives
Further growth in the manufacturing, processing, and sales value-chain for oilfield tubing
Sourcing, technology development, and improved logistics in the global auto market
Support and collaborate with Japanese makers moving into overseas markets
Steel, Materials & Plant
Motor Vehicles & Aerospace
page 17
page 18
page 19
The Kanematsu Group is strongly aware of its mission as a trading company to create new value by forging business connections in this increasingly globalized world. We have established “Being a ‘Value Creator’ and continuing to build new businesses” as our key aspiration under our medium-term vision, VISION-130: Kanematsu takes on new challenges for further growth. In line with this vision, we are striving to both ensure business stability by prioritizing the maintenance of fi nancial soundness and expand the earnings base by steadily capturing business opportunities. To establish a solid growth trajectory, we are adopting an aggressive management stance, aiming to raise corporate value to new levels.
nections
13KANEMATSU ANNUAL REPORT 2015
Review of O
perationsCSR and Corporate G
overnanceFinancial Section and Com
pany Information
Special Feature: Realizing VISIO
N-130

14 KANEMATSU ANNUAL REPORT 2015
Market Background and OverviewAs a vendor of multifaceted solutions with strengths in handling a wide variety of devices, the Kanematsu Group provides one-stop IT infra-structure services, from design, construction, and installation to operation and maintenance. Anticipating market trends, we work to identify and verify cutting-edge technologies in and outside Japan and further develop our areas of unique strength to achieve differentiation from competitors. We are providing infrastructure plat-forms tailored to customers’ business environ-ments, expanding services for big data systems, promoting the establishment of borderless cloud computing, and expanding supply systems for key components of smart devices. Furthermore, while streamlining our organization to make optimal use of our human resources and know-how, we are aggressively working toward business expan-sion in global markets, targeting China and Southeast Asia as well as leading-edge companies in Europe and the Americas and Japanese compa-nies operating in emerging nations.
Operational support and Maintenance
service
Replacement proposalProposal Development/
ConstructionConsultation
1 ICT SolutionsVISION-130 Focus areas
KEY REGIONS
Japan, Asia (China and Southeast Asia)
KEY BUSINESS COMPANIES
Kanematsu Electronics Ltd., Nippon Offi ce Systems Ltd.
• Strengthening system integration functions through M&As
• Strengths in infrastructure development and virtual-ization businesses
• Competitive advantage as a vendor of multifaceted solutions
2012 Nippon Offi ce Systems Ltd. became a consolidated subsidiary of Kanematsu Electronics Ltd.
2013 Established Growth D Ltd., a joint venture company in the IT distribution business
2015 Kanematsu Electronics Ltd. acquired Nippon Offi ce Systems Ltd. as fully owned consolidated subsidiary
Special Feature: Realizing VISION-130
Providing IT Infrastructure with One-Stop Services
Timeline and Measures Taken to Strengthen Business

15KANEMATSU ANNUAL REPORT 2015
Kanematsu’s Progress and
StrengthsSpecial Feature: Realizing VISIO
N-130
Review of O
perationsCSR and Corporate G
overnanceFinancial Section and Com
pany Information
Market Background and OverviewAs a primary distributor for telecommunications carriers in Japan, Kanematsu sells smartphones and other mobile communication devices nation-wide. In the mobile solutions business, we are working to sell bundle service packages that include fi ber optic internet contracts for customers replacing their mobile phones and are accelerating our roll out of prepaid communications cards that can be used overseas. At the same time, we are reinforcing content services through the develop-ment of software for mobile applications with an eye to providing services related to corporate information systems and aggressively promoting joint operations with businesses in other sectors. As industry reorganization progresses and compe-tition between carriers intensifi es, Kanematsu will focus on promoting effi ciency while expanding its market share by conducting aggressive M&As and establishing new stores.
• Developing a comprehensive mobile & communica-tions business based on mobile devices
• Nationwide sales locations• Providing ASP services for corporations
Capturing Domestic Market Share and Pursuing New Growth
Domestic stores
Content
Services for corporations Overseas services
2 MobileVISION-130 Focus areas
KEY REGION
Japan
KEY BUSINESS COMPANY
Kanematsu Communications Ltd.
2013 Acquired all shares of BD Holdings, Inc., a mobile phone sales company based in the Kyushu region
2014 Concluded a distribution agreement with NetComm Wireless Limited, an Australia-based supplier of global wireless M2M devices
Timeline and Measures Taken to Strengthen Business

16 KANEMATSU ANNUAL REPORT 2015
3 Asian Food MarketsVISION-130 Focus areas
Special Feature: Realizing VISION-130
KEY REGIONS
Asia
KEY BUSINESS COMPANIES
Kanematsu Corporation, PT. Kanemory Food Service, PT. Aeternit Prima Mandiri
• Entering animal feedstuff/feedstuff materials and other upstream areas
• One-stop proposal, manufacturing, and supply• Rigorous traceability management • Know-how in Japan and Group strengths
2012 Established PT. Kanemory Food Service, a food pro-cessing joint venture company
2013 Invested in a dairy producer in Vietnam and entered the dairy cow feed business via a business tie-up
2014 Established subsidiary in Vietnam
Established confectionery and baking ingredients wholesaling joint venture company in Shanghai
2015 Invested in the fi rst company to manufacture and sell fruit jelly in Indonesia
Building Value Chain InfrastructureMarket Background and OverviewFood culture is developing rapidly alongside eco-nomic growth in emerging Asian nations. In these countries, Kanematsu is building a value chain encompassing everything from upstream areas, such as animal feedstuff and feedstuff materials, to one-stop business development in the mid- and downstream areas of processed food product pro-posal, manufacture, and supply. First, in the animal feedstuff area, leveraging know-how it has developed in the dairy cow feed market, Kanematsu has established and begun operations at a dairy cow TMR (total mixed ration) production center. Furthermore, in the area of processed foods, using the Group’s R&D and con-tent provision functions developed in the domestic food service sector, we have established a company to run a central kitchen in Indonesia, where the Muslim middle class is growing rapidly. Using our thorough knowledge of the halal standards of MUI, a major halal certifi cation body in Indonesia, we are now considering entry into and expansion in markets in other parts of the Muslim world. Going forward, we aim to use this expertise to expand horizontally in Asia and bring Japanese-quality foods to the tables of the region’s four billion residents.
Timeline and Measures Taken to Strengthen Business

17KANEMATSU ANNUAL REPORT 2015
Kanematsu’s Progress and
StrengthsSpecial Feature: Realizing VISIO
N-130
Review of O
perationsCSR and Corporate G
overnanceFinancial Section and Com
pany Information
4 North American Shale Oil and Gas MarketsVISION-130 Focus areas
KEY REGION
North America
2013 Acquired a North American oilfi eld tubing processing company
2014 Finalized plans for the construction of a second factory for Benoit Premium Threading, LLC to expand the North American oilfi eld tubing business (temporarily suspended in light of current oil prices)
Market Background and OverviewThe Kanematsu Group is building an oilfi eld tubing value chain that encompasses manufacturing, processing, and sales and is supplying such tubing to major North American oil companies. We are also advancing preparations to ensure that we will be ready to quickly expand production to meet demand as necessary. Kanematsu’s oilfi eld tubing has a solid reputation for being high-performance and high-quality. Our products are well-suited for shale oil and gas drilling and can also accommo-date increasing demand related to deep water/ultra-deep water oil drilling. The plunge in crude oil prices in the latter half of 2014 has caused stagnation in shale oil and gas and other resource development. This has weakened demand for oilfi eld tubing, and, in response, Kanematsu has temporarily suspended construction of a second oilfi eld tubing factory being built for Benoit Premium Threading, LLC. Nevertheless, shale oil and gas demand is expected to grow over the medium to long term and, in turn, generate demand for further technological innovation. Kanematsu will therefore continue to work to expand the oilfi eld business while keeping a close eye on market trends.
• Constructing a value chain in North America• Medium- and long-term expansion of the oilfi eld
tubing market• Preparing a framework to increase production in
anticipation of recovery in oil prices
Steady Investment Targeting Demand
Timeline and Measures Taken to Strengthen Business
KEY BUSINESS COMPANIES
Kanematsu Corporation, Benoit Premium Threading, LLC, Steel Service Oilfi eld Tubular, Inc.
Constructing a Value Chain in North America
Manufacturing Processing Sales

18 KANEMATSU ANNUAL REPORT 2015
5 Global MotorizationVISION-130 Focus areas
Special Feature: Realizing VISION-130
Market Background and OverviewDrawing on a network of more than 20 overseas locations, the Kanematsu Group is building supply chains that combine its longstanding strengths in sales and sourcing with reinforced technological development, quality management, and logistics functions. In 2012, Kanematsu established a subsid-iary in the National Capital Region (NCR) around Delhi, India, and a Kanematsu subsidiary based in Germany established a branch offi ce in Munich. In 2014, the Group established a subsidiary in Silao, Mexico, and a liaison offi ce in Chongqing, China. Then, in 2015, it established an offi ce in Detroit, aiming to build a support framework that boasts specialized technology to offer just-in-time supply capable of rapidly responding to the needs of cus-tomers in the region, where automobile and motor-cycle demand is strong. The Group has also long been active in Poland, operating dealerships for Japanese automakers and importing and distributing general-purpose machinery. We aim to work as a Group to nimbly respond to customer needs and provide even greater added value through wide-ranging automotive supply chains handling opera-tions ranging from automobile component supply to automobile sales, as a partner for customers’ global operations.
KEY REGIONS
The Americas, Europe, Asia
KEY BUSINESS COMPANIES
Kanematsu Corporation, ANOVA Corporation, Aries Motor Ltd., Aries Power Equipment Ltd., Kanematsu Advanced Materials Corporation
• Technological support and quality management capabilities for OEM automobile component trading
• Global sales and sourcing capabilities and logistics network
• Indentifying/suggesting high-value-added performance materials and products
2012 Established subsidiary in India
Opened branch in Munich, Germany
2013 Expanded dealerships for Japanese automakers
2014 Established subsidiary in Mexico
Established liaison offi ce in Chongqing, China
2015 Opened Detroit offi ce
Making New Proposals to Meet Partners’ Needs
Timeline and Measures Taken to Strengthen Business
Marketing Globalsourcing
Planningand
proposalDevelopment
Massproduction
and logistics
Unified Support System

19KANEMATSU ANNUAL REPORT 2015
Kanematsu’s Progress and
StrengthsSpecial Feature: Realizing VISIO
N-130
Review of O
perationsCSR and Corporate G
overnanceFinancial Section and Com
pany Information
6 Overseas Expansion by Japanese CompaniesVISION-130 Focus areas
Market Background and OverviewKanematsu boasts locations in around 40 cities overseas, mainly in Asia. Thanks to this network and its information capabilities, we are able to quickly and precisely grasp trends in countries around the world and are building robust value chains. To support the accelerating overseas expansion of Japanese companies, we are estab-lishing additional locations and building support systems overseas. Kanematsu has a solid track record of achieve-ments in building support systems for automobile component manufacturers entering Indonesia, with services that include securing land for facto-ries and advising on legal and labor issues related to establishing a local company. Furthermore, in April 2015, Kanematsu joined with Aozora Bank, Ltd., and ES Networks Co., Ltd., to establish a company to operate a corporate investment fund supporting Japanese business expansion into Asia by customers seeking growth opportunities. The fund made its fi rst investment in June of the same year.
• Further expanding overseas network from around 40 cities currently and bolstering overseas staff
• Providing backup in the areas of machine tools and industrial machinery for Japanese manufacturers expanding into emerging countries
• Supporting customers that seek growth opportunities in Asia through the new fund
Support Based On Know-How in Main Fields
KEY REGIONS
North America, Emerging countries
KEY BUSINESS COMPANY
Kanematsu Corporation
2012 Reopened representative offi ce in Myanmar Established subsidiary in India2013 Entered business tie-up with Aozora Bank, Ltd. to
support corporate expansion into Asia2014 Established subsidiary in Mexico2015 Established a company to operate a corporate invest-
ment fund supporting business expansion into Asia
Timeline and Measures Taken to Strengthen Business
Support for JapaneseCompanies in Diverse Fields
Electronics &devices
Foods
Automobiles Machine tools/industrial machinery
ICT

20 KANEMATSU ANNUAL REPORT 2015
Review of Operations
Electronics & Devices
Foods & Grain
Main Business Products
Semiconductors Semiconductors Semiconductor devices; Sensor devices; LCD panels; Components for smartphones and tablets; Control modules for lithium ion batteries
Electronic Components and Materials
Electronic Components
Amusement related products; Vehicle equipment; AV related products; System boards; Printed circuit boards and materials; RFID substrates; LED lighting devices
Semiconductors/LCD Materials
LED components; Solar cell components; Battery components; Metal materials for electronic and functional components; Surface treatment agents
Optical Device Materials
Components for display devices and optical devices
Industrial Electronics
Industrial Printers Industrial printers and related consumables
Livingwares Batteries; Household supplies
Semiconductor Equipment
Semiconductor/LCD Manufacturing Equipment
Semiconductor manufacturing and testing equipment; LCD manufacturing and testing equipment
ICT/Mobile Solutions
ICT Solutions ICT and communications equipment and devices; ICT and communication services; System integration
Mobile Solutions Mobile communication terminals; Mobile internet system and services
Main Business Products
Foods Processed fruits (frozen/canned); Concentrated fruit/vegetable juices; Confectionary ingredients (couverture chocolate, cocoa powder, nuts, dry fruits, dairy products, etc.); Coffee; Teas; Alcoholic beverages (wine, etc.); Sugar; Honey; Sesame seeds; Peanuts; Pulses and peas; Nuts and seeds; Cooked foods; Others
Meat and Marine Products
Meat products: Beef; Pork; Chicken; Mutton/Lamb; Special poultry such as turkey and duck; Horsemeat; Others
Marine products: Cephalopods (octopus, squid, etc.); Crustaceans (shrimp, etc.); Frozen fi sh; Seafood ingredients for sushi; Others
Grain, Food Soybeans, Oilseeds
Rice; Wheat; Barley; Corn; Soybeans (for food, for oil); Defatted soya-fl ake for soy sauce production; Buckwheat; Corn grits; Corn starch; High-fructose corn syrup; Rapeseed; Cottonseed; Others
Feedstuff Feed grain (corn, milo, soybeans, etc.); Plant protein meal (soybean meal, rapeseed meal, etc.); Animal protein meal (Fish meal, etc.); Other by-products; Dairy products for feed (skim milk, whey powder); Roughage (baled hay, beet pulp pellets, etc.); Fish oil; Prebiotics (Laxel Force); Fertilizer; Others
Processed Agricultural Products
Processed wheat (wheat fl our, pasta, frozen bread dough, etc.); Cereal ingredients; Vegetable oil; Olive oil; Others
Pet Products and Groceries
Pet food and snacks; Pet products; Tropical fi sh; Raw ingredients for pet food and snacks; Products wholesaled to DIY stores (home improvement retailers)

21KANEMATSU ANNUAL REPORT 2015
Kanematsu’s Progress and
StrengthsSpecial Feature: Realizing VISIO
N-130
Review of O
perationsCSR and Corporate G
overnanceFinancial Section and Com
pany Information
Steel, Materials & Plant
Motor Vehicles & AerospaceM
Main Business Products
Steel Overseas Trading of Iron and Steel
Export of various kinds of steel sheets, plates, bar products, and pipe and tubing products; Export of porcelain enamel steel sheets
Overseas Trading of Specialty Steel
Export of stainless steel sheets and plates; Export of alloy steel wire and bar products
Domestic and Overseas Trading of Full Range of Steel Products
Import and third country trade of ferrous raw materials; Export and import of steel materials and sub-materials
Materials Functional Chemicals Incense materials; Lubricant-related materials; Fertilizer materials; Papermaking chemicals; Synthetic rubber; Petrochemical products
Healthcare Functional food materials; Health supplements
Life Science Pharmaceuticals and pharmaceutical and agrichemical intermediates; Pharmaceutical ingredients
Crude Oil, Petroleum Products
Crude oil; Jet fuel oil; Gasoline; Kerosene; Diesel oil; Fuel oil (bunker A and C); Lubricant oil and additives for industrial and automobile use
LPG LPG (propane, butane, autogas)Development of Environment-Related Materials and New Technologies
Heat refl ective paint; Carbon credit trading
Plant Plants Chemical and petrochemical plants; Industrial plants (papermaking plants, auto-manufacturing plants and other plants); Utility and process systems for oil and gas plants; Infrastructure facilities; Scrap-processing facilities; Environmental facilities
Cargo Vessels Shipbuilding; Used ships; Equipment package deals for new ships (including ship design and engineering)
Machine Tools and Industrial Machinery
Machine tools; Industrial machinery and peripheral equipment
Electric Power Cable Projects
Electric power and communication cable projects; Power generation plants (including design, engineering and installation)
ODA ODA projects (educational, medical/pharmaceutical, water supply-related, agricultural, and environmental)
Main Business Products
Motor Vehicles and Parts
Motorcycle and automobile parts; Construction machinery; Power products (general purpose engines, etc.); Industrial vehicles; Completed four-wheel automobiles
Aerospace Aircraft; Helicopters; Aircraft components and parts; Aircraft rotable parts; Small satellites; Space products; Night vision goggles
22 KANEMATSU ANNUAL REPORT 2015
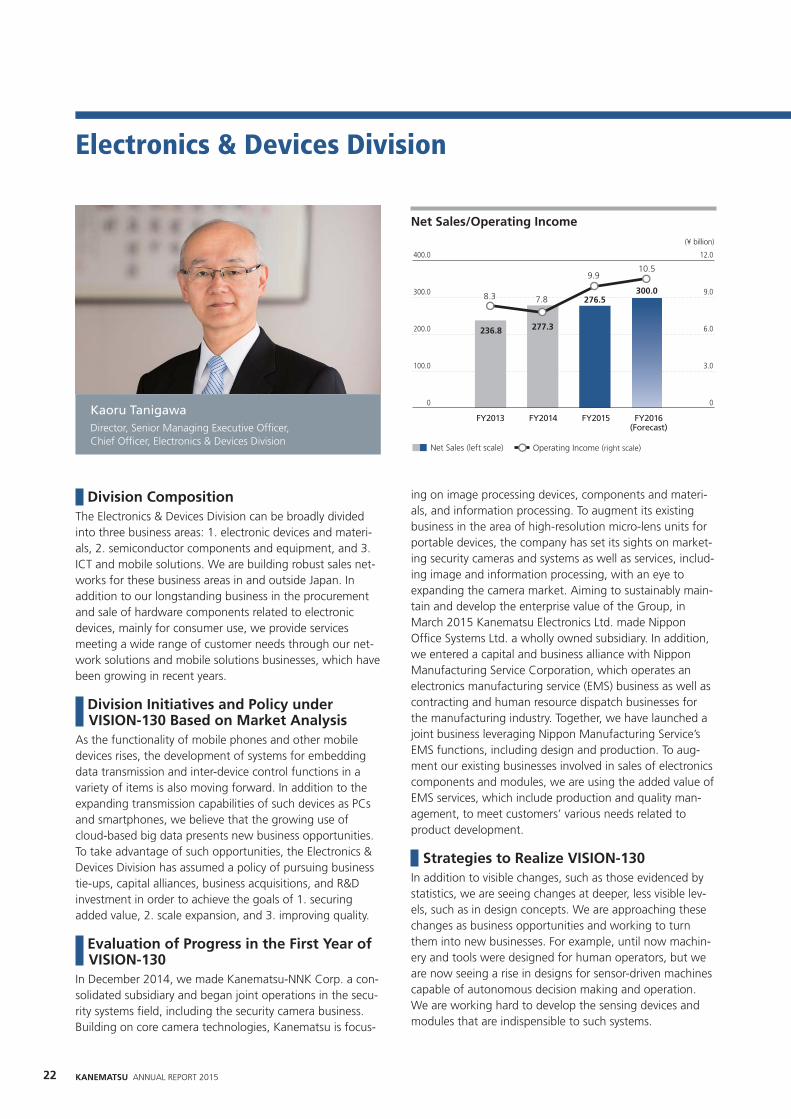
Net Sales (left scale) Operating Income (right scale)
400.0
300.0
200.0
100.0
0
12.0
9.0
6.0
3.0
0
(¥ billion)
FY2013 FY2014 FY2015 FY2016(Forecast)
236.8 277.3
276.5300.0
8.3 7.8
9.910.5
Division Composition The Electronics & Devices Division can be broadly divided into three business areas: 1. electronic devices and materi-als, 2. semiconductor components and equipment, and 3. ICT and mobile solutions. We are building robust sales net-works for these business areas in and outside Japan. In addition to our longstanding business in the procurement and sale of hardware components related to electronic devices, mainly for consumer use, we provide services meeting a wide range of customer needs through our net-work solutions and mobile solutions businesses, which have been growing in recent years.
Division Initiatives and Policy under VISION-130 Based on Market Analysis
As the functionality of mobile phones and other mobile devices rises, the development of systems for embedding data transmission and inter-device control functions in a variety of items is also moving forward. In addition to the expanding transmission capabilities of such devices as PCs and smartphones, we believe that the growing use of cloud-based big data presents new business opportunities. To take advantage of such opportunities, the Electronics & Devices Division has assumed a policy of pursuing business tie-ups, capital alliances, business acquisitions, and R&D investment in order to achieve the goals of 1. securing added value, 2. scale expansion, and 3. improving quality.
Evaluation of Progress in the First Year of VISION-130
In December 2014, we made Kanematsu-NNK Corp. a con-solidated subsidiary and began joint operations in the secu-rity systems fi eld, including the security camera business. Building on core camera technologies, Kanematsu is focus-
ing on image processing devices, components and materi-als, and information processing. To augment its existing business in the area of high-resolution micro-lens units for portable devices, the company has set its sights on market-ing security cameras and systems as well as services, includ-ing image and information processing, with an eye to expanding the camera market. Aiming to sustainably main-tain and develop the enterprise value of the Group, in March 2015 Kanematsu Electronics Ltd. made Nippon Offi ce Systems Ltd. a wholly owned subsidiary. In addition, we entered a capital and business alliance with Nippon Manufacturing Service Corporation, which operates an electronics manufacturing service (EMS) business as well as contracting and human resource dispatch businesses for the manufacturing industry. Together, we have launched a joint business leveraging Nippon Manufacturing Service’s EMS functions, including design and production. To aug-ment our existing businesses involved in sales of electronics components and modules, we are using the added value of EMS services, which include production and quality man-agement, to meet customers’ various needs related to product development.
Strategies to Realize VISION-130 In addition to visible changes, such as those evidenced by statistics, we are seeing changes at deeper, less visible lev-els, such as in design concepts. We are approaching these changes as business opportunities and working to turn them into new businesses. For example, until now machin-ery and tools were designed for human operators, but we are now seeing a rise in designs for sensor-driven machines capable of autonomous decision making and operation. We are working hard to develop the sensing devices and modules that are indispensible to such systems.
Electronics & Devices Division
Net Sales/Operating Income
Kaoru Tanigawa Director, Senior Managing Executive Offi cer, Chief Offi cer, Electronics & Devices Division
23KANEMATSU ANNUAL REPORT 2015
Kanematsu’s Progress and
StrengthsSpecial Feature: Realizing VISIO
N-130
Review of O
perationsCSR and Corporate G
overnanceFinancial Section and Com
pany Information
Semiconductors
We supply semiconductors made by domestic and overseas manufacturers and offer a wide array of products, from generic power ICs and memories to cutting-edge technologies, such as ASICs and high-precision sensors. Moreover, we provide optimal solutions by supplying electronic components, primarily semiconductor products, and various modules for a wide range of applications, including in mobile devices, intelligent home appliances, vehicle equipment, and industrial machinery.
Electronic Components and Materials
We offer a wide array of electronic components and electronic materials. We provide total support for materials of the key components of semiconduc-tors, LCDs, cameras, and batteries that are used in PCs, smartphones, tablets, and other products. In addition, we provide solutions such as LEDs and photovoltaic modules for environment-related, automotive, and amuse-ment businesses.
Industrial Electronics
We primarily offer commercial printers and their consumables with over-seas sales channels and a service system. We are expanding our business, including OEM and ODM, in a wide range of countries. In household supplies, we handle various daily-use products such as primary and sec-ondary batteries and their related products.
Semiconductor Equipment
This segment mainly deals in semiconductors and LCD manufacturing equip-ment and has a wide range of product lines as well as domestic and over-seas support structures. Kanematsu discovers promising cutting-edge technologies developed by Japanese and overseas manufacturers. In part-nership with these manufacturers, we commercialize these technologies as unique products and develop them into de-facto industry standards that meet the needs of customers. Our system, which is capable of responding to large numbers of requests, is creating stronger relationships of trust with customers.
ICT/Mobile Solutions
As ICT solutions, we provide one-stop delivery and consulting services that extend to the design, construction, installation, maintenance, and operation of clients’ information systems. As for mobile solutions, we sell mobile communication devices, including smartphones, nationwide as a primary distributor for communications car-riers. We also provide services for clients’ information systems.
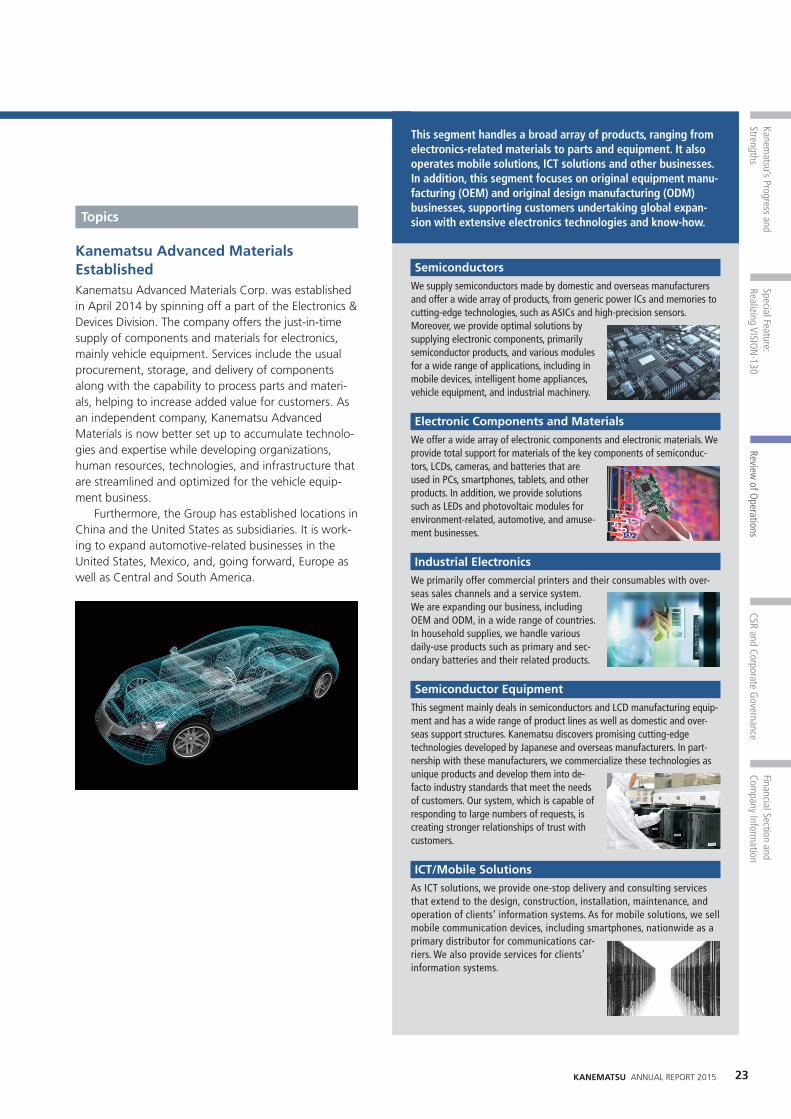
Kanematsu Advanced Materials EstablishedKanematsu Advanced Materials Corp. was established in April 2014 by spinning off a part of the Electronics & Devices Division. The company offers the just-in-time supply of components and materials for electronics, mainly vehicle equipment. Services include the usual procurement, storage, and delivery of components along with the capability to process parts and materi-als, helping to increase added value for customers. As an independent company, Kanematsu Advanced Materials is now better set up to accumulate technolo-gies and expertise while developing organizations, human resources, technologies, and infrastructure that are streamlined and optimized for the vehicle equip-ment business. Furthermore, the Group has established locations in China and the United States as subsidiaries. It is work-ing to expand automotive-related businesses in the United States, Mexico, and, going forward, Europe as well as Central and South America.
Topics
This segment handles a broad array of products, ranging from electronics-related materials to parts and equipment. It also operates mobile solutions, ICT solutions and other businesses. In addition, this segment focuses on original equipment manu-facturing (OEM) and original design manufacturing (ODM) businesses, supporting customers undertaking global expan-sion with extensive electronics technologies and know-how.

24 KANEMATSU ANNUAL REPORT 2015
4.0
3.0
2.0
1.0
0
Net Sales (left scale) Operating Income (right scale)
(¥ billion)
FY2013 FY2014 FY2015 FY2016(Forecast)
400.0
300.0
200.0
100.0
0
287.9
309.0 307.7340.0
3.2
2.11.9
3.5
Division CompositionIn April 2013, to facilitate the achievement of global devel-opment in the area of foods and grain, a priority measure, and to optimize the use of its strengths, the Group merged the Feedstuff Division, which handled such products as grain and animal feedstuff, and the Foods Division, which handled such products as processed foods and edible ani-mal products. Today, the Foods & Grain Division created by this reorganization provides a wide range of goods and ser-vices related to food for human and pet consumption, spanning everything from grain, agricultural products, meat and marine products, ingredients for desserts, alcoholic and non-alcoholic beverages, frozen foods, and processed foods to animal feedstuff and fertilizer.
Division Initiatives and Policy under VISION-130 Based on Market Analysis
In the food segment, we are reinforcing the supply and sales systems of existing Group businesses that deal with mass retailers and the restaurant and food service indus-tries. We are also working to increase our trading volume both in and outside Japan, particularly in emerging Asian countries where economic growth is driving rapid changes in food culture. To this end, we are developing one-stop services encompassing proposals, manufacturing, and sup-ply while building value chain infrastructure. In the food-stuff and grain business, we are particularly focused on reinforcing upstream frameworks in our areas of strength, including feedstuff materials and non-genetically modifi ed soybeans. At the same time, we are striving to ensure the stable supply of animal feedstuff and grains, expand over-seas sales channels, and build business platforms in line with the evolving food culture of Asia.
Evaluation of Progress in the First Year of VISION-130
Indonesia, a nation with a population of over 250 million, boasts a rapidly growing economy, and its middle class is expected to see continued growth. Although the country’s food culture remains relatively traditional, it has begun to shift toward eating for enjoyment. In response to this shift and in light of growing social diversity, we have partially fi nanced the fi rst Japanese-Indonesian joint venture to manufacture fruit jelly. In Japan, to further reinforce the value chains serving our pet-related businesses, we have acquired stakes in wholesal-ers, seeking synergies with the pet food manufacturing busi-nesses run by our subsidiaries. By building an integrated operational framework extending from material procurement to manufacturing and sales and combining this framework with our accumulated experience, we will meet needs not just in Japan, but overseas as well, particularly in Southeast Asia.
Strategies to Realize VISION-130We are working to maximize the comprehensive strengths of the Foods & Grain Division group and become more deeply involved in markets. In and outside Japan, we seek to build “glocal” value chains, that is, we seek to operate from a global perspective while promoting locally oriented, hands-on approaches that meet the needs of producers and suppliers and maintaining sales channels spanning upstream to downstream operations. Through our con-tinuous evolution, business creation-oriented business model, and with a commitment to manufacturing based on the development and proposal of high-value-added products, we aim to realize the joy of connecting the producer with the consumer, always put-ting the customer fi rst. Furthermore, by strengthening our Food Safety Management System and delivering even safer, more secure products, we hope to contribute to local communities around the world by enriching dietary habits and raising the quality of life.
Foods & Grain Division
Net Sales/Operating Income
Morihiro Toida Managing Executive Offi cer, Chief Offi cer, Foods & Grain Division

25KANEMATSU ANNUAL REPORT 2015
Kanematsu’s Progress and
StrengthsSpecial Feature: Realizing VISIO
N-130
Review of O
perationsCSR and Corporate G
overnanceFinancial Section and Com
pany Information
FoodsIn the areas of processed fruits and prepared foods, with sales centered on imported foodstuff for restaurants, ready-made meals, and retail markets, we established at an early stage a joint-venture plant for sorting and processing, built an integrated pro-duction management system covering everything from procurement to manufactur-ing, and provided high-quality, safe food. For food and beverages, such as confectionery ingredients, coffee, and wine, we inspect the farms and factory condi-tions of production areas throughout the world to select our business partners, and for agricultural products we have also developed new production areas. For ready-cooked foods, we have set up plants equipped with central kitchens at overseas locations.
Meat and Marine ProductsIn the meat processing business, we have been diversifying raw materials sourcing geographically and have secured multiple raw material procurement sources, thereby reducing supply risks. We have fortifi ed our partnerships with overseas packers and created a stable supply system for high-quality products that meet diverse customer needs in Japan. In marine products, we have established cephalopod, crustacean, and processed marine products (which are consumed raw, cooked, or as fl avoring) as our three core product areas. Centered on our processing facility in Vietnam, we have developed delicious and distinctive products by connecting the production area with the dining table.
Grain, Food Soybeans, OilseedsIn the grain business, we sell an assortment of grain, including rice, wheat, and corn, primarily in Japan and Asia. Notably, we handle one of the industry’s largest trade volumes of corn for grits. Kanematsu contributes to stable food supply in Japan through its ownership of grain silos in Kashima and Moji. The food soybean business operates a soybean sorting plant in the U.S. state of Ohio and has achieved integrated traceability, from agricultural fi elds to the custom-er, through seed development and direct farming contracts with farms. Kanematsu meets the various needs for edible soybeans through its supply of safe and secure non-genetically modifi ed (non-GMO) soybean brands in Japan and overseas. Kanematsu also sells oilseeds that are subject to inte-grated traceability management starting at the farm.
FeedstuffAs an industry pioneer, we have built an integrated business, from the import of raw materials to mixed feed production and sales. With the establishment of a cost advantage through rigorous cost management, we have developed high-value-added and differentiated products that meet customers’ needs. In response to the increasing move toward dairy mega farms, we have formed alliances with agricultural corpora-tions and through our own efforts thus created demand for mixed feed and feed crops. Further, as a leading company in this fi eld, we are boosting the development of affi liated plants overseas and promoting the vertical integration of the feedstuff business.
Processed Agricultural ProductsItalian-made pasta and olive oil are used in the foodservice industry, such as in restau-rants, processed into frozen pasta, and used as ingredients for ready-made meals, such as deli products for use in bagged and boxed lunches. We also sell French frozen bread dough and pie dough to such food service providers as bakeries and pastry shops. Oats and barley are also products of focus as ingredients for cereals.
Pet Products and GroceriesAs an all-rounder in the pet business, we develop, import, and sell private- and store-brand pet food, snacks, and other products not only for cats and dogs, but also birds, fi sh, and small animals. We also provide domestic pet food manufacturers with pet products and raw materials. Furthermore, we are globally expanding our business, including by exporting major Japanese pet food manufac-turer’s goods to Asian countries and through third-country trading.
Committed to safe, secure food, this segment works to ensure sta-ble supplies of a wide range of foods, including high value-added items, like grains, raw oil and fat materials, feedstuffs, and marine products, through an integrated supply system spanning raw mate-rial procurement through fi nished product processing.
Enriching Dietary Habits in Asia: Eating for EnjoymentTo shift our thinking from the perspective of a trad-ing company to that of a manufacturer, better inte-grate with the local culture, and meet the needs of Indonesia’s growing food service sector, we launched P.T. Kanemory Food Service, a joint venture with Indonesia’s Cimory Group that is engaged in food processing and central kitchen operations. Kanemory Food Service proposes and develops products in line with the needs of the food service sector and is capable of simultaneously producing and supplying a wide variety of products through its central kitchen system. The company is rolling out delicatessen items, boxed lunches, sweets, and other products. This company can also accommodate halal requirements, a crucial consideration for Muslim cus-tomers. Using operational and other know-how cultivat-ed in Japan’s food service market, Kanematsu pro-vides support for Japanese companies operating in Indonesia and strives to contribute to the develop-ment of food culture there and throughout Asia by bringing Japanese-quality foods to the tables of the region’s four billion residents.
Topics

26 KANEMATSU ANNUAL REPORT 2015
500.0
400.0
300.0
200.0
0
10.0
8.0
6.0
4.0
100.0 2.0
0
Net Sales (left scale) Operating Income (right scale)
(¥ billion)
FY2013 FY2014 FY2015 FY2016(Forecast)
434.2468.8 467.8 480.0
5.1
8.17.3
7.0
Steel, Materials & Plant Division
Net Sales/Operating Income
Division Composition The Steel, Materials & Plant Division was launched in April 2013, integrating three divisions that, until then, had oper-ated independently. By gathering experts in the fi elds of steel, materials (centered mainly on functional chemicals and energy), and plant to share information and insight, we believe that we can generate substantial synergies. The iron and steel business, for example, is particularly focused on the key areas of automobiles, the environment, and energy, and includes the oilfi eld tubing business and the specialty steel business for petrochemical plants, which supplies chimney desulfurization facilities and other prod-ucts. These businesses are closely linked to the materials and plant businesses.
Division Initiatives and Policy under VISION-130 Based on Market Analysis
As mentioned above, in the iron and steel business, we are focusing on the three key areas of automobiles, the envi-ronment, and energy, as these areas constitute growth businesses that support global industry and are fi elds in which Kanematsu has longstanding strengths. In our busi-ness approach, rather than toil in areas we are not strong in just for the sake of broadening our scope, we choose to focus on deeply developing areas of strength. Thus, in the functional chemicals business, we are continuing to focus on certain niche markets in addition to concentrating efforts on the pharmaceutical business, targeting the grow-ing needs presented by Japan’s low birth rate and aging population. In the energy business, we are working to opti-mize high-value-added transactions that make use of Group-owned tank facilities and to reinforce the distribu-tion sales business. In the plant business, we are steadily building a track record in wind-power generation and other aspects of the renewable energy business, an area of
strength, as well as the Offi cial Development Assistance (ODA) business, including that involving grants and yen loans from the Japanese government.
Evaluation of Progress in the First Year of VISION-130
A year has passed since the announcement of VISION-130. In fi scal 2015, crude oil prices dropped, somewhat impacting our petroleum product and oilfi eld tubing businesses. However, steel material exports to Asia expanded, and the steel business as a whole, including sales of specialty steel for automobiles and petrochemical facilities, was fi rm. In the materials busi-ness, the pharmaceutical and agricultural intermediate busi-ness saw solid growth. The plant business, meanwhile, received a signifi cant order for a wind-power generation proj-ect in the Philippines. As a result, I think the segment as a whole got off to a solid start.
Strategies to Realize VISION-130 To achieve the goals of VISION-130, we must deepen coor-dination with subsidiaries that possess high levels of exper-tise in their respective fi elds of steel, materials, and plant to raise the comprehensive strength of the division higher than ever. We are therefore aiming to maximize division profi t, continuing to focus on the division’s policies of: 1. Further development and horizontal expansion in our areas of strength, 2. Aggressively shifting management resources overseas, 3. Creating high-value-added businesses, and 4. Pursuing synergies with Group companies.
Takashi Gunji Director, Senior Managing Executive Offi cer,Chief Offi cer, Steel, Materials & Plant Division

27KANEMATSU ANNUAL REPORT 2015
Kanematsu’s Progress and
StrengthsSpecial Feature: Realizing VISIO
N-130
Review of O
perationsCSR and Corporate G
overnanceFinancial Section and Com
pany Information
Steel
Kanematsu is expanding its efforts in growth markets, including North America, Asia, and China. We are developing business in cooperation with Japan’s steel industry through the export of steel products and the import of steel raw materials. We seek to further open up new markets and build high-value-added businesses.
Functional Chemicals and Energy
In functional chemicals, we are focusing on market niches in which we are strong and on development and value-proposition businesses. We are also building supply chains with Japanese and overseas suppliers and customers. We are taking an active role in helping Japanese society deal with increas-ingly low birth rates and an aging population by supplying pharmaceuticals and functional food materials. In the energy business, we are engaging in new business opportunities in an environment changed by electricity and gas deregulation. We are devel-oping value-added businesses by putting our customer-oriented know-how and services to use, for example, leveraging our tank facilities to reinforce our existing distribution sales business. We have also developed new busi-nesses, including electric power and carbon credit trading.
Plant
We are pursuing project-forming businesses, full-package petrochemical plants that cover everything from raw material procurement to product sales, and the growing renewable energy-related businesses while focusing on direct marketing-related businesses and on our business and geographic areas of expertise.
This segment engages in domestic and export transactions covering the full range of iron and steel products, energy solu-tions, functional chemicals trading, and industrial plant and infrastructure facilities. While this segment handles a wide variety of operations, in each business area we boast highly specialized staff who uphold our commitment to supplying and developing high-value-added products.
New Initiatives in Businesses Related to the Global EnvironmentIn fi scal 2015, the Steel, Materials & Plant Division established a Global Environmental Business Team. The new team mainly works to put together and coordinate various projects for developing and emerging nations based on the Japanese government’s joint cred-iting mechanism (JCM). These include providing high-value-added energy saving technologies and equipment to help reduce and absorb greenhouse gases, and, in the future, possibly carbon credit trading. Previously, departments in charge of energy, plant, and ships worked separately. The Global Environmental Business Team was established to facilitate communica-tion among these disparate departments and thereby help to transform their individual projects into Groupwide initiatives. In fi scal 2014, the Plant & Ships Department received an order from a Filipino independent power supplier for the construction of a wind-power plant in San Lorenzo and the laying and covering of submarine cables. These projects represent exactly the type of business model that the Global Environmental Business Team aims for. Going forward, through various environment-related businesses in and outside Japan, the team will do its utmost to contribute to society while building a stable earnings base.
Topics

28 KANEMATSU ANNUAL REPORT 2015
80.0
60.0
40.0
20.0
0
4.0
3.0
2.0
1.0
0
Net Sales (left scale) Operating Income (right scale)
(¥ billion)
FY2013 FY2014 FY2015 FY2016(Forecast)
50.754.5
59.765.0
1.4 1.5
2.83.0
Net Sales/Operating Income
Division Composition The Motor Vehicles & Aerospace Division was formed in April 2013 as a combination of the existing Electronics & IT, Iron & Steel, and Machinery & Plant divisions’ business units related to automobiles and aerospace, areas of strength for the Group. By integrating and concentrating the Group’s automobile-related businesses, for which global demand is expected to grow, and adding to these the aerospace busi-ness, we aim to share information related to cutting-edge technologies in the fi eld of transport vehicles and thus further enhance sales capabilities. In motorcycle- and automobile-related businesses, we are working to strengthen and expand our supply chains and customer base. At the same time, we aim to facilitate the sharing of cutting-edge aero-space technologies with operations in the motorcycle and automotive fi elds to create new businesses in such areas as new materials and environmentally friendly products. Since the launch of this division, we have been improving our global framework for advancing businesses around the world targeting global motorization. We will continue to reinforce our roles and functions to better serve our cus-tomers and business partners.
Division Initiatives and Policy under VISION-130 Based on Market Analysis
Our basic policies consist of: 1. Maximize synergies result-ing from reorganization, 2. Improve and strengthen our global business structure, 3. Maximize the role of logistics transactions, 4. Build businesses outside of brokerage. Under these policies, in the automobile part business, we are building a global support framework to meet our customers’ needs, as global production of automobiles is projected to grow from 88 million vehicles in 2014 to 112 million in 2020. In the aerospace business, the rotable parts market is expected to remain fi rm, and we will horizontally
expand our existing operations in this market. At the same time, we will reinforce businesses in the area of space, which is expected to grow going forward.
Evaluation of Progress in the First Year of VISION-130
We have expanded the global framework of our motorcycle and automobile businesses. Specifi cally, in April 2014, we established locations in Silao, Mexico, and Chongqing, China, and are working to build a framework to support precise responsiveness at the local level and thus develop and realize new projects. To reinforce the aircraft rotable part business, at overseas business company KG Aircraft Rotables, in addition to components for the Boeing B737, we have begun handling Airbus A320 components.
Strategies to Realize VISION-130 In motor vehicle and parts-related businesses, we are con-tinuing to promote the longstanding initiatives of building and enhancing our global framework, improving our tech-nological adaptability, and strengthening logistics, quality management, and testing functions. At the same time, we are working to develop new projects related to safety, the environment, and comfort, enter manufacturing business-es, and build new, joint businesses with our key business partners. Furthermore, we are considering investment in new business models related to connected cars in anticipa-tion of the arrival of the age of networked automobiles. In the aerospace businesses, we are focusing on sales of Bombardier Aerospace’s new C Series airliners and expand-ing the range of aircraft covered by our aircraft rotable part businesses with an eye toward expansion outside of Europe. We are also now focusing on the space business, which is expected to see major growth going forward.
Motor Vehicles & Aerospace Division
Yoshiya Miyabe Managing Executive Offi cer,Chief Offi cer, Steel, Motor Vehicles & Aerospace Division

29KANEMATSU ANNUAL REPORT 2015
Kanematsu’s Progress and
StrengthsSpecial Feature: Realizing VISIO
N-130
Review of O
perationsCSR and Corporate G
overnanceFinancial Section and Com
pany Information
Motor Vehicles and Parts
Strengthening its sales force as well as sourcing and technical development capabilities, Kanematsu is expanding its businesses handling OEM compo-nents for vehicles. We operate global businesses through our worldwide net-works. Focusing on motorcycle and automobile parts, Kanematsu will continuously explore and propose new high-value-added materials and prod-ucts for which future demand is expected while establishing new business foundations through aggressive business investment.
Aerospace
Kanematsu is working to expand its businesses in the areas of aircraft, heli-copters, and related equipment and parts for government agencies. Also Kanematsu is focusing on sales to commercial airlines as the sales represen-tative of Bombardier Aerospace for its new C Series commercial aircraft. In addition, we are working to expand the aircraft rotable parts business, pos-sibly through investment. In the space business, Kanematsu will focus on sales of small satellites and peripheral equipment.
Entering the Growing Aircraft Rotable Parts MarketKG Aircraft Rotables operates aircraft rotable part exchange and repair as well as component sales busi-nesses in Europe. In 2014, this company began dealing in Airbus A320 components in addition to its existing business in Boeing B737 components. The aircraft mar-ket is expected to see global growth going forward, with the number of aircraft in operation roughly dou-bling over the next 20 years. Alongside this growth, exchange demand for rotable parts used in aircraft maintenance is also expected to increase. KG Aircraft Rotables will draw on its accumulated know-how to provide 24-hour year-round supply support to meet customers’ wide-ranging needs while considering expansion from Europe into the North American and Asian markets. KG Aircraft Rotables is furthermore considering entry into the maintenance, repair and overhaul (MRO) business, which is expected to gener-ate synergies with the aircraft rotable parts business.
Topics
Specializing in transportation equipment, this segment oper-ates global motorcycle and automobile parts businesses, lever-aging the Group’s superb expertise and extensive information resources. The segment also handles vehicles and fuselages for the automobile, construction machinery, industrial vehicle, air-craft, and satellite industries.

30 KANEMATSU ANNUAL REPORT 2015
CSR (Corporate Social Responsibility)
The Kanematsu Group defi nes the pioneering spirit as fostered by our predecessors along with the wisest use of our cre-ative imagination and ingenuity, conduct abiding by the rules of the organization, and fulfi lling our corporate social responsibilities by engaging in sound, fl ourishing businesses as its Corporate Principles. The Group conducts its business in accordance with these principles and the Company’s Code of Conduct. Based on the Company’s Corporate Principles, Kanematsu’s Code of Conduct serves as a set of standards for all of Kanematsu’s corporate activities. The Kanematsu Group offers a wide range of products and services in Japan and around the world. The Group thus regards creating shared value while meeting the needs and expectations of its many stakeholders, including shareholders, investors, business partners, local communities, and employees, as its corporate social responsibility.
Kanematsu has established a CSR Promotion Offi ce within its Personnel & General Affairs Department as well as a Companywide CSR Committee. These bodies formulate policies and reinforce initiatives for the Group as necessary to address various CSR-related issues, including social contribution and environmental preservation.
The Kanematsu Group engages in CSR initiatives in the course of its ordinary business activities. In and outside Japan, we focus on expanding businesses that make best use of our capabilities as a trading company to sustain and improve the environment. We also strive to conduct business with due consideration given to biodiversity.
Kanematsu’s Approach to CSR
CSR Framework
CSR through Our Business Activities
Kanematsu’s Code of Conduct
1. Origin of corporate activities
We became involved in corporate activities to serve our various stakeholders by providing socially valuable goods and services in accordance with the aim of our founder to realize a sustainable society.
2. Fair transactions Our corporate activities are conducted in compliance with laws and ordinances in Japan and abroad, international rules and practices, and internal rules, as well as with social common sense.
3. Information manage-ment & disclosure
Information is properly managed to protect personal information, customer information and intellectual property, and is disclosed in a timely and proper manner to establish mutual trust between Kanematsu and the community and main-tain a high level of transparency.
4. Respect for human rights We respect human rights and do not discriminate. Employee career development and capability development are actively supported. Diversity, personality, and character are respected so as to create a dynamic corporate culture.
5. Consideration of the global environment
We exercise suffi cient consideration in our corporate activities to maintain a sound global environment for sustainable growth.
6. Social contribution We are aware of the importance of our social responsibility as good corporate citizens, and proactively undertake social contribution activities. Employee activities to contribute to community development and to comfortable and safe living are supported.
CSR procurement refers to the practice of a company requiring its suppliers of materials, parts, and products to implement CSR initiatives in addition to meeting such everyday require-ments as consistently high quality and speed. CSR procurement is growing in importance year by year as awareness of CSR increases among companies and the general public. We have established systems to promote CSR activities, including CSR Action Guidelines for Supply Chains, to meet the CSR procurement requirements of our business partners. The requests made by business partners as part of CSR procure-ment activities touch on a wide variety of concerns, including employee relations, health and safety, environmental activities, CSR management, and corporate ethics. Areas of concern include the following.
• Does the supplier conduct its business activities with due consideration given to the environment?
• Does it conduct its business activities with due consideration given to human rights? (Respecting bans on child labor and forced labor, etc.)
• What is its compliance record like? • Does it meet the latest quality standards? (Usage restrictions
on harmful substances that go beyond legal requirements)
CSR Procurement
Flow of CSR Procurement
Suppliers of raw materials/business partners
(suppliers of each manufacturer, producer, etc.)
Procurement of raw materialsby Kanematsu
Added value such asmanufacturing, processing,
and customization by Kanematsu
Sales of products by Kanematsu
Buyer of products(sales offices, retailers,
manufacturers, government offices, etc.)
Sales by customers
End users
CSR procurement required ofcustomers by Kanematsu(business with companiespracticing CSR)
Supply chain
CSR procurement required ofKanematsu by customers(CSR practices)

31KANEMATSU ANNUAL REPORT 2015
Kanematsu’s Progress and
StrengthsSpecial Feature: Realizing VISIO
N-130
Review of O
perationsCSR and Corporate G
overnanceFinancial Section and Com
pany Information
Human resources are a vital asset for Kanematsu, and retaining and training human resources is important for the Company’s growth. Kanematsu maintains systems to promote work-life balance, including child care support and family care support systems, seeking to create workplaces that are comfortable and rewarding for employees. Furthermore, we focus considerable effort on human resource development, an indispensible part of Kanematsu’s growth.
Human Resource Initiatives
Kanematsu aims to improve corporate value by further devel-oping areas of strength, making new investments for business creation, and taking on other new challenges. To this end, we have created training courses covering business plan formula-tion to impart the skills necessary for drafting roadmaps to the creation and successful launch of new businesses.
Kanematsu operates an overseas training system for employees in their fi rst fi ve years with the Company. Participants are dis-patched to overseas subsidiaries, representative offi ces, and business corporations to experience local work- and lifestyles for around six months. This system exposes employees to diverse values and provides the experiences, insights, and knowledge that members of a globally operating trading company need.
Renewable EnergyKanematsu’s renewable energy businesses consist of the con-struction of and supply of facilities for geothermal, solar, and wind-power generation plants. The Company is steadily building a strong track record in these businesses, mainly in Indonesia and the Philippines. Compared with fossil fuels, renewable ener-gy sources produce much less CO2, a major cause of global warming, and therefore have the signifi cant merit of being bet-ter for the global environment. At the same time, renewable energy sources help to meet emerging needs to reduce depen-dence on imported energy. Going forward, Kanematsu will con-tinue to contribute to the development of clean energy by supplying renewable energy generation facilities.
Sustainable Coffee Kanematsu is committed to the trading of sustainable coffee. “Sustainable coffee” refers broadly to coffee produced and dis-tributed in ways that are sustainable in terms of their effect on the natural environment and people’s livelihoods, thus helping to meet the responsibility of the current generation to future gen-erations. Kanematsu was among the fi rst to focus its attention on this fi eld and strives to support producers and protect the environment by importing and marketing coffee beans that have received accreditation from the Rainforest Alliance, an interna-tional environmental body that focuses on tropical rainforest protection.
Training in Business Plan Formulation Overseas Dispatch Training System
Environmental Businesses
Keigo SuzukiCurrently stationed at AZ-Star Co., Ltd.
Through this training, I learned basic skills important for creating new busi-nesses. These included the ability to for-mulate a business plan, including the perspective and methodology to make
that plan strong, as well as ways of presenting plans so that they resonate with an audience, particularly decision makers. The training also provided valuable opportunities to expand my outlook through discussions and debates with employees of different backgrounds and levels of experience. This training has been very useful in my current position working with business investment funds.
Hanae TeruiElectronic Components & SemiconductorDepartment No. 1 Division 2
During my overseas training in Singapore, I learned a great deal, more than just knowledge and know-how, from my bosses and more senior employees who
were stationed there. I think that coming to understand the impor-tance of thinking about things from a comprehensive, objective per-spective was particularly valuable. Being in a new environment helped me view myself objectively, too, and I realized shortcomings and weaknesses that I wasn’t aware of before. I hope to continue to improve myself as a trading company employee and thus express my gratitude for the support and help I have received through my work.
Training in Business Plan Formulation Trainee’s Perspective
Overseas Dispatch Training SystemTrainee’s Perspective

32 KANEMATSU ANNUAL REPORT 2015
Kanematsu is proactively committed to ensuring a good work-life balance, and discourages long working hours to foster a healthy workforce. We have been improving the working envi-ronment so that employees can treasure the time they spend with their families as well as the time spent on hobbies and participating in social activities.
Child Care Support In addition to comprehensive maternity and childcare leave arrangements, we allow mothers to work short hours and fl exi-time after taking leave for pregnancy or care reasons, so they can continue to care for growing children after rejoining the workforce. Many mothers take childcare leave, and when they return to work, they generally go to the same divisions in which they worked before. These measures have been taken to create a pleasant working environment.
Family Care Support In addition to the conventional family care leave system, Kanematsu has recently enabled special paid holidays for family care. We also have in place a child-raising and care consulta-tion offi ce for one-to-one consultation on these matters.
Refreshment Day By urging employees across Kanematsu to do no overtime on Wednesdays, we aim to improve working effi ciency and encourage a better work-life balance. We have also set aside one day every month as a special “Refreshment Day” during which we monitor hours worked, to bring down overtime.
General Employer Action PlanIn December 2010, Kanematsu was award-ed the “Kurumin” certifi cation of support for nurturing of the next generation by the Ministry of Health, Labour and Welfare’s Tokyo Labor Bureau. In October 2013, we formulated our third General Employer Action Plan. Based on this plan, we are taking measures to fully harness employee potential by encour-aging a better balance between work and childcare duties and by creating a more pleasant workplace for all.
Work-Life Balance
FY2008 FY2009 FY2010 FY2011
6 4 10 9
FY2012 FY2013 FY2014 FY2015
3 4 14 10
Number of Employees Taking Childcare Leave
Kanematsu is engaged in environmental businesses in Japan and overseas that help protect and improve the global envi-ronment. The global Group also continuously works to improve its ISO 14001-based environmental management system. By effectively operating this system, the Group is reducing electricity and paper consumption, promoting comprehensive waste sorting and reduction, and helping to reduce CO2 emissions. Through these efforts, the Group strives to contribute to the creation of a low-carbon, recycling-oriented society.
Environmental Initiatives
ISO 14001Certification in theKanematsu Group
ExpandingISO 14001-basedenvironmental
management systems
Kanematsu Corporation: Certified Since 2004
Tokyo Head Office and All Domestic Branches (Osaka Branch, Midosuji Office,Hokkaido Branch, Nagoya Branch, Kobe Main Office, Kyushu Branch, Sendai Office)
Kanematsu-NNKCorp.
Certified since 2006
KanematsuElectronics Ltd.
Certified since 2007
KanematsuCommunications Ltd.Tokyo Head Office
Certified since 2015
Electronics & Devices
KanematsuWellness Corp.
Certified since 2005
KanematsuChemicals Corp.
Certified since 2005
Kanematsu Yuso Co., Ltd. Certified since 2005
KanematsuPetroleum Corp.
Certified since 2005
Kanematsu KGK Corp. Certified since 2005
Steel, Materials & Plant
Foods & Grain KanematsuAgritec Co., Ltd.
Certified since 2013
Other
Hokushin Co., Ltd. Certified since 2005

33KANEMATSU ANNUAL REPORT 2015
Kanematsu’s Progress and
StrengthsSpecial Feature: Realizing VISIO
N-130
Review of O
perationsCSR and Corporate G
overnanceFinancial Section and Com
pany Information
Social Contribution
The Kanematsu Foundation for the Research of Foreign Trade was established in 1940 with the purpose of contributing to economic development through support and funding for research into trade and international economics. The Foundation is jointly operated by the Research Institute for Economics and Business Administration of Kobe University and Kanematsu. In the more than 70 years since its founding, the Foundation has earned an international reputation as a top-level research institute focusing on international economics and management and has won high acclaim in Japan and overseas for its long list of research achievements.
In 1993, the Kanematsu Fellowship—a Kanematsu post-graduate research scholarship—was jointly established by the Research Institute for Economics and Business Administration of Kobe University, the Kanematsu Foundation for the Research of Foreign Trade, and Kanematsu Corporation. Every year, graduate students are invited to submit their dissertations to apply for the fellowship. The Kanematsu Fellowship thus provides graduate students in the fi elds of economics, management, and accounting across Japan with opportunities to win a research fellowship and to present their research.
After the March 2011 Great East Japan Earthquake, the Kanematsu Group donated money and supplies to affected areas. Since September of the same year, the Group has provided ongo-ing support for Rikuzentakata city in, Iwate, through its own vol-unteer program. In addition to the Company’s volunteer leave system, Kanematsu has a system to support employees volunteer-ing in disaster-affected areas that includes reimbursement of transportation and accommodation expenses for employees par-ticipating in the Company’s volunteer program. Furthermore, in February 2015, Kanematsu donated a mobile
library vehicle christened Yamabiko-go to the city of Rikuzentakata to contribute to the development of the city’s children. The interi-or of Yamabiko-go is brightly illuminated by LED lamps, and its shelves hold approximately 900 books. The mobile library is also equipped with a retractable awning to provide shade or shelter from rain to facilitate its use in all weather conditions. The Kanematsu Group is committed to volunteer activities in disaster-affected areas that address both immediate needs and long-term issues and will continue to offer support in response to the needs of the affected areas and their residents.
Among the main commemorative projects we have carried out in accordance with the wishes of our founder Fusajiro Kanematsu are the endowment of the Research Institute for Economic and Business Administration (Kanematsu Memorial Hall), a commerce research institute at Kobe Higher Commercial
School (now Kobe University); the endowment of the Kanematsu Auditorium at Hitotsubashi University; and the endowment of the Kanematsu Memorial Institute of Pathology at Sydney Hospital in Australia (a partial endowment by Kanematsu that is jointly funded by the Australian Government).
The Kanematsu Foundation for the Research of Foreign Trade
Reconstruction Support Activities
Commemorative Projects Carrying on the Wishes of Our Founder
Caring for a sacred laurel tree on the grounds of a local shrine
Kanematsu Memorial Hall at Kobe University The Kanematsu Auditorium at Hitotsubashi University
Kanematsu Memorial Institute of Pathology, Sydney Hospital
Mobile library Yamabiko-go donated to Rikuzentakata City

34 KANEMATSU ANNUAL REPORT 2015
Corporate Governance
Kanematsu strives to strengthen corporate governance to increase the transparency of management and to create a more equitable, effi cient, and sound company. We work to improve corporate governance with the aim of win-ning the support of all our stakeholders, including shareholders, customers, business partners, and employees, and increasing our enterprise value.
Kanematsu is a company with an Audit & Supervisory Board. The Audit & Supervisory Board and its members act independently to audit the performance of directors’ duties. Of the four Audit & Supervisory Board members, three are outside members. The outside Audit & Supervisory Board members draw on their insight and experience to offer recommendations and advice from an objective standpoint, thus providing due outside management oversight and supervision. Furthermore, Kanematsu has appointed multiple highly independent outside directors to strengthen and improve the effectiveness of manage-ment supervision and the transparency of decision making by the Board. The inclusion of these outside Audit & Supervisory Board members and directors is aimed at increasing the transparency of Kanematsu’s management and creating a more equitable, effi cient, and sound company. Kanematsu is expanding its executive offi cer system to improve the fl exibility of business execution, speed up management decision making, and further clarify roles and responsibilities through the separation of supervisory and executive functions.
Our Basic Stance on Corporate Governance
System of Corporate Governance
Internal AuditingDepartment
President & CEO
Management Committee
Business Divisions/Administrative Departments, Domestic and Overseas Offices
Project Deliberation Committee
Internal Control and Compliance Committee
CSR Committee
Board of Directors
Appointment/Dismissal/Supervision Audit
Appointment/Dismissal
(As of June 24, 2015)
Appointment/DismissalAppointment/
Dismissal
Collaboration
Internalcontrols
Collaboration
Audit
Accounting audit
Collaboration
General Meeting of Shareholders
Audit & Supervisory Board
Accounting Auditor
Four Audit & SupervisoryBoard Members
(including three outside members)
Seven directors(including two outside directors)
Corporate Governance Structure
The Board of Directors is made up of seven directors. The Board decides on matters required of it as set out in law and Kanematsu’s Articles of Incorporation as well as business policies and other important matters, and oversees business execution by directors. Two of the seven directors are outside directors to ensure that the Board conducts appropriate decision making
and to further reinforce the supervision of business execution. In principle, the Board of Directors meets once a month, with additional meetings held as necessary. Directors are appointed to the Board for one-year terms to allow the Board to respond appropriately to changes in the business environment.
To facilitate rapid decision making and fl exible management, Kanematsu has set up a Management Committee composed of certain executive offi cers, including the President. The Committee meets at least twice a month in principle. The
Committee establishes basic policies for Companywide general business execution in accordance with basic policies determined by the Board of Directors and provides instruction and guidance on the execution of business.
Board of Directors
Management Committee

Business Divisions/Administrative Departments
Departmental Compliance Officers(Chief officers of business divisions and administrative departments)
Directors of Kanematsu Corporation
Group Companies
Compliance Officer(President of Head of Location)
Directors of Group companies
Internal Control and Compliance Committee Members
Promotion Office: Legal & Compliance Department
Management CommitteeBoard of Directors Audit & Supervisory Board
Instructions, Feedback Reports, Consultation
(As of June 24, 2015)
Internal Control and Compliance Committee
*Sub-subsidiaries report through their immediate parent companies
(For items that do not have a controlling division at Kanematsu Corporation)
35KANEMATSU ANNUAL REPORT 2015
Kanematsu’s Progress and
StrengthsSpecial Feature: Realizing VISIO
N-130
Review of O
perationsCSR and Corporate G
overnanceFinancial Section and Com
pany Information
To ensure that proper accounting records are kept and to monitor appropriate business execution, Kanematsu has established auditing rules, in accordance with which the Internal Auditing Department conducts internal audits of all divisions and consolidated subsidiaries.
To comprehensively assess risks facing the Kanematsu Group, to comply with laws and regulations relating to operational effectiveness and effi ciency and business activities, to protect Group assets, and to ensure the reliabili-ty of its fi nancial reporting, the Kanematsu Group has built an internal control system, as described below.
Internal Auditing
Internal Control System and Risk Management System
Diagram of the Kanematsu Group Compliance System
The Audit & Supervisory Board acts as an independent organ to audit directors’ performance of their duties. Specifi cally, the four Audit & Supervisory Board members, including three out-side members, receive reports from directors and employees on
the performance of their duties as required, and attend meet-ings of the Board of Directors, Management Committee, Project Deliberation Committee, Internal Control and Compliance Committee, and other important meetings.
In light of the importance of corporate legal compliance, we have set up internal control systems for the Company and the Group as well as an Internal Control and Compliance Committee to implement said systems, seeking to strengthen our internal compliance system. In addition to preparing a Compliance
Handbook that covers all Group companies, we work to enhance awareness of and training on sensible behavioral ethics. The Group also maintains a hotline system that allows employees to directly report to or consult with the Internal Control and Compliance Committee or an outside lawyer.
The Project Deliberation Committee was established to enhance debate and speed up decision making on important projects. The Committee considers and discusses matters from a Companywide
perspective and submits recommendations to the designated deci-sion makers for each item before the decision must be made. In principle, the Committee meets at least twice a month.
Audit & Supervisory Board
Compliance
Project Deliberation Committee
To comprehensively assess risks facing the Kanematsu Group, to comply with laws and regulations relating to operational effectiveness and effi ciency and business activities, to protect its assets, and to ensure the reliability of its fi nancial reporting, the Kanematsu Group has built an internal control system. To operate this system effectively and effi ciently, we have also
established the Internal Control and Compliance Committee. We develop, operate, assess, and improve internal controls related to fi nancial reporting to ensure the correctness of the Group’s reporting in line with the internal control reporting systems defi ned in the Financial Instruments and Exchange Law.
Maintaining the Internal Control System

36 KANEMATSU ANNUAL REPORT 2015
One of Kanematsu’s compliance commitments is to take a fi rm stand against and eschew all relationships with antisocial forces. To promote the elimination of antisocial forces, Kanematsu belongs to the Tokyo Metropolitan Police Department’s Special Violence Prevention Countermeasures Association, cooperating closely on a regular basis by sharing information. The Personnel
& General Affairs Department is designated to coordinate Companywide response and information gathering to address any unreasonable demands from antisocial forces, and the Company maintains a framework for responding in coordination with outside organizations, including the police and attorneys.
With regard to information management, we have established standards for the custody, retention and disposal of accounting records, balance sheets, agreements and contracts concerning the basic rights and obligations of Kanematsu, certifi cates related to properties, and other similar documents. As informa-tion is a valuable corporate asset, we have also formulated, and work to reinforce, rules on information security manage-ment with the aim of protecting and managing personal data and other information in line with compliance requirements.
With regard to the security of information systems, the Group has established information security management rules aimed at preventing leaks and losses of important information and established standardized rules covering the use of PCs, networks, and e-mail to protect corporate and personal infor-mation. Furthermore, the Group continually reviews its systems framework aimed at enhancing security and operates and maintains said framework to ensure that security is maintained at necessary and appropriate levels.
With respect to business risks that may affect our operations, such as market risk, credit risk, investment risk, or country risk, Kanematsu has designated departments responsible for each type of risk, established internal regulations and detailed enforcement regulations, and prepared operational guidelines. We furthermore use training and other means to ensure thor-ough awareness of risk management. The Company also sets up cross-departmental committees as necessary to control risks. To comprehensively assess risks facing the Kanematsu Group, promote operational effectiveness and effi ciency, and ensure the reliability of fi nancial reporting, we have established
the Internal Control and Compliance Committee as a Groupwide organization. We have established an approval request system based on designated levels of authority to minimize business risks. The Project Deliberation Committee considers important investments and loans by comprehensively examining relevant risks. To address the risk of crises related to the occurrence of major events, such as natural disasters, we have put in place a system, including specifi c rules and policies of action, to ensure the appropriate management of the Group at such extraordi-nary times.
Elimination of Antisocial Forces
Information Management System
Risk Management
Group company presidents meet twice a year and at other times as necessary to share information on Groupwide business activities. These meetings are aimed at ensuring mutual understanding and awareness with regard to cor-porate governance issues.
We promote proper and transparent management by promptly and accurately disclosing important corporate information about management to shareholders and all other stakeholders, institutional investors, analysts, and the media. In addition to timely disclosure to fi nancial instruments exchanges, we disclose information through our website and engage actively in IR activities, including regular briefi ngs for institutional investors and analysts and meetings.
Groupwide Activities
Disclosure

37KANEMATSU ANNUAL REPORT 2015
Kanematsu’s Progress and
StrengthsSpecial Feature: Realizing VISIO
N-130
Review of O
perationsCSR and Corporate G
overnanceFinancial Section and Com
pany Information
Corporate Offi cers(As of June 24, 2015)
President & CEO Executive Vice President
Director
Audit & Supervisory Board Member (full-time)
Director
Audit & Supervisory Board Member (full-time)
Director
Audit & Supervisory Board Member
Director
Audit & Supervisory Board Member
Masayuki Shimojima Masao Hasegawa
Takashi Gunji
Fumihiko Nashimoto
Kaoru Tanigawa
Sohei Ogawa
Nobuyoshi Sakuyama
Yonosuke Yamada
Yutaka Hirai
Tsukasa Miyachi
Directors and Audit & Supervisory Board Members
Executive Offi cers
1. Mr. Yutaka Hirai and Mr. Seiichi Katayama are Outside Directors.2. Mr. Sohei Ogawa, Mr. Yonosuke Yamada and Mr. Tsukasa Miyachi are Outside Audit & Supervisory Board Members.3. Mr. Yutaka Hirai, Mr. Seiichi Katayama, Mr. Yonosuke Yamada and Tsukasa Miyachi are Independent Offi cers, as defi ned in the Securities Listing Regulations.
President & CEO Masayuki ShimojimaExecutive Vice President Masao Hasegawa Chief Offi cer, Supporting Area; Chief Offi cer, Internal Auditing
Senior Managing Executive Offi cers
Takashi Gunji Chief Offi cer, Steel, Materials & Plant Division, Chief Offi cer, Personnel and General Affairs, General Manager, Osaka Branch; General Manager, Nagoya Branch
Kaoru Tanigawa Chief Offi cer, Electronics & Devices Division, Corporate Planning
Managing Executive Offi cers
Morihiro Toida Chief Offi cer, Foods & Grain Division
Tetsuya Kaneko Chief Offi cer, System Planning, Traffi c and Insurance
Yoshiya Miyabe Chief Offi cer, Motor Vehicles & Aerospace Division
Nobuyoshi Sakuyama Chief Offi cer, Finance, Accounting, Business Accounting, Legal & Compliance
Kazuo Shibata Chief Offi cer, Credit Control
Keiichi Inaba President, Kanematsu (China) Co., Ltd.; President, Kanematsu (Hong Kong) Ltd.
Executive Offi cers Eiji Kan Deputy Chief Offi cer, Steel, Materials & Plant Division
Katsumi Morita President, Kanematsu USA Inc.
Masayuki Hamasaki Deputy Chief Offi cer, Foods & Grain Division; General Manager, Grain Dept.
Hiroyasu Hirasawa Deputy Chief Offi cer, Foods & Grain Division
Director
Seiichi Katayama

Business Results
For the fi scal year ended March 31, 2015, consolidated net sales edged up ¥2,557 million (0.2%) from the previous fi scal year to ¥1,117,096 million. Gross profi t increased ¥5,039 million (5.8%) from the previous fi scal year to ¥91,441 million. Consolidated operating income climbed ¥2,349 million (11.9%) from the previous fi scal year to ¥22,125 million. Net non-operating income improved ¥385 million from the previous fi scal year, thanks primarily to an increase in equity in earnings of affi liates and an improvement in the balance of interest income and expenses. As a result, consolidated ordinary income increased ¥2,735 million (13.6%) from the previous fi scal year to ¥22,895 million. Net extraordinary gains and losses amounted to a gain of ¥400 million, due in part to extraordinary gains recorded as a result of making Kanematsu-NNK Corp. a consolidated subsidiary. As a result, income before income taxes and minority interests climbed ¥4,219 million (22.1%) from the previous fi scal year to ¥23,294 million. Consolidated net income edged down ¥329 million (2.8%) from the previous fi scal year to ¥11,470 million, due in part to an increase in tax expenses as a result of a reversal of deferred tax assets, refl ecting changes to the tax system during the fi scal year.
Segment Information
Results for each business segment are described below.
Electronics & DevicesThe electronic components and materials business as well as the semiconductor components business performed favorably overall. In particular, businesses related to automobiles grew supported by expanding demand in and outside Japan. The ICT solutions business was fi rm thanks to strong corporate capital expenditure on infrastructure, and the mobile
business also performed strongly. Furthermore, in the fi scal year under review, Kanematsu-NNK Corp. was made a consolidated subsidiary, expanding the division’s business base, mainly with its security camera business, and thus contributing to income during the fourth quarter. As a result, although net sales in the Electronics & Devices Division fell ¥847 million year on year to ¥276,501 million, operating income increased ¥2,152 million to ¥9,907 million.
Foods & GrainThe meat product business was fi rm, supported by increasing demand. In the foodstuff business, both grain and animal feedstuff trading were solid. However, the food business faced diffi cult conditions, including depressed individual consumption since the 2014 consumption tax hike and the rising cost of imports to Japan due to the depreciation of the yen. As a result, in the Foods & Grain Division, net sales decreased ¥1,292 million year on year to ¥307,732 million. Operating income fell ¥166 million to ¥1,933 million.
Steel, Materials & PlantThe plant and infrastructure business received major orders for wind power generation plants in Southeast Asia and saw strong domestic trading in machine tools and industrial machinery. In the iron and steel business, while sales of specialty steel for automobiles were fi rm in the Americas and Europe, the mainstay oilfi eld tubing business was impacted by weak demand. The energy business faced challenging conditions, including decreased summer demand and a fall in crude oil prices. As a result, net sales in the Steel, Materials & Plant Division decreased ¥982 million year on year to ¥467,849 million. Operating income decreased ¥846 million to ¥7,283 million.
Motor Vehicles & AerospaceIn the aerospace business, aircraft part trading was strong. The
Net Sales Operating Income / Operating Income Ratio
Net Income / Net Income per Share
900,000
1,200,000
600,000
300,000
0
(Millions of yen)
11 12 13 14 15
Net sales
936,8911,006,3651,019,232
1,114,539 1,117,096
12,000
24,000
6,000
0
2.0
18,000 3.0
4.0
1.0
0
(%)
11 12 13 14 15
Operating income ratio
18,029
21,426
18,262
19,776
22,125
1.92.1
1.8 1.82.0
(Millions of yen)
Operating income
6,000
12,000
3,000
0
20
9,000 30
40
10
0
11 12 13 14 15
9,175
6,110
9,564
11,79911,470
21.93
14.60
22.80
28.09 27.30
(%)(Millions of yen)
Net income per shareNet income
38 KANEMATSU ANNUAL REPORT 2015
Management’s Discussion and Analysis

39KANEMATSU ANNUAL REPORT 2015
Kanematsu’s Progress and
StrengthsSpecial Feature: Realizing VISIO
N-130
Review of O
perationsCSR and Corporate G
overnanceFinancial Section and Com
pany Information
Net Interest-Bearing Debt / Net D/E Ratio
Net Assets / Net Assets per Share Shareholders’ Equity / Equity Ratio
60,000
120,000
30,000
0
2.0
90,000 3.0
4.0
1.0
0
11 12 13 14 15
(Times)(Millions of yen)
Net interest-bearing debt Net D/E ratio
104,612
90,01286,439
68,038 67,646
3.2
2.31.6
0.9
0.8
70,000
140,000
35,000
0
150
10,500 225
300
75
0
11 12 13 14 15
49,57655,992
75,912
96,204
118,731
79.0793.16
129.82
170.54
214.10
(Yen)(Millions of yen)
Net assets Net assets per share
50,000
100,000
25,000
0
20
75,000 30
40
10
0
11 12 13 14 15
33,10139,008
54,519
71,657
90,101
8.59.8
13.7
16.7
19.6
(%)(Millions of yen)
Shareholders’ equity Equity ratio
motor vehicles and parts business saw fi rm performance overall, particularly in motorcycle and automobile parts trading. As a result, net sales in the Motor Vehicles & Aerospace Division increased ¥5,224 million year on year to ¥59,675. Operating income rose ¥1,261 million to ¥2,755 million.
OtherNet sales rose ¥455 million year on year to ¥5,338 million. Operating income fell ¥55 million to ¥169 million.
Analysis of Financial Status
Assets, liabilities and net assets Total assets at the end of the fi scal year under review increased ¥30,552 million from the end of the previous fi scal year to ¥459,011 million. Interest-bearing debt declined ¥5,791 million from the end of the previous fi scal year to ¥136,114 million. Net interest-bearing debt, which is interest-bearing debt minus cash and bank deposits, decreased ¥392 million from the end of the previous fi scal year to ¥67,646 million. Net assets stood at ¥118,731 million, up ¥22,527 million from the end of the previous fi scal year, thanks to an increase in retained earnings as a result of the posting of net income and improvements in foreign currency translation adjustments that refl ected exchange rate fl uctuations. Shareholders’ equity, obtained by subtracting minority interests from net assets, increased ¥18,444 million from the end of the previous fi scal year to ¥90,101 million. As a result, the equity ratio improved 2.9 percentage points from the end of the previous fi scal year to 19.6%. The net D/E ratio stood at 0.8.
Cash fl owsNet cash provided by operating activities totaled ¥10,115 million (versus ¥22,384 million provided in the previous fi scal
year), chiefl y refl ecting the increase in operating income recorded. Net cash used in investing activities amounted to ¥8,903 million (versus ¥1,111 million used in the previous fi scal year), refl ecting the Group’s making Kanematsu-NKK Corp. a consolidated subsidiary and the acquisition of additional shares of Nippon Offi ce Systems Ltd. aimed at making that company a wholly owned subsidiary. Net cash used in fi nancing activities amounted to ¥9,895 million (versus ¥9,351 million used in the previous fi scal year), refl ecting the repayment of debt, among other factors. As a result, after the effect of exchange rate changes, cash and cash equivalents at the end of the fi scal year under review stood at ¥67,377 million, down ¥6,171 million from the end of the previous fi scal year.
FundraisingThe Group raises funds primarily through indirect fi nancing based on good relations with its main banks, regional banks, life and non-life insurers, and other fi nancial institutions. To secure liquidity on hand, the Group maintains ample cash and cash equivalents and has established commitment lines with major fi nancial institutions. Surplus funds are fl exibly managed in highly secure short-term fi nancial products in response to the Company’s funding needs and fi nancial circumstances. During the fi scal year under review, the Group fi led a shelf registration of corporate bonds, aiming to ensure that it can fl exibly respond to funding requirements arising from business development going forward and to increase its fi nancial stability by diversifying its available means of capital procurement. To facilitate capital procurement, the Company receives ratings from Japan Credit Rating Agency, Ltd. (JCR) and Rating and Investment Information, Inc. (R&I). The Company’s long-term ratings as of the end of the fi scal year under review are BBB+ (stable) from JCR and BBB (stable) from R&I.
* Net interest-bearing debt = Interest-bearing debt – Cash and bank deposits
* Net D/E ratio = Net interest-bearing debt / Shareholders’ equity
* Shareholders’ equity = Net assets – Minority interests* Equity ratio = Shareholders’ equity / Total assets

40 KANEMATSU ANNUAL REPORT 2015
Business Risks
Below are details of the risks that could affect the business performance and fi nancial position of the Group. The forward-looking statements below are based on information available as of June 24, 2015. The Group takes all risk that it faces on a daily basis in the course of its business very seriously. Risk control is undertaken through management mechanisms and methods tailored to the nature of each category of risk.
Market Risk Related to Supply and Demand and Prices of Goods Traded
In its mainstay commodity trading business in Japan and overseas, the Group deals with grains and petroleum products as well as electronic parts and information, communications and technology (ICT) products. Grains and petroleum products will be infl uenced by the market condi-tions, while electronic parts and ICT products are exposed to the risk of frequent price erosion caused by competition and obsolescence resulting from technological innovation. An unexpected loss may result from causes such as rapid movements in commodities prices or a decline in demand, when our positions in these commodities increase.
Foreign Currency Risk
The Group is engaged in foreign currency transactions in a number of currencies and terms incidental to its export and import trading. The Group not only transfers the risk of currency fl uctuations to customers in accordance with transaction terms but also participates in derivatives transactions such as forward contracts to reduce the risk. The Group also has local subsidiaries and business corporations overseas. Account balances at these companies are converted into yen at the exchange rates prevailing at the time of account closing, for the purposes of preparing consolidated fi nancial statements. For this reason, net assets may change through translation adjustments associated with exchange rate fl uctuations.
Interest Rate Risk
The Group raises most funds needed for operating and fi nancing activities in the form of borrowings from fi nancial institutions at variable interest rates, with the exception of certain loans. Since these borrowings and fund management are exposed to an interest rate risk, interest paid by the Group may increase with a rise in interest rates. Also, since certain companies in the Group adopt a defi ned benefi t pension plan, the retirement benefi t obligation could increase in the estimation of the Group if the discount rate used for the calculation of the retirement benefi t obligation falls.
Price Fluctuation Risk of Marketable Securities, etc.
The Group may hold shares in trade partners as means of strengthening its relationship with them. There is a risk of price fl uctuation inherent in these shares, which could have an effect on the fi nancial position of the Group through unrealized loss on available-for-sale securities. Since stocks and other securities are included in the portfolio of the pension assets of the Group for the purpose of making medium-and long-term investments, differences from the required investment yield could have an effect on the fi nancial position of the Group, given that the investment yield will fall if the prices of the stocks, etc. fall.
Default Risk and Credit Risk
The Group extends credit in a number of forms, including accounts receivable, advance payments, loans and guarantees in diverse business transactions with its trading partners in Japan and abroad. For this reason, late repayments and defaults may occur with developments such as a deterioration in the fi nancial strength of its trading partners. The Group could also be forced to perform obligations that could be accompanied by a monetary loss in association with the conclusion and performance of a commodity supply agreement, a contract agreement, and subcontract agreement, or other agreements, irrespective of reasons, if the trade partner defaults on its obligation or contract. Although the Group has set aside an allowance for these losses in our accounting procedures using certain estimates, an additional loss could arise if the loss exceeds the scope of the allowance.
Business Investment Risk
The Group makes business investments to achieve objectives, including deep mining of existing businesses and expansion of business areas. The Group decides whether to make such investments through procedures established according to their details and amounts. When making investment decisions, the Group evaluates and analyzes risk factors and the profi tability of the business based on cash fl ows, taking the criteria for business withdrawal into account. After making an investment, the Group regularly reevaluates and

41KANEMATSU ANNUAL REPORT 2015
Kanematsu’s Progress and
StrengthsSpecial Feature: Realizing VISIO
N-130
Review of O
perationsCSR and Corporate G
overnanceFinancial Section and Com
pany Information
reviews business potential and investment value to minimize any potential loss. The value of the business investments may fl uctuate according to the fi nancial conditions of investment targets and their business success or failure. The range of market changes tends to be particularly wide in overseas businesses. Local laws and relationships with partners may also prevent the Group from executing its policy for operating or withdrawing from a business.
Country Risk
The Group engages in transactions, loans and investments in other countries. The collection of receivables may be delayed or impossible as a result of political or economic developments in each of these countries. To minimize losses that could arise should these country risks become reality, the Group regularly sets a limit based on ratings given to each country and region according to the scale of their respective country risk, and operates its businesses in such a way that prevents overexposure to certain countries and regions. The Group takes steps such as enrolling in trade insurance programs, according to the ratings and project details in an attempt to minimize recovery risks. However, continuing transactions may become diffi cult if these risks actualize in certain countries and regions, and this development may affect the future business results of the Group.
Legal Risk Related to Changes in Laws
The business activities undertaken by the Group in Japan and overseas are subject to a wide range of legal regulations in Japan and other countries. The Group may become unable to continue certain transactions because of factors such as unexpected changes in laws, changes in export and import regulations, including a punitive tariff that could be introduced unilaterally following changes in the international political environment, and changes in regulations such as permits and licenses related to the sales and handling of products. An unexpected expense for the Group may also arise from a lawsuit or from an order issued by authorities. This risk also includes the risk that a tax rate or tax arrangements imposed by authorities or between countries under international taxation arrangements may change. Changes in these legal systems could infl uence the fi nancial position and operating results of the Group.
Legal Risk Related to Lawsuits and Disputes
Business operations by the Group, and its assets and liabilities associated with the business operations may become subject to legal proceedings, including lawsuits, and other disputes, in various ways through the course of the business activities undertaken by the Group in Japan and overseas. Such lawsuits and disputes are generally unpredictable, and
resolving them is often very time-consuming when they occur. Any prediction of the results therefore involves uncertainties. Any occurrence of such lawsuits or disputes and unexpected outcomes may affect the Group’s fi nancial position and operating results.
Security Risk Related to Information Systems and Information Security
The Group builds and operates information systems for sharing information and streamlining its operations. The Group has adopted information security control rules, and is taking steps to ensure that all members of the Group are familiar with crisis control responses, to meet the safety requirements for operating its information systems. However, information systems cannot be made entirely invulnerable to the unauthorized disclosure of business sensitive information or personal information through unauthorized access, computer viruses and other means, as well as inoperability due to factors such as natural disasters, destruction of information system facilities attributable to accidents and other causes, and communication line troubles. Inoperability may reduce the effi ciency of operations that depend on the systems, and seriously affect the future business results of the Group, depending on the scale of damages.
Product and Facility Deterioration Risk due to Natural Disasters and Accidents
The Group owns facilities and equipment, including business offi ces, warehouses and manufacturing plants, in Japan and overseas. It also owns cargo being stored or transported in and outside Japan for business transactions. Such assets may be damaged or deteriorate as a result of natural disasters, accidents and other developments, and the businesses of the Group may be suspended due to developments such as earthquakes, fi res, fl oods, and riots. Such incidents may seriously affect the future fi nancial position and operating results of the Group, depending on the extent of the damage.
Compliance and Fraud Risk
The Group operates businesses to buy, sell and provide a broad array of products and services in Japan and overseas and carefully monitors laws and regulations, including those related to exports and imports that are established and enforced for these products and services in Japan and other countries. However, it is diffi cult to execute all procedures at all times across all of the trading operations we conduct with the involvement of multiple parties. Although we take a number of actions to prevent violations, there is a risk that we may overlook a violation of a law or an instance of fraud. If the violation or fraud is material, the fi nancial position and operating results of the Group could be affected.
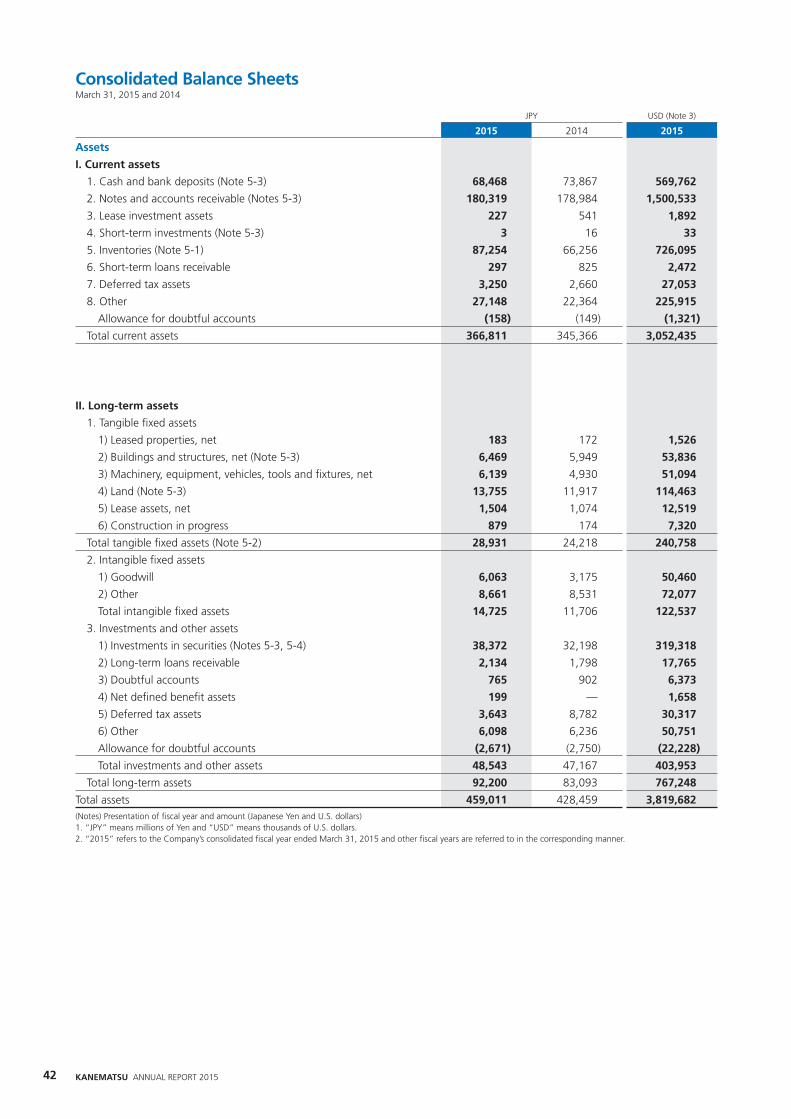
JPY USD (Note 3)
2015 2014 2015
Assets
I. Current assets
1. Cash and bank deposits (Note 5-3) 68,468 73,867 569,762
2. Notes and accounts receivable (Notes 5-3) 180,319 178,984 1,500,533
3. Lease investment assets 227 541 1,892
4. Short-term investments (Note 5-3) 3 16 33
5. Inventories (Note 5-1) 87,254 66,256 726,095
6. Short-term loans receivable 297 825 2,472
7. Deferred tax assets 3,250 2,660 27,053
8. Other 27,148 22,364 225,915
Allowance for doubtful accounts (158) (149) (1,321)
Total current assets 366,811 345,366 3,052,435
II. Long-term assets
1. Tangible fi xed assets
1) Leased properties, net 183 172 1,526
2) Buildings and structures, net (Note 5-3) 6,469 5,949 53,836
3) Machinery, equipment, vehicles, tools and fi xtures, net 6,139 4,930 51,094
4) Land (Note 5-3) 13,755 11,917 114,463
5) Lease assets, net 1,504 1,074 12,519
6) Construction in progress 879 174 7,320
Total tangible fi xed assets (Note 5-2) 28,931 24,218 240,758
2. Intangible fi xed assets
1) Goodwill 6,063 3,175 50,460
2) Other 8,661 8,531 72,077
Total intangible fi xed assets 14,725 11,706 122,537
3. Investments and other assets
1) Investments in securities (Notes 5-3, 5-4) 38,372 32,198 319,318
2) Long-term loans receivable 2,134 1,798 17,765
3) Doubtful accounts 765 902 6,373
4) Net defi ned benefi t assets 199 — 1,658
5) Deferred tax assets 3,643 8,782 30,317
6) Other 6,098 6,236 50,751
Allowance for doubtful accounts (2,671) (2,750) (22,228)
Total investments and other assets 48,543 47,167 403,953
Total long-term assets 92,200 83,093 767,248
Total assets 459,011 428,459 3,819,682(Notes) Presentation of fi scal year and amount (Japanese Yen and U.S. dollars)1. “JPY” means millions of Yen and “USD” means thousands of U.S. dollars.2. “2015” refers to the Company’s consolidated fi scal year ended March 31, 2015 and other fi scal years are referred to in the corresponding manner.
Consolidated Balance SheetsMarch 31, 2015 and 2014
42 KANEMATSU ANNUAL REPORT 2015

JPY USD (Note 3)
2015 2014 2015
Liabilities
I. Current liabilities
1. Notes and accounts payable 116,567 115,210 970,019
2. Import bills payable 32,530 27,610 270,705
3. Short-term borrowings (Note 5-3) 61,688 80,792 513,344
4. Lease obligations 638 760 5,310
5. Accrued income taxes 2,492 1,951 20,742
6. Deferred tax liabilities 1 1 10
7. Asset retirement obligations 107 6 892
8. Other 38,322 32,302 318,904
Total current liabilities 252,347 258,635 2,099,925
II. Non-current liabilities
1. Long-term borrowings (Note 5-3) 74,426 61,113 619,344
2. Lease obligations 1,286 1,033 10,708
3. Deferred tax liabilities 488 368 4,063
4. Net defi ned benefi t liability 5,137 4,630 42,751
5. Provision for retirement benefi ts for directors and statutory auditors 367 387 3,059
6. Asset retirement obligations 810 804 6,741
7. Other 5,414 5,281 45,059
Total non-current liabilities 87,931 73,620 731,726
Total liabilities 340,279 332,255 2,831,651
Net assets
I. Shareholders’ equity
1. Common stock 27,781 27,781 231,182
2. Capital surplus 27,502 27,493 228,864
3. Retained earnings 44,845 35,737 373,183
4. Treasury stock (222) (321) (1,852)
Total shareholders’ equity 99,906 90,690 831,378
II. Accumulated other comprehensive income
1. Net unrealized gains on securities, net of tax 4,020 1,743 33,459
2. Net gains (losses) on deferred hedges, net of tax 559 (18) 4,654
3. Revaluation reserves for land (Note 5-5) 104 104 865
4. Foreign currency translation adjustments (14,687) (20,758) (122,221)
5. Remeasurements of defi ned benefi t plans, net of tax 198 (104) 1,648
Total accumulated other comprehensive income (9,805) (19,033) (81,594)
III. Minority interests in consolidated subsidiaries 28,630 24,547 238,247
Total net assets 118,731 96,204 988,032
Total liabilities and net assets 459,011 428,459 3,819,682The accompanying notes are an integral part of these fi nancial statements.
43KANEMATSU ANNUAL REPORT 2015
Kanematsu’s Progress and
StrengthsSpecial Feature: Realizing VISIO
N-130
Review of O
perationsCSR and Corporate G
overnanceFinancial Section and Com
pany Information

JPY USD (Note 3)
2015 2014 2015
I. Net sales 1,117,096 1,114,539 9,295,967
II. Cost of sales (Note 6-1) 1,025,655 1,028,136 8,535,034
Gross profi t 91,441 86,402 760,933
III. Selling, general and administrative expenses (Note 6-2)
1. Salaries and bonuses 29,424 28,340 244,858
2. Retirement benefi t expenses 1,166 1,491 9,708
3. Outsourcing service charges 6,468 6,145 53,828
4. Provision of allowance for doubtful accounts 51 76 426
5. Other 32,203 30,573 267,991
Total 69,315 66,626 576,811
Operating income 22,125 19,776 184,122
IV. Non-operating income
1. Interest income 414 382 3,446
2. Dividend income 1,118 814 9,305
3. Equity in earnings of affi liates 1,145 739 9,536
4. Foreign exchange gains 1,835 2,389 15,277
5. Other 1,358 935 11,307
Total 5,872 5,260 48,871
V. Non-operating expenses
1. Interest expenses 2,949 3,255 24,548
2. Other 2,153 1,620 17,922
Total 5,103 4,876 42,470
Ordinary income 22,895 20,160 190,523
VI. Extraordinary gains
1. Gain on sale of tangible fi xed assets (Note 6-3) 70 2,114 588
2. Gain on sale of investments in securities 106 230 888
3. Gain on liquidation of subsidiaries and affi liates 84 — 702
4. Gain on step acquisitions 1,123 — 9,351
5. Gain on bargain purchase — 46 —
Total 1,385 2,390 11,529
VII. Extraordinary losses
1. Loss on disposal of fi xed assets (Note 6-4) 138 381 1,150
2. Impairment loss on fi xed assets (Note 6-5) 580 2,196 4,834
3. Loss on sale of investments in securities 62 34 522
4. Impairment loss on investments in securities 29 55 249
5. Loss on liquidation of subsidiaries and affi liates — 276 —
6. Provision of allowance for doubtful accounts for subsidiaries and affi liates 174 — 1,448
7. Business structure improvement expenses (Note 6-6) — 530 —
Total 985 3,476 8,203
Income before income taxes and minority interests 23,294 19,075 193,849
Income taxes – current 5,378 4,500 44,757
Income taxes – deferred 3,547 453 29,519
Total 8,925 4,953 74,275
Income before minority interests 14,369 14,121 119,574
Minority interests in consolidated subsidiaries 2,898 2,321 24,122
Net income 11,470 11,799 95,452The accompanying notes are an integral part of these fi nancial statements.
Consolidated Statements of IncomeFor the years ended March 31, 2015 and 2014
44 KANEMATSU ANNUAL REPORT 2015

JPY USD (Note 3)
2015 2014 2015
I. Income before minority interests 14,369 14,121 119,574
II. Other comprehensive income
1. Net unrealized gains on securities, net of tax 2,236 715 18,613
2. Net gains (losses) on deferred hedges, net of tax 569 (293) 4,737
3. Foreign currency translation adjustments 7,092 6,552 59,020
4. Remeasurements of defi ned benefi t plans, net of tax 316 — 2,635
5. Share of other comprehensive income of associates accounted for equity method
124 178 1,034
Total other comprehensive income (Note 7-1) 10,339 7,153 86,039
Comprehensive income 24,708 21,274 205,612
Comprehensive income attributable to the shareholders of the Company 20,698 17,869 172,243
Comprehensive income attributable to minority interests 4,009 3,405 33,369The accompanying notes are an integral part of these fi nancial statements.
Consolidated Statements of Comprehensive IncomeFor the years ended March 31, 2015 and 2014
45KANEMATSU ANNUAL REPORT 2015
Kanematsu’s Progress and
StrengthsSpecial Feature: Realizing VISIO
N-130
Review of O
perationsCSR and Corporate G
overnanceFinancial Section and Com
pany Information

Consolidated Statements of Changes in Net AssetsFor the years ended March 31, 2015 and 2014
Fiscal 2015 (From April 1, 2014 to March 31, 2015)JPY
Shareholders’ equity Accumulated other comprehensive income
Minority interests in
consolidated subsidiaries
Total net assets
Common stock
Capital surplus
Retained earnings
Treasury stock
Total shareholders’
equity
Net unrealized gains (losses) on securities,
net of tax
Net gains (losses) on deferred hedges,
net of tax
Revaluation reserves for land
Foreign currency translation
adjustments
Remeasurements of defi ned
benefi t plans, net of tax
Total accumulated
other comprehensive
income
Balance at the beginning of the fi scal year 27,781 27,493 35,737 (321) 90,690 1,743 (18) 104 (20,758) (104) (19,033) 24,547 96,204 Cumulative effects of changes
in accounting policies (681) (681) (155) (837)Restated balance 27,781 27,493 35,055 (321) 90,008 1,743 (18) 104 (20,758) (104) (19,033) 24,391 95,367Changes during the fi scal year Dividends (1,680) (1,680) (1,680) Net income 11,470 11,470 11,470 Acquisition of treasury stock (13) (13) (13) Disposition of treasury stock 8 155 164 164 Effect of changes in the shares
of equity-method affi liates — — Changes of scope
of consolidation (42) (42) (42) Net changes of items other
than shareholders’ equity during the fi scal year 2,277 577 (0) 6,071 302 9,228 4,238 13,466
Total changes during the fi scal year — 8 9,789 99 9,897 2,277 577 (0) 6,071 302 9,228 4,238 23,364 Balance at the end of the fi scal year 27,781 27,502 44,845 (222) 99,906 4,020 559 104 (14,687) 198 (9,805) 28,630 118,731
Fiscal 2014 (From April 1, 2013 to March 31, 2014)JPY
Shareholders’ equity Accumulated other comprehensive income
Minority interests in
consolidated subsidiaries
Total net assets
Common stock
Capital surplus
Retained earnings
Treasury stock
Total shareholders’
equity
Net unrealized gains (losses) on securities,
net of tax
Net gains (losses) on deferred hedges,
net of tax
Revaluation reserves for land
Foreign currency translation
adjustments
Remeasurements of defi ned
benefi t plans, net of tax
Total accumulated
other comprehensive
income
Balance at the beginning of the fi scal year 27,781 27,526 24,567 (357) 79,517 1,048 298 66 (26,411) — (24,997) 21,393 75,912
Cumulative effects of changes in accounting policies — —
Restated balance 27,781 27,526 24,567 (357) 79,517 1,048 298 66 (26,411) — (24,997) 21,393 75,912
Changes during the fi scal year
Dividends (630) (630) (630)
Net income 11,799 11,799 11,799
Acquisition of treasury stock (13) (13) (13)
Disposition of treasury stock (32) 49 16 16
Effect of changes in the shares of equity-method affi liates (0) (0) (0)
Changes of scope of consolidation — —
Net changes of items other than shareholders’ equity during the fi scal year 694 (316) 38 5,652 (104) 5,964 3,153 9,118
Total changes during the fi scal year — (32) 11,169 35 11,172 694 (316) 38 5,652 (104) 5,964 3,153 20,291
Balance at the end of the fi scal year 27,781 27,493 35,737 (321) 90,690 1,743 (18) 104 (20,758) (104) (19,033) 24,547 96,204
Fiscal 2015 (From April 1, 2014 to March 31, 2015)USD (Note 3)
Shareholders’ equity Accumulated other comprehensive income
Minority interests in
consolidated subsidiaries
Total net assets
Common stock
Capital surplus
Retained earnings
Treasury stock
Total shareholders’
equity
Net unrealized gains (losses) on securities,
net of tax
Net gains (losses) on deferred hedges,
net of tax
Revaluation reserves for land
Foreign currency translation
adjustments
Remeasurements of defi ned
benefi t plans, net of tax
Total accumulated
other comprehensive
income
Balance at the beginning of the fi scal year 231,182 228,792 297,388 (2,678) 754,684 14,508 (151) 872 (172,743) (871) (158,385) 204,271 800,570 Cumulative effects of changes
in accounting policies (5,672) (5,672) (1,295) (6,967)Restated balance 231,182 228,792 291,716 (2,678) 749,012 14,508 (151) 872 (172,743) (871) (158,385) 202,976 793,603Changes during the fi scal year Dividends (13,985) (13,985) (13,985) Net income 95,452 95,452 95,452 Acquisition of treasury stock (111) (111) (111) Disposition of treasury stock 73 1,293 1,366 1,366 Effect of changes in the shares
of equity-method affi liates — — Changes of scope
of consolidation (356) (356) (356) Net changes of items other
than shareholders’ equity during the fi scal year 18,951 4,805 (6) 50,522 2,519 76,791 35,271 112,062
Total changes during the fi scal year — 73 81,467 827 82,366 18,951 4,805 (6) 50,522 2,519 76,791 35,271 194,428Balance at the end of the fi scal year 231,182 228,864 373,183 (1,852) 831,378 33,459 4,654 865 (122,221) 1,648 (81,594) 238,247 988,032The accompanying notes are an integral part of these fi nancial statements.
46 KANEMATSU ANNUAL REPORT 2015

Consolidated Statements of Cash FlowsFor the years ended March 31, 2015 and 2014
JPY USD (Note 3)
2015 2014 2015
I. Cash fl ows from operating activities Income before income taxes and minority interests 23,294 19,075 193,849 Depreciation and amortization 3,245 3,170 27,005 Increase (decrease) in allowance for doubtful accounts 65 (198) 544 (Decrease) increase in net defi ned benefi t liability (654) 302 (5,444) Interest and dividends income (1,532) (1,196) (12,751) Interest expenses 2,949 3,255 24,548 Equity in gains of affi liates (1,145) (739) (9,536) Loss (gain) on disposal of fi xed assets 67 (1,732) 562 Impairment loss on fi xed assets 580 2,196 4,834 Gain on sale of investments in securities, net (44) (195) (366) Impairment loss on investments in securities 29 55 249 Gain on liquidation of subsidiaries and affi liates (84) — (702) Loss on liquidation of subsidiaries and affi liates — 276 — Gain on step acquisitions (1,123) — (9,351) Business structure improvement expenses — 530 — Decrease (increase) in notes and accounts receivable 6,263 (6,395) 52,122 (Increase) decrease in inventories (17,072) 2,964 (142,072) Increase in notes and accounts payable 975 5,617 8,114 Other 1,274 1,409 10,607 Sub total 17,089 28,396 142,212 Interest and dividends received 1,301 1,338 10,832 Interest paid (2,954) (3,276) (24,586) Payments for business structure improvement expenses (530) — (4,417) Income taxes paid (4,790) (4,074) (39,861) Net cash provided by operating activities 10,115 22,384 84,180II. Cash fl ows from investing activities (Increase) decrease in time deposits, net (743) 105 (6,191) Payments for tangible fi xed assets (3,807) (2,305) (31,687) Proceeds from sales of tangible fi xed assets 914 3,422 7,608 Payments for intangible fi xed assets (656) (435) (5,465) Payments for investments in securities (2,053) (271) (17,087) Proceeds from sales of investments in securities 50 551 421 Payments for purchase of investments in subsidiaries (2,030) (96) (16,894) Proceeds from sales of investments in subsidiaries — 826 — Payments for purchase of investments in subsidiaries resulting in change
in scope of consolidation (Note 9-2)(171) (2,761) (1,428)
Payments for transfer of business (87) — (728) Increase in loans receivable (437) (69) (3,638) Proceeds from collection of loans receivable 629 265 5,238 Other (509) (342) (4,243) Net cash used in investing activities (8,903) (1,111) (74,094)III. Cash fl ows from fi nancing activities Increase (decrease) in short-term borrowings, net 2,245 (4,237) 18,682 Proceeds from long-term borrowings 38,511 41,548 320,471 Repayments of long-term borrowings (47,756) (44,781) (397,407) Proceeds on issuance of common stock — 157 — Cash dividends paid (1,675) (625) (13,943) Proceeds from sales of shares of parent held by subsidiaries 355 — 2,960 Other (1,574) (1,412) (13,105) Net cash used in fi nancing activities (9,895) (9,351) (82,343)IV. Effect of exchange rate changes on cash and cash equivalents 2,511 1,593 20,903V. Net (decrease) increase in cash and cash equivalents (6,171) 13,516 (51,355)VI. Cash and cash equivalents at beginning of year 73,548 60,032 612,041VII. Cash and cash equivalents at end of year (Note 9-1) 67,377 73,548 560,686The accompanying notes are an integral part of these fi nancial statements.
47KANEMATSU ANNUAL REPORT 2015
Kanematsu’s Progress and
StrengthsSpecial Feature: Realizing VISIO
N-130
Review of O
perationsCSR and Corporate G
overnanceFinancial Section and Com
pany Information
Notes to Consolidated Financial StatementsFor the years ended March 31, 2015 and 2014
1. Basis of Preparing Consolidated Financial Statements
(1) The Method of Producing the Consolidated Financial Statements:
The consolidated fi nancial statements of Kanematsu Corporation (the “Company”) are prepared in accordance with the “Regulations Concerning Terminology, Forms, and Preparation Methods of Consolidated Financial Statements” (Ministry of Finance Ordinance No.28, 1976; hereinafter, the “Regulations”). The Company and its domestic consolidated subsidiaries main-tain their accounts and records in accordance with the provisions set forth in the Companies Act of Japan and the Financial Instruments and Exchange Act of Japan, and in conformity with
accounting principles generally accepted in Japan, which are differ-ent in certain respects as to application and disclosure require-ments of International Financial Reporting Standards.
(2) Japanese Yen amount:Amounts less than one million yen have been omitted, since the Regulations require such amounts to be rounded down for presen-tation. As a result, the totals shown in the consolidated fi nancial statements and notes thereto do not necessarily agree with the sum of the individual account balances or breakdowns.
2. Summary of Signifi cant Accounting Policies
(a) Scope of Consolidation:(1) Number of consolidated subsidiaries: 89(Major consolidated subsidiaries) Kanematsu Electronics Kanematsu Communications Kanematsu-NNK Kanematsu Trading Kanematsu KGK Kanematsu Petroleum Shintoa Kanematsu USA Kanematsu (Hong Kong)In the current fi scal year, Kanematsu-NNK, which was an affi liate under equity-method until the previous fi scal year, and 3 other companies were added to the scope of consolidation due to addi-tional acquisition of shares, North Pet and 5 other companies were added to the scope of consolidation due to new establishment, 1 company was added to the scope of consolidation due to new acquisition of shares, and 4 companies were excluded from the scope of consolidation due to merger or liquidation.
(2) Unconsolidated subsidiaries:(Major unconsolidated subsidiaries)KANEMATSU AMERICA DO SUL IMPORTACAO E EXPORTACAO(Reason for excluding from the scope of consolidation)The companies are small sized and immaterial to the Company in terms of their total assets, net sales, net income and retained earn-ings individually and in the aggregate.
(b) Application of Equity Method:(1) Unconsolidated subsidiaries and affi liated companies to
which the equity method is applied:Number of unconsolidated subsidiaries: 2(Major unconsolidated subsidiaries)KANEMATSU AMERICA DO SUL IMPORTACAO E EXPORTACAONumber of affi liated companies: 26(Major affi liated companies) Hokushin Kaneyo Kantatsu In the current fi scal year, 5 companies were added to accounting via the equity method due to new establishment, additional acqui-sition of shares and new acquisition of shares and 2 companies were excluded from accounting via the equity method due to changing to the scope of consolidation by additional acquisition of shares and sale of shares.
(2) Unconsolidated subsidiaries and affi liated companies to which the equity method is not applied:
(Major unconsolidated subsidiaries)Kanematsu IranMemorex Lease(Reason for not applying the equity method) The companies are immaterial to the Company’s consolidated net income and retained earnings, individually and in the aggregate. (c) Fiscal Year-ends of Consolidated Subsidiaries:Consolidated subsidiaries that have different fi scal year-end dates from the consolidated balance sheet date are as follows:
Name of consolidated subsidiary Year-end date
Kanematsu USA December 31
25 other companies
In preparing the consolidated fi nancial statements, the fi nancial statements of 26 companies with fi scal year-end dates within three months of the consolidated balance sheet date of March 31, are used. However, material differences in transactions and accounts arising from the use of these fi scal year-end dates are appropriately adjusted for in consolidation. In the current fi scal year, KG Aircraft Rotables and 2 other com-panies have changed their fi scal year-end to March 31 from December 31. As a result of this change, the accounting period ended March 31, 2015 for these 3 consolidated subsidiaries spanned 15 months from January 1, 2014.
(d) Short-term Investments and Investments in Securities:(1) Held-to-maturity bonds:Debt securities are stated at cost less the amortization of any premi-um or discounts, which are amortized over the period to maturities.
(2) Other securities (Non-trading purpose):* Marketable SecuritiesMarketable securities are stated at fair value. Net unrealized gains or losses on securities recorded in “Net assets” are net of tax amounts. The cost for marketable securities that have been sold is determined using the moving average method. The fair value is determined primary based on the average of daily market price for one-month prior to the fi scal year-end.* Non-marketable securitiesThe non-marketable securities are stated at cost using the moving average method.
48 KANEMATSU ANNUAL REPORT 2015

(e) Derivatives:Derivatives are stated at fair value method.
(f) Inventories:Inventories are stated at cost method principally determined by the moving average method (carried at the lower of cost or market value on the balance sheet).
(g) Property and Equipment:(1) Tangible fi xed assets (excluding lease assets):The straight-line method is used.The ranges of principal estimated useful lives are as follows.Buildings and structures 3 – 50 yearsMachinery, equipment, vehicles, tools and fi xtures 2 – 20 years
(2) Lease assets:Depreciation on lease assets is recorded using the straight-line method over the lease term, assuming a residual value of zero.Finance lease transactions that commenced on or before March 31, 2008 are accounted for as operating leases.
(h) Allowance for Doubtful Accounts:The Company and its consolidated subsidiaries (The “Companies”) provide an allowance for doubtful accounts to cover credit losses, based on estimates of collectability of individual accounts and past bad debt loss experiences.
(i) Provision for Retirement Benefi ts for Directors and Statutory Auditors:
The Company and certain of its subsidiaries provide a provision for retirement benefi ts for directors and statutory auditors, which is calculated by estimating the required payable as of the balance sheet date in accordance with the internal rules. (j) Retirement Benefi ts:The Company and certain of its subsidiaries provide for the pay-ment of employee retirement benefi ts and recognize net defi ned benefi t liability which deducts the value of plan assets from retire-ment benefi t obligations based on projections at the end of the current fi scal year. In calculating retirement benefi t obligation, the benefi t formula basis is used to attribute projected benefi ts to the period up to the end of fi scal year. Except for certain consolidated subsidiaries which recognize past service costs as expenses upon their occurrence, past service costs are amortized as expenses on a straight-line basis over fi ve years, a predetermined number of years, within the average expected remaining service period of the employees. Actuarial gains and losses are amortized on a straight-line basis over fi ve to ten years, within the average expected remaining ser-vice period of the employees, and are recorded as expenses in the subsequent years in which the gains or losses are recognized.Actuarial gains and losses and past service costs that are yet to be recognized in profi t or loss are recognized within the net asset sec-tion as remeasurements of defi ned benefi t plans of accumulated other comprehensive income after adjusting for tax effects. For certain calculations of defi ned net benefi t liability and retire-ment benefi t expenses, simplifi ed method is applied, which recog-nizes retirement benefi t obligations with the value of benefi ts payable assuming the voluntary retirement of all employees at the end of the fi scal year.
(k) Translation of Foreign Currencies:All monetary assets and liabilities denominated in foreign curren-cies are translated into yen at spot exchange rates prevailing at the balance sheet date. Resulting translation gains and losses are included in determination of net income for the period. The fi nancial statements of overseas subsidiaries are translated at current exchange rates on the closing date except for shareholders’ equity which is translated at historical acquisition date exchange rates. Differences in yen amounts arising from this translation are shown as “Foreign currency translation adjustments” and “Minority interests in consolidated subsidiaries” recorded in “Net assets”.
(l) Hedge Accounting:(1) Hedge accounting method:The Company and certain of its consolidated subsidiaries apply hedge accounting whereby gains and losses on hedged transac-tions are deferred and recognized over future periods. For certain interest rate swaps designated as hedging instruments that meet specifi c matching criteria, the amounts received or paid under such interest rate swap agreements are added to or deducted from the interest on the hedged assets or liabilities when paid. For certain forward exchange contracts designated as hedging instruments that meet specifi c matching criteria, the hedged assets or liabilities are measured by contract rate.
(2) Hedging instruments and hedged items:(Hedging instruments)* Commodity-related: Commodity futures contracts / Commodity
forward contracts* Foreign exchange-related: Forward exchange contracts / Foreign
currency swaps / Foreign currency options* Interest rate-related: Interest rate swaps / Interest rate options
(Hedged items)* Commodity-related: Forecasted transactions on commodity trading* Foreign exchange-related: Foreign currency-denominated mone-
tary assets and liabilities / Forecasted foreign currency transactions* Interest-related: Borrowings
(3) Hedging policy:The Company and certain of its consolidated subsidiaries have internal policies to utilize the above hedging instruments for the purpose of reducing their exposures to the risk of fl uctuations in commodity prices, foreign currencies and interest rates for their operating and fi nancing activities.
(4) Method of evaluating the effectiveness of hedging activities:The Company and certain of its consolidated subsidiaries evaluate the effectiveness of their hedging activities by comparing accumu-lated fl uctuations in prices or cash fl ows of the hedged items with those of the hedging instruments and examined the degree of their correlation.
(5) Other:Risk management is performed by the management division, which is independent of the trading section. Also, reporting to manage-ment is performed in accordance with the internal rules of the Company on a regular basis.
49KANEMATSU ANNUAL REPORT 2015
Kanematsu’s Progress and
StrengthsSpecial Feature: Realizing VISIO
N-130
Review of O
perationsCSR and Corporate G
overnanceFinancial Section and Com
pany Information

(m) Amortization of Goodwill and Negative Goodwill:Goodwill whose amortization period can be reasonably estimated is amortized over the estimated period. Otherwise goodwill is amortized over 5 years using the straight-line method. Negative goodwill which was recognized by business combina-tions before April 1, 2010 and whose amortization period can be reasonably estimated is amortized over the estimated period. Otherwise negative goodwill is amortized over 5 years using the straight-line method. (n) Scope of Cash and Cash Equivalents in
the Consolidated Statements of Cash Flows:Cash and cash equivalents in the consolidated statements of cash fl ows are comprised of cash on hand, bank deposits on demand,
and highly liquid short-term investments, generally with original maturities of three months or less, that are readily convertible to cash for which the risk of changes in value is insignifi cant.
(o) Consumption Taxes:Consumption tax and local consumption tax on goods and services are not included in the revenue and expense amounts subject to such taxes in the accompanying consolidated statements of income.
(p) Consolidated Tax Return:The Company and its wholly owned domestic subsidiaries have adopted the consolidated tax regime, and as such fi le a consolidat-ed corporate-tax return.
3. United States Dollar Amounts
The U.S. dollar amounts appearing in the consolidated fi nancial statements and the notes thereto represent the arithmetical results of translating yen to dollars at the rate of ¥120.17 to U.S.$1.00, the exchange rate prevailing on March 31, 2015. The translation of such dollar amounts is solely for convenience of the readers
outside Japan and does not imply those yen amounts have been or could be readily converted, realized or settled in dollars at the above, or any other rate.
4. Changes in Accounting Policies
(Application of accounting standard for retirement benefi ts)The main clause of Article 35 of the “Accounting Standard for Retirement Benefi ts” (ASBJ Statement No. 26 released May 17, 2012, hereinafter “Accounting Standard”) and the main clause of Article 67 of the “Guidance on Accounting Standard for Retirement Benefi ts” (ASBJ Guidance No. 25 released March 26, 2015, hereinafter “Guidance”) were adopted for the current fi scal year. As a result, the methods used for calculation of the retire-ment benefi t obligation and service costs changed. Specifi cally, the method used for determining the portion of projected benefi t obli-gation to be attributed to individual periods changed from the straight-line method to the benefi t formula basis. In addition, the method for determining the discount rates to be applied in calcu-lating the retirement benefi t obligation changed from the method of using a period approximating employees’ average remaining years of service to a single weighted-average discount rate that refl ects the estimated amounts and periods over which the benefi t will be paid. The Accounting Standard and Guidance were adopted according to the transitional treatment set forth in Article 37 of the Accounting Standard, and the effects of the change in calculation methods of the retirement benefi t obligation and service costs were adjusted against retained earnings as at the beginning of the current fi scal year. As a result, net defi ned benefi t liability increased by ¥797 million ($6,638 thousand), retained earnings decreased by ¥681 million
($5,672 thousand), and minority interests decreased by ¥155 mil-lion ($1,295 thousand). Operating income, ordinary income, and income before income taxes and minority interests increased by ¥85 million ($710 thousand), respectively. The effects of the changes on net assets per share, net income per share and diluted net income per share for the current fi scal year are immaterial.
(Change in depreciation method for tangible fi xed assets)Although the Company and certain domestic consolidated subsid-iaries had mainly used the declining-balance method as the depre-ciation method for tangible fi xed assets, the companies changed to use the straight-line method from the beginning of the current fi s-cal year. As a result of domestic and foreign business acquisitions made by the group, the portion of companies using the straight-line method became material to the group. Based on the Company’s detailed analysis of the use of their tangible fi xed assets, the eco-nomic benefi ts associated with these assets are expected to be consumed evenly over their useful lives and therefore the Company changed the depreciation method to the straight-line method. This change has no material impact on income for the current fi scal year.
5. Notes to Consolidated Balance Sheets
*1. Details of inventories are as follows:JPY USD
2015 2014 2015
Merchandise and fi nished goods 84,240 63,693 701,007
Real estate for sale 61 61 508
Raw materials and supplies 2,125 1,824 17,688
Work in progress 828 677 6,892
*2. The amount of accumulated depreciation of tangible fi xed assets
JPY USD
2015 2014 2015
30,443 28,305 253,334
50 KANEMATSU ANNUAL REPORT 2015

*3. Pledged assets and associated secured obligationsDetails of pledged assets are as follows:
JPY USD
2015 2014 2015
Cash and bank deposits 3 6 25
Notes and accounts receivable 303 229 2,524
Buildings and structures 383 381 3,192
Land 525 525 4,377
Total 1,215 1,143 10,118
Details of associated secured obligations are as follows:JPY USD
2015 2014 2015
Short-term borrowings 1,150 750 9,570
Long-term borrowings — 500 —
Guaranteed obligations 1 3 13
In addition to the foregoing pledged assets, the following items are tendered as security deposit or substitution for trading.
JPY USD
2015 2014 2015
Cash and bank deposits 3 3 25
Short-term investments — 15 —
Investments in securities 3,140 2,134 26,136
Total 3,143 2,152 26,161
*4. Investments in securities for unconsolidated subsidiaries and affi liated companies are as follows:
JPY USD
2015 2014 2015
Investments in securities 6,540 5,758 54,430
(Share stocks) (4,971) (5,306) (41,368)
(Equity investments) (569) (452) (4,740)
(Corporate bonds) (1,000) (—) (8,322)
*5. Revaluation reserves for landKANEYO Co., Ltd., an equity-method affi liate of the Company, revalued land held for business in accordance with the “Law Concerning Revaluation of Land” (Law No. 34 enacted on March 31, 1998) and the “Law to Partially Modify the Law Concerning Revaluation of Land” (Law No. 24 enacted on March 31, 1999 and Law No. 19 enacted on March 31, 2001). This equity-method affi li-ate recorded unrealized gains on revaluation, net of tax, as valua-tion and translation adjustment under the Laws. The Company’s investments in this affi liate increased by an amount equal to the unrealized gains on revaluation of land.
6. Liability for guaranteesGuarantees are provided to unconsolidated subsidiaries on their borrowings from third-party fi nancial institutions.
JPY USD
2015 2014 2015
Century Textile Industry 1,082 795 9,010
Growth D 470 191 3,919
Mojiko Silo 212 231 1,770
Other 950 1,061 7,908
Total 2,716 2,279 22,607
Keep-well or agreements similar to guarantees are included in the above accounts.
7. The amount of discounted notes receivable and endorsed notes receivable
JPY USD
2015 2014 2015
Discounted notes receivable 3,229 2,155 26,875
(Discounted export bills) 3,063 1,909 25,490
Endorsed notes receivable 128 108 1,072
6. Notes to Consolidated Statements of Income
*1. Loss on devaluation of inventoriesInventories are carried at the lower of cost or market value in the balance sheet. A loss (reversal) on devaluation of inventories is included in cost of sales.
JPY USD
2015 2014 2015
252 (311) 2,104
*2. The amount of research and development expensesJPY USD
2015 2014 2015
614 577 5,117
*3. Gain on sale of tangible fi xed assetsDetails of gain on sale of tangible fi xed assets are as follows:
JPY USD
2015 2014 2015
Machinery, equipment, vehicles, tools and fi xtures 62 12 519
Land 7 1,799 59
Leased properties 0 273 8
Other 0 28 3
Total 70 2,114 588
*4. Loss on disposal of fi xed assetsDetails of loss on disposal of fi xed assets are as follows:
JPY USD
2015 2014 2015
Buildings and structures 45 146 375
Machinery, equipment, vehicles, tools and fi xtures 42 212 355
Intangible fi xed assets 45 14 380
Other 4 8 40
Total 138 381 1,150
51KANEMATSU ANNUAL REPORT 2015
Kanematsu’s Progress and
StrengthsSpecial Feature: Realizing VISIO
N-130
Review of O
perationsCSR and Corporate G
overnanceFinancial Section and Com
pany Information

*5. Impairment loss on fi xed assetsThe Company recorded impairment loss on fi xed assets, which are summarized in the following table.Fiscal year ended March 31, 2015 (April 1, 2014 to March 31, 2015)
Use Location Type JPY USD
Business assets Shizuoka, Japan, others Land 387 3,225
Business assets Tokyo, Japan, others Buildings, etc. 193 1,608
Total 580 4,834
The Company assesses impairment losses on business assets by grouping the assets for each business operating unit, on the managerial accounting basis. For the business assets with lower profi tability, impairment losses of ¥580 million ($4,834 thousand) were recorded as an extraordinary loss by reducing their carrying amounts to their recoverable amounts. Out of ¥580 million ($4,834 thousand) of the impairment losses, ¥48 mil-lion ($407 thousand) was for buildings and structures, ¥6 million ($56 thousand) was for machinery, equipment, vehicles, tools and fi xtures, ¥387 million ($3,225 thousand) was for land and ¥137 million ($1,146 thousand) was for others. The recoverable amount is the net selling value. The net selling value is estimated mainly based on the real estate appraisal, or as zero for assets which the Company does not expect to sell.
Fiscal year ended March 31, 2014 (April 1, 2013 to March 31, 2014)
Use Location Type JPY
Business assets Chiba, Japan, others Land, etc. 2,016
Idle assets Hyogo, Japan Land 180
Total 2,196
The Company assesses impairment losses on business assets by grouping the assets for each business operating unit, on the managerial accounting basis. For idle assets, impairment is assessed individually. For the business assets with lower profi tability and idle assets which the Company has no plan to use in the future, impairment losses of ¥2,196 million were recorded as an extraordinary loss by reducing their carrying amounts to their recoverable amounts. Out of ¥2,196 million of the impairment losses, ¥11 million was for buildings and structures, ¥2 million was for machinery, equipment, vehicles, tools and fi xtures, ¥2,066 million was for land and ¥116 million was for others. The recoverable amount is the net selling value. The net selling value is estimated mainly based on the real estate appraisal.
*6. Business structure improvement expensesFiscal year ended March 31, 2015 (April 1, 2014 to March 31, 2015)Not applicable. Fiscal year ended March 31, 2014 (April 1, 2013 to March 31, 2014)Business structure improvement expenses occurred in a consolidated subsidiary. Details of the expenses are as follows:
JPY
Termination benefi ts for voluntary retirements 491
Other 39
Total 530
52 KANEMATSU ANNUAL REPORT 2015
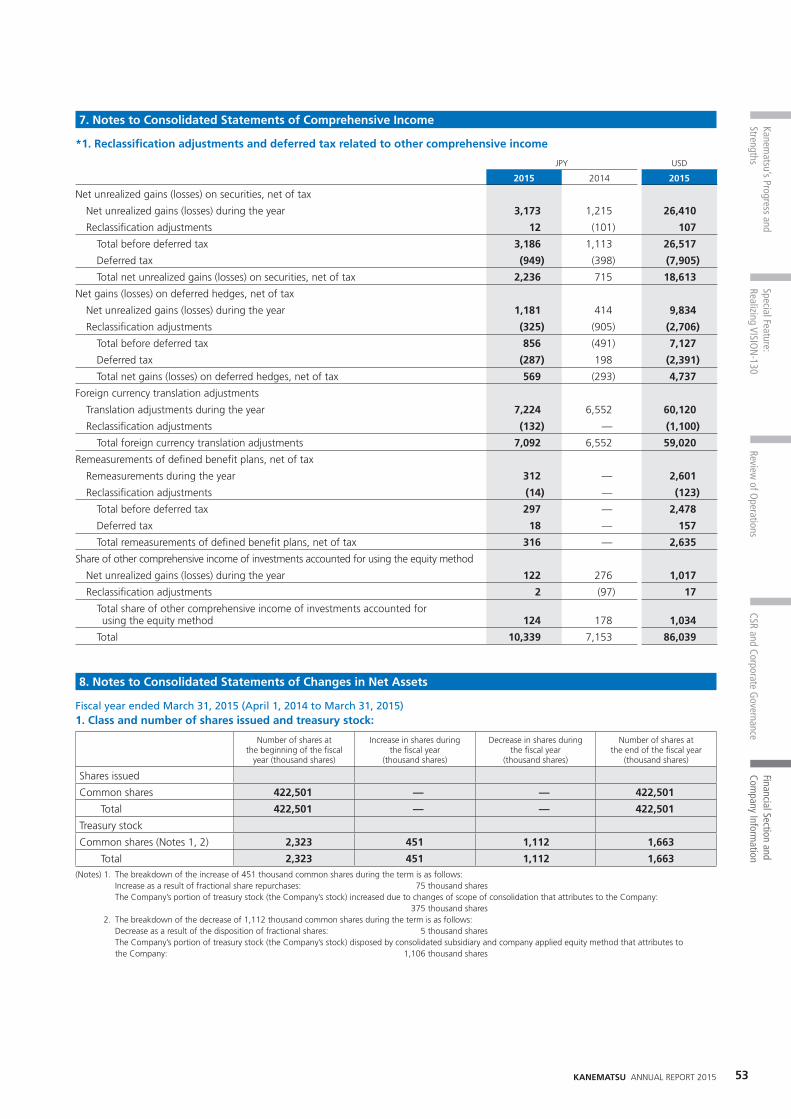
7. Notes to Consolidated Statements of Comprehensive Income
*1. Reclassifi cation adjustments and deferred tax related to other comprehensive income
JPY USD
2015 2014 2015
Net unrealized gains (losses) on securities, net of tax
Net unrealized gains (losses) during the year 3,173 1,215 26,410
Reclassifi cation adjustments 12 (101) 107
Total before deferred tax 3,186 1,113 26,517
Deferred tax (949) (398) (7,905)
Total net unrealized gains (losses) on securities, net of tax 2,236 715 18,613
Net gains (losses) on deferred hedges, net of tax
Net unrealized gains (losses) during the year 1,181 414 9,834
Reclassifi cation adjustments (325) (905) (2,706)
Total before deferred tax 856 (491) 7,127
Deferred tax (287) 198 (2,391)
Total net gains (losses) on deferred hedges, net of tax 569 (293) 4,737
Foreign currency translation adjustments
Translation adjustments during the year 7,224 6,552 60,120
Reclassifi cation adjustments (132) — (1,100)
Total foreign currency translation adjustments 7,092 6,552 59,020
Remeasurements of defi ned benefi t plans, net of tax
Remeasurements during the year 312 — 2,601
Reclassifi cation adjustments (14) — (123)
Total before deferred tax 297 — 2,478
Deferred tax 18 — 157
Total remeasurements of defi ned benefi t plans, net of tax 316 — 2,635
Share of other comprehensive income of investments accounted for using the equity method
Net unrealized gains (losses) during the year 122 276 1,017
Reclassifi cation adjustments 2 (97) 17
Total share of other comprehensive income of investments accounted for using the equity method 124 178 1,034
Total 10,339 7,153 86,039
8. Notes to Consolidated Statements of Changes in Net Assets
Fiscal year ended March 31, 2015 (April 1, 2014 to March 31, 2015)1. Class and number of shares issued and treasury stock:
Number of shares at the beginning of the fi scal
year (thousand shares)
Increase in shares during the fi scal year
(thousand shares)
Decrease in shares during the fi scal year
(thousand shares)
Number of shares at the end of the fi scal year
(thousand shares)
Shares issued
Common shares 422,501 — — 422,501
Total 422,501 — — 422,501
Treasury stock
Common shares (Notes 1, 2) 2,323 451 1,112 1,663
Total 2,323 451 1,112 1,663(Notes) 1. The breakdown of the increase of 451 thousand common shares during the term is as follows:
Increase as a result of fractional share repurchases: 75 thousand sharesThe Company’s portion of treasury stock (the Company’s stock) increased due to changes of scope of consolidation that attributes to the Company: 375 thousand shares
2. The breakdown of the decrease of 1,112 thousand common shares during the term is as follows: Decrease as a result of the disposition of fractional shares: 5 thousand shares The Company’s portion of treasury stock (the Company’s stock) disposed by consolidated subsidiary and company applied equity method that attributes to
the Company: 1,106 thousand shares
53KANEMATSU ANNUAL REPORT 2015
Kanematsu’s Progress and
StrengthsSpecial Feature: Realizing VISIO
N-130
Review of O
perationsCSR and Corporate G
overnanceFinancial Section and Com
pany Information

2. Dividends(1) Amount of dividend payments
Resolution Type of shares
Total amount of dividends Dividends per share
Record date Effective dateJPY
(Millions of yen)
USD (Thousands of U.S. dollars)
JPY (Yen)
USD (U.S. dollar)
Board of directors meeting on May 26, 2014
Common shares 632 5,260 1.50 0.012
March 31, 2014
June 5, 2014
Board of directors meeting on October 31, 2014
Common shares 1,053 8,766 2.50 0.021
September 30, 2014
December 2, 2014
(Note) The dividend of 2.50 yen per share in the resolution of board of directors meeting on October 31, 2014 includes a commemorative dividend of 1 yen per share for the Company’s 125th anniversary.
(2) Dividends whose record date is in the current fi scal year but effective date is in the following fi scal year
Resolution Type of shares
Total amount of dividends
Source of dividends
Dividends per share
Record date Effective date
JPY (Millions of
yen)
USD (Thousands of U.S. dollars)
JPY (Yen)
USD (U.S. dollar)
Board of directors meeting on May 25, 2015
Common shares 632 5,259
Retained earnings 1.50 0.012
March 31, 2015
June 4, 2015
Fiscal year ended March 31, 2014 (April 1, 2013 to March 31, 2014)1. Class and number of shares issued and treasury stock:
Number of shares at the beginning of the fi scal
year (thousand shares)
Increase in shares during the fi scal year
(thousand shares)
Decrease in shares during the fi scal year
(thousand shares)
Number of shares at the end of the fi scal year
(thousand shares)
Shares issued
Common shares 422,501 — — 422,501
Total 422,501 — — 422,501
Treasury stock
Common shares (Notes 1, 2) 2,539 92 308 2,323
Total 2,539 92 308 2,323(Notes) 1. The breakdown of the increase of 92 thousand common shares during the term is as follows: Increase as a result of fractional share repurchases: 92 thousand shares The Company’s portion of treasury stock (the Company’s stock) increased due to changes in the shares of companies applied equity method that attributes to
the Company: 0 thousand shares 2. The breakdown of the decrease of 308 thousand common shares during the term is as follows: Decrease as a result of the disposition of fractional shares: 5 thousand shares The Company’s portion of treasury stock (the Company’s stock) disposed by a company applied equity method that attributes to the Company: 302 thousand shares
2. Dividends(1) Amount of dividend payments
Resolution Type of shares
Total amount of dividends Dividends per share
Record date Effective dateJPY
(Millions of yen)JPY
(Yen)
Board of directors meeting on November 1, 2013
Common shares 632 1.50
September 30, 2013
December 3, 2013
(2) Dividends whose record date is in the current fi scal year but effective date is in the following fi scal year
Resolution Type of shares
Total amount of dividends
Source of dividends
Dividends per share
Record date Effective dateJPY
(Millions of yen)JPY
(Yen)
Board of directors meeting on May 26, 2014
Common shares 632
Retained earnings 1.50
March 31, 2014
June 5, 2014
54 KANEMATSU ANNUAL REPORT 2015
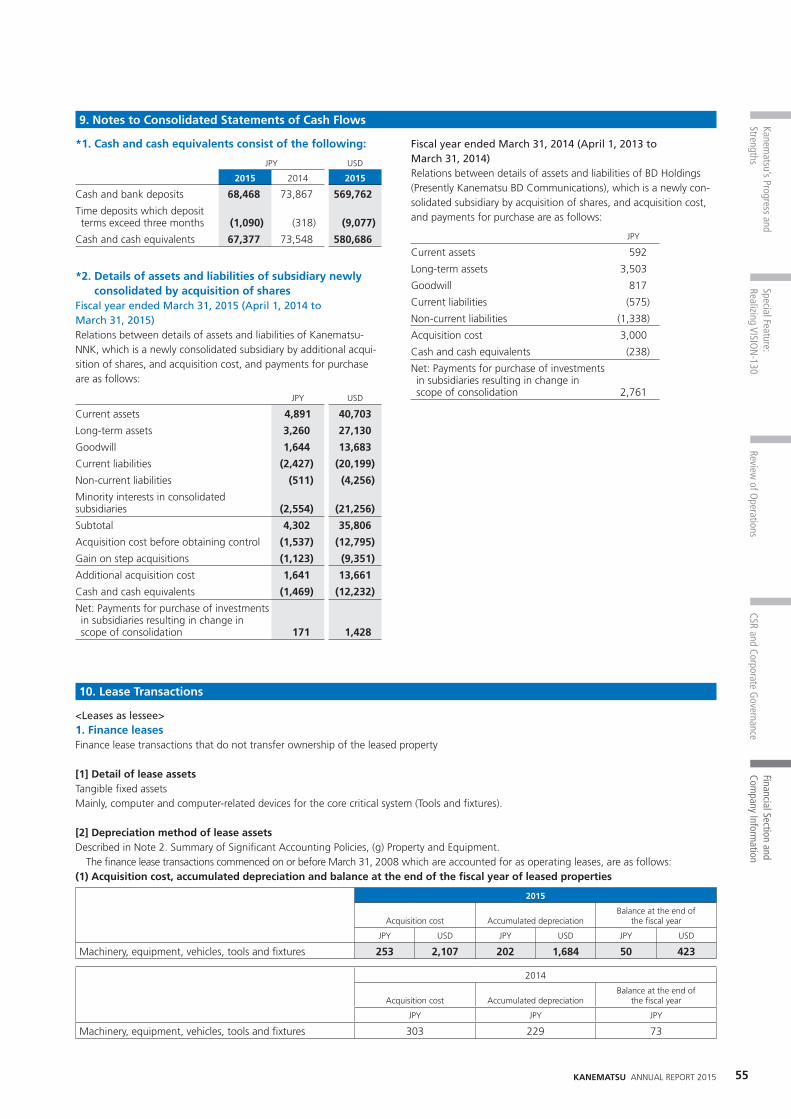
9. Notes to Consolidated Statements of Cash Flows
*1. Cash and cash equivalents consist of the following:
JPY USD
2015 2014 2015
Cash and bank deposits 68,468 73,867 569,762
Time deposits which deposit terms exceed three months (1,090) (318) (9,077)
Cash and cash equivalents 67,377 73,548 580,686
*2. Details of assets and liabilities of subsidiary newly consolidated by acquisition of shares
Fiscal year ended March 31, 2015 (April 1, 2014 to March 31, 2015)Relations between details of assets and liabilities of Kanematsu-NNK, which is a newly consolidated subsidiary by additional acqui-sition of shares, and acquisition cost, and payments for purchase are as follows:
JPY USD
Current assets 4,891 40,703
Long-term assets 3,260 27,130
Goodwill 1,644 13,683
Current liabilities (2,427) (20,199)
Non-current liabilities (511) (4,256)
Minority interests in consolidated subsidiaries (2,554) (21,256)
Subtotal 4,302 35,806
Acquisition cost before obtaining control (1,537) (12,795)
Gain on step acquisitions (1,123) (9,351)
Additional acquisition cost 1,641 13,661
Cash and cash equivalents (1,469) (12,232)
Net: Payments for purchase of investments in subsidiaries resulting in change in scope of consolidation 171 1,428
Fiscal year ended March 31, 2014 (April 1, 2013 to March 31, 2014)Relations between details of assets and liabilities of BD Holdings (Presently Kanematsu BD Communications), which is a newly con-solidated subsidiary by acquisition of shares, and acquisition cost, and payments for purchase are as follows:
JPY
Current assets 592
Long-term assets 3,503
Goodwill 817
Current liabilities (575)
Non-current liabilities (1,338)
Acquisition cost 3,000
Cash and cash equivalents (238)
Net: Payments for purchase of investments in subsidiaries resulting in change in scope of consolidation 2,761
10. Lease Transactions
<Leases as lessee>1. Finance leasesFinance lease transactions that do not transfer ownership of the leased property
[1] Detail of lease assetsTangible fi xed assetsMainly, computer and computer-related devices for the core critical system (Tools and fi xtures).
[2] Depreciation method of lease assetsDescribed in Note 2. Summary of Signifi cant Accounting Policies, (g) Property and Equipment. The fi nance lease transactions commenced on or before March 31, 2008 which are accounted for as operating leases, are as follows:(1) Acquisition cost, accumulated depreciation and balance at the end of the fi scal year of leased properties
2015
Acquisition cost Accumulated depreciationBalance at the end of
the fi scal year
JPY USD JPY USD JPY USD
Machinery, equipment, vehicles, tools and fi xtures 253 2,107 202 1,684 50 423
2014
Acquisition cost Accumulated depreciationBalance at the end of
the fi scal year
JPY JPY JPY
Machinery, equipment, vehicles, tools and fi xtures 303 229 73
55KANEMATSU ANNUAL REPORT 2015
Kanematsu’s Progress and
StrengthsSpecial Feature: Realizing VISIO
N-130
Review of O
perationsCSR and Corporate G
overnanceFinancial Section and Com
pany Information

(2) Future minimum lease payments outstanding at the balance sheet date, etc.
Future minimum lease payments outstanding at the balance sheet date
Future minimum lease payments outstanding at the balance sheet date
2015 2014
JPY USD JPY
Due within one year 22 189 27
Due after one year 65 543 87
Total 87 731 115
(3) Payments to lessors, depreciation and interest expenses
2015 2014
JPY USD JPY
Payments to lessors 23 193 32
Depreciation 22 191 32
Interest expenses 3 30 4
(4) Computation of depreciationDepreciation is computed using the straight-line method over the lease term assuming a residual value of zero.
(5) Computation of interest expensesThe excess amount of the sum of minimum lease payment over the acquisition cost is regarded as accumulated interest expenses, and is allocated to each period based on the interest method.
(Impairment loss)No impairment loss is recorded nor allocated to leased assets.
2. Operating leasesFuture lease payments outstanding at the balance sheet date
2015 2014
JPY USD JPY
Due within one year 10 91 13
Due after one year 31 259 39
Total 42 351 53
<Leases as lessor>1. Finance leases[1] Detail of the lease investment assetsCurrent assets
2015 2014
JPY USD JPY
Lease payments receivables 251 2,096 577
Interest income (4) (37) (11)
Lease investment assets 247 2,059 566
[2] Future lease receivables and lease investment assets outstanding at the balance sheet dateCurrent assets
2015
Due within one yearOver one year and within two years
Over two years and within three years
Over three years and within four years
Over four years and within fi ve years Over fi ve years
JPY USD JPY USD JPY USD JPY USD JPY USD JPY USD
Lease receivables 1 14 1 14 1 14 1 14 1 14 4 38
Lease investment assets 190 1,588 43 362 4 37 4 36 4 36 4 36
2014
Due within one yearOver one year and within two years
Over two years and within three years
Over three years and within four years
Over four years and within fi ve years Over fi ve years
JPY JPY JPY JPY JPY JPY
Lease receivables 2 2 2 2 2 6
Lease investment assets 328 189 42 4 4 8
11. Financial Instruments
1. Summary of fi nancial instruments(1) Policies of fi nancial instruments:The Companies design cash-fl ow plans to carry out operations, which are buying and selling of merchandise, investment and lend-ing. The Companies’ fund raising activities are mainly borrowings from banks and insurance companies. The Companies manage temporary surplus funds by funding highly secured fi nancial assets and also use derivative transactions for minimizing fi nancial risks.
(2) Nature and risks of fi nancial instruments:Notes and accounts receivable are exposed to credit risks of cus-tomers. In addition, receivables denominated in foreign currency are also exposed to risk of exchange rate fl uctuation due to the global business operations. The Companies have investments in securities in order to main-tain relationships with their customers and suppliers. Short-term investments and investments in securities are exposed to price
risks. The Companies also issue loans to certain customers and suppliers. Maturity dates of notes and accounts payable and import bills payable are mainly within one year. Foreign currency liabilities are exposed to risk of exchange rate fl uctuation. The longest maturity date of borrowings from banks and insur-ance companies is within seven years from the fi scal year-end. Certain borrowings are exposed to interest rate risk.The Companies utilize derivative transactions such as foreign exchange contracts to avert currency risk, interest rate swaps to avert interest rate risk, commodity future contracts to avert com-modity price risk. Hedging instruments, hedged items, hedging policy and method of evaluating the effectiveness of hedging activities are described in Note 2. Summary of Signifi cant Accounting Policies, (l) Hedge Accounting.
56 KANEMATSU ANNUAL REPORT 2015

(3) Financial risk management policies:[1] Credit risk managementThe Company employs its own credit scoring model based on cus-tomers’ fi nancial statements and other information. The Company determines the credit limit for customers based on their credit scor-ing and control credit risk by managing customer’s balances against these limits. To reduce credit risks, the Company regularly monitors the collectability of and age of receivables to take preser-vation measures. Since derivative transactions are executed with highly rated banks, the Company reviews the limit of volume of derivative transactions according to the internal rule.
[2] Market risk managementThe Companies utilize foreign exchange contracts for foreign cur-rency assets and liabilities or forecasted foreign currency transac-tions to avert currency risk. The Companies also utilize interest rate swaps to avert interest rate risk. For short-term investments and investments in securities, the Companies periodically examine fair values and the fi nancial condi-tions of the issuers and regularly revise the portfolio. With respect to derivative transactions, each business division undertakes transactions in accordance with internal rules deter-mined in the management meeting at the beginning of the fi scal year based on rule and operating policy for authorization of trans-action and limitation. Derivative transactions are recorded and the balances are managed by the Finance Department, Accounting Department and Business Accounting Department and actual results of transactions are reported monthly to management.
Certain of the Company’s consolidated subsidiaries utilize deriva-tive transactions in accordance with their own internal rules, which are prepared based on the Company’s risk management policies.
[3] Liquidity risk managementThe Finance Department performs cash management and main-tains the level of cash and bank deposits balance by preparing and revising cash-fl ow-plan to suit current fi nancial situation.
(4) Additional information on fair value measurements:Fair value measurements are based on market prices or on rational assumptions when market prices are not available. The fair values which are measured based on rational assumptions are affected by variable factors and might be changed when different assumption is applied. The notional amount of contracts described in Note 13. Derivatives do not directly indicate the market risks.
2. Fair value of fi nancial instrumentsA summary of book value and fair value of fi nancial instruments, and difference between them is disclosed in the following table. The fi nan-cial instruments for which the Company had diffi culty in estimating fair value are not included in the following table (See Note 2).In this table below,• Amounts in parentheses represent liabilities. • Notes and accounts receivable, long-term loans receivable and
doubtful accounts are offset by each allowance for doubtful accounts.
• Derivative assets and liabilities are disclosed on a net basis.
Fiscal year ended March 31, 2015
Book value Fair value Difference
JPY USD JPY USD JPY USD
(1) Cash and bank deposits 68,468 569,762 68,468 569,762 — —
(2) Notes and accounts receivable 180,319 1,500,533
Allowance for doubtful accounts (158) (1,321)
180,160 1,499,212 180,160 1,499,212 — —
(3) Short-term investments 3 33 3 33 (0) (0)
(4) Short-term loans receivable 297 2,472 297 2,472 — —
(5) Investments in securities 15,650 130,239 16,071 133,742 420 3,503
(6) Long-term loans receivable 2,134 17,765
Allowance for doubtful accounts (1,733) (14,429)
400 3,336 400 3,336 — —
(7) Doubtful accounts 765 6,373
Allowance for doubtful accounts (751) (6,256)
14 117 14 117 — —
Total assets 264,995 2,205,171 265,416 2,208,673 420 3,503
(8) Notes and accounts payable (116,567) (970,019) (116,567) (970,019) — —
(9) Import bills payable (32,530) (270,705) (32,530) (270,705) — —
(10) Short-term borrowings (61,688) (513,344) (61,688) (513,344) — —
(11) Accrued income taxes (2,492) (20,742) (2,492) (20,742) — —
(12) Long-term borrowings (74,426) (619,344) (74,636) (621,095) (210) (1,750)
Total liabilities (287,705) (2,394,154) (287,915) (2,395,904) (210) (1,750)
Derivatives 2,407 20,035 2,407 20,035 — —
57KANEMATSU ANNUAL REPORT 2015
Kanematsu’s Progress and
StrengthsSpecial Feature: Realizing VISIO
N-130
Review of O
perationsCSR and Corporate G
overnanceFinancial Section and Com
pany Information

Fiscal year ended March 31, 2014
Book value Fair value Difference
JPY JPY JPY
(1) Cash and bank deposits 73,867 73,867 —
(2) Notes and accounts receivable 178,984
Allowance for doubtful accounts (149)
178,835 178,835 —
(3) Short-term investments 16 16 (0)
(4) Short-term loans receivable 825 825 —
(5) Investments in securities 11,777 12,682 904
(6) Long-term loans receivable 1,798
Allowance for doubtful accounts (1,653)
144 144 —
(7) Doubtful accounts 902
Allowance for doubtful accounts (878)
24 24 —
Total assets 265,490 266,395 904
(8) Notes and accounts payable (115,210) (115,210) —
(9) Import bills payable (27,610) (27,610) —
(10) Short-term borrowings (80,792) (80,792) —
(11) Accrued income taxes (1,951) (1,951) —
(12) Long-term borrowings (61,113) (61,222) (108)
Total liabilities (286,678) (286,787) (108)
Derivatives 497 497 —(Notes) 1. Fair value measurements of fi nancial instruments and investment securities and derivative transaction
Assets(1) Cash and bank deposits, (2) Notes and accounts receivable and (4) Short-term loans receivable The carrying amounts are used as the fair values since these instruments are short-term maturities and the fair values approximate their carrying amount.(3) Short-term investments and (5) Investments in securities Fair value of marketable shares is estimated using quoted market price. Fair value of bonds is estimated using quoted market price or quoted price by fi nancial institutions.
Further information about investments in securities is described in Note 12. Short-term Investments and Investments in Securities.(6) Long-term loans receivable Fair value of long-term loans receivable with variable interest rates is thought to approximate the carrying amount and is thus stated at that carrying amount. Fair value of long term
loans corresponding to doubtful accounts is stated at the balances after deducting an allowance for doubtful accounts. Because the Companies provide an allowance for doubtful accounts based on estimates of collectability, fair value approximates the balances after deducting an allowance for doubtful accounts.
(7) Doubtful accounts Fair value of net doubtful accounts (offsetting doubtful accounts against allowance) approximates the carrying amount because the Companies provide an allowance for
doubtful accounts based on estimates of collectability by utilizing securities, guarantees and insurance or discounted cash fl ow analysis.
Liabilities(8) Notes and accounts payable, (9) Import bills payable, (10) Short-term borrowings and (11) Accrued income taxes Fair value of these instruments approximates the book value because of their short-term maturities.(12) Long-term borrowings Fair value of long-term borrowings is estimated based on discounted cash fl ow analysis, using assumed rates currently available for similar types of borrowings with similar
term and remaining maturity. Hedge accounting is applied to certain long-term borrowings with variable interest rates. The amounts received or paid under the interest rate swap agreements are added to or deducted from the interest on the hedged long-term borrowings when paid. Fair value of long-term borrowings in which these interest rate swaps are embedded is also estimated based on discounted cash fl ow analysis, using assumed rates currently available for similar types of borrowings with similar term and remaining maturity.
DerivativesDescribed in Note 13. Derivatives.
58 KANEMATSU ANNUAL REPORT 2015
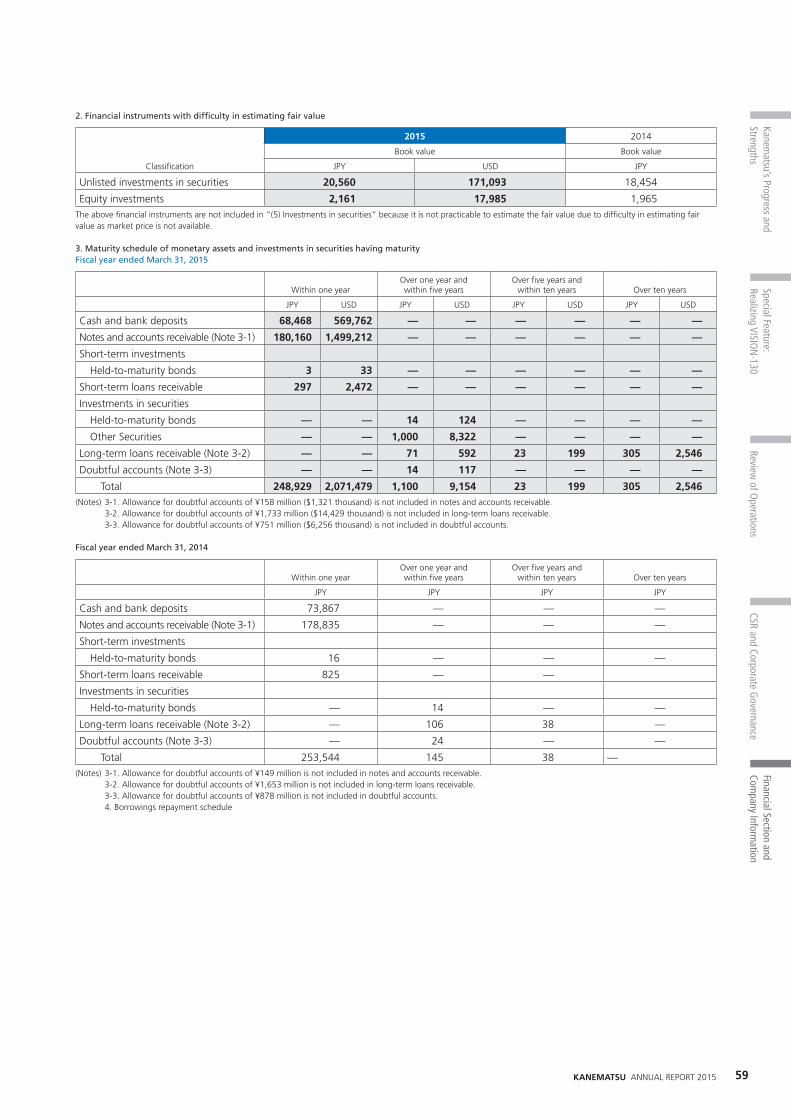
2. Financial instruments with diffi culty in estimating fair value
Classifi cation
2015 2014
Book value Book value
JPY USD JPY
Unlisted investments in securities 20,560 171,093 18,454
Equity investments 2,161 17,985 1,965The above fi nancial instruments are not included in “(5) Investments in securities” because it is not practicable to estimate the fair value due to diffi culty in estimating fair value as market price is not available.
3. Maturity schedule of monetary assets and investments in securities having maturity Fiscal year ended March 31, 2015
Within one yearOver one year and within fi ve years
Over fi ve years and within ten years Over ten years
JPY USD JPY USD JPY USD JPY USD
Cash and bank deposits 68,468 569,762 — — — — — —
Notes and accounts receivable (Note 3-1) 180,160 1,499,212 — — — — — —
Short-term investments
Held-to-maturity bonds 3 33 — — — — — —
Short-term loans receivable 297 2,472 — — — — — —
Investments in securities
Held-to-maturity bonds — — 14 124 — — — —
Other Securities — — 1,000 8,322 — — — —
Long-term loans receivable (Note 3-2) — — 71 592 23 199 305 2,546
Doubtful accounts (Note 3-3) — — 14 117 — — — —
Total 248,929 2,071,479 1,100 9,154 23 199 305 2,546(Notes) 3-1. Allowance for doubtful accounts of ¥158 million ($1,321 thousand) is not included in notes and accounts receivable. 3-2. Allowance for doubtful accounts of ¥1,733 million ($14,429 thousand) is not included in long-term loans receivable. 3-3. Allowance for doubtful accounts of ¥751 million ($6,256 thousand) is not included in doubtful accounts.
Fiscal year ended March 31, 2014
Within one yearOver one year and within fi ve years
Over fi ve years and within ten years Over ten years
JPY JPY JPY JPY
Cash and bank deposits 73,867 — — —
Notes and accounts receivable (Note 3-1) 178,835 — — —
Short-term investments
Held-to-maturity bonds 16 — — —
Short-term loans receivable 825 — —
Investments in securities
Held-to-maturity bonds — 14 — —
Long-term loans receivable (Note 3-2) — 106 38 —
Doubtful accounts (Note 3-3) — 24 — —
Total 253,544 145 38 —(Notes) 3-1. Allowance for doubtful accounts of ¥149 million is not included in notes and accounts receivable. 3-2. Allowance for doubtful accounts of ¥1,653 million is not included in long-term loans receivable. 3-3. Allowance for doubtful accounts of ¥878 million is not included in doubtful accounts. 4. Borrowings repayment schedule
59KANEMATSU ANNUAL REPORT 2015
Kanematsu’s Progress and
StrengthsSpecial Feature: Realizing VISIO
N-130
Review of O
perationsCSR and Corporate G
overnanceFinancial Section and Com
pany Information

Fiscal year ended March 31, 2015
Within one yearOver one year and within two years
Over two years and within three years
Over three years and within four years
Over four years and within fi ve years Over fi ve years
JPY USD JPY USD JPY USD JPY USD JPY USD JPY USD
Short-term borrowings 61,688 513,344 — — — — — — — — — —
Long-term borrowings — — 27,277 226,989 21,899 182,235 4,580 38,120 11,253 93,645 9,416 78,356
Total 61,688 513,344 27,277 226,989 21,899 182,235 4,580 38,120 11,253 93,645 9,416 78,356
Fiscal year ended March 31, 2014
Within one yearOver one year and within two years
Over two years and within three years
Over three years and within four years
Over four years and within fi ve years Over fi ve years
JPY JPY JPY JPY JPY JPY
Short-term borrowings 80,792 — — — — —
Long-term borrowings — 20,922 25,137 6,864 4,007 4,182
Total 80,792 20,922 25,137 6,864 4,007 4,182
12. Short-term Investments and Investments in Securities
1. “Held to maturity debt securities” with fair valueFiscal year ended March 31, 2015 (April 1, 2014 to March 31, 2015)
Category
Balance sheet amount Fair value Difference
JPY USD JPY USD JPY USD
Securities with market value exceeding their book value
Government bonds14 124 14 124 0 0
Securities with market value not exceeding their book value
Government bonds3 33 3 33 (0) (0)
Total 18 157 18 157 0 0
Fiscal year ended March 31, 2014 (April 1, 2013 to March 31, 2014)
Category
Balance sheet amount Fair value Difference
JPY JPY JPY
Securities with market value not exceeding their book value
Government bonds31 31 (0)
2. “Other securities” with fair valueFiscal year ended March 31, 2015 (April 1, 2014 to March 31, 2015)
Category
Balance sheet amount Acquisition cost Difference
JPY USD JPY USD JPY USD
Securities with book value exceeding their acquisition cost
(1) Equity securities 13,262 110,361 7,379 61,408 5,882 48,953
(2) Corporate bonds — — — — — —
Subtotal 13,262 110,361 7,379 61,408 5,882 48,953
Securities with book value not exceeding their acquisition cost
(1) Equity securities 79 660 108 900 (28) (240)
(2) Corporate bonds 1,000 8,322 1,000 8,322 — —
Subtotal 1,079 8,981 1,108 9,221 (28) (240)
Total 14,341 119,342 8,487 70,629 5,853 48,713(Note) Unlisted investments in securities (book value of ¥16,883 million ($140,497 thousand)) and equity investments (book value of ¥1,591 million ($13,245 thousand))
are not included in “Other securities” above because they are not practicable to estimate the fair value due to diffi culty in estimating fair value as market price is not available.
60 KANEMATSU ANNUAL REPORT 2015

Fiscal year ended March 31, 2014 (April 1, 2013 to March 31, 2014)
Category
Balance sheet amount Acquisition cost Difference
JPY JPY JPY
Securities with book value exceeding their acquisition cost
Equity securities8,729 5,941 2,788
Securities with book value not exceeding their acquisition cost
Equity securities290 336 (46)
Total 9,020 6,278 2,741(Note) Unlisted investments in securities (book value of ¥15,890 million) and equity investments (book value of ¥1,513 million) are not included in “Other securities” above
because they are not practicable to estimate the fair value due to diffi culty in estimating fair value as market price is not available.
3. Sold “Other securities”Fiscal year ended March 31, 2015 (April 1, 2014 to March 31, 2015)
Category
Sales proceeds Gains on sales Losses on sales
JPY USD JPY USD JPY USD
Equity securities 20 172 10 86 0 (0)
Fiscal year ended March 31, 2014 (April 1, 2013 to March 31, 2014)
Category
Sales proceeds Gains on sales Losses on sales
JPY JPY JPY
Equity securities 580 230 12
4. Securities on which impairment loss was recognizedThe total impairment loss amount recognized of investments in securities is ¥29 million ($249 thousand) in the current fi scal year (from April 1, 2014 to March 31, 2015), and ¥55 million in the previous fi scal year (from April 1, 2013 to March 31, 2014). For recognition of impairment loss, securities which fair value declines 50% or more against their carrying book value are subject to deval-uation. For securities that decline 30% or more in fair value, devaluation losses are recognized after considering likelihood of future price recovery or fi nancial position. For those determinations, fair value is primarily based on average of daily market price for one-month before the balance sheet date.
13. Derivatives
1. Derivative transactions to which hedge accounting is not applied(1) Currencies:Fiscal year ended March 31, 2015
Classifi cation Transaction type
Notional amount of contracts
Amount of over-one-year contracts Fair value Unrealized gain or (loss)
JPY USD JPY USD JPY USD JPY USD
Off market transactions
Foreign exchange contracts
Selling
U.S. dollar (USD) 6,335 52,725 — — (119) (990) (119) (990)
Euro (EUR) 333 2,773 — — 6 50 6 50
Australian dollar (AUD) 133 1,110 — — 4 33 4 33
Other currencies 126 1,056 — — (10) (90) (10) (90)
Subtotal 6,929 57,665 — — (119) (996) (119) (996)
Buying
U.S. dollar (USD) 28,446 236,715 — — 1,550 12,902 1,550 12,902
Euro (EUR) 462 3,848 — — (12) (104) (12) (104)
Pound sterling (GBP) 2 24 — — 0 0 0 0
Other currencies 109 912 — — 0 2 0 2
Subtotal 29,021 241,500 — — 1,538 12,801 1,538 12,801
Total — — — — — — 1,418 11,805(Note) Basis of fair value calculation
Fair value is calculated based on the quoted price by fi nancial institutions.
61KANEMATSU ANNUAL REPORT 2015
Kanematsu’s Progress and
StrengthsSpecial Feature: Realizing VISIO
N-130
Review of O
perationsCSR and Corporate G
overnanceFinancial Section and Com
pany Information

Fiscal year ended March 31, 2014
Classifi cation Transaction type
Notional amount of contracts
Amount of over-one-year contracts Fair value Unrealized gain or (loss)
JPY JPY JPY JPY
Off market transactions
Foreign exchange contracts
Selling
U.S. dollar (USD) 10,240 — 51 51
Euro (EUR) 497 — (4) (4)
Australian dollar (AUD) 116 — (1) (1)
Other currencies 79 — 4 4
Subtotal 10,933 — 49 49
Buying
U.S. dollar (USD) 28,127 — 505 505
Euro (EUR) 190 — 9 9
Australian dollar (AUD) 36 — 0 0
Pound sterling (GBP) 6 — 0 0
Other currencies 105 — (4) (4)
Subtotal 28,465 — 511 511
Currency option contracts
Selling
Call
U.S. dollar (USD) 14 — 0 0
Subtotal 14 — 0 0
Buying
Put
U.S. dollar (USD) 14 — (0) (0)
Subtotal 14 — (0) (0)
Total — — — 560(Note) Basis of fair value calculation
Fair value is calculated based on the quoted price by fi nancial institutions.
(2) Interest rate:Fiscal year ended March 31, 2015
Classifi cation Transaction type
Notional amount of contracts
Amount of over-one-year contracts Fair value Unrealized gain or (loss)
JPY USD JPY USD JPY USD JPY USD
Off market transactions
Interest rate swap contracts
Pay-fi xed, receive-variable interest rate swap 2,000 16,643 — — (9) (79) (9) (79)
Total 2,000 16,643 — — (9) (79) (9) (79)(Note) Basis of fair value calculation
Fair value is calculated based on the quoted price by fi nancial institutions.
Fiscal year ended March 31, 2014
Classifi cation Transaction type
Notional amount of contracts
Amount of over-one-year contracts Fair value Unrealized gain or (loss)
JPY JPY JPY JPY
Off market transactions
Interest rate swap contracts
Pay-fi xed, receive-variable interest rate swap
15,000 13,000 (375) (375)
Total 15,000 13,000 (375) (375)(Note) Basis of fair value calculation
Fair value is calculated based on the quoted price by fi nancial institutions.
62 KANEMATSU ANNUAL REPORT 2015

(3) Commodities:Fiscal year ended March 31, 2015
Classifi cation Transaction type
Notional amount of contracts
Amount of over-one-year contracts Fair value Unrealized gain or (loss)
JPY USD JPY USD JPY USD JPY USD
Market transactions
Commodity future contracts
Foods & Foodstuff
Selling 1,611 13,409 12 101 54 451 54 451
Buying 1,947 16,207 49 412 (39) (330) (39) (330)
Energy
Selling 1,860 15,481 — — 91 764 91 764
Buying 1,051 8,750 — — (16) (136) (16) (136)
Total — — — — — — 89 749(Note) Basis of fair value calculation
Fair value is calculated based on market closing price at end of the fi scal year.
Fiscal year ended March 31, 2014
Classifi cation Transaction type
Notional amount of contracts
Amount of over-one-year contracts Fair value Unrealized gain or (loss)
JPY JPY JPY JPY
Market transactions
Commodity future contracts
Foods & Foodstuff
Selling 5,364 11 (175) (175)
Buying 3,989 — 147 147
Energy
Selling 643 — (4) (4)
Buying 739 — 3 3
Total — — — (29)(Note) Basis of fair value calculation
Fair value is calculated based on market closing price at end of the fi scal year.
63KANEMATSU ANNUAL REPORT 2015
Kanematsu’s Progress and
StrengthsSpecial Feature: Realizing VISIO
N-130
Review of O
perationsCSR and Corporate G
overnanceFinancial Section and Com
pany Information

2. Derivative transactions to which hedge accounting is applied(1) Currencies:Fiscal year ended March 31, 2015
Hedge accounting
method Transaction type Main hedged items
Notional amount of contracts
Amount of over-one-year contracts Fair value
JPY USD JPY USD JPY USD
Principle hedge Accounting
Foreign exchange contracts
Forecasted foreign currency transactions
Selling
U.S. dollar (USD) 2,012 16,749 — — (198) (1,650)
Euro (EUR) 332 2,770 — — 24 206
Pound sterling (GBP) 22 189 — — 0 0
Australian dollar (AUD) 12 104 — — (0) (2)
Other currencies 150 1,255 — — (8) (73)
Subtotal 2,531 21,068 — — (182) (1,519)
Buying
Forecasted foreign currency transactions
U.S. dollar (USD) 26,661 221,866 901 7,501 1,195 9,945
Australian dollar (AUD) 1,093 9,102 — — (32) (267)
Euro (EUR) 811 6,750 — — (30) (257)
Pound sterling (GBP) 35 298 — — (0) (3)
Canadian dollar (CAD) 28 240 — — (0) (3)
Other currencies 348 2,897 — — (2) (21)
Subtotal 28,979 241,152 901 7,501 1,128 9,394
Specifi c matching criteria
Selling
Accounts receivable U.S. dollar (USD) 331 2,759 — — — —
Euro (EUR) 137 1,146 — — — —
Other currencies 17 146 — — — —
Subtotal 486 4,050 — — — —
Buying
Accounts payable
Euro (EUR) 83 697 — — — —
U.S. dollar (USD) 44 368 — — — —
Pound sterling (GBP) 1 9 — — — —
Other currencies 308 2,565 — — — —
Subtotal 437 3,639 — — — —(Note) Basis of fair value calculation
Fair value is calculated based on quoted price by fi nancial institutions for principle hedge accounting. For certain contracts designated as hedging instruments that meet specifi c matching criteria, hedged assets or liabilities are measured by contract rate. Fair value of these contracts is included in fair value of the corresponding assets or liabilities.
64 KANEMATSU ANNUAL REPORT 2015

Fiscal year ended March 31, 2014
Hedge accounting
method Transaction type Main hedged items
Notional amount of contracts
Amount of over-one-year contracts Fair value
JPY JPY JPY
Principle hedge Accounting
Foreign exchange contracts
Forecasted foreign currency transactions
Selling
U.S. dollar (USD) 3,441 9 (29)
Euro (EUR) 509 — (7)
Pound sterling (GBP) 60 — (0)
Australian dollar (AUD) 44 — (1)
Other currencies 149 — (4)
Subtotal 4,205 9 (45)
Buying
Forecasted foreign currency transactions
U.S. dollar (USD) 21,484 1,468 239
Euro (EUR) 927 — 128
Australian dollar (AUD) 323 — 24
Canadian dollar (CAD) 28 — (0)
Pound sterling (GBP) 3 — 0
Other currencies 432 — 1
Subtotal 23,199 1,468 393
Specifi c matching criteria
Selling
Accounts receivable U.S. dollar (USD) 129 — —
Euro (EUR) 3 — —
Other currencies 44 — —
Subtotal 176 — —
Buying
Accounts payable U.S. dollar (USD) 65 — —
Euro (EUR) 33 — —
Other currencies 19 — —
Subtotal 117 — —(Note) Basis of fair value calculation
Fair value is calculated based on quoted price by fi nancial institutions for principle hedge accounting. For certain contracts designated as hedging instruments that meet specifi c matching criteria, hedged assets or liabilities are measured by contract rate. Fair value of these contracts is included in fair value of the corresponding assets or liabilities.
(2) Interest rate:Fiscal year ended March 31, 2015
Hedge accounting
method Transaction type Main hedged items
Notional amount of contracts
Amount of over-one-year contracts Fair value
JPY USD JPY USD JPY USD
Specifi c matchingcriteria
Interest rate swap contracts Pay-fi xed, receive-variable
interest rate swap
Long-term borrowings 26,454 220,145 24,276 202,014 — —
(Note) Basis of fair value calculationFor certain interest rate contracts designated as hedging instruments that meet specifi c matching criteria, amounts received or paid under the interest rate swap agreements are added to or deducted from the interest on the hedged borrowings when paid. Fair value of these contracts is included in fair value of the corresponding borrowings.
Fiscal year ended March 31, 2014
Hedge accounting
method Transaction type Main hedged items
Notional amount of contracts
Amount of over-one-year contracts Fair value
JPY JPY JPY
Specifi c matchingcriteria
Interest rate swap contracts Pay-fi xed, receive-variable
interest rate swap
Long-term borrowings 28,531 9,778 —
(Note) Basis of fair value calculationFor certain interest rate contracts designated as hedging instruments that meet specifi c matching criteria, amounts received or paid under the interest rate swap agreements are added to or deducted from the interest on the hedged borrowings when paid. Fair value of these contracts is included in fair value of the corresponding borrowings.
65KANEMATSU ANNUAL REPORT 2015
Kanematsu’s Progress and
StrengthsSpecial Feature: Realizing VISIO
N-130
Review of O
perationsCSR and Corporate G
overnanceFinancial Section and Com
pany Information

(3) Commodities:Fiscal year ended March 31, 2015
Hedge accounting
method Transaction type Main hedged items
Notional amount of contracts
Amount of over-one-year contracts Fair value
JPY USD JPY USD JPY USD
Principle hedge accounting
Commodity future contractsForecasted transactions on commodity trading
Foods & Foodstuff
Selling 169 1,409 — — 16 140
Buying 223 1,857 — — (54) (455)(Note) Basis of fair value calculation
Fair value is calculated based on market closing price at end of the fi scal year.
Fiscal year ended March 31, 2014
Hedge accounting
method Transaction type Main hedged items
Notional amount of contracts
Amount of over-one-year contracts Fair value
JPY JPY JPY
Principle hedge accounting
Commodity future contractsForecasted transactions on commodity trading
Foods & Foodstuff
Selling 618 — (66)
Buying 327 — 59(Note) Basis of fair value calculation
Fair value is calculated based on market closing price at end of the fi scal year.
14. Retirement Benefi ts
1. Summary of pension plansThe Company and certain of its consolidated subsidiaries have established defi ned-benefi t employees’ pension plans, retirement lump sum plans, and other pension plans. Certain consolidated subsidiaries have defi ned contribution pension plans. In addition, some additional retirements benefi ts are paid under certain condi-tions when employees retire. Simplifi ed method is applied to certain defi ned-benefi t employ-ees’ pension plans and retirement lump sum plans in order to cal-culate net defi ned benefi t liability and retirement benefi t expenses.
2. Defi ned benefi t plans(1) Reconciliation of beginning and ending balances of
retirement benefi t obligationsJPY USD
2015 2014 2015
Beginning balance of retirement benefi t obligations 14,811 14,013 123,252
Cumulative effects of changes in accounting policies 797 — 6,638
Restated balance 15,608 14,013 129,890
Service cost 920 851 7,661
Interest cost 143 242 1,196
Actuarial gains and losses (16) 409 (137)
Benefi t payments (1,466) (759) (12,205)
Transfers regarding a change in calculation from simplifi ed method to principle method 272 — 2,265
Other 65 54 542
Ending balance of retirement benefi t obligations 15,527 14,811 129,212
(2) Reconciliation of beginning and ending balances of plan assets
JPY USD
2015 2014 2015
Beginning balance of plan assets 12,449 11,562 103,601
Expected return on plan assets 257 237 2,145
Actuarial gains and losses 297 222 2,479
Employer contributions 913 1,084 7,603
Benefi t payments (1,195) (697) (9,947)
Other 33 40 279
Ending balance of plan assets 12,757 12,449 106,158
(3) Reconciliation of beginning and ending balances of net defi ned benefi t liability for the plans applying the simplifi ed method
JPY USD
2015 2014 2015
Beginning balance of net defi ned benefi t liability 2,269 2,228 18,885
Retirement benefi t expenses 326 266 2,719
Benefi t payments (206) (197) (1,717)
Contribution to plans (68) (28) (571)
Changes of scope of consolidation 118 — 989
Transfers regarding a change in calculation from simplifi ed method to principle method (272) — (2,265)
Ending balance of net defi ned benefi t liability 2,167 2,269 18,039
66 KANEMATSU ANNUAL REPORT 2015

(4) Reconciliation of ending balances of retirement benefi t obligations / plan assets and net defi ned benefi t liability / asset on consolidated balance sheet
JPY USD
2015 2014 2015
Retirement benefi t obligations of funded plan 14,802 14,284 123,177
Plan assets (13,422) (12,841) (111,695)
1,379 1,442 11,482
Retirement benefi t obligations of unfunded plan 3,558 3,188 29,611
Net of liability and asset on consolidated balance sheet 4,938 4,630 41,093
Net defi ned benefi t liability 5,137 4,630 42,751
Net defi ned benefi t assets (199) — (1,658)
Net of liability and asset on consolidated balance sheet 4,938 4,630 41,093
(5) Details of retirement benefi t expensesJPY USD
2015 2014 2015
Service cost 920 851 7,661
Interest cost 143 242 1,196
Expected return on plan assets (257) (237) (2,145)
Amortization of actuarial gains and losses (14) 268 (123)
Retirement benefi t expenses calculated with simplifi ed method 326 266 2,719
Other 71 — 598
Retirement benefi t expenses of defi ned benefi t plans 1,190 1,391 9,906
(6) Remeasurements of defi ned benefi t plansDetails of remeasurements of defi ned benefi t plans (before adjust-ing for tax effects) are as follows:
JPY USD
2015 2014 2015
Actuarial gains and losses (297) — (2,478)
Total (297) — (2,478)
(7) Accumulated remeasurements of defi ned benefi t plansDetails of accumulated remeasurements of defi ned benefi t plans (before adjusting for tax effects) are as follows:
JPY USD
2015 2014 2015
Unrecognized actuarial gains and losses 4 301 35
Total 4 301 35
(8) Plan assets[1] Major categories of plan assetsPercentages of the major categories for total of plan assets are as follows:
%
2015 2014
Debt securities 38.7 39.1
Equity securities 10.5 10.9
Life insurance company general accounts 43.5 43.2
Other 7.3 6.9
Total 100.0 100.0
[2] Method of setting expected long-term rates of returnCurrent and expected allocations of plan assets and long-term rates of return from variety of assets comprise plan assets are con-sidered to determine the expected long-term rates of return on plan assets.
(9) Assumptions used in actuarial valuationsPrincipal assumptions used in actuarial valuations (by weighted average) are as follows:
%
2015 2014
Discount rates 0.7 1.6
Expected long-term rates of return on plan assets 2.2 1.9
3. Defi ned contribution plansContributions charged for the defi ned contribution plans of the Company and its certain consolidated subsidiaries were ¥202 mil-lion ($1,685 thousand) in the current fi scal year, and ¥243 million in the previous fi scal year.
15. Stock Options
Fiscal year ended March 31, 2015 (April 1, 2014 to March 31, 2015)Not applicable.
Fiscal year ended March 31, 2014 (April 1, 2013 to March 31, 2014)Not applicable.
67KANEMATSU ANNUAL REPORT 2015
Kanematsu’s Progress and
StrengthsSpecial Feature: Realizing VISIO
N-130
Review of O
perationsCSR and Corporate G
overnanceFinancial Section and Com
pany Information

16. Deferred Taxes
1. Major components of deferred tax assets and deferred tax liabilities
JPY USD
2015 2014 2015
Deferred tax assets
Net defi ned benefi t liability 1,614 1,542 13,435
Allowance for doubtful accounts 3,747 4,140 31,182
Inventories 1,759 1,821 14,645
Impairment loss on fi xed assets 1,673 1,554 13,927
Investments in securities 2,403 2,632 20,005
Golf club memberships 447 480 3,724
Tax loss carried forward 9,264 13,358 77,098
Net gains (losses) on deferred hedges — 11 —
Other 3,593 3,522 29,905
Deferred tax assets subtotal 24,505 29,065 203,920
Valuation allowance (14,003) (15,058) (116,532)
Total deferred tax assets 10,501 14,006 87,388
Deferred tax liabilities
Retained earnings in subsidiaries (252) (258) (2,100)
Net gains (losses) on deferred hedges (275) — (2,291)
Net unrealized gains on securities (1,892) (956) (15,745)
Other (1,676) (1,719) (13,955)
Total deferred tax liabilities (4,096) (2,933) (34,091)
Net deferred tax assets 6,404 11,072 53,297(Note) Net deferred tax assets recorded in the consolidated balance sheets
JPY USD
2015 2014 2015
Current assets— deferred tax assets 3,250 2,660 27,053
Long-term assets— deferred tax assets 3,643 8,782 30,317
Current liabilities— deferred tax liabilities (1) (1) (10)
Non-current liabilities— deferred tax liabilities (488) (368) (4,063)
Net deferred tax assets 6,404 11,072 53,297
2. Major reconciliation items between the statutory effective tax rate and the effective income tax rate after the application of deferred tax accounting.
%
2015 2014
Statutory effective tax rate 35.6 38.0
(Reconciliation)
Permanent differences—additions such as entertainment expenses 2.1 1.9
Change in valuation allowance 0.8 (19.1)
Effect of tax rate differences 1.7 1.0
Tax reform 5.5 1.5
Other (7.3) 2.7
Effective income tax rate 38.3 26.0
3. Adjustment of deferred tax assets and liabilities in connection with changes in the rates of corporate income tax:
On March 31, 2015, “Partial Revision of Income Tax Act, etc.” (Act No.9 of 2015) and “Partial Revision of Local Tax Act, etc.” (Act No.2 of 2015 ) were enacted. Under these Acts, the reduction in the corporate tax rate will become effective from the fi scal year beginning on or after April 1, 2015. As a result of this change, the statutory effective tax rate being applied in the deferred tax calcu-lation reduced from 35.6% to 33.1% for the temporary differenc-es which will be deducted during the fi scal year beginning on April 1, 2015, and 32.3% for those which will be deducted during and after the fi scal year beginning on April 1, 2016. As a result, deferred tax assets (net of deferred tax liabilities) decreased by ¥569 million ($4,742 thousand), and deferred income tax, net unrealized gains on securities and net gains on deferred hedges increased by ¥785 million ($6,532 thousand), ¥194 million ($1,620 thousand) and ¥20 million ($170 thousand), respectively. In addition, utilization of tax loss carried forward is limited to 65% of taxable income in the fi scal year beginning on April 1, 2015 and 50% in the fi scal year beginning on April 1, 2017. Due to the change, deferred tax assets decreased by ¥489 million ($4,069 thou-sand) and deferred income tax increased by the same amount.
17. Business Combinations
Business combination by means of acquisition1. Outline of the business combination(1) Name of the acquired company: Kanematsu-NNK
Corporation (“KNN”)Content of business: Security equipment business, Geo-tech (Ground improvement) business, wood processing business and petroleum product business
(2) Purpose of the business combinationThe Company judged that through strengthening the capital rela-tionship between KNN and the Company, it would accelerate deci-sion-making and strategy execution and collaboration of security
camera business of KNN and Electronics & Device Division of the Company, thus the business combination would contribute to strengthening the business base further and enhancing the corpo-rate value of KNN and the Companies.
(3) Date of the business combinationDecember 24, 2014 (Date of the acquisition of shares )December 31, 2014 (Date regarded as date of the acquisition)
(4) Legal form of the business combinationAcquisition of shares for cash consideration (Tender offer)
68 KANEMATSU ANNUAL REPORT 2015

(5) Company name after the combinationKanematsu-NNK Corporation
(6) Percentage of the voting rightsPercentage of the voting rights before the acquisition 32.1 percentPercentage of the additional acquisition of the voting rights 18.9 percentPercentage of the voting rights after the acquisition 51.0 percent
(7) Basis for deciding the acquiring companyIt is because the Company acquired the shares of KNN for cash consideration.
2. Period of the performance of the acquired company in the consolidated fi nancial statements
The performance of the KNN from January 1, 2015 to March 31, 2015 is included in the consolidated fi nancial statements. The per-formance of the KNN from April 1, 2014 to December 31, 2014 is included in the consolidated statement of income through equity in earnings of affi liates.
3. Acquisition costs and those detailsConsideration for acquisition Fair value of shares of KNN granted before the date of the business combination ¥2,661 million ($22,149 thousand)
Fair value of shares of KNN granted at the date of the business combination ¥1,567 million ($13,042 thousand)
Other acquisition costs ¥74 million ($619 thousand)
Total costs ¥4,302 million ($35,809 thousand)
4. Gain on step acquisitions ¥1,123 million ($9,351 thousand)
5. Amount, cause and method and period of amortization of goodwill
(1) Amount of goodwill¥1,644 million ($13,683 thousand)
(2) Cause of goodwillThe excess of acquisition costs over the net of the assets and liabilities on the day of the business combination
(3) Method and period of amortization of goodwillStraight line method over 10 years
6. Assets and liabilities on the day of the business combinationJPY USD
Current assets 4,891 40,703
Long-term assets 3,260 27,130
Total assets 8,151 67,834
Current liabilities 2,427 20,199
Non-current liabilities 511 4,256
Total liabilities 2,938 24,455
Transaction under common control, etc.(Additional acquisition of shares by a subsidiary)1. Outline of the transaction(1) Name of the acquiring company: Kanematsu Electronics
Ltd. (“KEL”)Content of business: KEL designs and implements information sys-tems and provides operation and consulting services for businesses based on KEL’s expertise in information technologies. KEL retails, leases, maintains, develops IT system products and software, and also send loan engineers. Name of the acquired company: Nippon Offi ce Systems Ltd. (“NOS”, a consolidated subsidiary of KEL) Content of business: Information service business and System sales business
(2) Date of the business combinationMarch 26, 2015 (Date of the acquisition of shares)March 31, 2015 (Date regarded as date of the acquisition)
(3) Legal form of the business combinationAcquisition of shares from minority shareholders
(4) Company name after the acquisitionNippon Offi ce Systems Ltd.
(5) Other outlines of the transactionKEL additionally acquired the shares of NOS through tender offer in order to make NOS a wholly owned subsidiary.
2. Outline of accounting treatmentBased on the Accounting Standard for Business Combinations (ASBJ Statement No. 21, released December 26, 2008) and the Guidance on Accounting Standard for Business Combinations and Accounting Standard for Business Divestitures (ASBJ Guidance No. 10, released December 26, 2008), it was treated as a transaction with minority shareholders of transaction under common control, etc. 3. Items regarding additional acquisition of shares of
the subsidiary(1) Acquisition costs and those detailsCash paid for the acquisition ¥1,839 million ($15,306 thousand)Other acquisition costs ¥107 million ($892 thousand)
Total costs ¥1,946 million ($16,199 thousand)
(2) Amount of goodwill¥981 million ($8,171 thousand)
(3) Cause of goodwillDue to the difference between the additional acquisition costs of shares of the subsidiary and the amount of decreases in minority interests with the transaction.
(4) Method and period of amortization of goodwillStraight line method over 5 years
69KANEMATSU ANNUAL REPORT 2015
Kanematsu’s Progress and
StrengthsSpecial Feature: Realizing VISIO
N-130
Review of O
perationsCSR and Corporate G
overnanceFinancial Section and Com
pany Information
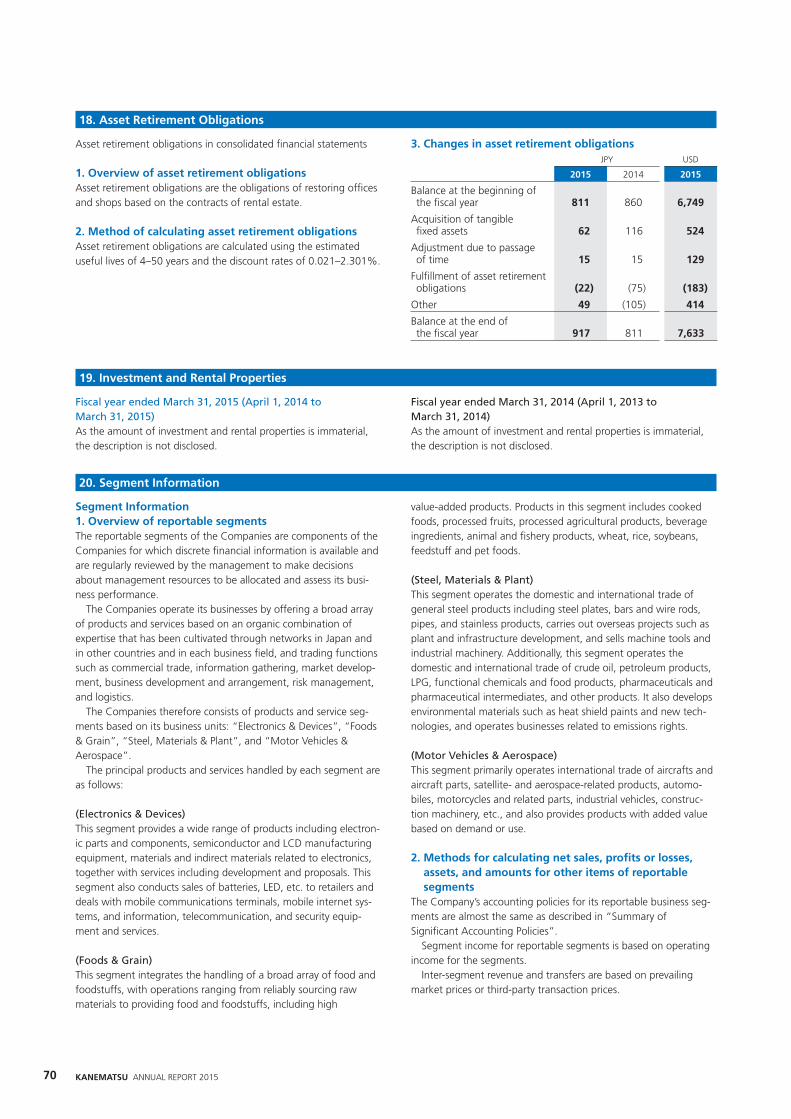
18. Asset Retirement Obligations
Asset retirement obligations in consolidated fi nancial statements
1. Overview of asset retirement obligationsAsset retirement obligations are the obligations of restoring offi ces and shops based on the contracts of rental estate.
2. Method of calculating asset retirement obligationsAsset retirement obligations are calculated using the estimated useful lives of 4–50 years and the discount rates of 0.021–2.301%.
3. Changes in asset retirement obligationsJPY USD
2015 2014 2015
Balance at the beginning of the fi scal year 811 860 6,749
Acquisition of tangible fi xed assets 62 116 524
Adjustment due to passage of time 15 15 129
Fulfi llment of asset retirement obligations (22) (75) (183)
Other 49 (105) 414
Balance at the end of the fi scal year 917 811 7,633
19. Investment and Rental Properties
Fiscal year ended March 31, 2015 (April 1, 2014 to March 31, 2015)As the amount of investment and rental properties is immaterial, the description is not disclosed.
Fiscal year ended March 31, 2014 (April 1, 2013 to March 31, 2014)As the amount of investment and rental properties is immaterial, the description is not disclosed.
20. Segment Information
Segment Information1. Overview of reportable segmentsThe reportable segments of the Companies are components of the Companies for which discrete fi nancial information is available and are regularly reviewed by the management to make decisions about management resources to be allocated and assess its busi-ness performance. The Companies operate its businesses by offering a broad array of products and services based on an organic combination of expertise that has been cultivated through networks in Japan and in other countries and in each business fi eld, and trading functions such as commercial trade, information gathering, market develop-ment, business development and arrangement, risk management, and logistics. The Companies therefore consists of products and service seg-ments based on its business units: “Electronics & Devices”, “Foods & Grain”, “Steel, Materials & Plant”, and “Motor Vehicles & Aerospace”. The principal products and services handled by each segment are as follows:
(Electronics & Devices)This segment provides a wide range of products including electron-ic parts and components, semiconductor and LCD manufacturing equipment, materials and indirect materials related to electronics, together with services including development and proposals. This segment also conducts sales of batteries, LED, etc. to retailers and deals with mobile communications terminals, mobile internet sys-tems, and information, telecommunication, and security equip-ment and services.
(Foods & Grain)This segment integrates the handling of a broad array of food and foodstuffs, with operations ranging from reliably sourcing raw materials to providing food and foodstuffs, including high
value-added products. Products in this segment includes cooked foods, processed fruits, processed agricultural products, beverage ingredients, animal and fi shery products, wheat, rice, soybeans, feedstuff and pet foods.
(Steel, Materials & Plant)This segment operates the domestic and international trade of general steel products including steel plates, bars and wire rods, pipes, and stainless products, carries out overseas projects such as plant and infrastructure development, and sells machine tools and industrial machinery. Additionally, this segment operates the domestic and international trade of crude oil, petroleum products, LPG, functional chemicals and food products, pharmaceuticals and pharmaceutical intermediates, and other products. It also develops environmental materials such as heat shield paints and new tech-nologies, and operates businesses related to emissions rights.
(Motor Vehicles & Aerospace)This segment primarily operates international trade of aircrafts and aircraft parts, satellite- and aerospace-related products, automo-biles, motorcycles and related parts, industrial vehicles, construc-tion machinery, etc., and also provides products with added value based on demand or use.
2. Methods for calculating net sales, profi ts or losses, assets, and amounts for other items of reportable segments
The Company’s accounting policies for its reportable business seg-ments are almost the same as described in “Summary of Signifi cant Accounting Policies”. Segment income for reportable segments is based on operating income for the segments. Inter-segment revenue and transfers are based on prevailing market prices or third-party transaction prices.
70 KANEMATSU ANNUAL REPORT 2015

3. Information on net sales, profi ts or losses, assets and other amounts of reportable segments Fiscal year ended March 31, 2015 (April 1, 2014 to March 31, 2015) (JPY)
Reportable segments
Other (Note 1) Total
Adjustment (Note 2)
Amount in consolidated statements
(Note 3)Electronics &
Devices Foods &
Grain
Steel, Materials &
Plant
Motor Vehicles & Aerospace Subtotal
Net sales
Customers 276,501 307,732 467,849 59,675 1,111,758 5,338 1,117,096 — 1,117,096
Inter-segment 353 5 111 0 471 59 530 (530) —
Total 276,854 307,738 467,960 59,675 1,112,229 5,397 1,117,627 (530) 1,117,096
Segment income 9,907 1,933 7,283 2,755 21,880 169 22,050 75 22,125
Segment assets 133,002 105,375 121,010 29,966 389,355 11,642 400,998 58,013 459,011
Other
Depreciation and amortization 1,257 577 912 422 3,170 79 3,250 (4) 3,245
Investments in equity method affi liates 2,146 837 50 300 3,335 1,910 5,246 174 5,420
Increases in tangible fi xed assets and intangible fi xed assets 1,704 1,018 1,610 906 5,240 61 5,302 732 6,035
Fiscal year ended March 31, 2015 (April 1, 2014 to March 31, 2015) (USD)
Reportable segments
Other (Note 1) Total
Adjustment (Note 2)
Amount in consolidated statements
(Note 3)Electronics &
Devices Foods &
Grain
Steel, Materials &
Plant
Motor Vehicles & Aerospace Subtotal
Net sales
Customers 2,300,917 2,560,808 3,893,228 496,592 9,251,545 44,422 9,295,967 — 9,295,967
Inter-segment 2,943 48 926 4 3,921 495 4,416 (4,416) —
Total 2,303,860 2,560,856 3,894,155 496,596 9,255,466 44,917 9,300,383 (4,416) 9,295,967
Segment income 82,445 16,092 60,612 22,933 182,083 1,414 183,497 625 184,122
Segment assets 1,106,788 876,890 1,006,993 249,367 3,240,039 96,885 3,336,923 482,759 3,819,682
Other
Depreciation and amortization 10,468 4,802 7,596 3,519 26,384 661 27,045 (40) 27,005
Investments in equity method affi liates 17,861 6,973 421 2,501 27,756 15,901 43,657 1,451 45,109
Increases in tangible fi xed assets and intangible fi xed assets 14,182 8,479 13,403 7,547 43,611 513 44,124 6,097 50,221
(Notes) 1. “Other” is a business segment that is not included in the reportable segments and includes the logistics and insurance service business and the Geo-tech business, etc.
2. Adjustments are as follows. (1) Adjustment for segment income of ¥75 million ($625 thousand) includes offset amount of goodwill of ¥62 million ($523 thousand) and inter-segment
elimination of 12 million ($102 thousand). (2) Adjustment for segment assets of ¥58,013 million ($482,759 thousand) includes inter-segment elimination of (¥8,530) million (($70,986) thousand) and
corporate assets of ¥66,543 million ($553,745 thousand) that are not allocated to any reportable segment. The corporate assets consist mainly of cash and bank deposits and investments in securities related to fi nancing activities.
(3) Adjustment for depreciation and amortization of (¥4) million (($40) thousand) includes inter-segment elimination of (¥4) million (($40) thousand). (4) Adjustment for investments in equity method affi liates of ¥174 million ($1,451 thousand) includes inter-segment elimination of (¥0) million (($3) thousand) and
corporate assets of ¥174 million ($1,455 thousand) that are not allocated to any reportable segment. (5) Adjustment for increases in tangible fi xed assets and intangible fi xed assets of ¥732 million ($6,097 thousand) includes inter-segment elimination of (¥32)
million (($271) thousand) and corporate assets of ¥765 million ($6,368 thousand) that are not allocated to any reportable segment. 3. Segment income is adjusted for operating income in the consolidated statements of income.
71KANEMATSU ANNUAL REPORT 2015
Kanematsu’s Progress and
StrengthsSpecial Feature: Realizing VISIO
N-130
Review of O
perationsCSR and Corporate G
overnanceFinancial Section and Com
pany Information
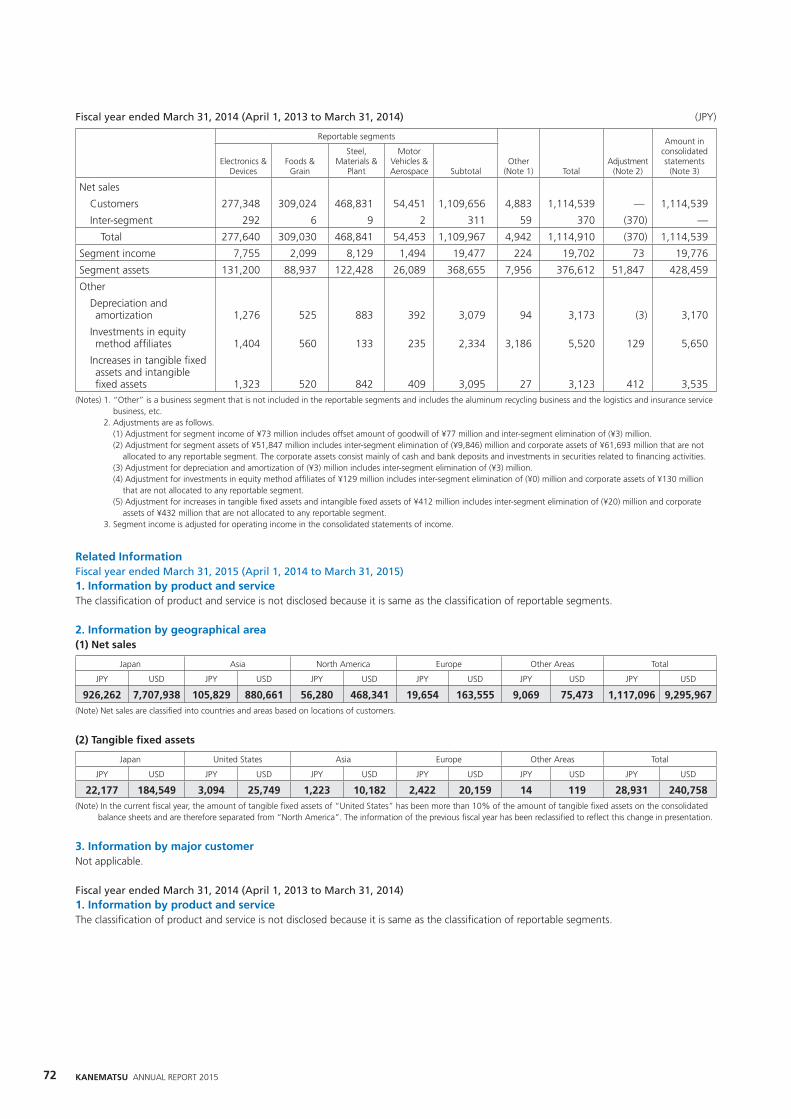
Fiscal year ended March 31, 2014 (April 1, 2013 to March 31, 2014) (JPY)
Reportable segments
Other (Note 1) Total
Adjustment (Note 2)
Amount in consolidated statements
(Note 3)Electronics &
Devices Foods &
Grain
Steel, Materials &
Plant
Motor Vehicles & Aerospace Subtotal
Net sales
Customers 277,348 309,024 468,831 54,451 1,109,656 4,883 1,114,539 — 1,114,539
Inter-segment 292 6 9 2 311 59 370 (370) —
Total 277,640 309,030 468,841 54,453 1,109,967 4,942 1,114,910 (370) 1,114,539
Segment income 7,755 2,099 8,129 1,494 19,477 224 19,702 73 19,776
Segment assets 131,200 88,937 122,428 26,089 368,655 7,956 376,612 51,847 428,459
Other
Depreciation and amortization 1,276 525 883 392 3,079 94 3,173 (3) 3,170
Investments in equity method affi liates 1,404 560 133 235 2,334 3,186 5,520 129 5,650
Increases in tangible fi xed assets and intangible fi xed assets 1,323 520 842 409 3,095 27 3,123 412 3,535
(Notes) 1. “Other” is a business segment that is not included in the reportable segments and includes the aluminum recycling business and the logistics and insurance service business, etc.
2. Adjustments are as follows. (1) Adjustment for segment income of ¥73 million includes offset amount of goodwill of ¥77 million and inter-segment elimination of (¥3) million. (2) Adjustment for segment assets of ¥51,847 million includes inter-segment elimination of (¥9,846) million and corporate assets of ¥61,693 million that are not
allocated to any reportable segment. The corporate assets consist mainly of cash and bank deposits and investments in securities related to fi nancing activities. (3) Adjustment for depreciation and amortization of (¥3) million includes inter-segment elimination of (¥3) million. (4) Adjustment for investments in equity method affi liates of ¥129 million includes inter-segment elimination of (¥0) million and corporate assets of ¥130 million
that are not allocated to any reportable segment. (5) Adjustment for increases in tangible fi xed assets and intangible fi xed assets of ¥412 million includes inter-segment elimination of (¥20) million and corporate
assets of ¥432 million that are not allocated to any reportable segment. 3. Segment income is adjusted for operating income in the consolidated statements of income.
Related InformationFiscal year ended March 31, 2015 (April 1, 2014 to March 31, 2015) 1. Information by product and serviceThe classifi cation of product and service is not disclosed because it is same as the classifi cation of reportable segments.
2. Information by geographical area(1) Net sales
Japan Asia North America Europe Other Areas Total
JPY USD JPY USD JPY USD JPY USD JPY USD JPY USD
926,262 7,707,938 105,829 880,661 56,280 468,341 19,654 163,555 9,069 75,473 1,117,096 9,295,967(Note) Net sales are classifi ed into countries and areas based on locations of customers.
(2) Tangible fi xed assets
Japan United States Asia Europe Other Areas Total
JPY USD JPY USD JPY USD JPY USD JPY USD JPY USD
22,177 184,549 3,094 25,749 1,223 10,182 2,422 20,159 14 119 28,931 240,758(Note) In the current fi scal year, the amount of tangible fi xed assets of “United States” has been more than 10% of the amount of tangible fi xed assets on the consolidated
balance sheets and are therefore separated from “North America”. The information of the previous fi scal year has been reclassifi ed to refl ect this change in presentation.
3. Information by major customerNot applicable.
Fiscal year ended March 31, 2014 (April 1, 2013 to March 31, 2014) 1. Information by product and serviceThe classifi cation of product and service is not disclosed because it is same as the classifi cation of reportable segments.
72 KANEMATSU ANNUAL REPORT 2015
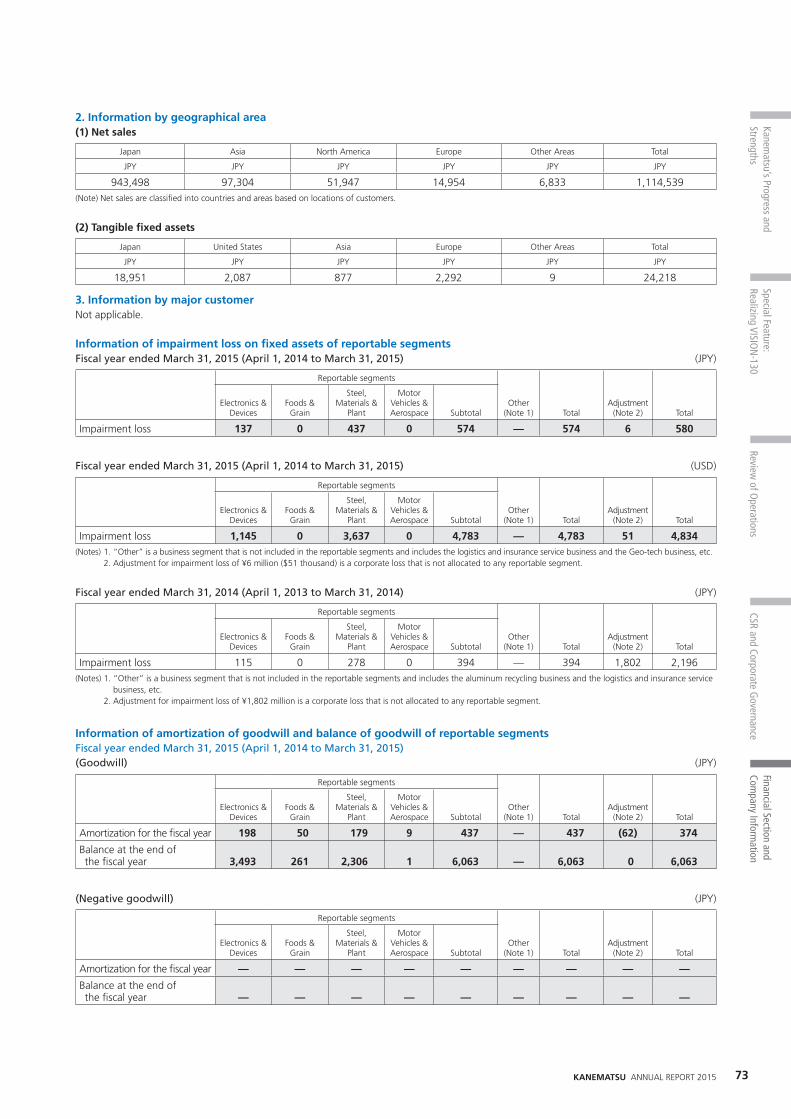
2. Information by geographical area(1) Net sales
Japan Asia North America Europe Other Areas Total
JPY JPY JPY JPY JPY JPY
943,498 97,304 51,947 14,954 6,833 1,114,539(Note) Net sales are classifi ed into countries and areas based on locations of customers.
(2) Tangible fi xed assets
Japan United States Asia Europe Other Areas Total
JPY JPY JPY JPY JPY JPY
18,951 2,087 877 2,292 9 24,218
3. Information by major customerNot applicable.
Information of impairment loss on fi xed assets of reportable segmentsFiscal year ended March 31, 2015 (April 1, 2014 to March 31, 2015) (JPY)
Reportable segments
Other (Note 1) Total
Adjustment (Note 2) Total
Electronics & Devices
Foods & Grain
Steel, Materials &
Plant
Motor Vehicles & Aerospace Subtotal
Impairment loss 137 0 437 0 574 — 574 6 580
Fiscal year ended March 31, 2015 (April 1, 2014 to March 31, 2015) (USD)
Reportable segments
Other (Note 1) Total
Adjustment (Note 2) Total
Electronics & Devices
Foods & Grain
Steel, Materials &
Plant
Motor Vehicles & Aerospace Subtotal
Impairment loss 1,145 0 3,637 0 4,783 — 4,783 51 4,834(Notes) 1. “Other” is a business segment that is not included in the reportable segments and includes the logistics and insurance service business and the Geo-tech business, etc. 2. Adjustment for impairment loss of ¥6 million ($51 thousand) is a corporate loss that is not allocated to any reportable segment.
Fiscal year ended March 31, 2014 (April 1, 2013 to March 31, 2014) (JPY)
Reportable segments
Other (Note 1) Total
Adjustment (Note 2) Total
Electronics & Devices
Foods & Grain
Steel, Materials &
Plant
Motor Vehicles & Aerospace Subtotal
Impairment loss 115 0 278 0 394 — 394 1,802 2,196(Notes) 1. “Other” is a business segment that is not included in the reportable segments and includes the aluminum recycling business and the logistics and insurance service
business, etc. 2. Adjustment for impairment loss of ¥1,802 million is a corporate loss that is not allocated to any reportable segment.
Information of amortization of goodwill and balance of goodwill of reportable segmentsFiscal year ended March 31, 2015 (April 1, 2014 to March 31, 2015)(Goodwill) (JPY)
Reportable segments
Other (Note 1) Total
Adjustment (Note 2) Total
Electronics & Devices
Foods & Grain
Steel, Materials &
Plant
Motor Vehicles & Aerospace Subtotal
Amortization for the fi scal year 198 50 179 9 437 — 437 (62) 374
Balance at the end of the fi scal year 3,493 261 2,306 1 6,063 — 6,063 0 6,063
(Negative goodwill) (JPY)
Reportable segments
Other (Note 1) Total
Adjustment (Note 2) Total
Electronics & Devices
Foods & Grain
Steel, Materials &
Plant
Motor Vehicles & Aerospace Subtotal
Amortization for the fi scal year — — — — — — — — —
Balance at the end of the fi scal year — — — — — — — — —
73KANEMATSU ANNUAL REPORT 2015
Kanematsu’s Progress and
StrengthsSpecial Feature: Realizing VISIO
N-130
Review of O
perationsCSR and Corporate G
overnanceFinancial Section and Com
pany Information

Fiscal year ended March 31, 2015 (April 1, 2014 to March 31, 2015) (Goodwill) (USD)
Reportable segments
Other (Note 1) Total
Adjustment (Note 2) Total
Electronics & Devices
Foods & Grain
Steel, Materials &
Plant
Motor Vehicles & Aerospace Subtotal
Amortization for the fi scal year 1,649 420 1,491 78 3,638 — 3,638 (523) 3,115
Balance at the end of the fi scal year 29,073 2,175 19,195 16 50,459 — 50,459 1 50,460
(Negative goodwill) (USD)
Reportable segments
Other (Note 1) Total
Adjustment (Note 2) Total
Electronics & Devices
Foods & Grain
Steel, Materials &
Plant
Motor Vehicles & Aerospace Subtotal
Amortization for the fi scal year — — — — — — — — —
Balance at the end of the fi scal year — — — — — — — — —
(Notes) 1. “Other” is a business segment that is not included in the reportable segments and includes the logistics and insurance service business and the Geo-tech business, etc. 2. Negative goodwill recognized due to the combinations before April 1, 2010. The amounts of amortization of goodwill and negative goodwill are offset in
consolidated fi nancial statements. In addition, adjustments are as follows (1) Adjustment for amortization of goodwill for the fi scal year of (¥62) million (($523) thousand) includes offset amount of (¥62) million (($523) thousand). (2) Adjustment for balance of goodwill at the end of the fi scal year of ¥0 million ($1 thousand) includes corporate assets of ¥0 million ($1 thousand) that are not
allocated to any reportable segment. (3) Adjustment for amortization of negative goodwill for the fi scal year includes corporate profi ts of ¥62 million ($523 thousand) that are not allocated to any
reportable segment and offset amount of (¥62) million (($523) thousand).
Fiscal year ended March 31, 2014 (April 1, 2013 to March 31, 2014) (Goodwill) (JPY)
Reportable segments
Other (Note 1) Total
Adjustment (Note 2) Total
Electronics & Devices
Foods & Grain
Steel, Materials &
Plant
Motor Vehicles & Aerospace Subtotal
Amortization for the fi scal year 132 16 156 6 312 0 312 (77) 235
Balance at the end of the fi scal year 1,034 20 2,173 9 3,238 — 3,238 (62) 3,175
(Negative goodwill) (JPY)
Reportable segments
Other (Note 1) Total
Adjustment (Note 2) Total
Electronics & Devices
Foods & Grain
Steel, Materials &
Plant
Motor Vehicles & Aerospace Subtotal
Amortization for the fi scal year — — — — — — — — —
Balance at the end of the fi scal year — — — — — — — — —
(Notes) 1. “Other” is a business segment that is not included in the reportable segments and includes the aluminum recycling business and the logistics and insurance service business, etc.
2. Negative goodwill recognized due to the combinations before April 1, 2010. The amounts of amortization and balance of goodwill and negative goodwill are offset in consolidated fi nancial statements.
In addition, adjustments are as follows (1) Adjustment for amortization of goodwill for the fi scal year of (¥77) million includes inter-segment elimination of (¥0) million and offset amount of (¥77) million. (2) Adjustment for balance of goodwill at the end of the fi scal year of (¥62) million includes corporate assets of ¥0 million that are not allocated to any reportable
segment and offset amount of (¥62) million. (3) Adjustment for amortization of negative goodwill for the fi scal year includes corporate profi ts of ¥77 million that are not allocated to any reportable segment
and offset amount of (¥77) million. (4) Adjustment for balance of negative goodwill at the end of the fi scal year includes corporate liabilities of ¥62 million that are not allocated to any reportable
segment and offset amount of (¥62) million.
74 KANEMATSU ANNUAL REPORT 2015

21. Disclosure of Related Party Transactions
Fiscal year ended March 31, 2015 (April 1, 2014 to March 31, 2015)Related party transactions:Not applicable.
Fiscal year ended March 31, 2014 (April 1, 2013 to March 31, 2014)Related party transactions:Not applicable.
22. Information per Share
JPY USD
2015 2014 2015
Net assets per share 214.10 170.54 1.78
Net income per share 27.30 28.09 0.23(Notes) 1. Diluted net income per share for the term is not reported since there is no outstanding security with dilutive effect. 2. The supplemental information for the computation of net assets per share is as follows:
JPY USD
2015 2014 2015
Total net assets 118,731 96,20 988,032
Amount deducted from total net assets 28,630 24,547 238,247
(minority interest in consolidated subsidiaries) (28,630) (24,547) (238,247)
Net assets corresponding to common stock at the end of the fi scal year 90,101 71,657 749,785
Number of common stock issued (thousand shares) 422,501 422,501
Number of treasury stock (thousand shares) 1,663 2,323
Number of common stock used for the calculation of net assets per share (thousand shares) 420,837 420,177
3. The supplemental information for the computation of net income per share is as follows:
JPY USD
2015 2014 2015
Net income 11,470 11,799 95,452
Amount that does not belong to common shareholders — — —
Net income corresponding to common stock 11,470 11,799 95,452
Average number of common stock for the term (thousand shares) 420,211 420,060
23. Subsequent Events
Not applicable.
75KANEMATSU ANNUAL REPORT 2015
Kanematsu’s Progress and
StrengthsSpecial Feature: Realizing VISIO
N-130
Review of O
perationsCSR and Corporate G
overnanceFinancial Section and Com
pany Information

24. Consolidated Supplementary Schedules
(1) Schedule of bonds payable:Not applicable.
(2) Schedule of borrowings:
Classifi cation
Balance at the beginning of the fi scal year
Balance at the end of the fi scal year
Composite interest rate Due
JPY USD JPY USD % Month, year
Short-term borrowings 36,387 302,797 39,841 331,545 0.9 —
Current portion of long-term borrowings 44,405 369,522 21,846 181,799 1.5 —
Current portion ofl ease obligations 760 6,330 638 5,310 — —
Long-term borrowings (excluding current portion) 61,113 508,557 74,426 619,344 1.5 April 2016-March 2022
Lease obligations (excluding current portion) 1,033 8,597 1,286 10,708 — April 2016-January 2022
Total 143,699 1,195,803 138,040 1,148,706 — —(Notes) 1. The composite interest rate is a weighted average interest rate for those outstanding at the end of the year. 2. The composite interest rate of lease obligations is not presented as lease obligations of the Company and certain of its subsidiaries comprise interest expenses
portion of total lease payments. 3. The long-term borrowings and lease obligations repayment schedule for next fi ve years (excluding current portion) is as follows:
Over one year and within two years
Over two years and within three years
Over three years and within four years
Over four years and within fi ve years
JPY USD JPY USD JPY USD JPY USD
Long-term borrowings 27,277 226,989 21,899 182,235 4,580 38,120 11,253 93,645
Lease obligations 401 3,344 303 2,527 252 2,103 212 1,769
(3) Schedule of asset retirement obligations:According to the Article 92-2 of the “Regulations for Consolidated Financial Statements”, schedule of asset retirement obligations are not disclosed, as the amount of “asset retirement obligations” is less than 1 percent of total amount of liabilities and net assets.
76 KANEMATSU ANNUAL REPORT 2015

Independent Auditor’s Report
To the Board of Directors of Kanematsu Corporation
We have audited the accompanying consolidated fi nancial statements of Kanematsu Corporation (“the Company”) and its consolidated subsidiaries, which comprise the consolidated balance sheets as at March 31, 2015, and the consolidated statements of income, consolidated statements of comprehensive income, consolidated statements of changes in net assets and consolidated statements of cash fl ows for the year then ended, and a summary of signifi cant accounting policies and other explanatory information.
Management’s Responsibility for the Consolidated Financial Statements Management is responsible for the preparation and fair presentation of these consolidated fi nancial statements in accordance with accounting principles generally accepted in Japan, and for such internal control as management determines is necessary to enable the preparation of consolidated fi nancial statements that are free from material misstatements, whether due to fraud or error.
Auditor’s Responsibility Our responsibility is to express an opinion on these consolidated fi nancial statements based on our audit. We conducted our audit in accordance with auditing standards generally accepted in Japan. Those standards require that we comply with ethical requirements and plan and perform the audit to obtain reasonable assurance about whether the consolidated fi nancial statements are free from material misstatement. An audit involves performing procedures to obtain audit evidence about the amounts and disclosures in the consolidated fi nancial statements. The procedures selected depend on the auditor’s judgment, including the assessment of the risks of material misstatement of the consolidated fi nancial statements, whether due to fraud or error. In making those risk assessments, the auditor considers internal control relevant to the entity’s preparation and fair presentation of the consolidated fi nancial statements in order to design audit procedures that are appropriate in the circumstances, while the purpose of the fi nancial statements audit is not to express an opinion on the effectiveness of the entity’s internal control. An audit also includes evaluating the appropriateness of accounting policies used and the reasonableness of accounting estimates made by management, as well as evaluating the overall presentation of the consolidated fi nancial statements. We believe that the audit evidence we have obtained is suffi cient and appropriate to provide a basis for our audit opinion.
Opinion In our opinion, the consolidated fi nancial statements present fairly, in all material respects, the fi nancial position of the Company and its consolidated subsidiaries as at March 31, 2015, and their fi nancial performance and cash fl ows for the year then ended accordance with accounting principles generally accepted in Japan.
Convenience Translation The U.S. dollar amounts in the accompanying consolidated fi nancial statements with respect to the year ended March 31, 2015 are presented solely for convenience. Our audit also included the translation of Japanese yen amounts into U.S. dollar amounts and, in our opinion, such translation has been made on the basis described in Note 3 to the consolidated fi nancial statements.
June 24, 2015
77KANEMATSU ANNUAL REPORT 2015
Kanematsu’s Progress and
StrengthsSpecial Feature: Realizing VISIO
N-130
Review of O
perationsCSR and Corporate G
overnanceFinancial Section and Com
pany Information
PricewaterhouseCoopers Arata Sumitomo Fudosan Shiodome Hamarikyu Bldg., 8-21-1 Ginza, Chuo-ku, Tokyo 104-0061, Japan T: +81 (3) 3546 8450, F: +81 (3) 3546 8451, www.pwc.com/jp/assurance

78 KANEMATSU ANNUAL REPORT 2015
Global Network(As of March 31, 2015)
Kanematsu supplies products and services through its large network of business bases in Japan and overseas. 92 subsidiaries and 30
affi liates ensure the Group’s global market reach.
Organization Chart(As of April 1, 2015)
DOMESTIC OFFICES
EUROPE
OCEANIA
ASIA & THE MIDDLE EAST
NORTH AMERICA
CENTRAL & SOUTH AMERICA
Overseas subsidiariesand their branches
Representative offices
Branches
1
1
8
91012
1617 18
2221
23
26
2930
313233
35
34
36
40
41
37
38
39
2728
24
1920
21
25
1315
14
11
23
45
6
7
32
5
6
4 1 Tokyo Head Office
2 Osaka
Midosuji Office
3 Nagoya
4 Hokkaido
5 Kyushu
6 Sendai
1 London
2 Dusseldorf
3 Munich
4 Milan
5 Budapest
6 Moscow
7 Las Palmas 29 Sydney
30 Auckland
8 Seoul
9 Shanghai
10 Suzhou
11 Wuxi
12 Chongqing
13 Beijing
14 Dalian
15 Tianjin
16 Shenzhen
17 Hong Kong
18 Taipei
19 Hanoi
20 Haiphong
21 21 Ho Chi Minh City
22 Bangkok
23 Singapore
24 Manila
25 Yangon
26 Jakarta
27 New Delhi
28 Tehran
31 New York
32 Somerset
33 Chicago
34 Detroit
35 San Diego
36 Houston
37 Silicon Valley
38 Portland
39 Vancouver
40 Silao
41 Sao Paulo
Shareholder’s Meeting
Board of Directors Audit & Supervisory Board
Marketing Area Support Area
Electronics & Devices Division
Industrial Electronics Dept.
Semiconductor Equipment Dept.
Components & Material Dept.
Electronic Components & Semiconductor Dept. No. 1
Electronic Components & Semiconductor Dept. No. 2
Electronic Components & Semiconductor Marketing Dept.
System & Module Dept.
Electronics Planning Office
Foods & Grain Division
Food Dept. No. 1
Food Dept. No. 2
Food Dept. No. 3
Meat Dept.
Grain Dept.
Feedstuff Dept.
Agricultural Products & Oilseeds Dept.
Domestic Sections
Foods & Grain Planning Office
Food Safety Management System Office
Steel, Materials & Plant Division
Iron & Steel Foreign Trade Dept.
Specialty Steel Foreign Trade Dept.
Functional Chemicals Dept.
Energy Dept.
Plant & Ships Dept.
Steel, Materials & Plant Planning Office
Food Safety Management Office
Motor Vehicles & Aerospace Division
Motor Vehicles & Parts Dept. No. 1
Motor Vehicles & Parts Dept. No. 2
Aerospace Dept.
Motor Vehicles & Aerospace Planning Office
Personnel & General Affairs Dept.
Finance Dept.
Accounting Dept.
Business Accounting Dept.
Legal & Compliance Dept.
Credit Control Dept.
Traffic & Insurance Dept.
System Planning Dept.
Internal Auditing Dept.
Corporate Planning Dept.
Management Committee

79KANEMATSU ANNUAL REPORT 2015
Kanematsu’s Progress and
StrengthsSpecial Feature: Realizing VISIO
N-130
Review of O
perationsCSR and Corporate G
overnanceFinancial Section and Com
pany Information
Major Group Companies(As of March 31, 2015)
Electronics & Devices JapanKanematsu Electronics Ltd.* System integration of ICT and communications equipmentNippon Offi ce Systems Ltd.* Development of software for and sales and maintenance of computers and computer peripherals, etc.
Kanematsu-NNK Corp.*Manufacture and sales of home-construction materials; Ground inspection services and improvement work; Sales of security systems
Kanematsu Communications Ltd. Sales of mobile communications devices; Mobile internet systems and services
Kanematsu Advanced Materials Corp.Import, export, storage, sales, and processing of materials and components for vehicle equipment, industrial electronics, and communication devices
Kanematsu PWS LTD. Manufacture of semiconductors; Design, development, manufacture, and sales of testing equipmentKantatsu Co., Ltd. Development, manufacture, and sales of lens units, camera modules, and other optical equipment and partsChinaKanekoh Electronics (Shanghai) Co., Ltd. Development, manufacture, and sales of control modules for lithium ion batteries
Foods & Grain JapanKanematsu Shintoa Foods Corp. Food wholesaling and cold storageKanematsu Agritec Co., Ltd. Manufacture and sales of feed and fertilizer
Kanematsu Soytech Corp.Sales of soybeans, pulses & peas, and grain; Development and marketing of tofu and other ingredients for processed foods
Heisei Feed Manufacturing Co. Manufacture and processing of mixed feedsMojiko Silo Co., Ltd. Operation of grain silos; Land/marine transportNorth Pet Co., Ltd. Manufacture of pet snacks (jerky, dried meat, biscuits)GPC Holdings Co., Ltd. Sales of pet food and other productsChinaDalian Tiantianli Food Co., Ltd. Manufacture of dim sum and delicatessensShangdong Lufeng Foods Co., Ltd. Production of processed vegetables and fruitsThailandSummit Food Industries Co., Ltd. Production and sales of rice crackersSiam Aloe Vera (2005) Co., Ltd. Processing and sales of aloe veraIndonesiaPT. Kanemory Food Service Manufacture of processed foods; Management of central kitchenU.S.A.KAI Enterprises, Inc. Sales of hay and roughageKG Agri Products, Inc. Seed development; Contract farming; Sorting, processing, and sales of food soybeans
Steel, Materials & Plants JapanKanematsu Trading Corp. Sales of steel and construction materialsKyowa Steel Co., Ltd. Cutting and processing of steel sheet; Sales of construction materialsEiwa Metal Co., Ltd. Processing and sales of stainless steel, titanium, and high-alloy steelsKanematsu Petroleum Corp. Sales of petroleum products and LPGKanematsu Yuso Co., Ltd. Delivery and storage of petroleum productsKanematsu Chemicals Corp. Sales of petrochemicals, automobile-related chemicals, health food ingredients, and pharmaceuticalsKanematsu Wellness Corp. Sales of health foods and provision of medical informationMiracool Co., Ltd. Sales of heat refl ective paintKanematsu KGK Corp. Sales of machine tools and industrial machineryKGK Engineering Corp. Repair and sales of machine tools; Sales of paper-manufacturing machineryChinaKanematsu Hoplee Co., Ltd. Processing and marketing of steel sheets and platesKanematsu KGK Trade & Sales (Shanghai) Co., Ltd. Sales of machine tools and industrial machineryThailandKGK Engineering (Thai) Co., Ltd. Sales of machine tools and industrial machineryVietnamKanematsu KGK Vietnam Company Limited Sales of machine tools and industrial machineryIndonesiaPT. Kanematsu KGK Indonesia Sales of machine tools and industrial machineryCzech RepublicKGK Czech s.r.o. Sales of machine tools and industrial machineryU.S.A.Steel Service Oilfi eld Tubular, Inc. Sales of steel materials for oil excavationBenoit Premium Threading, LLC Oil well casing fabrication; Manufacture and sales of oil well-related partsKGK International Corp. Sales of machine tools
Motor Vehicles & Aerospace JapanKanematsu Aerospace Corp. Sales of aircraft, defense, and aerospace-related productsIrelandKG Aircraft Rotables Co., Ltd. Replacement and maintenance of aircraft rotable components; LeasingPolandAries Motor Sp. zo.o. Sales of automobilesAries Power Equipment Sp. zo.o. Sales of engines, generators, water pumps, and other general-purpose machinery
Others JapanKaneyo Co., Ltd.* Sales of bedding materials and products, general merchandise, and interior goodsHokushin Co., Ltd.* Manufacture and sales of medium-density fi berboardAso Kanko Kaihatsu Co., Ltd. Golf course managementShintoa Corp. Beverage-vending machine operations; Imports, exports, and sales of aircraft enginesKanematsu Logistics & Insurance Ltd. Insurance agency and forwarding business; Consigned freight forwarding businessJapan Logistics Co., Ltd. Warehouse and self-storage operationVietnamVietnam-Japan International Transport Co., Ltd. Total logistics servicesIndonesiaP.T. Dunia Express Transindo Total logistics services
* Companies with shares listed on a stock exchange

80 KANEMATSU ANNUAL REPORT 2015
Network(As of March 31, 2015)
Japan Overseas
Tokyo Head Offi ce2-1, Shibaura 1-chome, Minato-ku,
Tokyo 105-8005, Japan
TEL: 81-3-5440-8111
FAX: 81-3-5440-6500
OsakaAwaji-machi Dai Building, 1-9, Awaji-machi
3-chome, Chuo-ku, Osaka 541-8560, Japan
TEL: 81-6-6205-3111
FAX: 81-6-6205-3322
Midosuji Offi ceMidosuji Daiwa Building, 6-8, Kyutaro-machi
3-chome, Chuo-ku, Osaka 541-0056, Japan
TEL: 81-6-6251-7700
FAX: 81-6-6251-7770
Nagoya9-3, Sakae 2-chome, Naka-ku,
Nagoya 460-0008, Japan
TEL: 81-52-202-5111
Fax: 81-52-202-4605
HokkaidoSapporo-Kokusai Building, 4-1, Kitashijou-nishi,
Chuo-ku, Sapporo 060-0004, Japan
TEL: 81-11-261-5631
FAX: 81-11-261-5630
KyushuTenjin Twin Building, 6-8, Tenjin 1-chome,
Chuo-ku, Fukuoka 810-0001, Japan
TEL: 81-92-715-7820
FAX: 81-92-715-7830
Sendai Offi ceVerza Sendai Room #405, 7-17, Chuo
4-chome, Aoba-ku, Sendai-shi,
Miyagi 980-0021, Japan
TEL: 81-22-722-2675
FAX: 81-22-267-7351
ASIA & THE MIDDLE EAST
KOREA
Kanematsu Devices Korea CorporationKoreana Bldg., 6F, 61-1-Ka Tae Pyung Ro,Chung-Ku, Seoul, Republic of KoreaTEL: 82-2-737-5795FAX: 82-2-737-5799
CHINA
Kanematsu (China) Co., Ltd.
Shanghai Head Offi ce Shanghai Branch18th Floor Raffl es City (Offi ce Tower) 268 Xi ZangMiddle Road, Shanghai 200001, P.R. ChinaTEL: 86-21-6340-3456FAX: 86-21-6340-4290Suzhou Offi ce12F09, Gold River Tower, No. 35 Shishan Road,Suzhou New District, Jiansu Province, P.R. ChinaTEL: 86-512-6809-7379FAX: 86-512-6803-2295Wuxi Offi ceRoom 401, Rong Zhi Building E, No. 2 Long Shan Rd., Wuxi New District, Wuxi Province 214028 , P.R. ChinaTEL: 86-510-8522-6426, 6425FAX: 86-510-8522-6430Chongqing Liaison Offi ceRoom 6-B-2, Wanyou Conifer Hotel, 77Changjiang 2nd Road, Daping, Yuzhong District,Chongqing, P.R. China 400042TEL: 86-23-6800-7771FAX: 86-23-6800-7772Beijing BranchBeijing Lufthansa Center C315, 50 Liangma QiaoRoad, Chaoyang District, Beijing 100125, P.R. ChinaTEL: 86-10-8591-1031FAX: 86-10-8591-1535Dalian BranchRoom 602, Furama Hotel, 60 Renmin Road,Dalian 116001, P.R. ChinaTEL: 86-411-8263-9105, 7481FAX: 86-411-8280-5534Tianjin Branch29F-A, Kai Xuan Men Building A, 66 Nanjing Road,Hexi-Qu, Tianjin, 300042, P.R. ChinaTEL: 86-22-2331-2405, 2330-5886FAX: 86-22-2331-6873Shenzhen BranchRoom B-C, 33/F, Bldg B, Hong Long Century Plaza,4002 Shen Nan Dong Road Luohu District,Shenzhen 518001, P.R. ChinaTEL: 86-755-8235-4891FAX: 86-755-8223-8980
Kanematsu Industrial and Trading(Dalian Free Trade Zone) Co., Ltd.Aulan Industrial Land, ID-32 Free Trade ZoneDalian, P.R. ChinaTEL: 86-411-8732-3090, 3091, 3092FAX: 86-411-8732-3093Kanematsu (Hong Kong) Ltd.Rooms 1806-1807, 18th Floor, Hopewell Centre,183 Queen’s Road East, Hong KongTEL: 852-2821-6200FAX: 852-2527-0465, 2865-6649
TAIWAN
Kanematsu Taiwan Corporation11th Floor, No. 61 Chung Shan N.Rd., Sec. 2,Taipei 104, Taiwan, R.O.C.TEL: 886-2-2511-7007FAX: 886-2-2511-2947, 2951, 3554
VIETNAM
The Representative of Kanematsu Corporation
HanoiRoom No. 1205-1206-1207, 12th fl oor, DaehaBusiness Center, 360 Kim Ma St., Ba Dinh Dist.,Hanoi, S.R. VietnamTEL: 84-4-3771-5642FAX: 84-4-3771-5641, 3771-5648HaiphongH-Tower 3rd Floor, 195 Van Cao Street, Haiphong, S.R. VietnamTEL: 84-31-368-6371FAX: 84-31-368-6373Hochiminh CityUnit 609 Saigon Tower, 29 Le Duan St,District 1, Hochiminh City, S.R. VietnamTEL: 84-8-3910-5532, 5534, 5535FAX: 84-8-3910-5538
Kanematsu Vietnam Company LimitedUnit 608 Saigon Tower, 29 Le Duan St, District 1, Hochiminh City, S.R. VietnamTEL: 84-8-3910-5536, 5537FAX: 84-8-3910-5539
THAILAND
Kanematsu (Thailand) Ltd.Watana Inter-Trade Co., Ltd.25F Thaniya Plaza Building, 52 Silom Road,Bangkok 10500, ThailandTEL: 66-2-632-8060FAX: 66-2-632-8083, 8084
SINGAPORE
Kanematsu (Singapore) Pte. Ltd.100 Tras Street, #12-01 100 AM, Singapore 079027TEL: 65-6320-6000FAX: 65-6320-6041
PHILIPPINES
Kanematsu Corporation Manila Branch17th Floor Tower 2, The Enterprise Center 6766,Ayala Avenue, cor. Paseo de Roxas, Makati City,PhilippinesTEL: 63-2-889-1701, 845-2017FAX: 63-2-887-0030
MYANMAR
Kanematsu Corporation Yangon Offi ceUnion Business Center (UBC) Suite 03-08, NatMauk Road, Bo Cho Quarter, Bahan Township,Yangon, MyanmarTEL: 95-1-860-4370FAX: 95-1-860-4380
INDONESIA
P.T. Kanematsu Trading IndonesiaANZ Tower 15th Floor, Jalan Jend. Sudirman Kav.33A Jakarta 10220, IndonesiaTEL: 62-21-572-1220, 1225, 1228, 1230, 1238FAX: 62-21-572-1188, 1237

81KANEMATSU ANNUAL REPORT 2015
Kanematsu’s Progress and
StrengthsSpecial Feature: Realizing VISIO
N-130
Review of O
perationsCSR and Corporate G
overnanceFinancial Section and Com
pany Information
INDIA
Kanematsu India Private LimitedTower 1, Block-A, Unit No. 2, DLF Corporate Park,Gurgaon, Haryana - 122 022, IndiaTEL: 91-124-4001461, 4001462, 4001362FAX: 91-124-4001371
IRAN
Kanematsu Iran Ltd.Elahiyeh Commercial Complex, Unit 1201,12th Floor, No. 244, Africa Ave., Tehran, IranTEL: 98-21-2621-2812FAX: 98-21-2621-3106
EUROPE
UNITED KINGDOM
Kanematsu Europe PLC.London Head Offi ceGround Floor Genesis House, 17 Godliman Street,London, EC4V 5BD, United KingdomTEL: 44-20-7246-2900FAX: 44-20-7248-8986
GERMANY
Kanematsu G.m.b.H.Duesseldorf Head Offi ceOststrasse 34, D-40211 Duesseldorf, GermanyTEL: 49-211-36890FAX: 49-211-3689-111Munchen Offi ceFrankfurter Ring 193a, D-80807 Munchen,GermanyTEL: 49-89-3074-817-12FAX: 49-89-3074-817-29
ITALY
Kanematsu G.m.b.H.Milano Liaison Offi cePiazza Duca d’Aosta 8, Milano, ItalyTEL: 39-02-6749-3538FAX: 39-02-6707-7364
HUNGARY
Kanematsu G.m.b.H.Budapest Offi ceH-1034 Budapest Becsi ut 126-128.I.103. HungaryTEL: 36-1-329-3412, 320-4952FAX: 36-1-320-4953
RUSSIAN FEDERATION
The Representative of Kanematsu CorporationMoscowTverskaya 16/2, Building 1, Business Centre,125009, Moscow, Russian FederationTEL: 7-495-935-89-40, 42, 43FAX: 7-495-935-8948
SPAIN
The Representative of Kanematsu CorporationLas PalmasCalle Eduardo Benot 51, Edifi cio Atlansea, 4-izqda, 35008 Las Palmas de Gran Canaria, SpainTEL: 34-928-275634, 275680FAX: 34-928-275632
OCEANIA
AUSTRALIA
Kanematsu Australia Ltd.Sydney Head Offi ceSuite 1 Level 9, 15 Castlereagh Street, Sydney NSW, AustraliaTEL: 61-2-8278-7004, 9993-0748,
9283-3347FAX: 61-2-9283-3095
NEW ZEALAND
Kanematsu New Zealand Ltd.Level 2, No. 5 Broadway Newmarket, Auckland,New ZealandTEL: 64-9-302-5660FAX: 64-9-309-3877
NORTH AMERICA
U.S.A.
Kanematsu USA Inc.New York Head Offi ce500 Fifth Avenue, 29th Floor,New York City, New York 10110, U.S.A.TEL: 1-212-704-9400FAX: 1-212-704-9401Somerset Offi ce100 Randolph Road, Somerset,New Jersey 08873, U.S.A.TEL: 1-732-271-7300FAX: 1-732-271-7370Chicago Branch543 West Algonquin Road, Arlington Heights,Illinois 60005, U.S.A.TEL: 1-847-981-5600FAX: 1-847-981-6760Detroit Offi ce41700 Gardenbrook Rd. Novi, Garden Offi ce B,Suite 140 Novi, MI 48375, U.S.A.TEL: 1-248-347-3216FAX: 1-248-347-3219San Diego Offi ce900 Lane Avenue, Suite 150, Chula Vista,California 91914, U.S.A.TEL: 1-619-656-2385FAX: 1-619-656-2386
Houston Branch1800 Augusta, Suite 390, Houston,Texas 77057, U.S.A.TEL: 1-713-975-7200FAX: 1-713-975-7966Silicon Valley Branch2043 Zanker Road, San Jose CA 95131, U.S.A.TEL: 1-408-501-1400FAX: 1-408-501-1499Portland Branch4380 SW Macadam Avenue, Suite 170, Portland,Oregon 97239, U.S.A.TEL: 1-503-224-7755FAX: 1-503-228-5067
CANADA
The Representative of Kanematsu Corporation
Vancouver205-8988 Fraserton Court, Burnaby, B.C.V5J 5H8, CanadaTEL: 1-604-689-0550FAX: 1-604-689-0655
CENTRAL & SOUTH AMERICA
MEXICO
Kanematsu Mexico S. de R.L. de C.V.Suite C, Multitenant III, Av. Mineral de Valencia No. 202 Col. Parque Santa Fe, C.P. 36275, Guanajuato Puerto Interior Silao, MexicoTEL: 52-472-748-9187, 9327, 9329FAX: 52-472-748-9221
BRAZIL
Kanematsu America do Sul Importacao eExportacao Ltda.Alameda Campinas No. 728, Cjto 302 e 304 Jardim Paulista, Sao Paulo, S.P. CEP 01404-001 BrasilTEL: 55-11-3285-3311FAX: 55-11-3285-3318
Number of employees(consolidated basis) Number of affi liated companies
Electronics & Devices 3,339 28 (Japan:18, Overseas:10)
Foods & Grain 582 23 (Japan:12, Overseas:11)
Steel, Materials & Plant 1,212 28 (Japan:12, Overseas:16)
Motor Vehicles & Aerospace 205 8 (Japan:1, Overseas:7)
Others 299 17 (Japan:12, Overseas:5)
Companywide (common) 365
Overseas subsidiaries 18
Total 6,002 122
Notes:1. Number of employees on a non-consolidated basis is 813 (including employees seconded from
Kanematsu, excluding employees seconded from companies other than Kanematsu).2. Of affi liated companies, 89 are consolidated subsidiaries and 28 are equity-method affi liates.
Segment information:Number of employees and number of group companies (As of March 31, 2015)

82 KANEMATSU ANNUAL REPORT 2015
Corporate Profi le(As of March 31, 2015)
Paid-in Capital ¥27,781 million
Fiscal Year April 1 to March 31
General Meeting of
Shareholders
June
Number of Offi ces Domestic: Head offi ce 1 and branches 6Overseas: 43
Number of Employees 813 (Consolidated: 6,002)
Company Name KANEMATSU CORPORATION
Established August 15, 1889
Foundation March 18, 1918
President & CEO Masayuki Shimojima
Head Offi ce 2-1, Shibaura 1-chome, Minato-ku,Tokyo 105-8005, Japan
Stock Exchange Listings Tokyo
Stock Code 8020
Transfer Agentfor Common Stock Sumitomo Mitsui Trust Bank, Limited
Shares Authorized 1,016,653,604
Shares Outstanding 422,501,010(including 1,157,263 treasury shares)
Minimum Trading Unit 1,000
Number of Shareholders 27,174
Number ofshares held(thousands)
Percentage ofvoting rights
(%)
Japan Trustee Services Bank, Ltd. (trust account) 16,770 3.98
The Master Trust Bank of Japan, Ltd. (trust account) 14,256 3.38
The Bank of Tokyo-Mitsubishi UFJ, Ltd. 13,298 3.15
The Norinchukin Bank 12,460 2.95
Mitsui Sumitomo Insurance Co., Ltd. 11,613 2.75
Tokio Marine & Nichido Fire Insurance Co., Ltd. 11,612 2.75
Hayat 5,435 1.28
Japan Trustee Services Bank, Ltd. (trust account 9) 5,285 1.25
Japan Trustee Services Bank, Ltd. (trust account 1) 4,334 1.02
Japan Trustee Services Bank, Ltd. (trust account 2) 4,329 1.02
Note: Calculated after deduction of treasury shares (1,157,263 shares)
Individuals and others(including treasury shares 34.28%
Financial institutions 33.40%
Foreign institutionsand individuals 21.25%
Other corporations 7.71%
Securities firms 3.36%
More than 1 million shares(including treasury shares) 53.66%
50,000 shares and more 22.86%
10,000 shares and more 13.06%
1,000 shares and more 10.02%
Less than 1,000 shares 0.40%
350,000
300,000
250,000
200,000
150,000
100,000
50,000
0
150
200
100
50
0
Stock price
(¥) (thousand shares)
Trading Volume
10/4 6 8 10 12 11/2 12/24 6 8 10 12 4 6 8 10 12 13/2 4 6 8 10 12 4 6 8 10 1214/2 15/2
Corporate Profi le
Investor Information
Principal Shareholders
Composition of Shareholders
Stock Price/Trading Volume
Shareholder Distribution by Number of Shares Held

English: http://www.kanematsu.co.jp/en/
Our WebsiteDetailed additional information about the Kanematsu Group is available on our website in English, Japanese and Chinese. Content includes information about the Company and its busi-nesses, press releases, investor relations materials (for shareholders and investors), and details on its environmental and CSR activities, employment opportunities and other topics are available.
83KANEMATSU ANNUAL REPORT 2015
Printed in Japan
For more information on this Annual Report, or to obtainadditional copies, please contact:
Public & Investor Relations Section, Finance Department,Kanematsu Corporation
2-1, Shibaura 1-chome, Minato-ku, Tokyo 105-8005, JapanTel: 81-3-5440-8000Fax: 81-3-5440-6503