Embed Size (px)
Citation preview
Annual Review 2017
* To be published in the second half of the fiscal year ending March 31, 2018
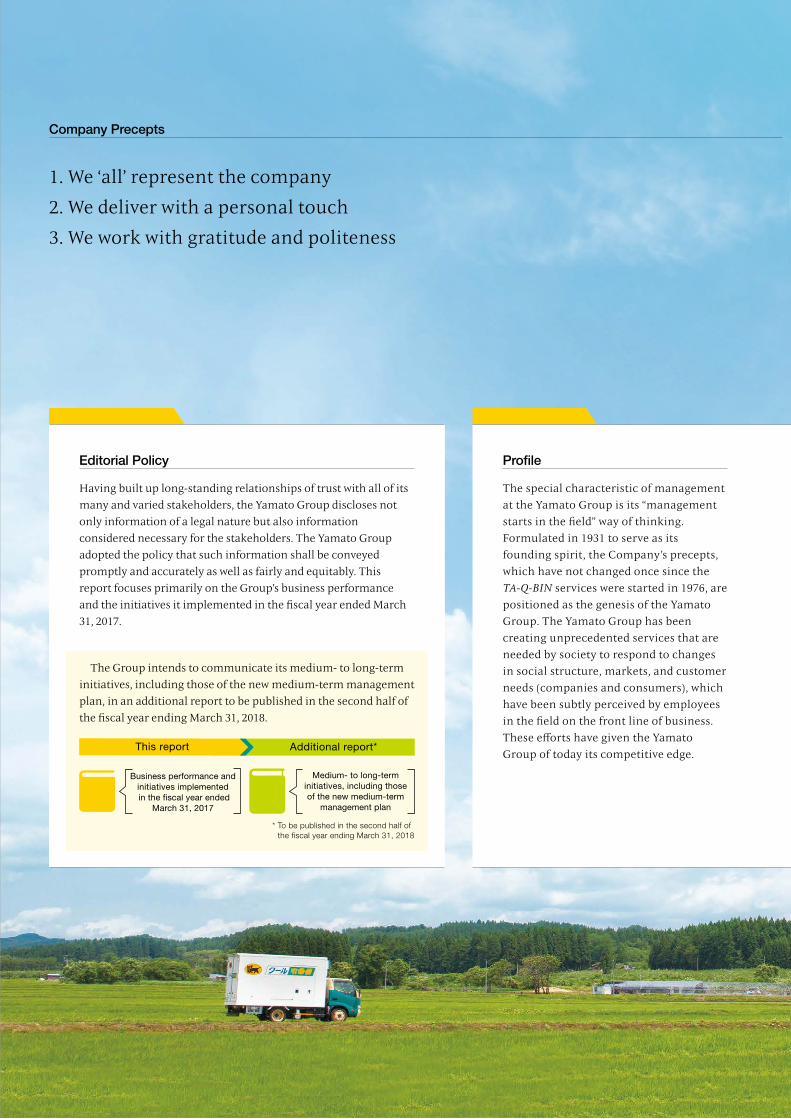
Company Precepts
1. We ‘all’ represent the company
2. We deliver with a personal touch
3. We work with gratitude and politeness
ProfileEditorial Policy
The special characteristic of management at the Yamato Group is its “management starts in the field” way of thinking. Formulated in 1931 to serve as its founding spirit, the Company’s precepts, which have not changed once since the TA-Q-BIN services were started in 1976, are positioned as the genesis of the Yamato Group. The Yamato Group has been creating unprecedented services that are needed by society to respond to changes in social structure, markets, and customer needs (companies and consumers), which have been subtly perceived by employees in the field on the front line of business. These efforts have given the Yamato Group of today its competitive edge.
Having built up long-standing relationships of trust with all of its many and varied stakeholders, the Yamato Group discloses not only information of a legal nature but also information considered necessary for the stakeholders. The Yamato Group adopted the policy that such information shall be conveyed promptly and accurately as well as fairly and equitably. This report focuses primarily on the Group’s business performance and the initiatives it implemented in the fiscal year ended March 31, 2017.
The Group intends to communicate its medium- to long-term initiatives, including those of the new medium-term management plan, in an additional report to be published in the second half of the fiscal year ending March 31, 2018.
This report Additional report*
Business performance and initiatives implemented in the fiscal year ended
March 31, 2017
Medium- to long-term initiatives, including those of the new medium-term
management plan

Domestic Parcel Delivery Market Share
EmployeesProportion of Japan Covered by TA-Q-BIN Network
Sales DriversTA-Q-BIN Annual Delivery Volume
TA-Q-BIN Centers
No. 1
Approx.
200,000
Approx.
60,000
Approx.
6,000*100%
1.8 billion parcels
46.9%
* Number of organizations
Management Philosophy
The Yamato Group helps enrich our society by enhancing the social infrastructure of TA-Q-BIN networks, creating more convenient services for comfortable lifestyles, and developing an innovative logistics system.
01YAMATO HOLDINGS CO., LTD. Annual Review 2017

1,867
(3.3)%
(1,000)
0
1,000
2,000
(4)
0
4
8
2013/3 2014/3 2015/3 2016/3 2017/3 2013/3 2014/3 2015/3 2016/3 2017/3
18.0
3.4%
0
15
30
45
0
3
6
9
73.3
(73.9)
(0.6)
(80)
(20)
(40)
20
60
100
(60)
0
40
80
2013/3 2014/3 2015/3 2016/3 2017/3
539.1
48.4%
0
200
400
600
0
50
55
60
2013/3 2014/3 2015/3 2016/3 2017/3
34.8
0
20
40
60
80
2013/3 2014/3 2015/3 2016/3 2017/32013/3 2014/3 2015/3 2016/3 2017/3
1,466.8
0
400
800
1,200
1,600
Performance Highlights
Operating Revenues
(¥ billion)
TA-Q-BIN Delivery Volume / TA-Q-BIN Unit Price Growth Rate (YoY)(Millions of parcels) (%)
Operating and Investing Cash Flows / Free Cash Flows*
(¥ billion)
Operating Income
(¥ billion)
Net Income Attributable to Owners of Parent / ROE
(¥ billion) (%)
Total Shareholders’ Equity / Shareholders’ Equity Ratio
(¥ billion) (%)
Delivery Business Non-delivery Businesses
TA-Q-BIN Delivery Volume (left scale) TA-Q-BIN Unit Price Growth Rate (YoY) (right scale) Net Income Attributable to Owners of Parent (left scale) ROE (right scale)
Cash Flows from Operating Activities Cash Flows from Investing Activities
Free Cash Flows
* Free Cash Flows = Cash Flows from Operating Activities + Cash Flows from Investing Activities
Total Shareholders’ Equity (left scale) Shareholders’ Equity Ratio (right scale)
The TA-Q-BIN delivery volume increased in the Delivery Business due to expansion of the e-commerce market and an increase in delivery volume via flea market websites. In addition, existing services in non-delivery businesses showed a solid performance. As a result, operating revenue rose 3.6% year on year, to ¥1,466.8 billion.
In addition to increased delivery volume centered on large-lot shipments for e-commerce business operators, there was a rise in delivery volumes via flea market websites, which are driving growth in the C2C market. In light of these factors, overall TA-Q-BIN delivery volume was up 7.9% year on year, to 1867 million parcels. On the other hand, the TA-Q-BIN unit price growth rate was down 3.3% year on year, due to a change in the composition of delivery volume.
Despite net cash provided by operating activities increasing ¥23.6 billion year on year, free cash flows were down ¥20.1 billion due to a ¥43.7 billion decrease in net cash used in investing activities year on year.
Amid tight labor market conditions, costs to secure labor capacity to respond to increased business volume rose, and payments for specially acknowl-edged working hours were additionally recognized. As a result, operating income declined 49.1% year on year, to ¥34.8 billion.
Net income attributable to owners of parent fell 54.2% year on year, to ¥18.0 billion. Accordingly, ROE declined 3.7 percentage points compared with the previous fiscal year and stood at 3.4%.
Despite basic net income attributable to owners of parent that was lower than initial expectations, we carried out dividend payments and acquired treasury stock in accordance with the Group’s capital policies. As a result, the shareholders’ equity ratio decreased 1.0 percentage point year on year, to 48.4%.
02 YAMATO HOLDINGS CO., LTD. Annual Review 2017

02 Performance Highlights
04 Organization
05 Business Performance Overview
ABOUT THE YAMATO GROUP
06 Overview of Operations by Segment
06 Delivery
08 BIZ-Logistics
09 Home Convenience
10 e-Business
11 Financial
12 Autoworks
13 Other Services
OVERVIEW OF OPERATIONS
Contents
Forward-Looking StatementsThis annual review contains forward-looking statements concerning Yamato Holdings’ future plans, strategies, and performance.
These statements represent assumptions and beliefs based on information currently available and are not historical facts.
Furthermore, forward-looking statements are subject to a number of risks and uncertainties that include, but are not limited to, economic
conditions, customer demand, foreign currency exchange rates, tax laws, and other regulations.
Yamato Holdings therefore cautions readers that actual results may differ materially from these predictions.
16 Yamato Group: Creating Shared Value (CSV) Initiatives
20 Corporate Governance
23 Directors / Audit & Supervisory Board Members / Executive Officers
ESG
26 Ten-Year Summary and Business Highlights
28 Consolidated Balance Sheet
30 Consolidated Statement of Income
31 Consolidated Statement of Comprehensive Income
32 Consolidated Statement of Changes in Equity
33 Consolidated Statement of Cash Flows
34 Notes to Consolidated Financial Statements
54 Independent Auditor’s Report
55 Corporate Data / Stock Information
FINANCIAL SECTION
03YAMATO HOLDINGS CO., LTD. Annual Review 2017
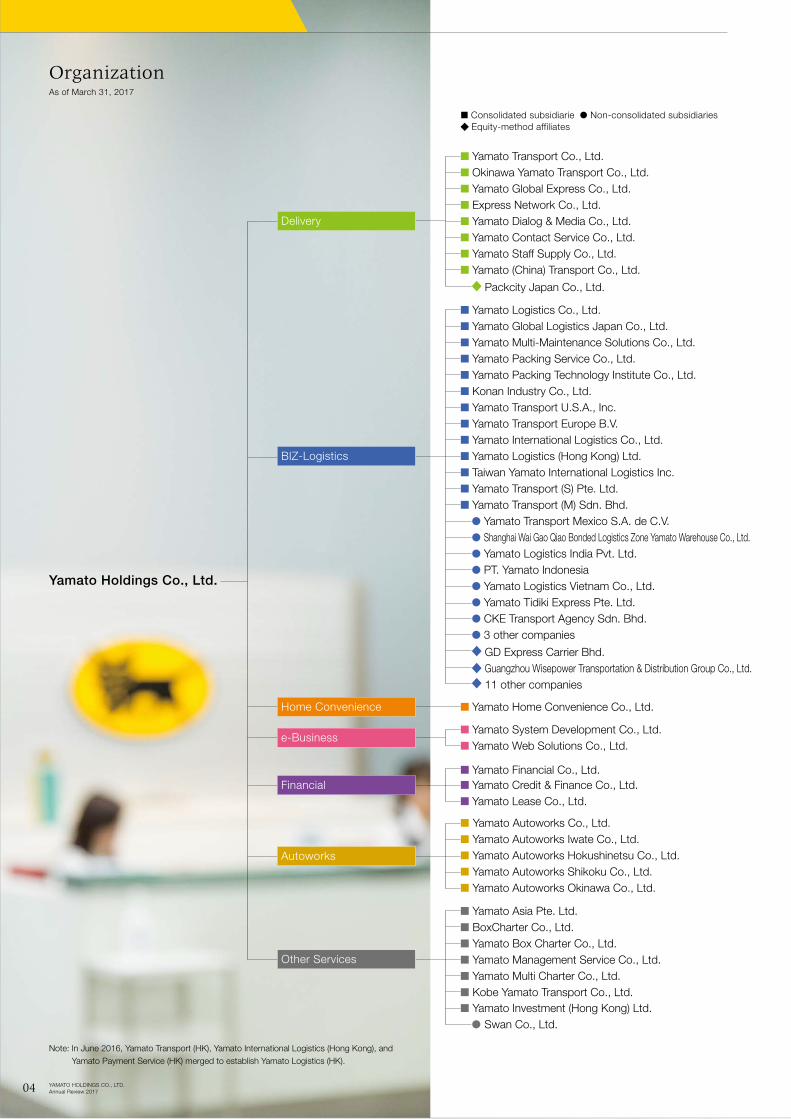
Note: In June 2016, Yamato Transport (HK), Yamato International Logistics (Hong Kong), and Yamato Payment Service (HK) merged to establish Yamato Logistics (HK).
OrganizationAs of March 31, 2017
n Yamato Transport Co., Ltd.n Okinawa Yamato Transport Co., Ltd.n Yamato Global Express Co., Ltd.n Express Network Co., Ltd.n Yamato Dialog & Media Co., Ltd.
n Yamato (China) Transport Co., Ltd.
Packcity Japan Co., Ltd.
n Yamato Contact Service Co., Ltd.n Yamato Staff Supply Co., Ltd.
n Yamato Logistics Co., Ltd.n Yamato Global Logistics Japan Co., Ltd.n Yamato Multi-Maintenance Solutions Co., Ltd.n Yamato Packing Service Co., Ltd.n Yamato Packing Technology Institute Co., Ltd.n Konan Industry Co., Ltd.
n Yamato Transport Europe B.V.n Yamato Transport U.S.A., Inc.
n Yamato International Logistics Co., Ltd.n Yamato Logistics (Hong Kong) Ltd.
n Yamato Transport (S) Pte. Ltd.n Taiwan Yamato International Logistics Inc.
n Yamato Transport (M) Sdn. Bhd.l Yamato Transport Mexico S.A. de C.V.l Shanghai Wai Gao Qiao Bonded Logistics Zone Yamato Warehouse Co., Ltd.l Yamato Logistics India Pvt. Ltd.l PT. Yamato Indonesial Yamato Logistics Vietnam Co., Ltd.l Yamato Tidiki Express Pte. Ltd.l CKE Transport Agency Sdn. Bhd.l 3 other companies
GD Express Carrier Bhd. Guangzhou Wisepower Transportation & Distribution Group Co., Ltd. 11 other companies
n Yamato Home Convenience Co., Ltd.
n Yamato System Development Co., Ltd.n Yamato Web Solutions Co., Ltd.
n Yamato Financial Co., Ltd.n Yamato Credit & Finance Co., Ltd.n Yamato Lease Co., Ltd.
n Yamato Autoworks Co., Ltd.n Yamato Autoworks Iwate Co., Ltd.n Yamato Autoworks Hokushinetsu Co., Ltd.n Yamato Autoworks Shikoku Co., Ltd.n Yamato Autoworks Okinawa Co., Ltd.
n Yamato Asia Pte. Ltd.n BoxCharter Co., Ltd.n Yamato Box Charter Co., Ltd.n Yamato Management Service Co., Ltd.n Yamato Multi Charter Co., Ltd.n Kobe Yamato Transport Co., Ltd.n Yamato Investment (Hong Kong) Ltd.
l Swan Co., Ltd.
Yamato Holdings Co., Ltd.
n Consolidated subsidiarie l Non-consolidated subsidiaries
Delivery
BIZ-Logistics
Home Convenience
e-Business
Financial
Autoworks
Other Services
◆ Equity-method affiliates
04 YAMATO HOLDINGS CO., LTD. Annual Review 2017
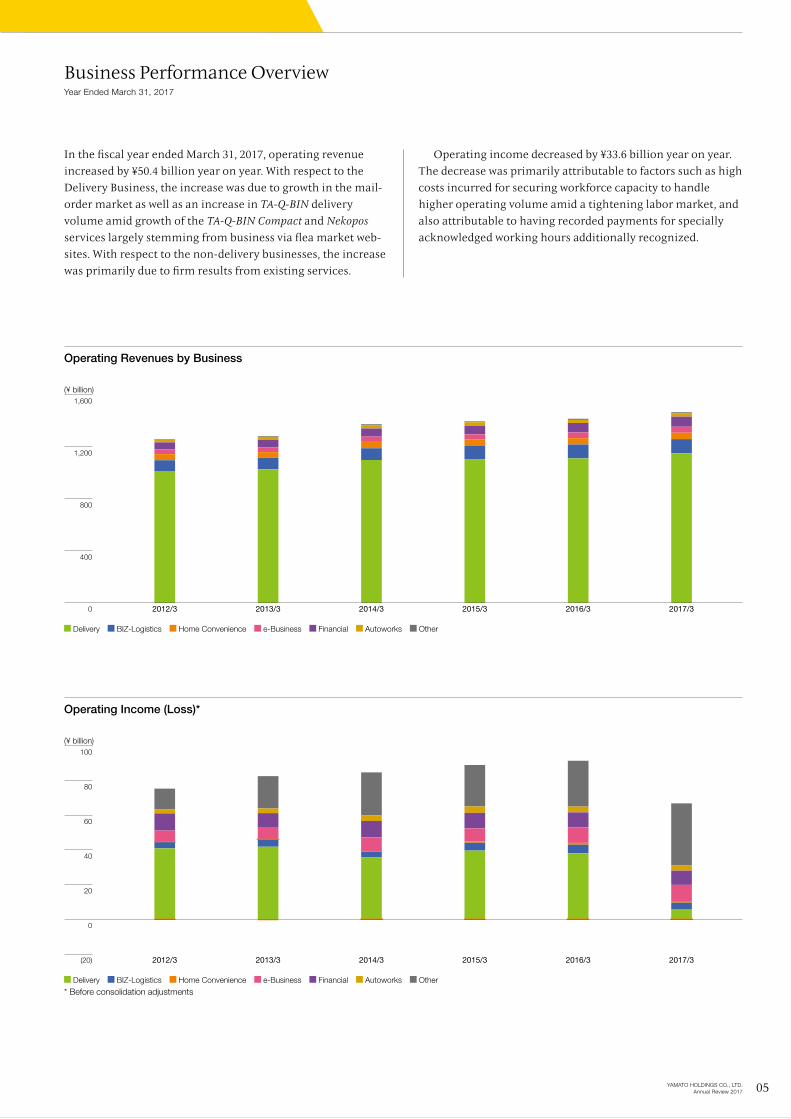
Business Performance OverviewYear Ended March 31, 2017
In the fiscal year ended March 31, 2017, operating revenue increased by ¥50.4 billion year on year. With respect to the Delivery Business, the increase was due to growth in the mail-order market as well as an increase in TA-Q-BIN delivery volume amid growth of the TA-Q-BIN Compact and Nekopos services largely stemming from business via flea market web-sites. With respect to the non-delivery businesses, the increase was primarily due to firm results from existing services.
Operating income decreased by ¥33.6 billion year on year. The decrease was primarily attributable to factors such as high costs incurred for securing workforce capacity to handle higher operating volume amid a tightening labor market, and also attributable to having recorded payments for specially acknowledged working hours additionally recognized.
2015/32014/32013/32012/3 2016/3 2017/30
1,600
1,200
800
400
2015/32014/32013/32012/3 2016/3 2017/3(20)
100
80
60
20
40
0
Operating Revenues by Business
(¥ billion)
Operating Income (Loss)*
(¥ billion)
Delivery BIZ-Logistics Home Convenience e-Business Financial Autoworks Other
Delivery BIZ-Logistics Home Convenience e-Business Financial Autoworks Other
* Before consolidation adjustments
05YAMATO HOLDINGS CO., LTD. Annual Review 2017
2013/3 2014/3 2015/3 2016/3 2017/3
1,200,000
800,000
400,000
0
2013/3 2014/3 2015/3 2016/3 2017/3
45,000
30,000
15,000
0
Operating Revenues (¥ million)
Operating Income (¥ million)
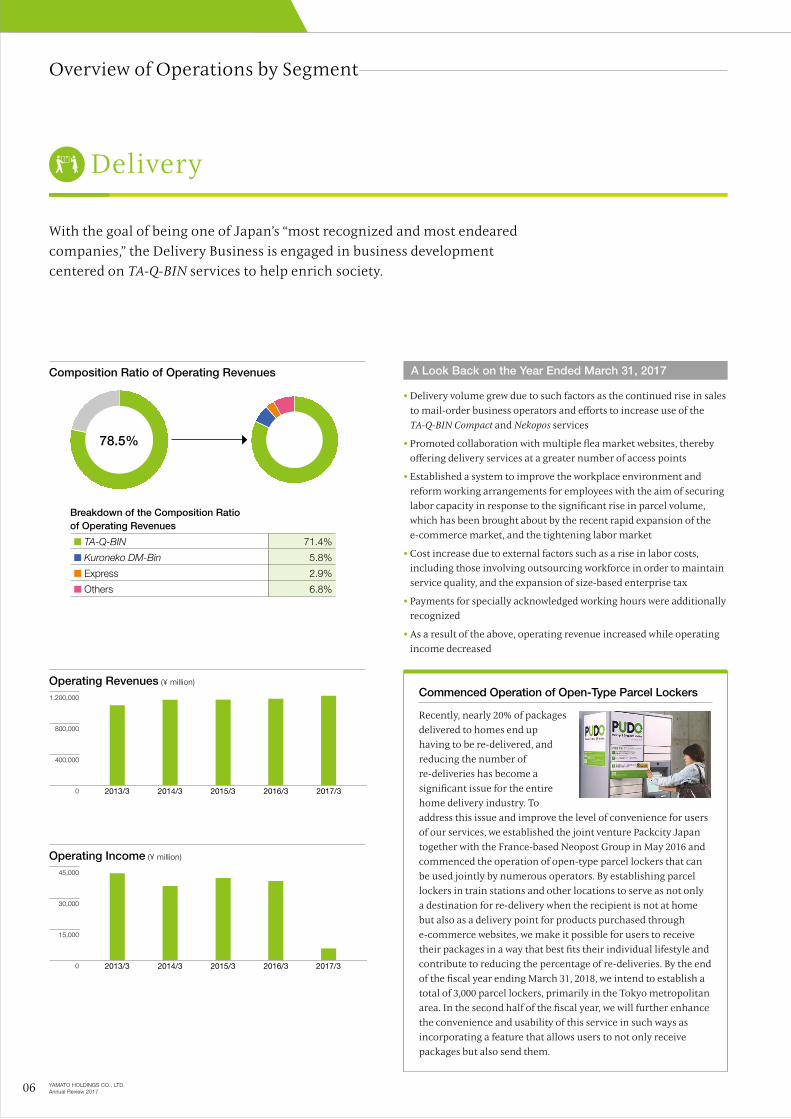
With the goal of being one of Japan’s “most recognized and most endeared companies,” the Delivery Business is engaged in business development centered on TA-Q-BIN services to help enrich society.
Delivery
Overview of Operations by Segment
• Delivery volume grew due to such factors as the continued rise in sales to mail-order business operators and efforts to increase use of the TA-Q-BIN Compact and Nekopos services
• Promoted collaboration with multiple flea market websites, thereby offering delivery services at a greater number of access points
• Established a system to improve the workplace environment and reform working arrangements for employees with the aim of securing labor capacity in response to the significant rise in parcel volume, which has been brought about by the recent rapid expansion of the e-commerce market, and the tightening labor market
• Cost increase due to external factors such as a rise in labor costs, including those involving outsourcing workforce in order to maintain service quality, and the expansion of size-based enterprise tax
• Payments for specially acknowledged working hours were additionally recognized
• As a result of the above, operating revenue increased while operating income decreased
Composition Ratio of Operating Revenues
Breakdown of the Composition Ratio of Operating Revenues
■ TA-Q-BIN 71.4%
■ Kuroneko DM-Bin 5.8%
■ Express 2.9%
■ Others 6.8%
A Look Back on the Year Ended March 31, 2017
78.5%
Commenced Operation of Open-Type Parcel Lockers
Recently, nearly 20% of packages delivered to homes end up having to be re-delivered, and reducing the number of re-deliveries has become a significant issue for the entire home delivery industry. To address this issue and improve the level of convenience for users of our services, we established the joint venture Packcity Japan together with the France-based Neopost Group in May 2016 and commenced the operation of open-type parcel lockers that can be used jointly by numerous operators. By establishing parcel lockers in train stations and other locations to serve as not only a destination for re-delivery when the recipient is not at home but also as a delivery point for products purchased through e-commerce websites, we make it possible for users to receive their packages in a way that best fits their individual lifestyle and contribute to reducing the percentage of re-deliveries. By the end of the fiscal year ending March 31, 2018, we intend to establish a total of 3,000 parcel lockers, primarily in the Tokyo metropolitan area. In the second half of the fiscal year, we will further enhance the convenience and usability of this service in such ways as incorporating a feature that allows users to not only receive packages but also send them.
06 YAMATO HOLDINGS CO., LTD. Annual Review 2017

1. Improving and developing employee working environment
• Thoroughly implement and improve labor management• Modify service level for TA-Q-BIN
2. Placing controls on total TA-Q-BIN volume
• Make requests to large-lot customers• Examine the introduction of a pricing system for corporate
clients
3. Optimizing the entire TA-Q-BIN delivery network
• Realize high-frequency, trunk-route transportation between Atsugi Gateway, Chubu Gateway, and Kansai Gateway
• Promote automation at our large-scale integrated bases
4. Boosting efficiency by enhancing the “last mile” network
• Accelerate the introduction of open-type parcel lockers and enhance services
• Make pickup and delivery operations more sophisticated through the use of IT
• Enhance the Kuroneko Members service• Introduce discount shipping rates to individual customers who
cooperated in improving the efficiency of the “last mile” network
5. Revising TA-Q-BIN basic fees and respective service standards
• Revise basic fees for TA-Q-BIN• Revise standards for Ski TA-Q-BIN, Golf TA-Q-BIN, suitcase
deliveries, and other services• Newly establish discount programs for individual customers
who cooperate with improving the efficiency of pickup and delivery operations, including digital discounts
• Newly develop a direct delivery service to TA-Q-BIN centers
Overview of Operations by Segment
Structural Reforms in the Delivery Business
The environment in which the Yamato Group operates is rapidly becoming more and more severe due a variety of factors, including the greater-than-anticipated increases in TA-Q-BIN delivery volumes, which have been brought about by the rapid expansion of the e-commerce market, and the tightening labor market. Under such circum-stances, the employee working environment has been deteriorating amid a situation where we have been falling behind with respect to our efforts to build an operational framework. After conducting investigations of employee working hours centered on the sales drivers at our TA-Q-BIN centers, one issue we discovered is that a large number of employees were unable to report the fact that they did not take long enough breaks. In response to this issue, payments for specially acknowledged working hours were additionally recognized.
To meet the expectations of society as a whole, starting with our customers, and realize growth well into the future, there is a need to implement management that prioritizes efforts geared toward placing top priority on “heightening employee satisfaction” through efforts that involve overhauling the workplace into a more upbeat working environment for employees, thereby allowing us to provide high-quality, highly efficient services. To this end, we will take steps to create an environment that allows our employees to work with peace of mind, focusing on improving and implementing thorough labor management as well as encouraging a work-life balance and other means of reforming working styles. In these ways, we will forge a robust corporate culture.
In light of the current business environment, we have decided on the details regarding the structural reforms we will make in our Delivery Business, which represents the Yamato Group’s core operating business, based on management that emphasizes reforming working styles.
Going forward, we will persist with efforts to further develop our “last mile” network, including open-type parcel lockers and convenience store delivery, primarily in urban areas, as well as the establishment of networks that specialize in mailbox services and services that address the needs of customers who wish to send packages outside of operating hours. In doing so, we aim to realize further growth in the Delivery Business.
Details on Structural Reforms in the Delivery Business
07YAMATO HOLDINGS CO., LTD. Annual Review 2017
2013/3 2014/3 2015/3 2016/3 2017/3
120,000
80,000
40,000
0
2013/3 2014/3 2015/3 2017/32016/3
6,000
4,000
2,000
0
Operating Revenues (¥ million)
Operating Income (¥ million)
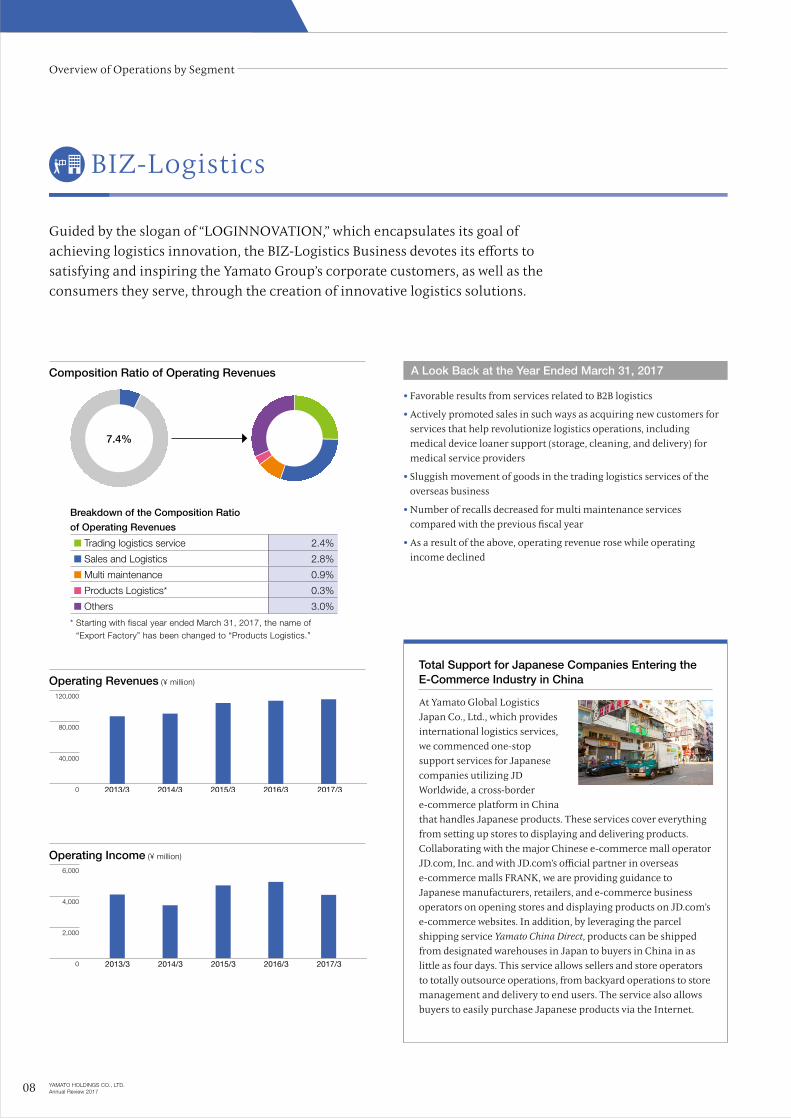
Guided by the slogan of “LOGINNOVATION,” which encapsulates its goal of achieving logistics innovation, the BIZ-Logistics Business devotes its efforts to satisfying and inspiring the Yamato Group’s corporate customers, as well as the consumers they serve, through the creation of innovative logistics solutions.
BIZ-Logistics
• Favorable results from services related to B2B logistics
• Actively promoted sales in such ways as acquiring new customers for services that help revolutionize logistics operations, including medical device loaner support (storage, cleaning, and delivery) for medical service providers
• Sluggish movement of goods in the trading logistics services of the overseas business
• Number of recalls decreased for multi maintenance services compared with the previous fiscal year
• As a result of the above, operating revenue rose while operating income declined
Composition Ratio of Operating Revenues
Breakdown of the Composition Ratio
of Operating Revenues
■ Trading logistics service 2.4%
■ Sales and Logistics 2.8%
■ Multi maintenance 0.9%
■ Products Logistics* 0.3%
■ Others 3.0%
A Look Back at the Year Ended March 31, 2017
7.4%
* Starting with fiscal year ended March 31, 2017, the name of “Export Factory” has been changed to “Products Logistics.”
Overview of Operations by Segment
Total Support for Japanese Companies Entering the E-Commerce Industry in China
At Yamato Global Logistics Japan Co., Ltd., which provides international logistics services, we commenced one-stop support services for Japanese companies utilizing JD Worldwide, a cross-border e-commerce platform in China that handles Japanese products. These services cover everything from setting up stores to displaying and delivering products. Collaborating with the major Chinese e-commerce mall operator JD.com, Inc. and with JD.com’s official partner in overseas e-commerce malls FRANK, we are providing guidance to Japanese manufacturers, retailers, and e-commerce business operators on opening stores and displaying products on JD.com’s e-commerce websites. In addition, by leveraging the parcel shipping service Yamato China Direct, products can be shipped from designated warehouses in Japan to buyers in China in as little as four days. This service allows sellers and store operators to totally outsource operations, from backyard operations to store management and delivery to end users. The service also allows buyers to easily purchase Japanese products via the Internet.
08 YAMATO HOLDINGS CO., LTD. Annual Review 2017
Overview of Operations by Segment
60,000
40,000
20,000
0 2013/3 2014/3 2015/3 2017/32016/3
1,200
0
600
(600) 2013/3 2014/3 2015/3 2017/32016/3
Operating Revenues (¥ million)
Operating Income (¥ million)
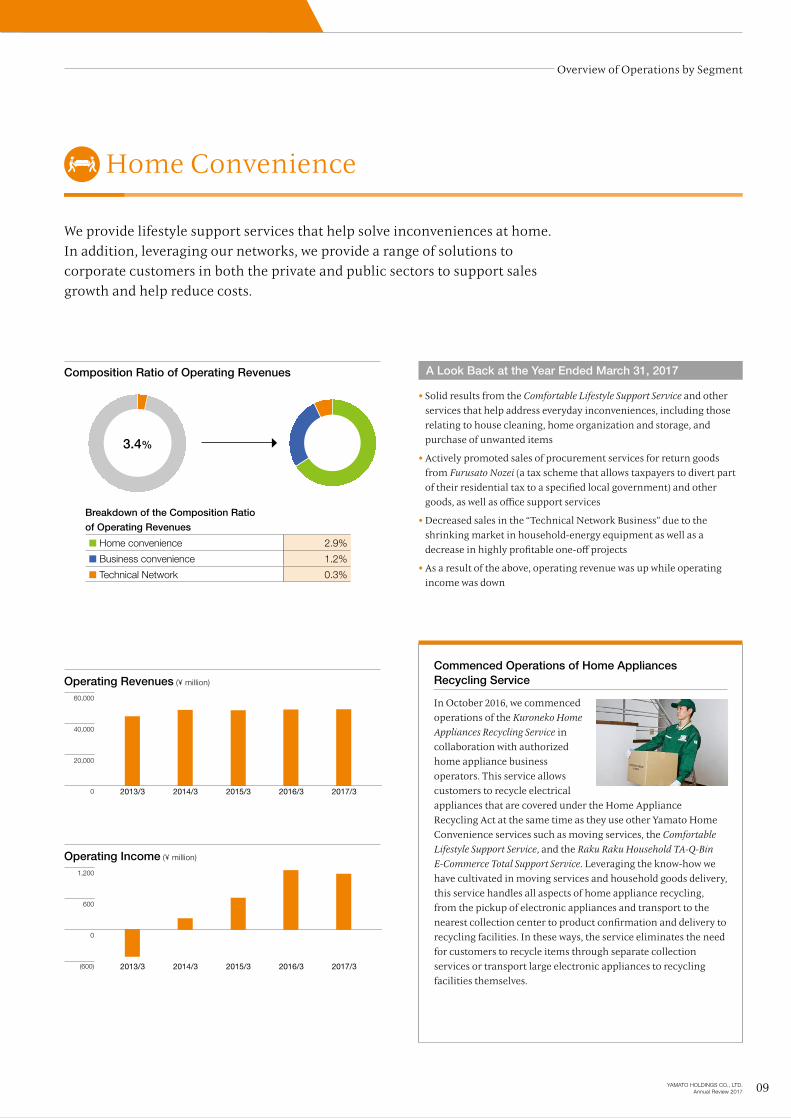
We provide lifestyle support services that help solve inconveniences at home. In addition, leveraging our networks, we provide a range of solutions to corporate customers in both the private and public sectors to support sales growth and help reduce costs.
Home Convenience
• Solid results from the Comfortable Lifestyle Support Service and other services that help address everyday inconveniences, including those relating to house cleaning, home organization and storage, and purchase of unwanted items
• Actively promoted sales of procurement services for return goods from Furusato Nozei (a tax scheme that allows taxpayers to divert part of their residential tax to a specified local government) and other goods, as well as office support services
• Decreased sales in the “Technical Network Business” due to the shrinking market in household-energy equipment as well as a decrease in highly profitable one-off projects
• As a result of the above, operating revenue was up while operating income was down
Composition Ratio of Operating Revenues
Breakdown of the Composition Ratio
of Operating Revenues
■ Home convenience 2.9%
■ Business convenience 1.2%
■ Technical Network 0.3%
A Look Back at the Year Ended March 31, 2017
3.4%
Commenced Operations of Home Appliances Recycling Service
In October 2016, we commenced operations of the Kuroneko Home Appliances Recycling Service in collaboration with authorized home appliance business operators. This service allows customers to recycle electrical appliances that are covered under the Home Appliance Recycling Act at the same time as they use other Yamato Home Convenience services such as moving services, the Comfortable Lifestyle Support Service, and the Raku Raku Household TA-Q-Bin E-Commerce Total Support Service. Leveraging the know-how we have cultivated in moving services and household goods delivery, this service handles all aspects of home appliance recycling, from the pickup of electronic appliances and transport to the nearest collection center to product confirmation and delivery to recycling facilities. In these ways, the service eliminates the need for customers to recycle items through separate collection services or transport large electronic appliances to recycling facilities themselves.
09YAMATO HOLDINGS CO., LTD. Annual Review 2017
50,000
40,000
20,000
30,000
10,000
0 2013/3 2014/3 2015/3 2017/32016/3
12,000
6,000
9,000
3,000
0 2013/3 2014/3 2015/3 2017/32016/3
Operating Revenues (¥ million)
Operating Income (¥ million)
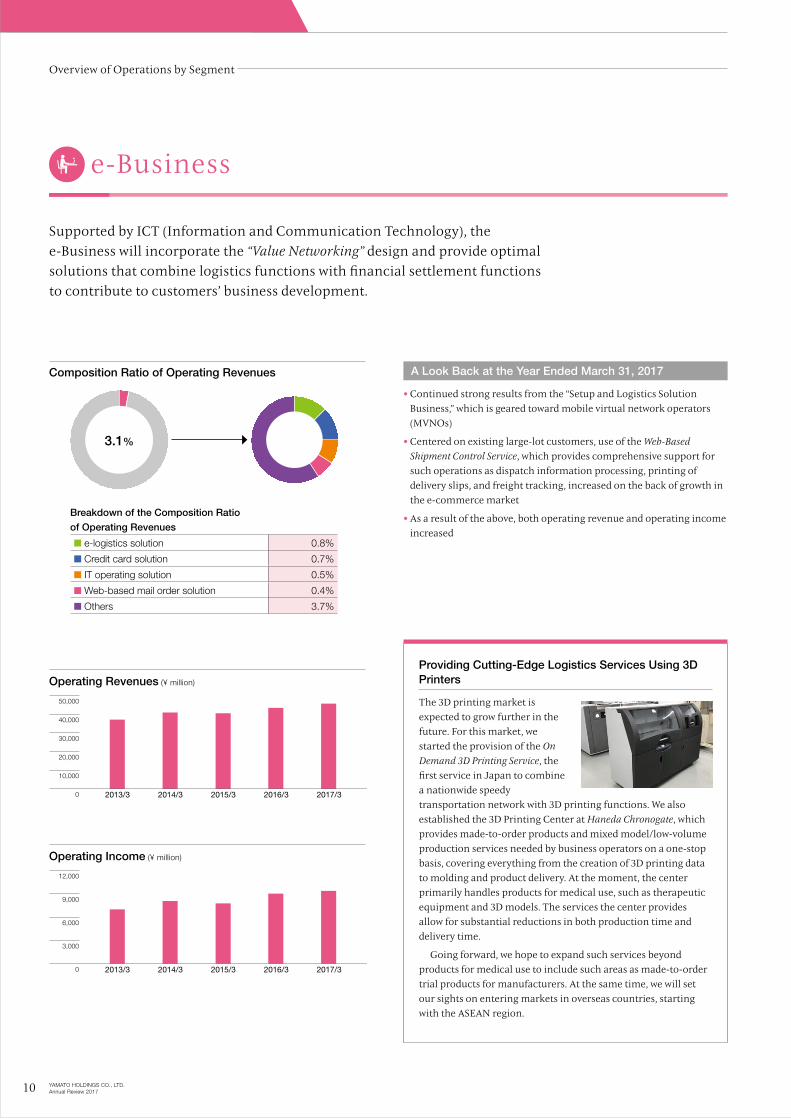
Supported by ICT (Information and Communication Technology), the e-Business will incorporate the “Value Networking” design and provide optimal solutions that combine logistics functions with financial settlement functions to contribute to customers’ business development.
e-Business
Composition Ratio of Operating Revenues A Look Back at the Year Ended March 31, 2017
Providing Cutting-Edge Logistics Services Using 3D Printers
The 3D printing market is expected to grow further in the future. For this market, we started the provision of the On Demand 3D Printing Service, the first service in Japan to combine a nationwide speedy transportation network with 3D printing functions. We also established the 3D Printing Center at Haneda Chronogate, which provides made-to-order products and mixed model/low-volume production services needed by business operators on a one-stop basis, covering everything from the creation of 3D printing data to molding and product delivery. At the moment, the center primarily handles products for medical use, such as therapeutic equipment and 3D models. The services the center provides allow for substantial reductions in both production time and delivery time.
Going forward, we hope to expand such services beyond products for medical use to include such areas as made-to-order trial products for manufacturers. At the same time, we will set our sights on entering markets in overseas countries, starting with the ASEAN region.
Breakdown of the Composition Ratio
of Operating Revenues
■ e-logistics solution 0.8%
■ Credit card solution 0.7%
■ IT operating solution 0.5%
■ Web-based mail order solution 0.4%
■ Others 3.7%
3.1%
• Continued strong results from the “Setup and Logistics Solution Business,” which is geared toward mobile virtual network operators (MVNOs)
• Centered on existing large-lot customers, use of the Web-Based Shipment Control Service, which provides comprehensive support for such operations as dispatch information processing, printing of delivery slips, and freight tracking, increased on the back of growth in the e-commerce market
• As a result of the above, both operating revenue and operating income increased
Overview of Operations by Segment
10 YAMATO HOLDINGS CO., LTD. Annual Review 2017
80,000
40,000
60,000
20,000
0 2013/3 2014/3 2015/3 2017/32016/3
12,000
6,000
9,000
3,000
0 2013/3 2014/3 2015/3 2017/32016/3
Operating Revenues (¥ million)
Operating Income (¥ million)
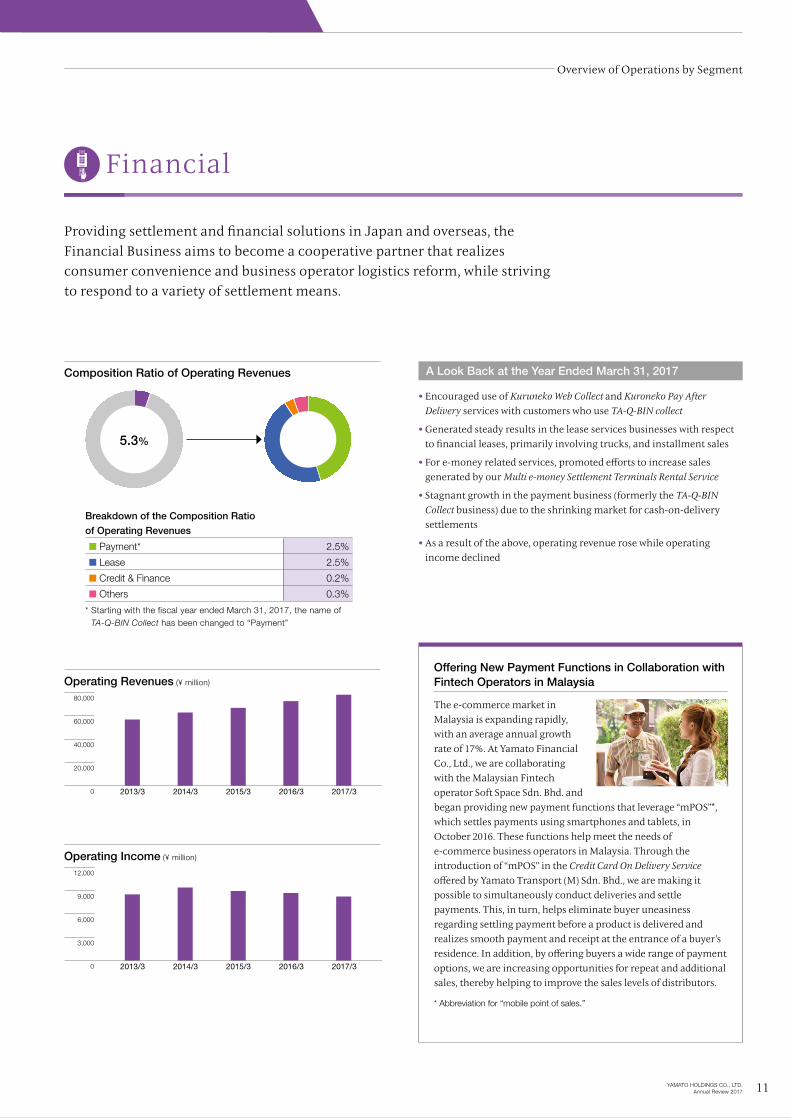
Providing settlement and financial solutions in Japan and overseas, the Financial Business aims to become a cooperative partner that realizes consumer convenience and business operator logistics reform, while striving to respond to a variety of settlement means.
Financial
• Encouraged use of Kuruneko Web Collect and Kuroneko Pay After Delivery services with customers who use TA-Q-BIN collect
• Generated steady results in the lease services businesses with respect to financial leases, primarily involving trucks, and installment sales
• For e-money related services, promoted efforts to increase sales generated by our Multi e-money Settlement Terminals Rental Service
• Stagnant growth in the payment business (formerly the TA-Q-BIN Collect business) due to the shrinking market for cash-on-delivery settlements
• As a result of the above, operating revenue rose while operating income declined
Composition Ratio of Operating Revenues A Look Back at the Year Ended March 31, 2017
5.3%
Breakdown of the Composition Ratio
of Operating Revenues
■ Payment* 2.5%
■ Lease 2.5%
■ Credit & Finance 0.2%
■ Others 0.3%
* Starting with the fiscal year ended March 31, 2017, the name of TA-Q-BIN Collect has been changed to “Payment”
Offering New Payment Functions in Collaboration with Fintech Operators in Malaysia
The e-commerce market in Malaysia is expanding rapidly, with an average annual growth rate of 17%. At Yamato Financial Co., Ltd., we are collaborating with the Malaysian Fintech operator Soft Space Sdn. Bhd. and began providing new payment functions that leverage “mPOS”*, which settles payments using smartphones and tablets, in October 2016. These functions help meet the needs of e-commerce business operators in Malaysia. Through the introduction of “mPOS” in the Credit Card On Delivery Service offered by Yamato Transport (M) Sdn. Bhd., we are making it possible to simultaneously conduct deliveries and settle payments. This, in turn, helps eliminate buyer uneasiness regarding settling payment before a product is delivered and realizes smooth payment and receipt at the entrance of a buyer’s residence. In addition, by offering buyers a wide range of payment options, we are increasing opportunities for repeat and additional sales, thereby helping to improve the sales levels of distributors.
* Abbreviation for “mobile point of sales.”
Overview of Operations by Segment
11YAMATO HOLDINGS CO., LTD. Annual Review 2017
30,000
20,000
10,000
0 2013/3 2014/3 2015/3 2017/32016/3
4,000
2,000
3,000
1,000
0 2013/3 2014/3 2015/3 2017/32016/3
Operating Revenues (¥ million)
Operating Income (¥ million)
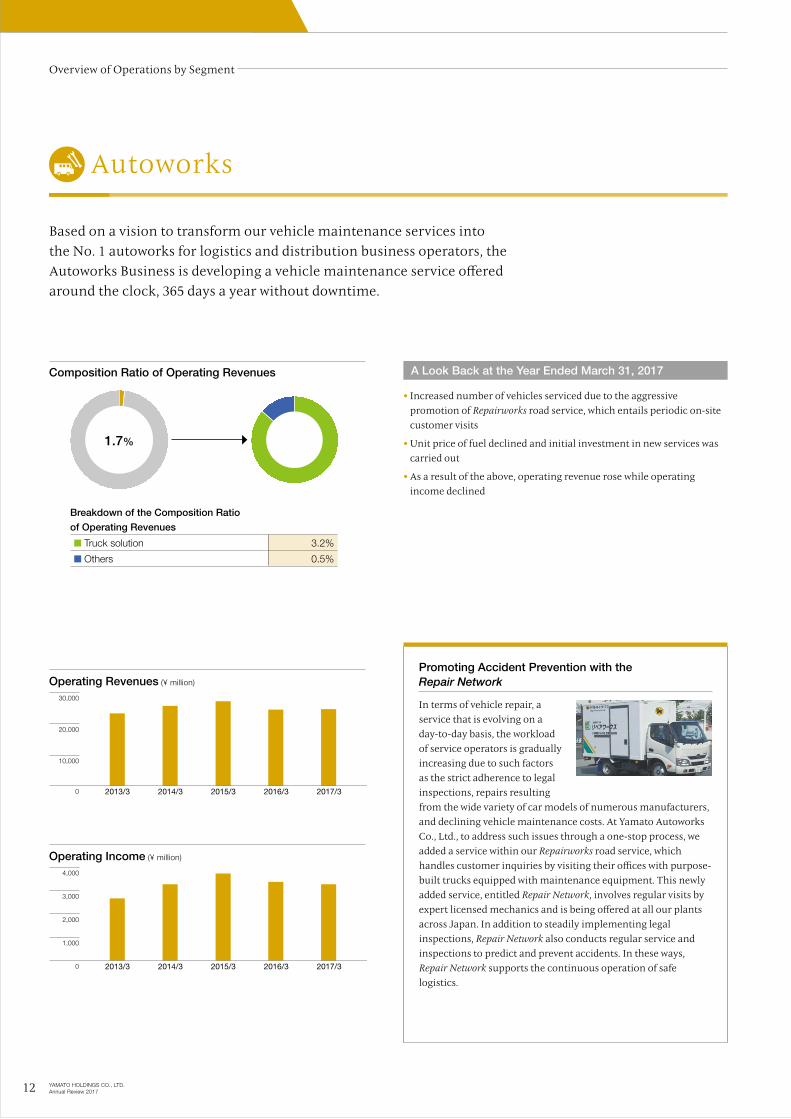
Based on a vision to transform our vehicle maintenance services into the No. 1 autoworks for logistics and distribution business operators, the Autoworks Business is developing a vehicle maintenance service offered around the clock, 365 days a year without downtime.
Autoworks
• Increased number of vehicles serviced due to the aggressive promotion of Repairworks road service, which entails periodic on-site customer visits
• Unit price of fuel declined and initial investment in new services was carried out
• As a result of the above, operating revenue rose while operating income declined
Composition Ratio of Operating Revenues
Breakdown of the Composition Ratio
of Operating Revenues
■ Truck solution 3.2%
■ Others 0.5%
A Look Back at the Year Ended March 31, 2017
1.7%
Promoting Accident Prevention with the Repair Network
In terms of vehicle repair, a service that is evolving on a day-to-day basis, the workload of service operators is gradually increasing due to such factors as the strict adherence to legal inspections, repairs resulting from the wide variety of car models of numerous manufacturers, and declining vehicle maintenance costs. At Yamato Autoworks Co., Ltd., to address such issues through a one-stop process, we added a service within our Repairworks road service, which handles customer inquiries by visiting their offices with purpose-built trucks equipped with maintenance equipment. This newly added service, entitled Repair Network, involves regular visits by expert licensed mechanics and is being offered at all our plants across Japan. In addition to steadily implementing legal inspections, Repair Network also conducts regular service and inspections to predict and prevent accidents. In these ways, Repair Network supports the continuous operation of safe logistics.
Overview of Operations by Segment
12 YAMATO HOLDINGS CO., LTD. Annual Review 2017
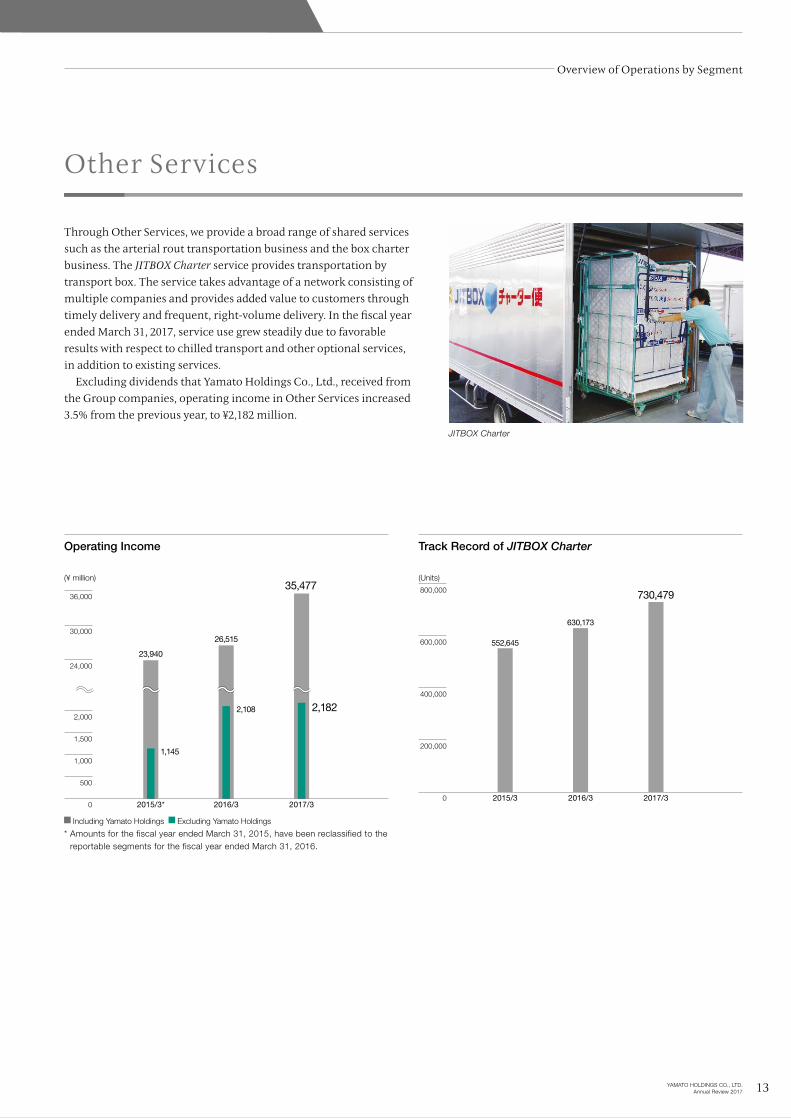
Through Other Services, we provide a broad range of shared services such as the arterial rout transportation business and the box charter business. The JITBOX Charter service provides transportation by transport box. The service takes advantage of a network consisting of multiple companies and provides added value to customers through timely delivery and frequent, right-volume delivery. In the fiscal year ended March 31, 2017, service use grew steadily due to favorable results with respect to chilled transport and other optional services, in addition to existing services. Excluding dividends that Yamato Holdings Co., Ltd., received from the Group companies, operating income in Other Services increased 3.5% from the previous year, to ¥2,182 million.
2015/3* 2016/3 2017/3
35,477
2,182
26,515
2,108
23,940
1,145
0
36,000
30,000
24,000
2,000
1,500
1,000
500
2015/3 2016/3 2017/3
730,479
630,173
552,645
0
200,000
400,000
600,000
800,000
Operating Income
(¥ million)
Track Record of JITBOX Charter
(Units)
Including Yamato Holdings Excluding Yamato Holdings
* Amounts for the fiscal year ended March 31, 2015, have been reclassified to the reportable segments for the fiscal year ended March 31, 2016.
JITBOX Charter
Other Services
Overview of Operations by Segment
13YAMATO HOLDINGS CO., LTD. Annual Review 2017
Before
ESG
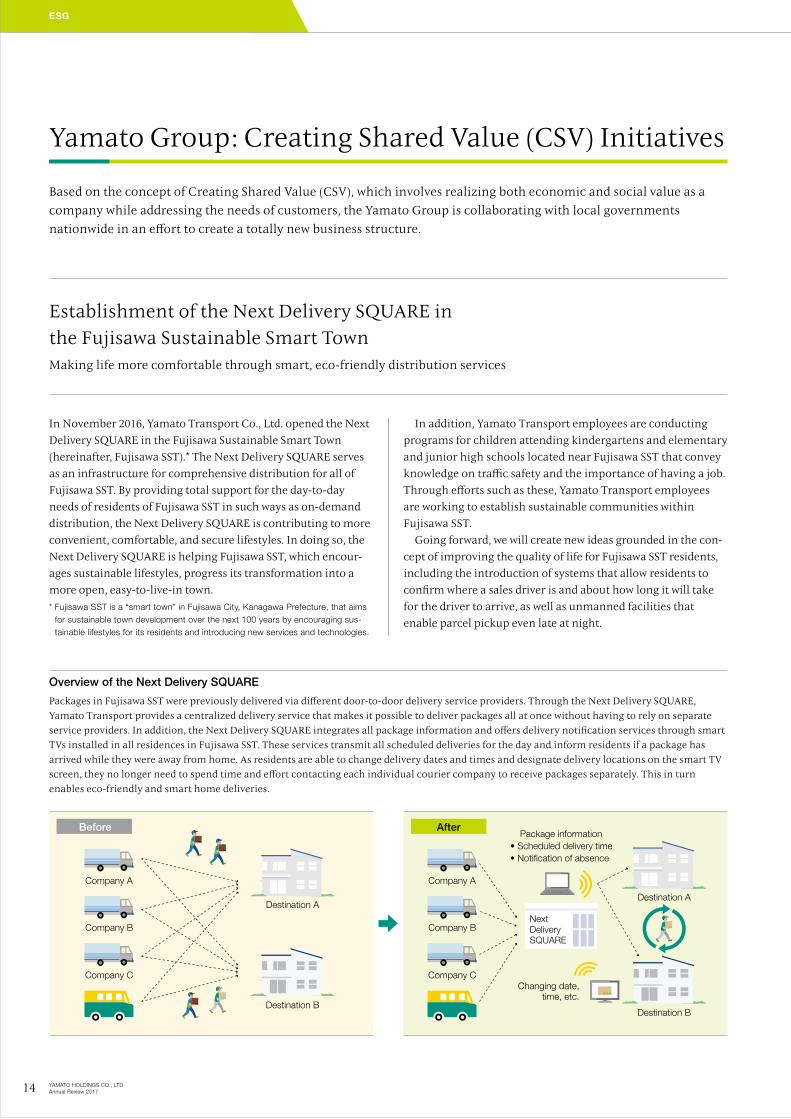
Based on the concept of Creating Shared Value (CSV), which involves realizing both economic and social value as a company while addressing the needs of customers, the Yamato Group is collaborating with local governments nationwide in an effort to create a totally new business structure.
In November 2016, Yamato Transport Co., Ltd. opened the Next Delivery SQUARE in the Fujisawa Sustainable Smart Town (hereinafter, Fujisawa SST).* The Next Delivery SQUARE serves as an infrastructure for comprehensive distribution for all of Fujisawa SST. By providing total support for the day-to-day needs of residents of Fujisawa SST in such ways as on-demand distribution, the Next Delivery SQUARE is contributing to more convenient, comfortable, and secure lifestyles. In doing so, the Next Delivery SQUARE is helping Fujisawa SST, which encour-ages sustainable lifestyles, progress its transformation into a more open, easy-to-live-in town.* Fujisawa SST is a “smart town” in Fujisawa City, Kanagawa Prefecture, that aims
for sustainable town development over the next 100 years by encouraging sus-tainable lifestyles for its residents and introducing new services and technologies.
In addition, Yamato Transport employees are conducting programs for children attending kindergartens and elementary and junior high schools located near Fujisawa SST that convey knowledge on traffic safety and the importance of having a job. Through efforts such as these, Yamato Transport employees are working to establish sustainable communities within Fujisawa SST. Going forward, we will create new ideas grounded in the con-cept of improving the quality of life for Fujisawa SST residents, including the introduction of systems that allow residents to confirm where a sales driver is and about how long it will take for the driver to arrive, as well as unmanned facilities that enable parcel pickup even late at night.
Yamato Group: Creating Shared Value (CSV) Initiatives
Establishment of the Next Delivery SQUARE in the Fujisawa Sustainable Smart Town Making life more comfortable through smart, eco-friendly distribution services
Overview of the Next Delivery SQUARE
Packages in Fujisawa SST were previously delivered via different door-to-door delivery service providers. Through the Next Delivery SQUARE, Yamato Transport provides a centralized delivery service that makes it possible to deliver packages all at once without having to rely on separate service providers. In addition, the Next Delivery SQUARE integrates all package information and offers delivery notification services through smart TVs installed in all residences in Fujisawa SST. These services transmit all scheduled deliveries for the day and inform residents if a package has arrived while they were away from home. As residents are able to change delivery dates and times and designate delivery locations on the smart TV screen, they no longer need to spend time and effort contacting each individual courier company to receive packages separately. This in turn enables eco-friendly and smart home deliveries.
After
Company A Company A
Company B Company B
Company C Company C
Destination A
Destination BDestination B
Next Delivery SQUARE
Destination A
Package information• Scheduled delivery time• Notification of absence
Changing date, time, etc.
14 YAMATO HOLDINGS CO., LTD. Annual Review 2017
Concluded Agreement with the Tokyo Metropolitan Government to Support the ElderlyTo realize local communities in which elderly people and their families can continue to live comfortably and with peace of mind, Yamato Transport entered into an agreement with the Tokyo Metropolitan Government to help support the elderly. Under this agreement, our sales drivers will not only watch over elderly residents, they will also provide support to elderly people suffering from dementia and their families by notifying relevant institutions in cases where they observe signs of fraud or other acts that harm consumers. In doing so, our drivers will help address local issues and invigorate local communities.
Change: Advance of social issues, such as Japan’s decreasing birthrate and aging population
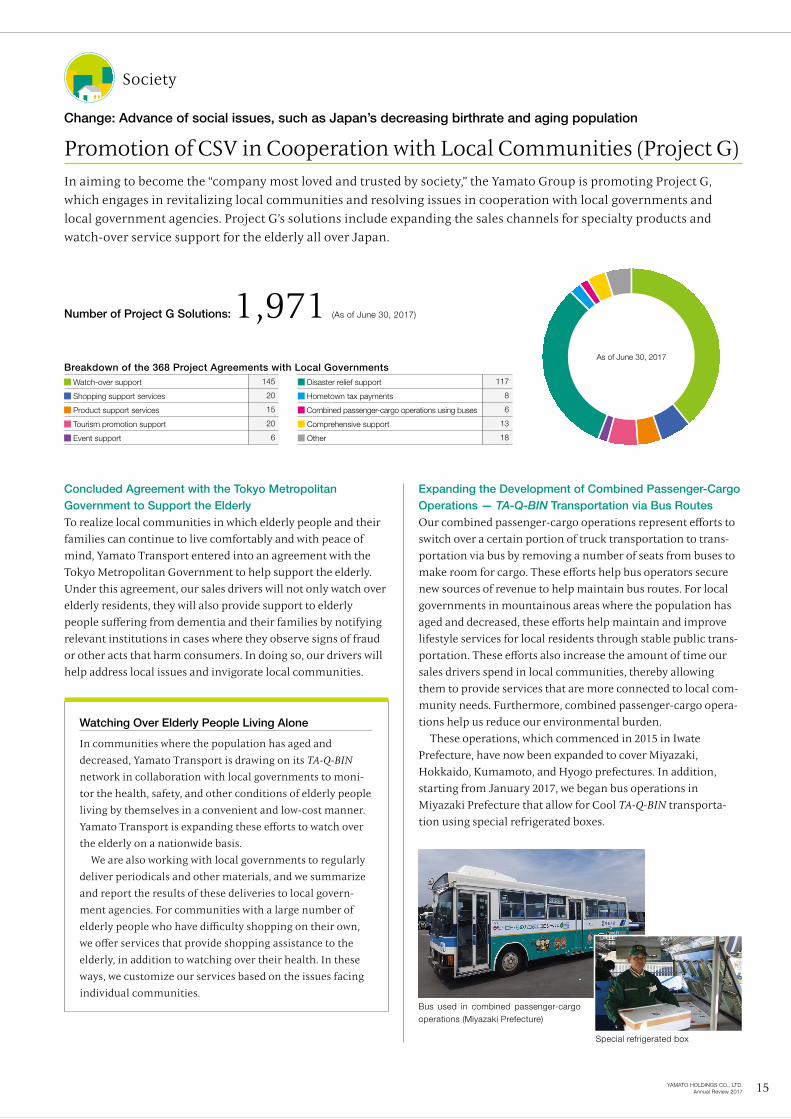
Promotion of CSV in Cooperation with Local Communities (Project G)In aiming to become the “company most loved and trusted by society,” the Yamato Group is promoting Project G, which engages in revitalizing local communities and resolving issues in cooperation with local governments and local government agencies. Project G’s solutions include expanding the sales channels for specialty products and watch-over service support for the elderly all over Japan.
Number of Project G Solutions: 1,971 (As of June 30, 2017)
As of June 30, 2017
Society
Watching Over Elderly People Living Alone
In communities where the population has aged and decreased, Yamato Transport is drawing on its TA-Q-BIN network in collaboration with local governments to moni-tor the health, safety, and other conditions of elderly people living by themselves in a convenient and low-cost manner. Yamato Transport is expanding these efforts to watch over the elderly on a nationwide basis. We are also working with local governments to regularly deliver periodicals and other materials, and we summarize and report the results of these deliveries to local govern-ment agencies. For communities with a large number of elderly people who have difficulty shopping on their own, we offer services that provide shopping assistance to the elderly, in addition to watching over their health. In these ways, we customize our services based on the issues facing individual communities.
Bus used in combined passenger-cargo operations (Miyazaki Prefecture)
Special refrigerated box
Breakdown of the 368 Project Agreements with Local Governments
Watch-over support 145
Shopping support services 20
Product support services 15
Tourism promotion support 20
Event support 6
Disaster relief support 117
Hometown tax payments 8
Combined passenger-cargo operations using buses 6
Comprehensive support 13
Other 18
Expanding the Development of Combined Passenger-Cargo Operations — TA-Q-BIN Transportation via Bus RoutesOur combined passenger-cargo operations represent efforts to switch over a certain portion of truck transportation to trans-portation via bus by removing a number of seats from buses to make room for cargo. These efforts help bus operators secure new sources of revenue to help maintain bus routes. For local governments in mountainous areas where the population has aged and decreased, these efforts help maintain and improve lifestyle services for local residents through stable public trans-portation. These efforts also increase the amount of time our sales drivers spend in local communities, thereby allowing them to provide services that are more connected to local com-munity needs. Furthermore, combined passenger-cargo opera-tions help us reduce our environmental burden. These operations, which commenced in 2015 in Iwate Prefecture, have now been expanded to cover Miyazaki, Hokkaido, Kumamoto, and Hyogo prefectures. In addition, starting from January 2017, we began bus operations in Miyazaki Prefecture that allow for Cool TA-Q-BIN transporta-tion using special refrigerated boxes.
15YAMATO HOLDINGS CO., LTD. Annual Review 2017
Safety Management Disclosure InformationWith ensuring the safety of transport business operators as its goal, the Yamato Group has built up a transport safety management system, based on the Transport Safety Management System stipulated by the Ministry of Land, Infrastructure, Transport and Tourism, and remains actively involved in its implementation. Results for the fiscal year ended March 31, 2017, and part of the goals for the fiscal year ending March 31, 2018, are listed below.
Training of Sales Drivers Who Prioritize Safety Above All ElseTo train excellent drivers who prioritize safety above all else, the Yamato Group has expanded and upgraded its training system and engages in the provision of detailed guidance on a daily basis. Yamato Transport drivers hired following a rigorous aptitude test receive training when they join the Company that includes safety training and other training for approximately one month after they have entered the Company. After earning their internal Yamato licenses, they come to the actual business of driving for the first time. Even after that, they hone their driving skills through training sessions one year after joining, regular ride along instruction and on-the-road patrols by safety experts and managers, and a driving manager aptitude examination once every three years.
Safety Measures toward Achievement of Zero AccidentsThe Yamato Group deems community streets and roads as the places to carry out its business activities. Based on our corporate stance of thorough safety management that keeps respect for human life as its top priority, the Group thoroughly adheres to its philosophy of placing safety first and business second to maintain respect for human life as a priority at all times.
Transport Safety Goals and Achievement Status (Yamato Transport Co., Ltd.)
Traffic Accidents
ItemResults for the fiscal year ended March 31, 2017
Goal for the fiscal year ending March 31, 2018
No. of serious traffic accidents 4 0
No. of serious work-related accidents 0 0
Source: Yamato Transport’s publicly disclosed “Transport Safety Management” information (Japanese-language only)
Results for the Fiscal Year Ended March 31, 2017
Results for the Fiscal Year Ended March 31, 2017 1. Operating expenses for on-board See-T Navi systems ...................¥336.0 million 2. Long-running no accident commendation awardees amount .........¥604.5 million
3. Expenses related to long-running no accident commendation ceremony ...................................................¥62.0 million
4. Expenses related to Nationwide Safety Meet ......................................¥7.1 million
5. Introduction of Event Data Recorders ...............................................¥62.0 million
Budget Plan for the Fiscal Year Ending March 31, 2018 1. Operating expenses for on-board See-T Navi systems ...................¥312.0 million
2. Long-running no accident commendation awardees amount .........¥567.0 million
3. Expenses related to long-running no accident commendation ceremony ...................................................¥71.5 million
4. Expenses related to Nationwide Safety Meet ......................................¥8.2 million
5. Introduction of Event Data Recorders .............................................¥383.0 million
6. Safety-related training for team leaders...............................................¥6.0 million
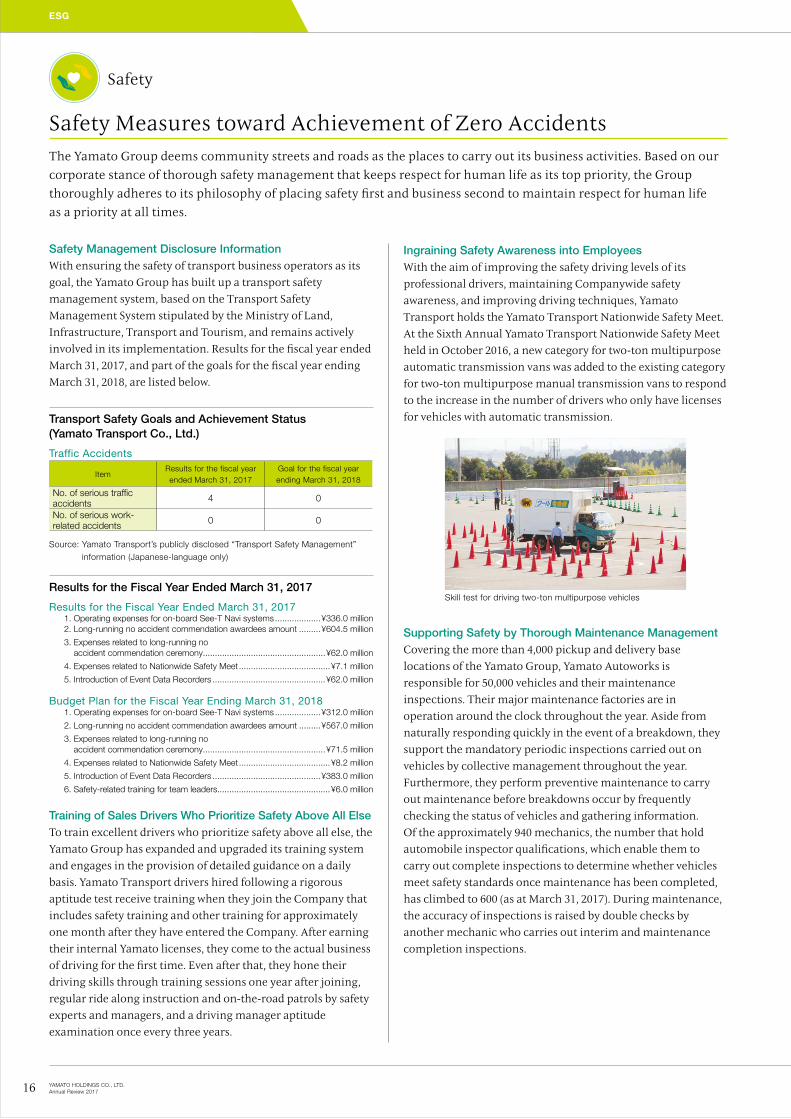
Ingraining Safety Awareness into EmployeesWith the aim of improving the safety driving levels of its professional drivers, maintaining Companywide safety awareness, and improving driving techniques, Yamato Transport holds the Yamato Transport Nationwide Safety Meet. At the Sixth Annual Yamato Transport Nationwide Safety Meet held in October 2016, a new category for two-ton multipurpose automatic transmission vans was added to the existing category for two-ton multipurpose manual transmission vans to respond to the increase in the number of drivers who only have licenses for vehicles with automatic transmission.
Supporting Safety by Thorough Maintenance ManagementCovering the more than 4,000 pickup and delivery base locations of the Yamato Group, Yamato Autoworks is responsible for 50,000 vehicles and their maintenance inspections. Their major maintenance factories are in operation around the clock throughout the year. Aside from naturally responding quickly in the event of a breakdown, they support the mandatory periodic inspections carried out on vehicles by collective management throughout the year. Furthermore, they perform preventive maintenance to carry out maintenance before breakdowns occur by frequently checking the status of vehicles and gathering information. Of the approximately 940 mechanics, the number that hold automobile inspector qualifications, which enable them to carry out complete inspections to determine whether vehicles meet safety standards once maintenance has been completed, has climbed to 600 (as at March 31, 2017). During maintenance, the accuracy of inspections is raised by double checks by another mechanic who carries out interim and maintenance completion inspections.
Safety
Skill test for driving two-ton multipurpose vehicles
ESG
16 YAMATO HOLDINGS CO., LTD. Annual Review 2017
Introduction of Semi-trailers and Full Trailers with New StandardsWith the aim of improving the efficiency of high-frequency, trunk-route transportation between Atsugi Gateway, Chubu Gateway, and Kansai Gateway, we collaborated with automo-bile manufacturers to introduce Japan’s first ever van-type semi-trailers and full trailers with new standards and a longer overall trailer length compared with conventional models. The new semi-trailers have roughly 8% greater load-ing capacity compared with conventional models, while the full trailers have approximately 23% greater loading capac-ity. This increase in loading capacity will help us realize more efficient high-frequency, trunk-route transportation and reduce CO2 emissions.
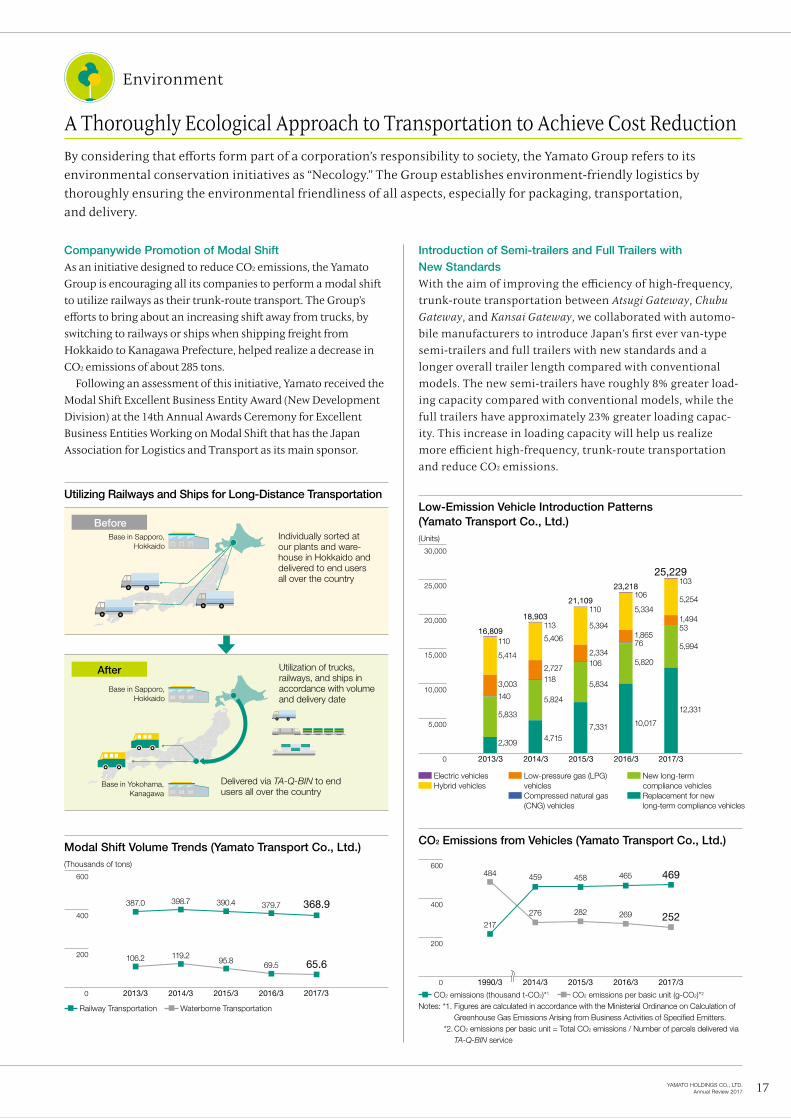
Companywide Promotion of Modal ShiftAs an initiative designed to reduce CO2 emissions, the Yamato Group is encouraging all its companies to perform a modal shift to utilize railways as their trunk-route transport. The Group’s efforts to bring about an increasing shift away from trucks, by switching to railways or ships when shipping freight from Hokkaido to Kanagawa Prefecture, helped realize a decrease in CO2 emissions of about 285 tons. Following an assessment of this initiative, Yamato received the Modal Shift Excellent Business Entity Award (New Development Division) at the 14th Annual Awards Ceremony for Excellent Business Entities Working on Modal Shift that has the Japan Association for Logistics and Transport as its main sponsor.
A Thoroughly Ecological Approach to Transportation to Achieve Cost ReductionBy considering that efforts form part of a corporation’s responsibility to society, the Yamato Group refers to its environmental conservation initiatives as “Necology.” The Group establishes environment-friendly logistics by thoroughly ensuring the environmental friendliness of all aspects, especially for packaging, transportation, and delivery.
2013/3 2017/32014/3 2015/3 2016/3
18,903
2,309 4,715
5,824
1182,727
5,406
113
21,109
5,834
7,331
1062,334
5,394
110
23,218
5,820
10,017
761,865
5,334
106
25,229
5,994
12,331
531,494
5,254
103
5,833
140
3,003
5,414
11016,809
0
5,000
10,000
15,000
20,000
25,000
30,000
Low-Emission Vehicle Introduction Patterns (Yamato Transport Co., Ltd.)(Units)
390.4
95.8
398.7
119.2
387.0
106.2
379.7
69.5
368.9
65.6
2014/32013/3 2017/32015/3 2016/30
200
400
600
Modal Shift Volume Trends (Yamato Transport Co., Ltd.)(Thousands of tons)
Railway Transportation Waterborne Transportation
2014/3 2017/31990/3 2015/3 2016/30
200
400
600
458
282
459
276
484
217
469
252
465
269
CO2 Emissions from Vehicles (Yamato Transport Co., Ltd.)
CO2 emissions (thousand t-CO2)*1 CO2 emissions per basic unit (g-CO2)*2
Notes: *1. Figures are calculated in accordance with the Ministerial Ordinance on Calculation of Greenhouse Gas Emissions Arising from Business Activities of Specified Emitters.
*2. CO2 emissions per basic unit = Total CO2 emissions / Number of parcels delivered via TA-Q-BIN service
After
Before
Utilization of trucks, railways, and ships in accordance with volume and delivery date
Delivered via TA-Q-BIN to end users all over the country
Individually sorted at our plants and ware-house in Hokkaido and delivered to end users all over the country
Base in Sapporo, Hokkaido
Base in Sapporo, Hokkaido
Utilizing Railways and Ships for Long-Distance Transportation
Environment
Base in Yokohama, Kanagawa
Electric vehicles Hybrid vehicles
Low-pressure gas (LPG) vehicles Compressed natural gas (CNG) vehicles
New long-term compliance vehicles Replacement for new long-term compliance vehicles
17YAMATO HOLDINGS CO., LTD. Annual Review 2017
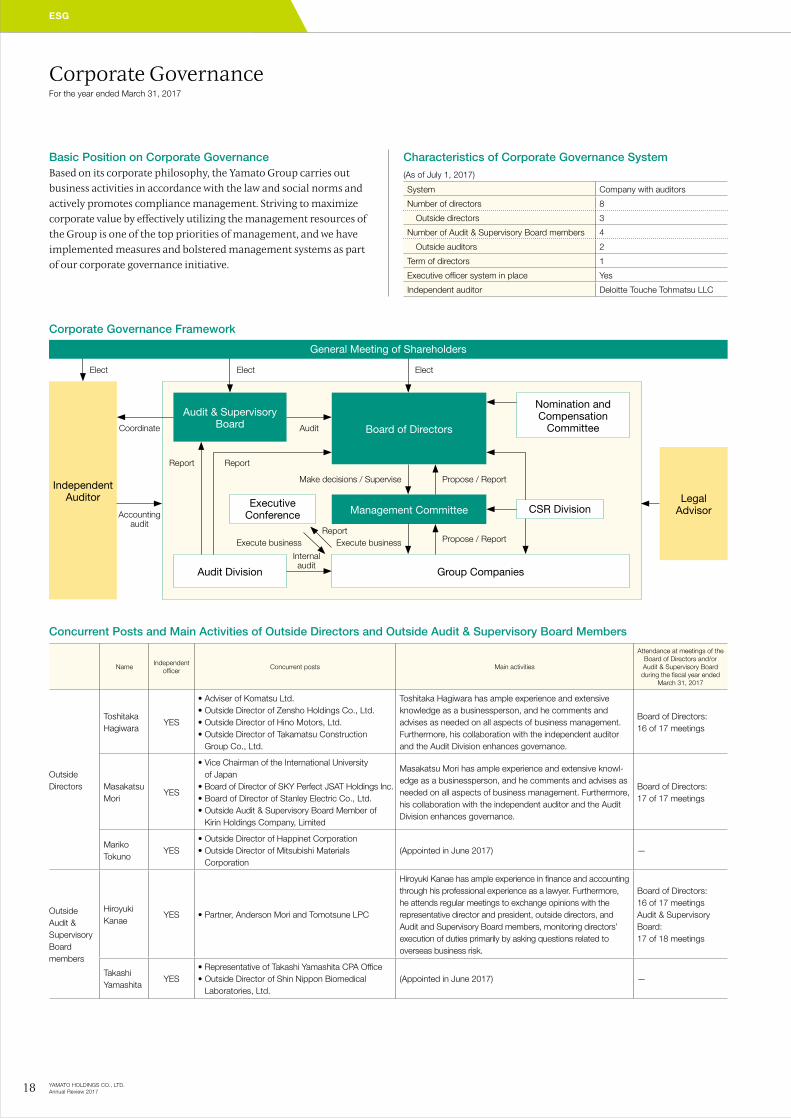
Corporate GovernanceFor the year ended March 31, 2017
Characteristics of Corporate Governance System
(As of July 1, 2017)
System Company with auditors
Number of directors 8
Outside directors 3
Number of Audit & Supervisory Board members 4
Outside auditors 2
Term of directors 1
Executive officer system in place Yes
Independent auditor Deloitte Touche Tohmatsu LLC
Basic Position on Corporate GovernanceBased on its corporate philosophy, the Yamato Group carries out business activities in accordance with the law and social norms and actively promotes compliance management. Striving to maximize corporate value by effectively utilizing the management resources of the Group is one of the top priorities of management, and we have implemented measures and bolstered management systems as part of our corporate governance initiative.
Concurrent Posts and Main Activities of Outside Directors and Outside Audit & Supervisory Board Members
NameIndependent
officerConcurrent posts Main activities
Attendance at meetings of the Board of Directors and/or Audit & Supervisory Board during the fiscal year ended
March 31, 2017
Outside Directors
Toshitaka Hagiwara
YES
• Adviser of Komatsu Ltd.• Outside Director of Zensho Holdings Co., Ltd.• Outside Director of Hino Motors, Ltd.• Outside Director of Takamatsu Construction
Group Co., Ltd.
Toshitaka Hagiwara has ample experience and extensive knowledge as a businessperson, and he comments and advises as needed on all aspects of business management. Furthermore, his collaboration with the independent auditor and the Audit Division enhances governance.
Board of Directors:16 of 17 meetings
Masakatsu Mori
YES
• Vice Chairman of the International University of Japan
• Board of Director of SKY Perfect JSAT Holdings Inc.• Board of Director of Stanley Electric Co., Ltd.• Outside Audit & Supervisory Board Member of
Kirin Holdings Company, Limited
Masakatsu Mori has ample experience and extensive knowl-edge as a businessperson, and he comments and advises as needed on all aspects of business management. Furthermore, his collaboration with the independent auditor and the Audit Division enhances governance.
Board of Directors:17 of 17 meetings
Mariko Tokuno
YES• Outside Director of Happinet Corporation• Outside Director of Mitsubishi Materials
Corporation(Appointed in June 2017) —
Outside Audit & Supervisory Board members
Hiroyuki Kanae
YES • Partner, Anderson Mori and Tomotsune LPC
Hiroyuki Kanae has ample experience in finance and accounting through his professional experience as a lawyer. Furthermore, he attends regular meetings to exchange opinions with the representative director and president, outside directors, and Audit and Supervisory Board members, monitoring directors’ execution of duties primarily by asking questions related to overseas business risk.
Board of Directors:16 of 17 meetingsAudit & Supervisory Board:17 of 18 meetings
Takashi Yamashita
YES• Representative of Takashi Yamashita CPA Office• Outside Director of Shin Nippon Biomedical
Laboratories, Ltd.(Appointed in June 2017) —
Independent Auditor Legal
Advisor
General Meeting of Shareholders
Nomination and Compensation
Committee
Group CompaniesAudit Division
Audit & Supervisory Board Board of Directors
Management Committee
Corporate Governance Framework
Elect Elect
Coordinate
Accounting audit
Internal audit
Audit
Report
Report
Execute business
Make decisions / Supervise
Propose / ReportExecute business
Propose / Report
Elect
CSR DivisionExecutive Conference
Report
ESG
18 YAMATO HOLDINGS CO., LTD. Annual Review 2017
The Company is a company with an Audit & Supervisory Board. In addition to the Board of Directors supervising important manage-ment decision-making and business execution, Audit& Supervisory Board members and the Audit & Supervisory Board which are inde-pendent from the Board of Directors shall audit the status of execu-tion of duties by directors.
Board of Directorsn Roles and duties• The Board of Directors shall make important decisions concerning
the Company’s business and supervises the execution of duties by executive directors and executive officers.
• The Board of Directors shall recognize the medium-term manage-ment plan as one of the commitments to shareholders and do its utmost to achieve the goals of the plan. Moreover, the Board of Directors shall sufficiently analyze the initiatives aimed at realizing the goals of the medium-term management plan as well as the extent to which the plan’s objectives are being achieved. In addition to providing explanations to shareholders, such analyses shall be reflected in future management plans.
• The Board of Directors shall encourage executive officers to demon-strate a healthy entrepreneurial spirit and not excessively avoid or curb risk, while at the same time establishing a framework that enables it to ensure accountability.
• The scope of responsibility of each executive officer shall be decided by the Board of Directors and disclosed. Executive officers shall execute business in accordance with internal regulations.
n Management• To allow Board of Directors meeting attendees the opportunity to
prepare for meetings in advance, the Board of Directors secre-tariat shall send agenda items and related materials to directors well in advance of the meeting date and provide explanations in advance as needed.
• The annual schedule of Board of Directors meetings as well as anticipated agenda items shall be decided in advance, and this information shall be provided to directors and Audit & Supervisory Board members.
• The number of issues to be deliberated as well as the frequency of meetings shall be appropriately set, and the time of meetings shall be decided so as to allow sufficient time for deliberations.
• As needed, meetings comprising Board of Directors meeting attend-ees shall be held for the purpose of exchanging ideas, thereby encouraging lively debate.
• The effectiveness of the Board of Directors shall be evaluated through questionnaires and interviews performed by the chair.
Audit & Supervisory Boardn Roles and duties• The Audit & Supervisory Board and its members shall exercise their
authority actively and proactively, and they shall appropriately state their opinions at Board of Directors meetings as well as to members of senior management.
• The full-time Audit & Supervisory Board members shall attend Board of Directors meetings and other important meetings related to the execution of business, express reasonable opinions, hold effective Audit & Supervisory Board meetings, and ensure that information is shared and that members work together in a coordi-nated manner.
• The Audit & Supervisory Board shall regularly hold information exchange meetings for the purpose of sharing information with
outside directors, thereby ensuring more robust gathering of information and encouraging teamwork.
Nomination and Compensation Committee• The Nomination and Compensation Committee shall comprise
outside directors and the same number or fewer internal directors with an outside director serving as the committee chair.
• The committee shall deliberate on matters related to the appoint-ment or removal of senior management members based on business performance and multifaceted observations and evaluation, thereby verifying the validity of such decisions, and decide policies on com-pensation and other matters related to senior management members.
• The committee shall propose candidates as successors to the repre-sentative director to the Board of Directors, following deliberation based on multifaceted observations and evaluations of candidates’ track records, human nature, and other factors, thereby increas-ing management transparency.
Support Framework for Directors and Audit & Supervisory Board Members• The Company shall establish a support framework that enables it to
provide necessary and adequate information at the necessary time to allow directors to effectively fulfill their roles and duties.
• By participating in key business strategy meetings for the overall Group, such as the “Business Summit,” “Business Conference,” and “Management Plan Unveiling,” as well as by observing key Group business sites, including those overseas, participants are able to better understand the business strategies and provide opportunities to see how these strategies are being advanced.
• As a system to help Audit & Supervisory Board members smoothly perform their duties, employees in the internal audit division shall be appointed to assist Audit & Supervisory Board members.
• Audit & Supervisory Board members shall exercise their authority to perform investigations in accordance with the Companies Act. In addition, if a director or employee discovers a fact that could potentially inflict marked damage on the Company, he/she shall immediately report this fact to an Audit & Supervisory Board member, even if there is no request to do so from an Audit & Supervisory Board member.
• If a director or Audit & Supervisory Board member believes it to be necessary, he/she shall obtain advice from an outside expert at the Company’s expense.
• The internal audit division shall regularly hold meetings with the full-time Audit & Supervisory Board members, and provide audit reports in a planned manner to the Board of Directors and the Audit & Supervisory Board, thereby enhancing the provision of informa-tion to as well as bolstering coordination with outside directors and outside Audit & Supervisory Board members.
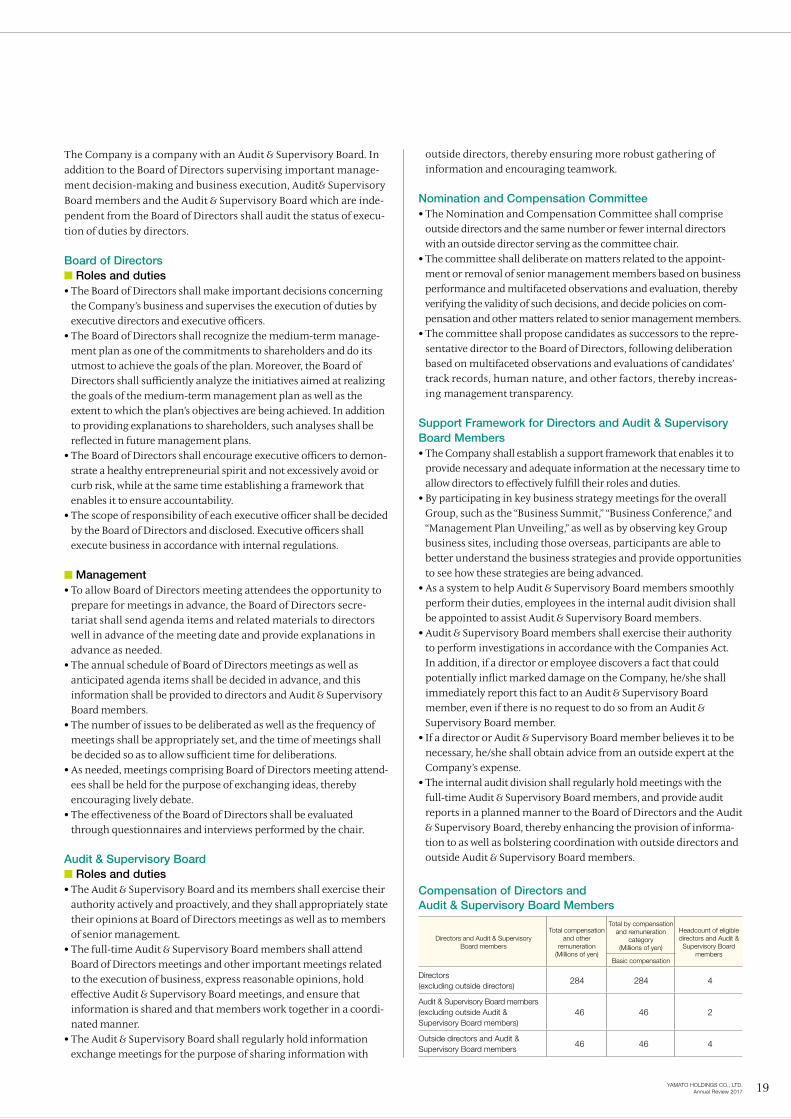
Compensation of Directors and Audit & Supervisory Board Members
Directors and Audit & Supervisory Board members
Total compensation and other
remuneration (Millions of yen)
Total by compensation and remuneration
category (Millions of yen)
Headcount of eligible directors and Audit & Supervisory Board
membersBasic compensation
Directors (excluding outside directors)
284 284 4
Audit & Supervisory Board members (excluding outside Audit & Supervisory Board members)
46 46 2
Outside directors and Audit & Supervisory Board members
46 46 4
19YAMATO HOLDINGS CO., LTD. Annual Review 2017
an outside attorney. The Company shall secure a framework in which employees who report on such violations are protected under whistle-blower regulations. Violations and responses to violations shall be regularly reported to the Compliance and Risk Committee, as well as reported to the Board of Directors if deemed necessary by the responsible officer.
Business Continuity Plan (BCP)n Revisions and maintenance to prepare for unexpected,
large-scale natural disasters and power outages, based on our experience in the Great East Japan Earthquake
The Yamato Group offers the TA-Q-BIN service as social infrastruc-ture, and it is expected to keep offering the steady service even under unforeseeable circumstances. Therefore, we formulated a business continuity plan (BCP) to prepare for these circumstances. Based on this BCP, formulated according to response guidelines focusing on maximum priority on human life and on continuation of the TA-Q-BIN business, we addressed the problems caused by the Great East Japan Earthquake that occurred in 2011 and the 2016 earthquakes with epicenters in Kumamoto and Oita. Our aim is to prepare for an earthquake occurring directly beneath the Tokyo metropolitan area and an earthquake along the Nankai Trough, which are likely to occur in the future and are expected to cause large-scale damage.
AccountabilityThe Yamato Group considers the explanation of corporate and management data to shareholders, investors, and other stakeholders to be an important corporate governance issue and is committed to the speedy, accurate, and fair disclosure of information. Furthermore, the Group has established the Disclosure Policy in order to disclose and manage information in a more appropriate manner and enhance the reliability of that information. The main investor relations activities are listed below.
n Policies related to methods for calculation and determination of director compensation
To ensure the objectivity and transparency of policies for determin-ing director compensation, deliberations are conducted through the Nomination and Compensation Committee, more than half of whose members are outside directors, with the Board of Directors making resolutions. Director compensation comprises fixed remuneration that reflects external standards and performance-based amounts. The compensation of Audit & Supervisory Board members and outside directors is fixed in keeping with the nature of their work. In addition, for executives at or above the level of executive officer, a certain percentage of their compensation is allocated to purchase shares of Company through the Officers and Executives’ Share-holding Association.
Policy on cross-shareholdingsThe Company shall maintain a policy of owning stocks that are deemed meaningful, based on a comprehensive consideration of the relationship with the Group’s businesses and the profitability of the company, among other factors. With respect to the key stocks that the Company owns, a decision shall be made every year at the Board of Directors meeting concerning whether to continue holding the stocks, based on careful consideration of various factors including the effect of holding the stock on strengthening the alliance, the business track record with the company, and the market price of the shares. In exercising the voting rights of shares held, decisions on sup-porting or opposing shareholders’ meeting agenda items shall be made on a case-by-case basis, with consideration given to the issuing company raising its corporate value, the issuing company’s compli-ance framework, and the possibility that the issue will have a negative impact on the Group’s business, among other factors.
Compliancen Strengthening internal control for the Group overallThe Yamato Group has established an internal control system in order to promote sound corporate culture in the Group as a whole and to enable employees to perform their duties effectively and efficiently without any misbehavior or mistakes. Having stipulated its basic policy on the internal control system in accordance with the Companies Act, each Group company is working on strengthening internal control. In addition, in order to respond to the internal control report system pursuant to the Financial Instruments and Exchange Act, we are promoting reviews of business rules and the standardization of operations, checking whether operations have been effectively per-formed in accordance with the rules, and establishing a system to immediately put improvements in place should there have been any shortcomings. Internal control over the financial reporting of the Yamato Group as of March 31, 2017, was considered valid, and a report was submit-ted to the Kanto Local Finance Bureau.
n Reinforcing the Whistle-Blower SystemWith regard to compliance violations by the Company, employees, directors, and other members, the Yamato Group ensures an appro-priate framework related to whistle-blowing by having in place a contact point for the president, a contact point managed by the Compliance and Risk Committee, and a contact point managed by
Item Number of times Content
Settlement of Accounts Meetings for analysts and institutional investors
4
Settlement of Accounts Meetings are held each quarter.The first-quarter meeting is held by telephone with the Chief Financial Officer. Meetings for the second, third, and fourth quarters are held with the president.
Visits by the president to investors in the United States, Europe, and Asia
1 or more per year to each region
The president or chairman make regular overseas visits to investors in the United States, Europe, and Asia to explain management policies.
Small meetings with the president
2 per yearCreating regular opportunities for direct dialogue with management
Facility tours2 or more per year
Creating regular opportunities to promote understanding of business operations
Website for investor relations materials
—
Financial results, news releases, securities reports, and quarterly reports; materials pertain-ing to settlement of accounts meetings, convo-cation notices for the ordinary general meeting of shareholders, notices of resolution, and disclo-sure of voting results. Publication of most important information in two languages – Japanese and English – so that information can be communicated to foreign investors.
Establishment of IR department
— Responsibility for IR strategy
ESG
20 YAMATO HOLDINGS CO., LTD. Annual Review 2017
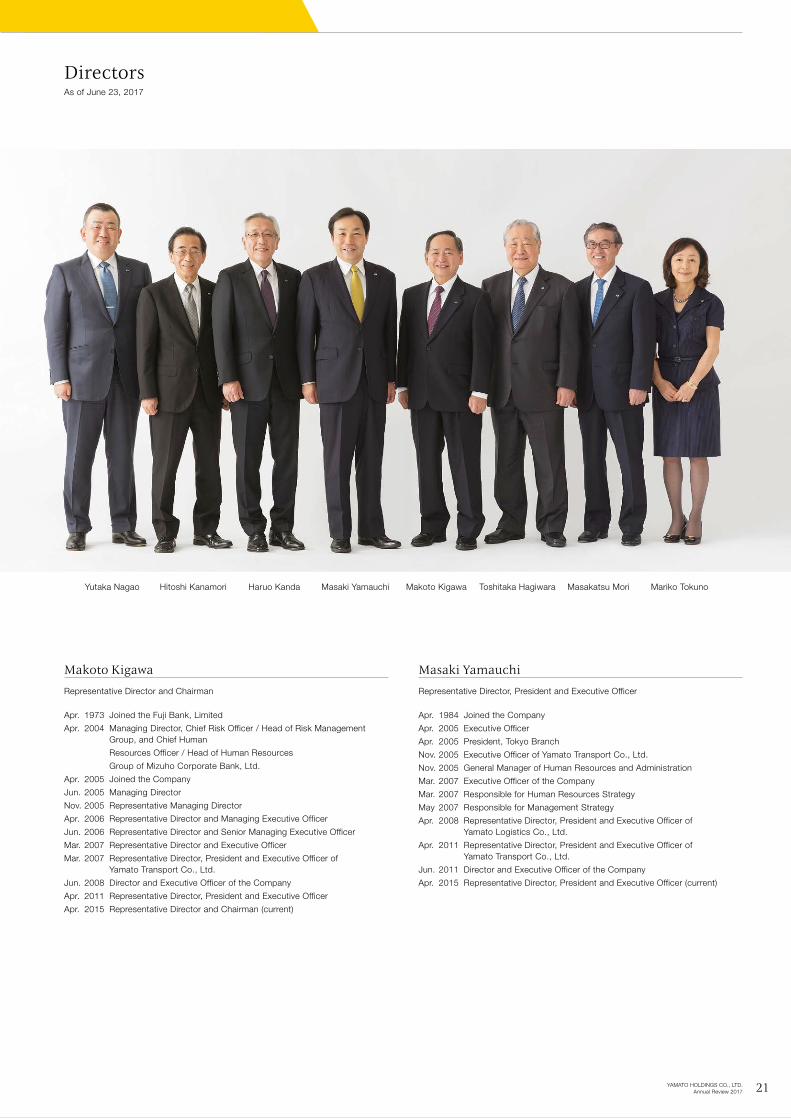
DirectorsAs of June 23, 2017
Makoto Kigawa
Representative Director and Chairman
Apr. 1973 Joined the Fuji Bank, Limited
Apr. 2004 Managing Director, Chief Risk Officer / Head of Risk Management Group, and Chief Human
Resources Officer / Head of Human Resources
Group of Mizuho Corporate Bank, Ltd.
Apr. 2005 Joined the Company
Jun. 2005 Managing Director
Nov. 2005 Representative Managing Director
Apr. 2006 Representative Director and Managing Executive Officer
Jun. 2006 Representative Director and Senior Managing Executive Officer
Mar. 2007 Representative Director and Executive Officer
Mar. 2007 Representative Director, President and Executive Officer of Yamato Transport Co., Ltd.
Jun. 2008 Director and Executive Officer of the Company
Apr. 2011 Representative Director, President and Executive Officer
Apr. 2015 Representative Director and Chairman (current)
Masaki Yamauchi
Representative Director, President and Executive Officer
Apr. 1984 Joined the Company
Apr. 2005 Executive Officer
Apr. 2005 President, Tokyo Branch
Nov. 2005 Executive Officer of Yamato Transport Co., Ltd.
Nov. 2005 General Manager of Human Resources and Administration
Mar. 2007 Executive Officer of the Company
Mar. 2007 Responsible for Human Resources Strategy
May 2007 Responsible for Management Strategy
Apr. 2008 Representative Director, President and Executive Officer of Yamato Logistics Co., Ltd.
Apr. 2011 Representative Director, President and Executive Officer of Yamato Transport Co., Ltd.
Jun. 2011 Director and Executive Officer of the Company
Apr. 2015 Representative Director, President and Executive Officer (current)
Yutaka Nagao Hitoshi Kanamori Haruo Kanda Masaki Yamauchi Makoto Kigawa Toshitaka Hagiwara Masakatsu Mori Mariko Tokuno
21YAMATO HOLDINGS CO., LTD. Annual Review 2017
Directors
Haruo Kanda
Representative Director, Vice President and Executive Officer
Jan. 1985 Joined the Company
Apr. 2004 General Manager of Human Resources
Aug. 2005 Executive Officer
Nov. 2005 Executive Officer of Yamato Transport Co., Ltd.
Jul. 2006 Managing Executive Officer
Apr. 2008 Managing Executive Officer of the Company
Jun. 2008 Representative Director and Managing Executive Officer
Apr. 2013 Representative Director and Senior Managing Executive Officer
Apr. 2014 Responsible for Human Resources Strategy, Network Strategy, Legal Affairs, CSR Strategy and Audit
Apr. 2015 Representative Director, Vice President and Executive Officer (current)
Toshitaka Hagiwara
Outside Director
Dec. 1969 Joined Komatsu Ltd.
Jun. 1990 Director
Jun. 1995 Managing Director
Jun. 1997 Executive Managing Director
Jun. 1999 Executive Vice President
Jun. 2003 Chairman and Representative Director of the Board
Jun. 2007 Councilor and Senior Adviser
Jun. 2009 Director of the Company (current)
Jul. 2011 Senior Adviser of Komatsu Ltd.
Jul. 2013 Adviser of Komatsu Ltd. (current)
Yutaka Nagao
Director, Executive Officer
Apr. 1988 Joined the Company
Apr. 2004 Regional Branch Manager of Yamaguchi Regional Branch
Apr. 2006 Regional Branch Manager of Saitama Regional Branch of Yamato Transport Co., Ltd.
Apr. 2009 General Manager of TSS Sales Promotion Office
Apr. 2010 Executive Officer and President of Kanto Regional Office
Apr. 2013 Managing Executive Officer
Apr. 2015 Executive Officer of the Company
Apr. 2015 Representative Director, President and Executive Officer of Yamato Transport Co., Ltd. (current)
Jun. 2017 Director and Executive Officer (current)
Hitoshi Kanamori
Director, Senior Managing Executive Officer
Apr. 1979 Joined Yamato System Development Co., Ltd.
Feb. 1996 General Manager of System Equipment Sales Division
Apr. 2006 General Manager of Division of Information Systems of Yamato Transport Co., Ltd.
Apr. 2007 Executive Officer, General Manager of Management Strategy
Apr. 2008 Managing Executive Officer
Apr. 2009 Representative Director and Managing Executive Officer
Apr. 2011 Executive Officer of the Company
Apr. 2011 Representative Director, President and Executive Officer of Yamato Logistics Co., Ltd.
Apr. 2015 Senior Managing Executive Officer
Apr. 2017 Coordinator-General of Management Strategy, Global Business Strategy, IT Strategy, Key Account Management (current)
Jun. 2017 Director and Senior Managing Executive Officer (current)
Masakatsu Mori
Outside Director
Apr. 1969 Joined Arthur Andersen & Co. (currently: Accenture Japan Ltd.)
May 1972 Qualified as Certified Public Accountant
Sep. 1981 Partner (business partner) of Arthur Andersen & Co. (currently: Accenture Japan Ltd.)
Feb. 1989 President of Andersen Consulting (currently: Accenture Japan Ltd.) Board Member of Andersen Consulting (Global) (currently: Accenture)
Apr. 2003 Representative Director and Chairman of Accenture Japan Ltd.
Sep. 2007 Corporate Advisor of Accenture Japan Ltd.
Oct. 2009 President of the International University of Japan (IUJ)
Apr. 2013 Senior Advisor of IUJ
Jun. 2013 Director of the Company (current)
Nov. 2013 Vice Chairman of IUJ (current)
Mariko Tokuno
Outside Director
Jan. 1994 Joined Louis Vuitton Japan KK
Apr. 2002 Senior Director for Sales Administration
Mar. 2004 Vice President of Tiffany & Co. Japan Inc.
Aug. 2010 Representative Director and President of Christian Dior Japan KK
Sep. 2013 Representative Director, President and CEO of Ferragamo Japan KK
Jun. 2017 Director of the Company (current)
22 YAMATO HOLDINGS CO., LTD. Annual Review 2017

Audit & Supervisory Board MembersAs of June 23, 2017
Hiroyuki Kanae
Audit & Supervisory Board Member (Independent)
Apr. 1979 Licensed and registered as an attorney at law (Bengoshi) at Daini Tokyo Bar Association
Sep. 1987 Joined Coudert Brothers LLP (New York)
Jul. 1988 Licensed and registered as an attorney at law in the State of New York
Sep. 1988 Joined Nishi, Tanaka & Takahashi Law Office
Apr. 1992 Partner of Nishi, Tanaka & Takahashi Law Office
May 2001 Joined Shin-Tokyo Law Office as partner
Oct. 2007 Through the consolidation of law offices, name change to Bingham McCutchen Murase, Sakai Mimura Aizawa,
Foreign Law Joint Enterprise (Partner)
Jun. 2012 Audit & Supervisory Board Member of the Company (current)
Apr. 2015 Through the consolidation of law offices, name change to Anderson Mori & Tomotsune LPC (Partner) (current)
Takashi Yamashita
Audit & Supervisory Board Member (Independent)
Oct. 1983 Joined Asahi Accounting Company
Mar. 1987 Registered as a Certified Public Accountant
May 2003 Representative Partner of Asahi & Co. (currently: KPMG AZSA LLC)
Aug. 2014 Established Takashi Yamashita CPA Office, Representative (current)
Jan. 2015 Registered as a Certified Tax Accountant
Jun. 2017 Audit & Supervisory Board Member of the Company (current)
Etsuo Ogawa
Full-time Audit & Supervisory Board Member
Nov. 1973 Joined the Company
Jun. 2002 President, Chugoku Branch
Jun. 2003 Director
Apr. 2004 Responsible for Financing and Accounting
Jun. 2004 Director and Managing Executive Officer
Jun. 2005 Managing Executive Officer
Oct. 2005 Representative Director, President and Executive Officer of Yamato Logistics Co., Ltd.
Apr. 2008 Director and Chairman of the Board of Yamato Logstics Co., Ltd.
Jun. 2009 Audit & Supervisory Board Member of Yamato Home Convenience Co., Ltd.
Jun. 2014 Audit & Supervisory Board Member of Yamato Transport Co., Ltd.
Jun. 2015 Full-time Audit & Supervisory Board Member of the Company (current)
Kazuko Takahara
Full-time Audit & Supervisory Board Member
Apr. 1978 Joined Ministry of Labour (currently: Ministry of Health, Labour and Welfare)
Aug. 2003 Director-general, Gunma Labour Bureau, Ministry of Health, Labour and Welfare
May 2005 Deputy Director of Japan Advanced Information Center of Safety and Health, Japan Industrial Safety and Health Association
Jul. 2006 Director of Compliance Department, Japan Industrial Safety and Health Association
Jul. 2009 Director-general, Hokkaido Labour Bureau, Ministry of Health, Labour and Welfare
Sep. 2012 Principal of Labour College, The Japan Institute for Labour Policy and Training
Apr. 2014 Joined the Company
Jun. 2014 Full-time Audit & Supervisory Board Member (current)
Etsuo Ogawa Kazuko Takahara Hiroyuki Kanae Takashi Yamashita
23YAMATO HOLDINGS CO., LTD. Annual Review 2017
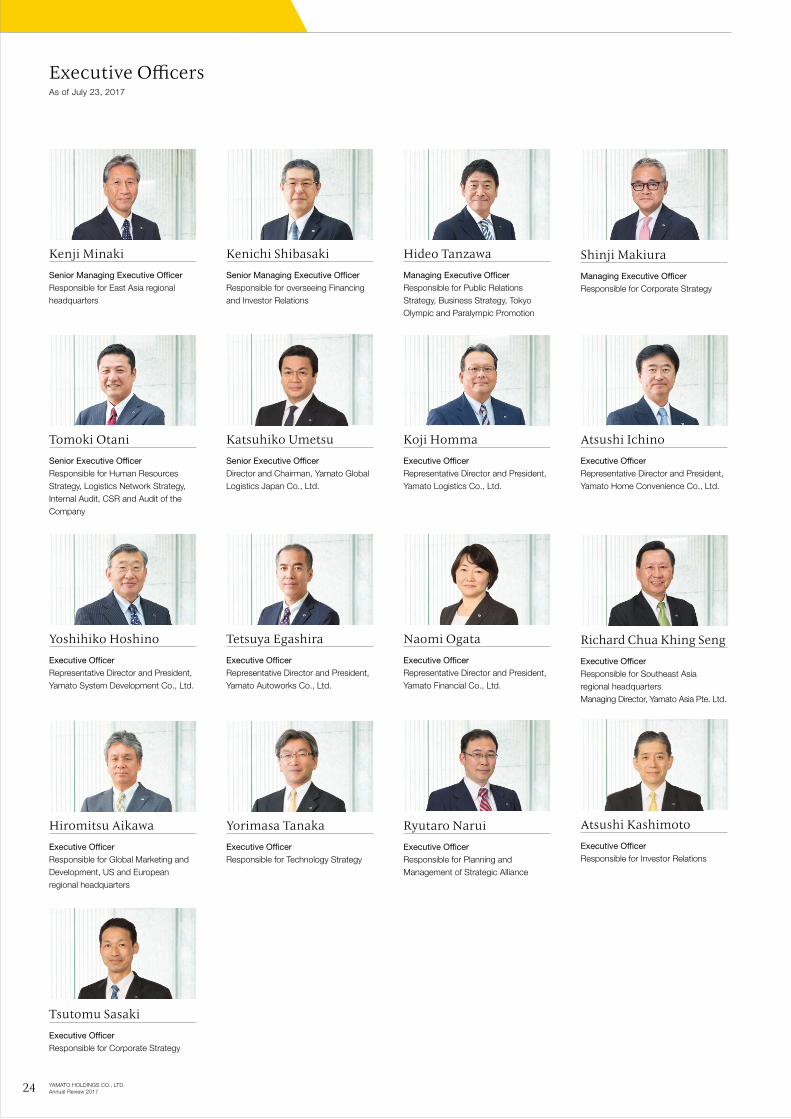
Executive OfficersAs of July 23, 2017
Kenji Minaki
Senior Managing Executive Officer
Responsible for East Asia regional headquarters
Hideo Tanzawa
Managing Executive Officer
Responsible for Public Relations Strategy, Business Strategy, Tokyo Olympic and Paralympic Promotion
Tomoki Otani
Senior Executive Officer
Responsible for Human ResourcesStrategy, Logistics Network Strategy, Internal Audit, CSR and Audit of the Company
Katsuhiko Umetsu
Senior Executive Officer
Director and Chairman, Yamato Global Logistics Japan Co., Ltd.
Atsushi Ichino
Executive Officer
Representative Director and President, Yamato Home Convenience Co., Ltd.
Kenichi Shibasaki
Senior Managing Executive Officer
Responsible for overseeing Financing and Investor Relations
Tetsuya Egashira
Executive Officer
Representative Director and President, Yamato Autoworks Co., Ltd.
Koji Homma
Executive Officer
Representative Director and President, Yamato Logistics Co., Ltd.
Naomi Ogata
Executive Officer
Representative Director and President, Yamato Financial Co., Ltd.
Richard Chua Khing Seng
Executive Officer
Responsible for Southeast Asia regional headquartersManaging Director, Yamato Asia Pte. Ltd.
Ryutaro Narui
Executive Officer
Responsible for Planning and Management of Strategic Alliance
Tsutomu Sasaki
Executive Officer
Responsible for Corporate Strategy
Yoshihiko Hoshino
Executive Officer
Representative Director and President, Yamato System Development Co., Ltd.
Shinji Makiura
Managing Executive Officer
Responsible for Corporate Strategy
Yorimasa Tanaka
Executive Officer
Responsible for Technology Strategy
Hiromitsu Aikawa
Executive Officer
Responsible for Global Marketing and Development, US and European regional headquarters
Atsushi Kashimoto
Executive Officer
Responsible for Investor Relations
24 YAMATO HOLDINGS CO., LTD. Annual Review 2017
Financial Section
26 Ten-Year Summary and Business Highlights
28 Consolidated Balance Sheet
30 Consolidated Statement of Income
31 Consolidated Statement of Comprehensive Income
32 Consolidated Statement of Changes in Equity
33 Consolidated Statement of Cash Flows
34 Notes to Consolidated Financial Statements
54 Independent Auditor’s Report
25YAMATO HOLDINGS CO., LTD. Annual Review 2017
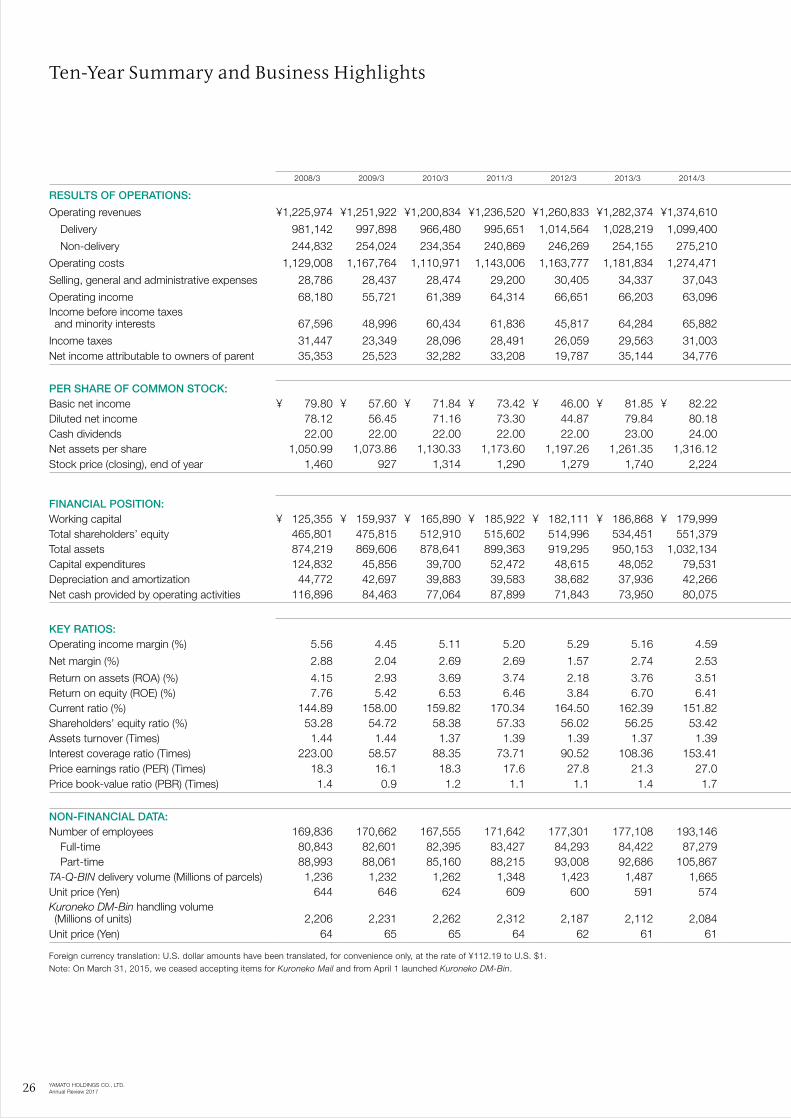
Millions of Yen Thousands of U.S. Dollars
2008/3 2009/3 2010/3 2011/3 2012/3 2013/3 2014/3 2015/3 2016/3 2017/3 2017/3
RESULTS OF OPERATIONS:
Operating revenues ¥1,225,974 ¥1,251,922 ¥1,200,834 ¥1,236,520 ¥1,260,833 ¥1,282,374 ¥1,374,610 ¥1,396,708 ¥1,416,413 ¥1,466,852 $13,074,713
Delivery 981,142 997,898 966,480 995,651 1,014,564 1,028,219 1,099,400 1,101,439 1,111,867 1,151,028 10,259,634
Non-delivery 244,832 254,024 234,354 240,869 246,269 254,155 275,210 295,269 304,546 315,824 2,815,079
Operating costs 1,129,008 1,167,764 1,110,971 1,143,006 1,163,777 1,181,834 1,274,471 1,290,715 1,306,200 1,385,492 12,349,517
Selling, general and administrative expenses 28,786 28,437 28,474 29,200 30,405 34,337 37,043 37,046 41,673 46,475 414,247
Operating income 68,180 55,721 61,389 64,314 66,651 66,203 63,096 68,947 68,540 34,885 310,949 Income before income taxes and minority interests 67,596 48,996 60,434 61,836 45,817 64,284 65,882 69,158 68,079 33,038 294,479
Income taxes 31,447 23,349 28,096 28,491 26,059 29,563 31,003 31,555 28,415 14,673 130,784 Net income attributable to owners of parent 35,353 25,523 32,282 33,208 19,787 35,144 34,776 37,533 39,425 18,054 160,921
Yen U.S. Dollars
PER SHARE OF COMMON STOCK:Basic net income ¥ 79.80 ¥ 57.60 ¥ 71.84 ¥ 73.42 ¥ 46.00 ¥ 81.85 ¥ 82.22 ¥ 90.41 ¥ 96.45 ¥ 45.37 $ 0.40Diluted net income 78.12 56.45 71.16 73.30 44.87 79.84 80.18 88.26 95.64 — —Cash dividends 22.00 22.00 22.00 22.00 22.00 23.00 24.00 25.00 28.00 27.00 0.24Net assets per share 1,050.99 1,073.86 1,130.33 1,173.60 1,197.26 1,261.35 1,316.12 1,368.66 1,349.56 1,367.51 12.19Stock price (closing), end of year 1,460 927 1,314 1,290 1,279 1,740 2,224 2,772 2,247 2,332.5 —
Millions of YenThousands of
U.S. Dollars
FINANCIAL POSITION:Working capital ¥ 125,355 ¥ 159,937 ¥ 165,890 ¥ 185,922 ¥ 182,111 ¥ 186,868 ¥ 179,999 ¥ 209,172 ¥ 235,884 ¥ 214,661 $1,913,373Total shareholders’ equity 465,801 475,815 512,910 515,602 514,996 534,451 551,379 565,521 537,821 539,179 4,805,949 Total assets 874,219 869,606 878,641 899,363 919,295 950,153 1,032,134 1,082,531 1,089,437 1,114,672 9,935,576 Capital expenditures 124,832 45,856 39,700 52,472 48,615 48,052 79,531 52,022 53,945 48,994 436,704 Depreciation and amortization 44,772 42,697 39,883 39,583 38,682 37,936 42,266 46,058 46,739 46,114 411,037 Net cash provided by operating activities 116,896 84,463 77,064 87,899 71,843 73,950 80,075 92,620 49,715 73,325 653,575
KEY RATIOS:Operating income margin (%) 5.56 4.45 5.11 5.20 5.29 5.16 4.59 4.94 4.84 2.38
Net margin (%) 2.88 2.04 2.69 2.69 1.57 2.74 2.53 2.69 2.78 1.23
Return on assets (ROA) (%) 4.15 2.93 3.69 3.74 2.18 3.76 3.51 3.55 3.63 1.64Return on equity (ROE) (%) 7.76 5.42 6.53 6.46 3.84 6.70 6.41 6.75 7.15 3.35Current ratio (%) 144.89 158.00 159.82 170.34 164.50 162.39 151.82 158.59 167.76 157.73Shareholders’ equity ratio (%) 53.28 54.72 58.38 57.33 56.02 56.25 53.42 52.24 49.37 48.37Assets turnover (Times) 1.44 1.44 1.37 1.39 1.39 1.37 1.39 1.32 1.30 1.33Interest coverage ratio (Times) 223.00 58.57 88.35 73.71 90.52 108.36 153.41 173.45 125.33 81.45Price earnings ratio (PER) (Times) 18.3 16.1 18.3 17.6 27.8 21.3 27.0 30.7 23.3 51.4Price book-value ratio (PBR) (Times) 1.4 0.9 1.2 1.1 1.1 1.4 1.7 2.0 1.7 1.7
NON-FINANCIAL DATA:Number of employees 169,836 170,662 167,555 171,642 177,301 177,108 193,146 197,056 196,582 201,784 Full-time 80,843 82,601 82,395 83,427 84,293 84,422 87,279 88,247 89,112 90,737 Part-time 88,993 88,061 85,160 88,215 93,008 92,686 105,867 108,809 107,470 111,047TA-Q-BIN delivery volume (Millions of parcels) 1,236 1,232 1,262 1,348 1,423 1,487 1,665 1,622 1,731 1,867Unit price (Yen) 644 646 624 609 600 591 574 595 578 559Kuroneko DM-Bin handling volume (Millions of units) 2,206 2,231 2,262 2,312 2,187 2,112 2,084 1,901 1,536 1,542Unit price (Yen) 64 65 65 64 62 61 61 61 57 55
Foreign currency translation: U.S. dollar amounts have been translated, for convenience only, at the rate of ¥112.19 to U.S. $1.Note: On March 31, 2015, we ceased accepting items for Kuroneko Mail and from April 1 launched Kuroneko DM-Bin.
Ten-Year Summary and Business Highlights
26 YAMATO HOLDINGS CO., LTD. Annual Review 2017
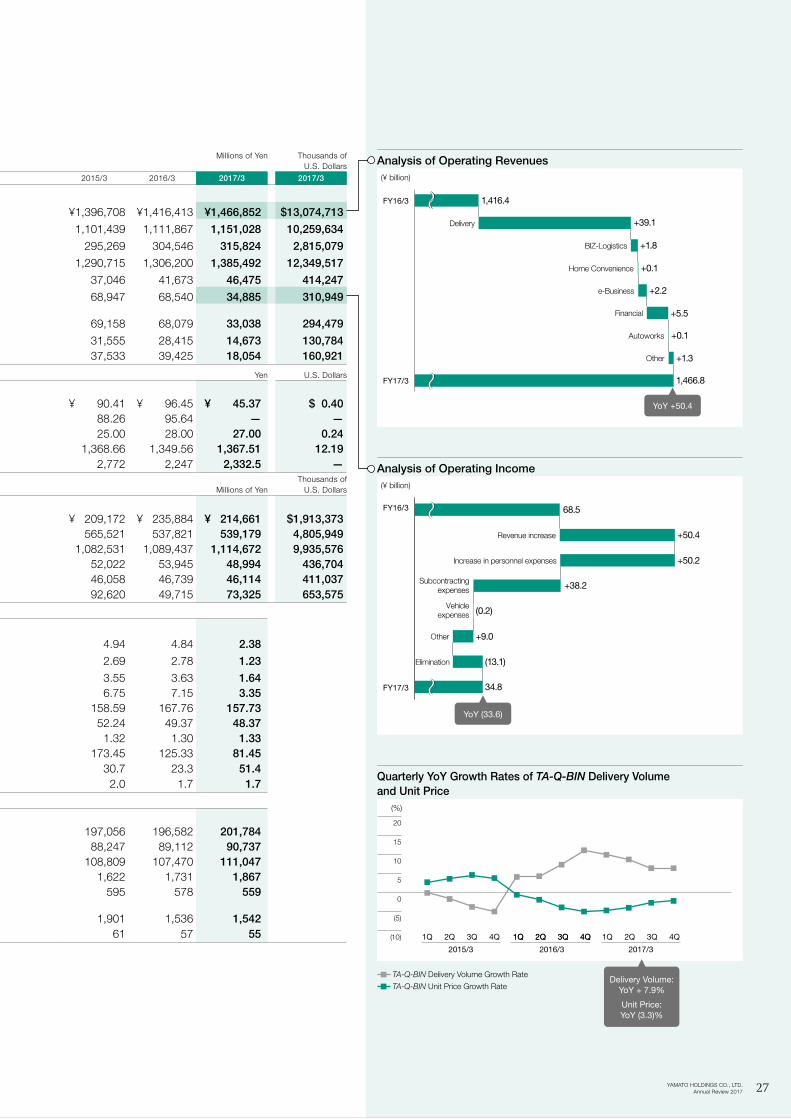
Millions of Yen Thousands of U.S. Dollars
2008/3 2009/3 2010/3 2011/3 2012/3 2013/3 2014/3 2015/3 2016/3 2017/3 2017/3
RESULTS OF OPERATIONS:
Operating revenues ¥1,225,974 ¥1,251,922 ¥1,200,834 ¥1,236,520 ¥1,260,833 ¥1,282,374 ¥1,374,610 ¥1,396,708 ¥1,416,413 ¥1,466,852 $13,074,713
Delivery 981,142 997,898 966,480 995,651 1,014,564 1,028,219 1,099,400 1,101,439 1,111,867 1,151,028 10,259,634
Non-delivery 244,832 254,024 234,354 240,869 246,269 254,155 275,210 295,269 304,546 315,824 2,815,079
Operating costs 1,129,008 1,167,764 1,110,971 1,143,006 1,163,777 1,181,834 1,274,471 1,290,715 1,306,200 1,385,492 12,349,517
Selling, general and administrative expenses 28,786 28,437 28,474 29,200 30,405 34,337 37,043 37,046 41,673 46,475 414,247
Operating income 68,180 55,721 61,389 64,314 66,651 66,203 63,096 68,947 68,540 34,885 310,949 Income before income taxes and minority interests 67,596 48,996 60,434 61,836 45,817 64,284 65,882 69,158 68,079 33,038 294,479
Income taxes 31,447 23,349 28,096 28,491 26,059 29,563 31,003 31,555 28,415 14,673 130,784 Net income attributable to owners of parent 35,353 25,523 32,282 33,208 19,787 35,144 34,776 37,533 39,425 18,054 160,921
Yen U.S. Dollars
PER SHARE OF COMMON STOCK:Basic net income ¥ 79.80 ¥ 57.60 ¥ 71.84 ¥ 73.42 ¥ 46.00 ¥ 81.85 ¥ 82.22 ¥ 90.41 ¥ 96.45 ¥ 45.37 $ 0.40Diluted net income 78.12 56.45 71.16 73.30 44.87 79.84 80.18 88.26 95.64 — —Cash dividends 22.00 22.00 22.00 22.00 22.00 23.00 24.00 25.00 28.00 27.00 0.24Net assets per share 1,050.99 1,073.86 1,130.33 1,173.60 1,197.26 1,261.35 1,316.12 1,368.66 1,349.56 1,367.51 12.19Stock price (closing), end of year 1,460 927 1,314 1,290 1,279 1,740 2,224 2,772 2,247 2,332.5 —
Millions of YenThousands of
U.S. Dollars
FINANCIAL POSITION:Working capital ¥ 125,355 ¥ 159,937 ¥ 165,890 ¥ 185,922 ¥ 182,111 ¥ 186,868 ¥ 179,999 ¥ 209,172 ¥ 235,884 ¥ 214,661 $1,913,373Total shareholders’ equity 465,801 475,815 512,910 515,602 514,996 534,451 551,379 565,521 537,821 539,179 4,805,949 Total assets 874,219 869,606 878,641 899,363 919,295 950,153 1,032,134 1,082,531 1,089,437 1,114,672 9,935,576 Capital expenditures 124,832 45,856 39,700 52,472 48,615 48,052 79,531 52,022 53,945 48,994 436,704 Depreciation and amortization 44,772 42,697 39,883 39,583 38,682 37,936 42,266 46,058 46,739 46,114 411,037 Net cash provided by operating activities 116,896 84,463 77,064 87,899 71,843 73,950 80,075 92,620 49,715 73,325 653,575
KEY RATIOS:Operating income margin (%) 5.56 4.45 5.11 5.20 5.29 5.16 4.59 4.94 4.84 2.38
Net margin (%) 2.88 2.04 2.69 2.69 1.57 2.74 2.53 2.69 2.78 1.23
Return on assets (ROA) (%) 4.15 2.93 3.69 3.74 2.18 3.76 3.51 3.55 3.63 1.64Return on equity (ROE) (%) 7.76 5.42 6.53 6.46 3.84 6.70 6.41 6.75 7.15 3.35Current ratio (%) 144.89 158.00 159.82 170.34 164.50 162.39 151.82 158.59 167.76 157.73Shareholders’ equity ratio (%) 53.28 54.72 58.38 57.33 56.02 56.25 53.42 52.24 49.37 48.37Assets turnover (Times) 1.44 1.44 1.37 1.39 1.39 1.37 1.39 1.32 1.30 1.33Interest coverage ratio (Times) 223.00 58.57 88.35 73.71 90.52 108.36 153.41 173.45 125.33 81.45Price earnings ratio (PER) (Times) 18.3 16.1 18.3 17.6 27.8 21.3 27.0 30.7 23.3 51.4Price book-value ratio (PBR) (Times) 1.4 0.9 1.2 1.1 1.1 1.4 1.7 2.0 1.7 1.7
NON-FINANCIAL DATA:Number of employees 169,836 170,662 167,555 171,642 177,301 177,108 193,146 197,056 196,582 201,784 Full-time 80,843 82,601 82,395 83,427 84,293 84,422 87,279 88,247 89,112 90,737 Part-time 88,993 88,061 85,160 88,215 93,008 92,686 105,867 108,809 107,470 111,047TA-Q-BIN delivery volume (Millions of parcels) 1,236 1,232 1,262 1,348 1,423 1,487 1,665 1,622 1,731 1,867Unit price (Yen) 644 646 624 609 600 591 574 595 578 559Kuroneko DM-Bin handling volume (Millions of units) 2,206 2,231 2,262 2,312 2,187 2,112 2,084 1,901 1,536 1,542Unit price (Yen) 64 65 65 64 62 61 61 61 57 55
Foreign currency translation: U.S. dollar amounts have been translated, for convenience only, at the rate of ¥112.19 to U.S. $1.Note: On March 31, 2015, we ceased accepting items for Kuroneko Mail and from April 1 launched Kuroneko DM-Bin.
FY16/3
FY17/3 1,466.8
+1.3
+0.1
+5.5
+0.1
+2.2
+1.8
+39.1
Other
Autoworks
Financial
Home Convenience
e-Business
BIZ-Logistics
Delivery
1,416.4
FY16/3
FY17/3 34.8
(13.1)
+9.0
(0.2)
+38.2
+50.2
+50.4
Elimination
Other
Vehicleexpenses
Subcontractingexpenses
Increase in personnel expenses
Revenue increase
68.5
Analysis of Operating Revenues(¥ billion)
Analysis of Operating Income(¥ billion)
TA-Q-BIN Delivery Volume Growth Rate
TA-Q-BIN Unit Price Growth Rate
YoY +50.4
YoY (33.6)
1Q 2Q 3Q 4Q
2016/3 2017/32015/3
1Q 2Q 3Q 4Q1Q 2Q 3Q 4Q 1Q 2Q 3Q 4Q(10)
(5)
0
5
10
15
20
Quarterly YoY Growth Rates of TA-Q-BIN Delivery Volume and Unit Price
(%)
Delivery Volume: YoY + 7.9%
Unit Price: YoY (3.3)%
27YAMATO HOLDINGS CO., LTD. Annual Review 2017
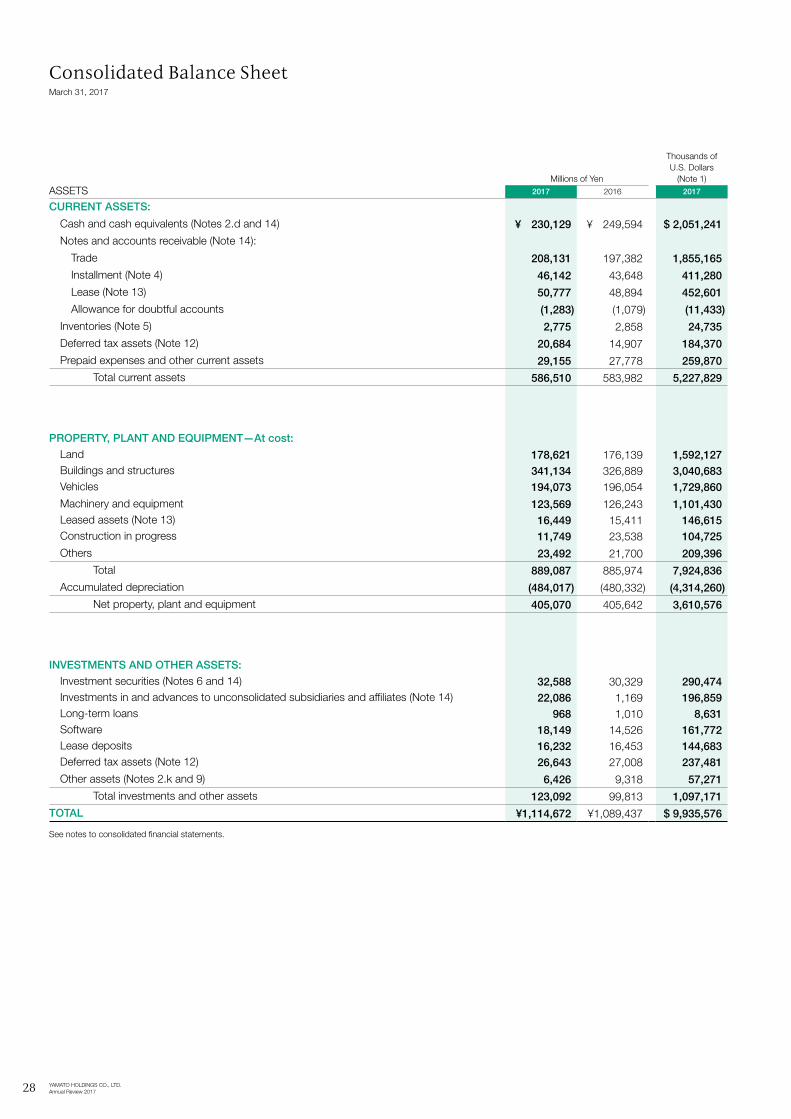
Consolidated Balance SheetMarch 31, 2017
Millions of Yen
Thousands of U.S. Dollars
(Note 1)ASSETS 2017 2016 2017
CURRENT ASSETS:
Cash and cash equivalents (Notes 2.d and 14) ¥ 230,129 ¥ 249,594 $ 2,051,241
Notes and accounts receivable (Note 14):
Trade 208,131 197,382 1,855,165
Installment (Note 4) 46,142 43,648 411,280
Lease (Note 13) 50,777 48,894 452,601
Allowance for doubtful accounts (1,283) (1,079) (11,433)
Inventories (Note 5) 2,775 2,858 24,735
Deferred tax assets (Note 12) 20,684 14,907 184,370
Prepaid expenses and other current assets 29,155 27,778 259,870
Total current assets 586,510 583,982 5,227,829
PROPERTY, PLANT AND EQUIPMENT—At cost: Land 178,621 176,139 1,592,127 Buildings and structures 341,134 326,889 3,040,683 Vehicles 194,073 196,054 1,729,860
Machinery and equipment 123,569 126,243 1,101,430 Leased assets (Note 13) 16,449 15,411 146,615 Construction in progress 11,749 23,538 104,725
Others 23,492 21,700 209,396
Total 889,087 885,974 7,924,836
Accumulated depreciation (484,017) (480,332) (4,314,260)
Net property, plant and equipment 405,070 405,642 3,610,576
INVESTMENTS AND OTHER ASSETS: Investment securities (Notes 6 and 14) 32,588 30,329 290,474 Investments in and advances to unconsolidated subsidiaries and affiliates (Note 14) 22,086 1,169 196,859 Long-term loans 968 1,010 8,631 Software 18,149 14,526 161,772 Lease deposits 16,232 16,453 144,683 Deferred tax assets (Note 12) 26,643 27,008 237,481
Other assets (Notes 2.k and 9) 6,426 9,318 57,271
Total investments and other assets 123,092 99,813 1,097,171
TOTAL ¥1,114,672 ¥1,089,437 $ 9,935,576
See notes to consolidated financial statements.
28 YAMATO HOLDINGS CO., LTD. Annual Review 2017
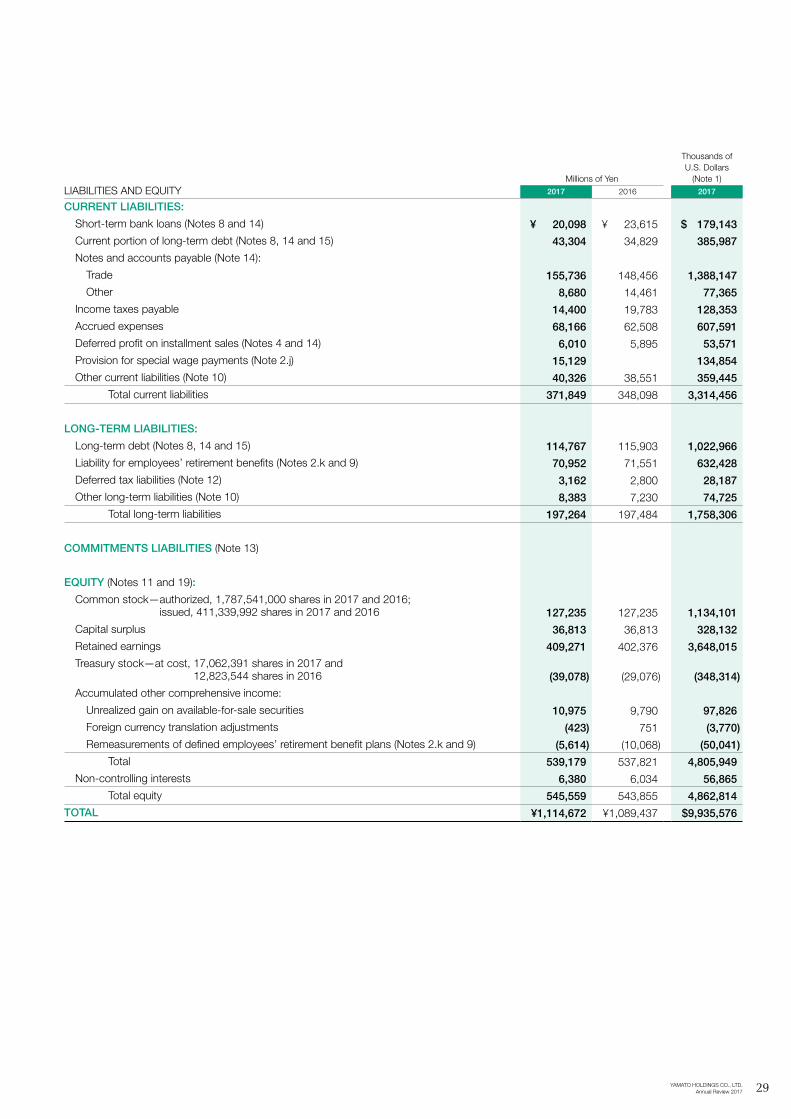
Millions of Yen
Thousands of U.S. Dollars
(Note 1)LIABILITIES AND EQUITY 2017 2016 2017
CURRENT LIABILITIES:
Short-term bank loans (Notes 8 and 14) ¥ 20,098 ¥ 23,615 $ 179,143
Current portion of long-term debt (Notes 8, 14 and 15) 43,304 34,829 385,987
Notes and accounts payable (Note 14):
Trade 155,736 148,456 1,388,147
Other 8,680 14,461 77,365
Income taxes payable 14,400 19,783 128,353
Accrued expenses 68,166 62,508 607,591
Deferred profit on installment sales (Notes 4 and 14) 6,010 5,895 53,571
Provision for special wage payments (Note 2.j) 15,129 134,854
Other current liabilities (Note 10) 40,326 38,551 359,445
Total current liabilities 371,849 348,098 3,314,456
LONG-TERM LIABILITIES:
Long-term debt (Notes 8, 14 and 15) 114,767 115,903 1,022,966
Liability for employees’ retirement benefits (Notes 2.k and 9) 70,952 71,551 632,428
Deferred tax liabilities (Note 12) 3,162 2,800 28,187
Other long-term liabilities (Note 10) 8,383 7,230 74,725
Total long-term liabilities 197,264 197,484 1,758,306
COMMITMENTS LIABILITIES (Note 13)
EQUITY (Notes 11 and 19):
Common stock— authorized, 1,787,541,000 shares in 2017 and 2016; issued, 411,339,992 shares in 2017 and 2016 127,235 127,235 1,134,101
Capital surplus 36,813 36,813 328,132
Retained earnings 409,271 402,376 3,648,015
Treasury stock—at cost, 17,062,391 shares in 2017 and 12,823,544 shares in 2016 (39,078) (29,076) (348,314)
Accumulated other comprehensive income:
Unrealized gain on available-for-sale securities 10,975 9,790 97,826
Foreign currency translation adjustments (423) 751 (3,770)
Remeasurements of defined employees’ retirement benefit plans (Notes 2.k and 9) (5,614) (10,068) (50,041)
Total 539,179 537,821 4,805,949
Non-controlling interests 6,380 6,034 56,865
Total equity 545,559 543,855 4,862,814
TOTAL ¥1,114,672 ¥1,089,437 $9,935,576
29YAMATO HOLDINGS CO., LTD. Annual Review 2017
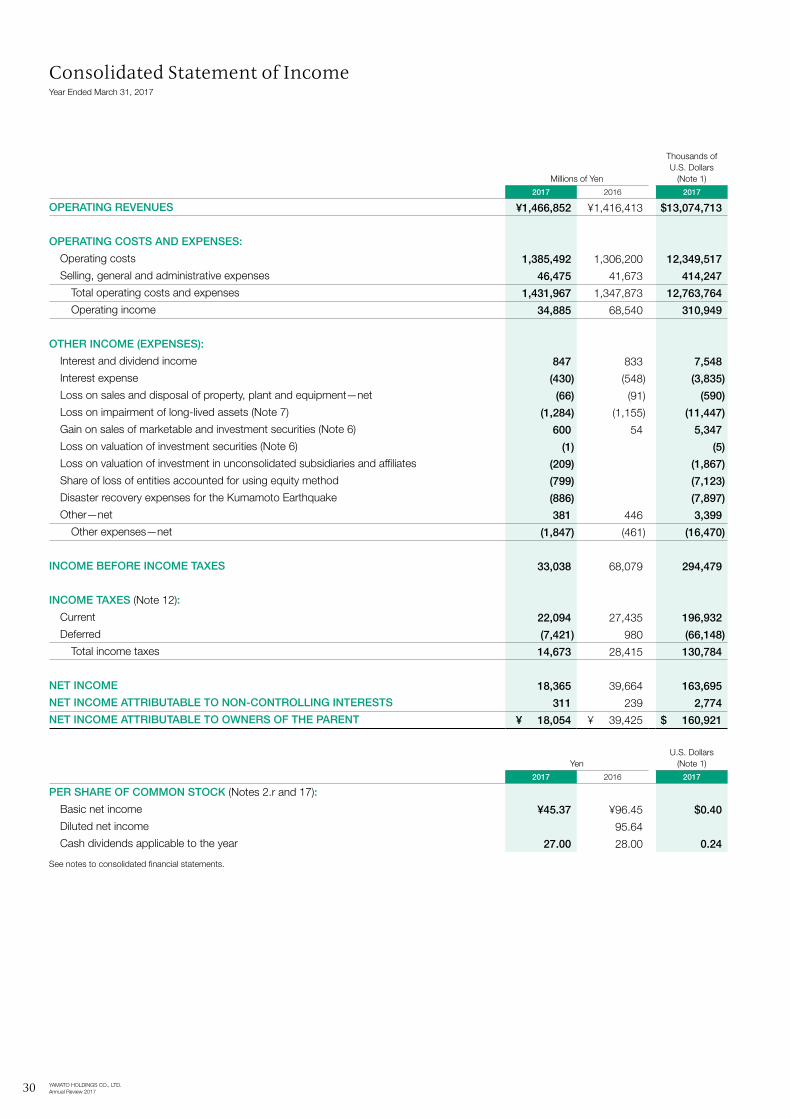
Consolidated Statement of IncomeYear Ended March 31, 2017
Millions of Yen
Thousands of U.S. Dollars
(Note 1)
2017 2016 2017
OPERATING REVENUES ¥1,466,852 ¥1,416,413 $13,074,713
OPERATING COSTS AND EXPENSES:
Operating costs 1,385,492 1,306,200 12,349,517
Selling, general and administrative expenses 46,475 41,673 414,247
Total operating costs and expenses 1,431,967 1,347,873 12,763,764
Operating income 34,885 68,540 310,949
OTHER INCOME (EXPENSES):
Interest and dividend income 847 833 7,548
Interest expense (430) (548) (3,835)
Loss on sales and disposal of property, plant and equipment—net (66) (91) (590)
Loss on impairment of long-lived assets (Note 7) (1,284) (1,155) (11,447)
Gain on sales of marketable and investment securities (Note 6) 600 54 5,347
Loss on valuation of investment securities (Note 6) (1) (5)
Loss on valuation of investment in unconsolidated subsidiaries and affiliates (209) (1,867)
Share of loss of entities accounted for using equity method (799) (7,123)
Disaster recovery expenses for the Kumamoto Earthquake (886) (7,897)
Other—net 381 446 3,399
Other expenses—net (1,847) (461) (16,470)
INCOME BEFORE INCOME TAXES 33,038 68,079 294,479
INCOME TAXES (Note 12):
Current 22,094 27,435 196,932
Deferred (7,421) 980 (66,148)
Total income taxes 14,673 28,415 130,784
NET INCOME 18,365 39,664 163,695
NET INCOME ATTRIBUTABLE TO NON-CONTROLLING INTERESTS 311 239 2,774
NET INCOME ATTRIBUTABLE TO OWNERS OF THE PARENT ¥ 18,054 ¥ 39,425 $ 160,921
YenU.S. Dollars
(Note 1)
2017 2016 2017
PER SHARE OF COMMON STOCK (Notes 2.r and 17):
Basic net income ¥45.37 ¥96.45 $0.40
Diluted net income 95.64
Cash dividends applicable to the year 27.00 28.00 0.24
See notes to consolidated financial statements.
30 YAMATO HOLDINGS CO., LTD. Annual Review 2017

Consolidated Statement of Comprehensive IncomeYear Ended March 31, 2017
Millions of Yen
Thousands of U.S. Dollars
(Note 1)
2017 2016 2017
NET INCOME ¥18,365 ¥ 39,664 $163,695
OTHER COMPREHENSIVE INCOME (Note 16):
Unrealized gain (loss) on available-for-sale securities 1,269 (3,976) 11,311
Foreign currency translation adjustments (1,174) (419) (10,468)
Remeasurements of defined employees’ retirement benefit plans 4,456 (10,787) 39,722
Share of other comprehensive income of entities accounted for using equity method 1 7
Total other comprehensive income (loss) 4,552 (15,182) 40,572
COMPREHENSIVE INCOME ¥22,917 ¥ 24,482 $204,267
TOTAL COMPREHENSIVE INCOME ATTRIBUTABLE TO:
Owners of the parent ¥22,519 ¥ 24,166 $200,718
Non-controlling interests 398 316 3,549
See notes to consolidated financial statements.
31YAMATO HOLDINGS CO., LTD. Annual Review 2017
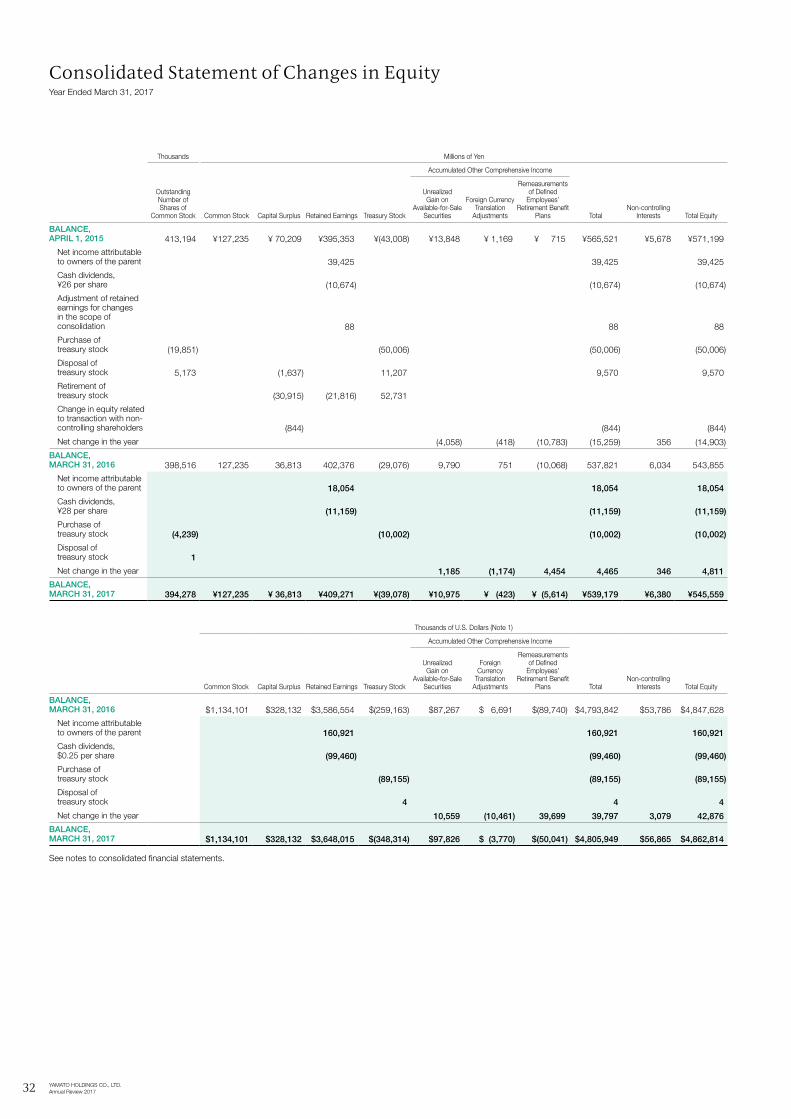
Consolidated Statement of Changes in EquityYear Ended March 31, 2017
Thousands Millions of Yen
Accumulated Other Comprehensive Income
Outstanding Number of Shares of
Common Stock Common Stock Capital Surplus Retained Earnings Treasury Stock
Unrealized Gain on
Available-for-Sale Securities
Foreign Currency Translation
Adjustments
Remeasurements of Defined
Employees’ Retirement Benefit
Plans TotalNon-controlling
Interests Total Equity
BALANCE, APRIL 1, 2015 413,194 ¥127,235 ¥ 70,209 ¥395,353 ¥(43,008) ¥13,848 ¥ 1,169 ¥ 715 ¥565,521 ¥5,678 ¥571,199
Net income attributable to owners of the parent 39,425 39,425 39,425
Cash dividends, ¥26 per share (10,674) (10,674) (10,674)
Adjustment of retained earnings for changes in the scope of consolidation 88 88 88
Purchase of treasury stock (19,851) (50,006) (50,006) (50,006)
Disposal of treasury stock 5,173 (1,637) 11,207 9,570 9,570
Retirement of treasury stock (30,915) (21,816) 52,731
Change in equity related to transaction with non-controlling shareholders (844) (844) (844)
Net change in the year (4,058) (418) (10,783) (15,259) 356 (14,903)
BALANCE, MARCH 31, 2016 398,516 127,235 36,813 402,376 (29,076) 9,790 751 (10,068) 537,821 6,034 543,855
Net income attributable to owners of the parent 18,054 18,054 18,054
Cash dividends, ¥28 per share (11,159) (11,159) (11,159)
Purchase of treasury stock (4,239) (10,002) (10,002) (10,002)
Disposal of treasury stock 1
Net change in the year 1,185 (1,174) 4,454 4,465 346 4,811
BALANCE, MARCH 31, 2017 394,278 ¥127,235 ¥ 36,813 ¥409,271 ¥(39,078) ¥10,975 ¥ (423) ¥ (5,614) ¥539,179 ¥6,380 ¥545,559
Thousands of U.S. Dollars (Note 1)
Accumulated Other Comprehensive Income
Common Stock Capital Surplus Retained Earnings Treasury Stock
Unrealized Gain on
Available-for-Sale Securities
Foreign Currency
Translation Adjustments
Remeasurements of Defined
Employees’ Retirement Benefit
Plans TotalNon-controlling
Interests Total Equity
BALANCE, MARCH 31, 2016 $1,134,101 $328,132 $3,586,554 $(259,163) $87,267 $ 6,691 $(89,740) $4,793,842 $53,786 $4,847,628
Net income attributable to owners of the parent 160,921 160,921 160,921
Cash dividends, $0.25 per share (99,460) (99,460) (99,460)
Purchase of treasury stock (89,155) (89,155) (89,155)
Disposal of treasury stock 4 4 4
Net change in the year 10,559 (10,461) 39,699 39,797 3,079 42,876
BALANCE, MARCH 31, 2017 $1,134,101 $328,132 $3,648,015 $(348,314) $97,826 $ (3,770) $(50,041) $4,805,949 $56,865 $4,862,814
See notes to consolidated financial statements.
32 YAMATO HOLDINGS CO., LTD. Annual Review 2017
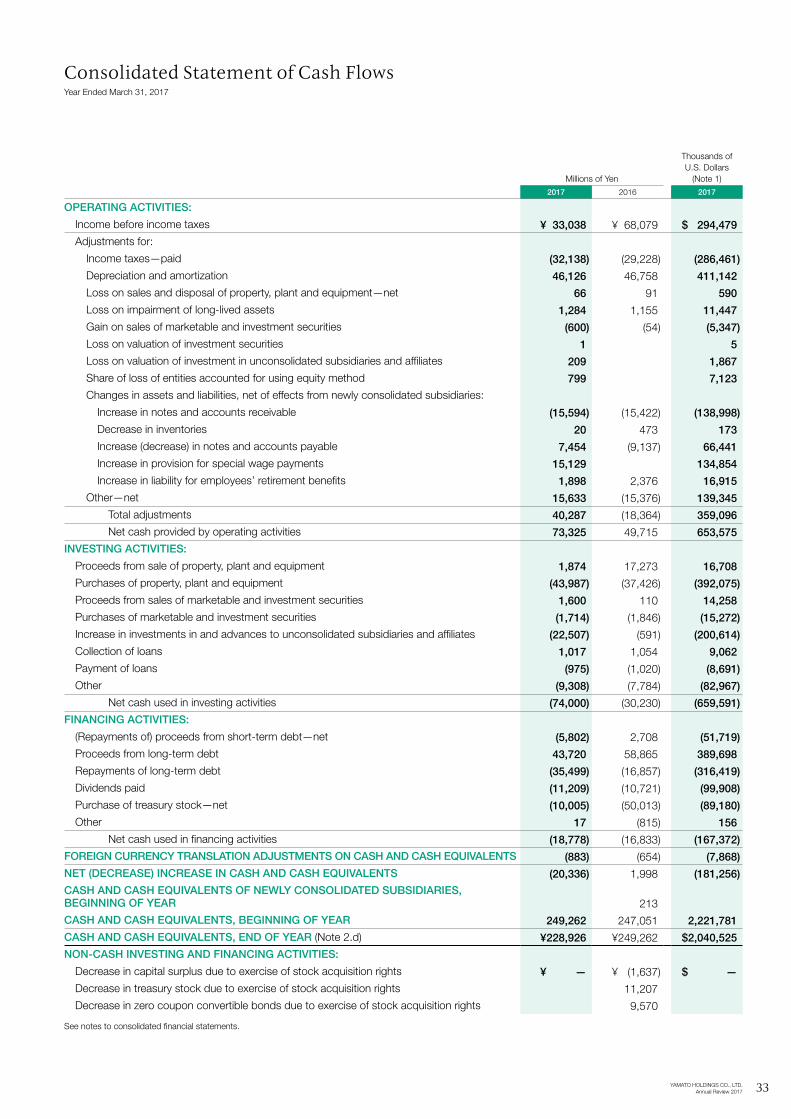
Consolidated Statement of Cash FlowsYear Ended March 31, 2017
Millions of Yen
Thousands of U.S. Dollars
(Note 1)
2017 2016 2017
OPERATING ACTIVITIES:
Income before income taxes ¥ 33,038 ¥ 68,079 $ 294,479
Adjustments for:
Income taxes—paid (32,138) (29,228) (286,461)
Depreciation and amortization 46,126 46,758 411,142
Loss on sales and disposal of property, plant and equipment—net 66 91 590
Loss on impairment of long-lived assets 1,284 1,155 11,447
Gain on sales of marketable and investment securities (600) (54) (5,347)
Loss on valuation of investment securities 1 5
Loss on valuation of investment in unconsolidated subsidiaries and affiliates 209 1,867
Share of loss of entities accounted for using equity method 799 7,123
Changes in assets and liabilities, net of effects from newly consolidated subsidiaries:
Increase in notes and accounts receivable (15,594) (15,422) (138,998)
Decrease in inventories 20 473 173
Increase (decrease) in notes and accounts payable 7,454 (9,137) 66,441
Increase in provision for special wage payments 15,129 134,854
Increase in liability for employees’ retirement benefits 1,898 2,376 16,915
Other—net 15,633 (15,376) 139,345
Total adjustments 40,287 (18,364) 359,096
Net cash provided by operating activities 73,325 49,715 653,575
INVESTING ACTIVITIES:
Proceeds from sale of property, plant and equipment 1,874 17,273 16,708
Purchases of property, plant and equipment (43,987) (37,426) (392,075)
Proceeds from sales of marketable and investment securities 1,600 110 14,258
Purchases of marketable and investment securities (1,714) (1,846) (15,272)
Increase in investments in and advances to unconsolidated subsidiaries and affiliates (22,507) (591) (200,614)
Collection of loans 1,017 1,054 9,062
Payment of loans (975) (1,020) (8,691)
Other (9,308) (7,784) (82,967)
Net cash used in investing activities (74,000) (30,230) (659,591)
FINANCING ACTIVITIES:
(Repayments of) proceeds from short-term debt—net (5,802) 2,708 (51,719)
Proceeds from long-term debt 43,720 58,865 389,698
Repayments of long-term debt (35,499) (16,857) (316,419)
Dividends paid (11,209) (10,721) (99,908)
Purchase of treasury stock—net (10,005) (50,013) (89,180)
Other 17 (815) 156
Net cash used in financing activities (18,778) (16,833) (167,372)
FOREIGN CURRENCY TRANSLATION ADJUSTMENTS ON CASH AND CASH EQUIVALENTS (883) (654) (7,868)
NET (DECREASE) INCREASE IN CASH AND CASH EQUIVALENTS (20,336) 1,998 (181,256)
CASH AND CASH EQUIVALENTS OF NEWLY CONSOLIDATED SUBSIDIARIES, BEGINNING OF YEAR 213
CASH AND CASH EQUIVALENTS, BEGINNING OF YEAR 249,262 247,051 2,221,781
CASH AND CASH EQUIVALENTS, END OF YEAR (Note 2.d) ¥228,926 ¥249,262 $2,040,525
NON-CASH INVESTING AND FINANCING ACTIVITIES:
Decrease in capital surplus due to exercise of stock acquisition rights ¥ — ¥ (1,637) $ —
Decrease in treasury stock due to exercise of stock acquisition rights 11,207
Decrease in zero coupon convertible bonds due to exercise of stock acquisition rights 9,570
See notes to consolidated financial statements.
33YAMATO HOLDINGS CO., LTD. Annual Review 2017
Notes to Consolidated Financial StatementsYear Ended March 31, 2017
1. BASIS OF PRESENTATION OF CONSOLIDATED FINANCIAL STATEMENTS
The accompanying consolidated financial statements have been prepared in accordance with the provisions set forth in the Japanese Financial Instruments and Exchange Act and its related accounting regulations, and in accordance with accounting principles generally accepted in Japan (“Japanese GAAP”), which are different in certain respects as to the application and disclo-sure requirements of International Financial Reporting Standards.
In preparing these consolidated financial statements, certain reclassifications and rearrangements have been made to the consolidated financial statements issued domestically in order to present them in a form which is more familiar to readers out-side Japan. In addition, certain reclassifications and rearrangements have been made in the 2016 consolidated financial state-ments to conform them to the classifications and presentations used in 2017.
The consolidated financial statements are stated in Japanese yen, the currency of the country in which Yamato Holdings Co., Ltd. (the “Company”) is incorporated and operates. The translations of Japanese yen amounts into U.S. dollar amounts are included solely for the convenience of readers outside Japan and have been made at the rate of ¥112.19 to $1, the approximate rate of exchange at March 31, 2017. Such translations should not be construed as representations that the Japanese yen amounts could be converted into U.S. dollars at that or any other rate.
2. SUMMARY OF SIGNIFICANT ACCOUNTING POLICIES
a. Consolidation—The consolidated financial statements as of March 31, 2017, include the accounts of the Company and its 39 significant (40 in 2016) subsidiaries (together, the “Group”).
Under the control and influence concepts, those companies in which the Company, directly or indirectly, is able to exercise control over operations are fully consolidated, and those companies over which the Group has the ability to exercise significant influence are accounted for by the equity method.
The unconsolidated subsidiaries, whose combined assets, net sales, net income and retained earnings in the aggregate are not significant to the consolidated financial statements, have not been consolidated with the Company.
There were 14 affiliates accounted for by the equity method in 2017. No affiliates were accounted for by the equity method in 2016.
Effective from the fiscal year ended March 31, 2017, the scope of equity method includes GD EXPRESS CARRIER BHD., Packcity Japan Co., Ltd. and GUANGZHOU WISEPOWER TRANSPORTATION & DISTRIBUTION GROUP CO., LTD. following the new acquisition of shares, and also includes 11 subsidiaries of GD EXPRESS CARRIER BHD.
Investments in the unconsolidated subsidiaries and several affiliates not accounted for by equity method are stated at cost, less a valuation allowance representing possible losses on the investments that are deemed to be other than temporary. If the equity method of accounting had been applied to the investments in such companies, the effect on the accompanying consoli-dated financial statements would not be material.
All significant intercompany balances and transactions have been eliminated in consolidation. All material unrealized profit included in assets resulting from transactions within the Group is also eliminated.
b. Unification of Accounting Policies Applied to Foreign Subsidiaries for the Consolidated Financial Statements—Under Accounting Standards Board of Japan (“ASBJ”) Practical Issues Task Force (“PITF”) No. 18, “Practical Solution on Unification of Accounting Policies Applied to Foreign Subsidiaries for the Consolidated Financial Statements,” the accounting policies and proce-dures applied to a parent company and its subsidiaries for similar transactions and events under similar circumstances should in principle be unified for the preparation of the consolidated financial statements. However, financial statements prepared by foreign subsidiaries in accordance with either International Financial Reporting Standards or generally accepted accounting principles in the United States of America tentatively may be used for the consolidation process, except for the following items which should be adjusted in the consolidation process so that net income is accounted for in accordance with Japanese GAAP, unless they are not material: (a) amortization of goodwill; (b) scheduled amortization of actuarial gain or loss of pensions that has been recorded in equity through other comprehensive income; (c) expensing capitalized development costs of R&D; and (d) cancellation of the fair value model accounting for property, plant and equipment and investment properties and incorporation of the cost model accounting.
c. Recognition of Operating Revenues—The Group recognizes freight charge income as operating revenue at the time when freight has been received from the shipping customer for transportation.
Fees from customers based on installment sales contracts are recognized by the equal installment method.
34 YAMATO HOLDINGS CO., LTD. Annual Review 2017
d. Cash Equivalents—Cash equivalents in the consolidated statement of cash flows are short-term investments that are readily convertible into cash and that are exposed to insignificant risk of changes in value. Cash equivalents in the consolidated state-ment of cash flows include time deposits, certificates of deposit, and mutual funds investing in bonds that represent short-term investments, all of which mature or become due within three months of the date of acquisition. The difference between cash and cash equivalents in the accompanying consolidated balance sheet and cash and cash equiv-alents in the accompanying consolidated statement of cash flows was as follows:
Millions of YenThousands of U.S. Dollars
2017 2016 2017
Cash and cash equivalents presented in the consolidated balance sheet ¥230,129 ¥249,594 $2,051,241
Time deposits due beyond three months (1,203) (10,716)
Bank overdraft (332)
C ash and cash equivalents presented in the consolidated statement of cash flows ¥228,926 ¥249,262 $2,040,525
e. Inventories—Inventories are stated at the lower of cost determined by the first-in, first-out method or net selling value.
f. Marketable and Investment Securities—Marketable and investment securities are classified and accounted for, depending on management’s intent, as follows: (1) trading securities, which are held for the purpose of earning capital gains in near term, are reported at fair value, and the related unrealized gains and losses are included in earnings; (2) held-to-maturity debt securi-ties, for which there is a positive intent and ability to hold to maturity, are reported at amortized cost; and (3) available-for-sale securities, which are not classified as either of the aforementioned securities, are reported at fair value, with unrealized gains and losses, net of applicable taxes, reported in a separate component of equity. The Group had no trading securities at March 31, 2017 and 2016. Non-marketable available-for-sale securities are stated at cost determined by the moving-average method.
For other-than-temporary declines in fair value, investment securities are reduced to net realizable value by a charge to income.
g. Property, Plant and Equipment—Property, plant and equipment are stated at cost. Depreciation of property, plant and equip-ment excluding leased assets of the Company and its domestic consolidated subsidiaries is computed substantially by the declining-balance method, while the straight-line method is applied to buildings acquired on or after April 1, 1998, and facilities attached to buildings and structures acquired on or after April 1, 2016. Depreciation of leased assets is computed by the straight-line method over the lease period with no residual value carried.
The depreciation of property, plant and equipment of foreign consolidated subsidiaries is computed by the straight-line method over the estimated useful lives of the assets. The range of useful lives is principally as follows:
Buildings and structures 7–60 years Vehicles 2– 7 years Machinery and equipment 2–20 years
Maintenance and repairs, including minor renewals and improvements, are charged to income as incurred.
h. Long-Lived Assets—The Group reviews its long-lived assets for impairment whenever events or changes in circumstances indicate the carrying amount of an asset or asset group may not be recoverable. An impairment loss is recognized if the carrying amount of an asset or asset group exceeds the sum of the undiscounted future cash flows expected to result from the continued use and eventual disposition of the asset or asset group. The impairment loss would be measured as the amount by which the carrying amount of the asset exceeds its recoverable amount, which is the higher of the discounted cash flows from the continued use and eventual disposition of the asset or the net selling price at disposition.
i. Other Assets—Amortization of intangible assets is computed by the straight-line method.Depreciation of leased assets is computed by the straight-line method over the lease period with no residual value carried.
j. Provision for Special Wage Payments—The Group conducted investigation during the fiscal year ended March 31, 2017, in order to measure unrecognized working hours. The provision for special wage payments has been recorded on the basis of the estimated amount of payment with regard to consideration for labor in accordance with the result of the investigation.
35YAMATO HOLDINGS CO., LTD. Annual Review 2017

k. Retirement and Pension Plan—The Company and consolidated subsidiaries mainly have a contributory trusted pension plan and an unfunded retirement benefit plan. In addition, a defined contribution retirement plan was introduced along with these defined benefit pension plans.
In calculating the retirement benefit obligations, the straight-line basis is used in determining the amount of the expected retirement benefit obligations attributed to service performed up to the end of the current fiscal year.
Past service costs are recognized in profit or loss in full in the fiscal year in which it arises. Actuarial gains and losses are amortized on a straight-line basis over five years within the average remaining service period of the eligible employees on and after the fiscal year following the fiscal year in which it arises.
Actuarial gains and losses are recognized within equity on the consolidated balance sheet after adjusting for tax effects, and funded status is recognized as a liability or asset.
l. Asset Retirement Obligations—An asset retirement obligation is recorded for a legal obligation imposed either by law or contract that results from the acquisition, construction, development, and normal operation of a tangible fixed asset and is asso-ciated with the retirement of such tangible fixed asset.
The asset retirement obligation is recognized as the sum of the discounted cash flows required for the future asset retirement and is recorded in the period in which the obligation is incurred if a reasonable estimate can be made. If a reasonable estimate of the asset retirement obligation cannot be made in the period the asset retirement obligation is incurred, the liability should be recognized when a reasonable estimate of the asset retirement obligation can be made. Upon initial recognition of a liability for an asset retirement obligation, an asset retirement cost is capitalized by increasing the carrying amount of the related fixed asset by the amount of the liability. The asset retirement cost is subsequently allocated to expense through depreciation over the remaining useful life of the asset. Over time, the liability is accreted to its present value each period. Any subsequent revisions to the timing or the amount of the original estimate of undiscounted cash flows are reflected as reconciliation to the carrying amount of the liability and the capitalized amount of the related asset retirement cost.
m. Leases—For a lessee, all finance lease transactions are capitalized to recognize lease assets and lease obligations in the balance sheet.
For a lessor, all finance leases that deem to transfer ownership of the leased property to the lessee are recognized as lease receivables, and all finance leases that deem not to transfer ownership of the leased property to the lessee are recognized as investments in leases.
n. Income Taxes—The provision for income taxes is computed based on the pretax income included in the consolidated state-ment of income. The asset and liability approach is used to recognize deferred tax assets and liabilities for the expected future tax consequences of temporary differences between the carrying amounts and the tax bases of assets and liabilities. Deferred taxes are measured by applying currently enacted tax rates to the temporary differences.
The Company applied ASBJ Guidance No. 26, “Guidance on Recoverability of Deferred Tax Assets,” effective April 1, 2016. There was no impact from this for the year ended March 31, 2017.
o. Foreign Currency Transactions—All short and long-term monetary receivables and payables denominated in foreign cur-rencies are translated into Japanese yen at the exchange rates at the balance sheet date.
p. Derivative Financial Instruments—The Company and certain consolidated subsidiaries use derivative financial instruments to manage their exposures to fluctuations in interest rates. Interest rate swaps are utilized by the Company and the consolidated sub-sidiaries to reduce interest rate risks. The Group has a policy not to enter into derivatives for trading or speculative purposes.
The interest rate swaps, which qualify for hedge accounting and meet specific matching criteria, are not remeasured at market value but the differential paid or received under the swap agreements is recognized and included in interest expense or income.
q. Foreign Currency Financial Statements—The balance sheet accounts of the consolidated foreign subsidiaries are translated into Japanese yen at the current exchange rate as of the balance sheet date except for equity, which is translated at the historical rate. Differences arising from such translation are shown as “Foreign currency translation adjustments” under accumulated other comprehensive income in a separate component of equity.
Revenue and expense accounts of the consolidated foreign subsidiaries are translated into Japanese yen at the current exchange rates as of the balance sheet date.
36 YAMATO HOLDINGS CO., LTD. Annual Review 2017
r. Per Share Information—Basic net income per share is computed by dividing net income attributable to common shareholders by the weighted-average number of common shares outstanding for the period, retroactively adjusted for stock splits.
Diluted net income per share reflects the potential dilution that could occur if securities were exercised or converted into common stock. Diluted net income per share of common stock assumes full conversion of the outstanding convertible notes and bonds at the beginning of the year (or at the time of issuance) with an applicable adjustment for related interest expense, net of tax, and full exercise of outstanding warrants.
For the year ended March 31, 2017, diluted net income per share is not disclosed because the Company had no dilutive securities.Cash dividends per share presented in the accompanying consolidated statement of income are dividends applicable to the
respective years, including dividends to be paid after the end of the year.
s. Accounting Changes and Error Corrections—Under ASBJ Statement No. 24, “Accounting Standard for Accounting Changes and Error Corrections,” and ASBJ Guidance No. 24, “Guidance on Accounting Standard for Accounting Changes and Error Corrections,” accounting treatments are required as follows:
(1) Changes in Accounting Policies—When a new accounting policy is applied following revision of an accounting standard, the new policy is applied retrospectively unless the revised accounting standard includes specific transitional provisions, in which case the entity shall comply with the specific transitional provisions. (2) Changes in Presentation—When the presentation of financial statements is changed, prior-period financial statements are reclassified in accordance with the new presentation. (3) Changes in Accounting Estimates—A change in an accounting estimate is accounted for in the period of the change if the change affects that period only, and is accounted for prospectively if the change affects both the period of the change and future periods. (4) Corrections of Prior-Period Errors—When an error in prior-period financial statements is discovered, those statements are restated.
3. ACCOUNTING CHANGES
Application of Practical Solution on a Change in Depreciation Method Due to Tax Reform 2016—Following the revision to the Corporation Tax Act, the Company has applied the “Practical Solution on a Change in Depreciation Method Due to Tax Reform 2016” (ASBJ PITF No.32) since the fiscal year ended March 31, 2017, and changed the depreciation method for facilities attached to buildings and structures acquired on or after April 1, 2016, from the declining-balance method to the straight-line method.
As a result of this change, operating income and income before income taxes increased by ¥189 million ($1,685 thousand) for the fiscal year ended March 31, 2017.
4. NOTES AND ACCOUNTS RECEIVABLE
Sales recorded on the installment basis were 0.3% of operating revenues in both 2017 and 2016.Annual maturities of notes and accounts receivable—installment at March 31, 2017, and related amortization of deferred
profit on installment sales are as follows:
Millions of Yen Thousands of U.S. Dollars
Year Ending March 31 ReceivablesDeferred Profit on Installment Sales Receivables
Deferred Profit on Installment Sales
2018 ¥22,982 ¥2,346 $204,848 $20,909
2019 11,403 1,657 101,638 14,776
2020 6,422 1,023 57,240 9,120
2021 3,123 531 27,835 4,730
2022 1,464 276 13,048 2,458
2023 and thereafter 748 177 6,671 1,578
Total ¥46,142 ¥6,010 $411,280 $53,571
37YAMATO HOLDINGS CO., LTD. Annual Review 2017
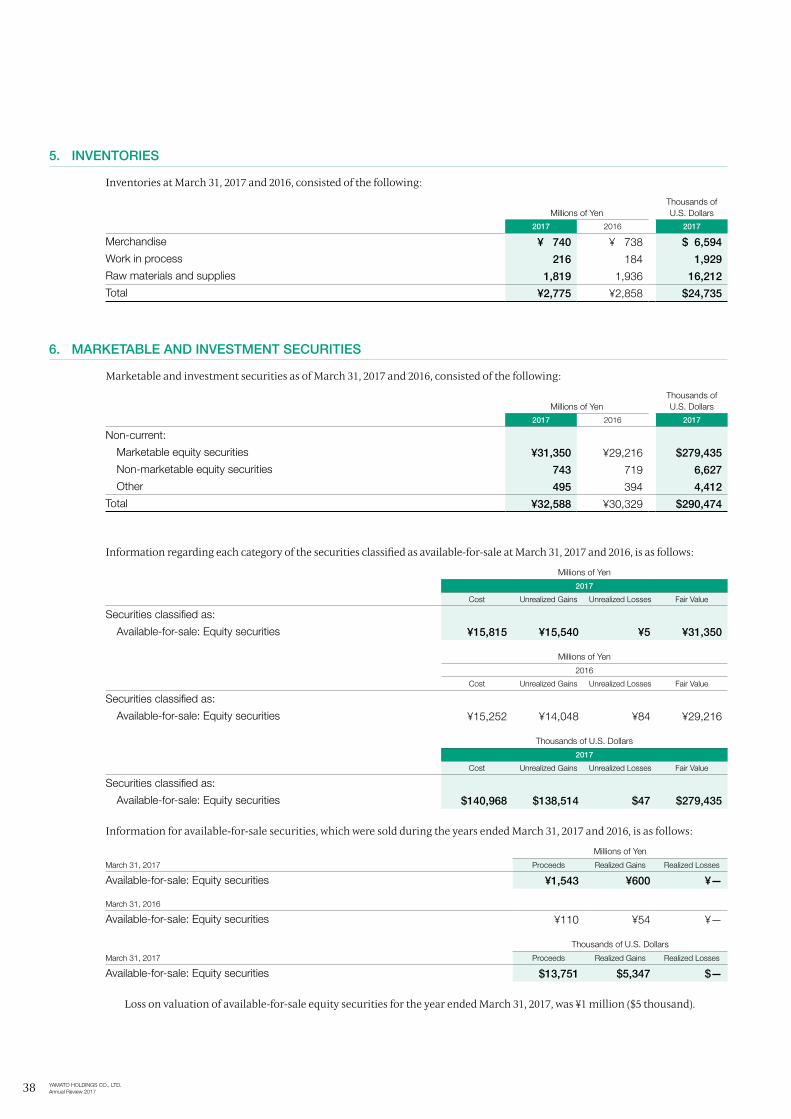
5. INVENTORIES
Inventories at March 31, 2017 and 2016, consisted of the following:
Millions of YenThousands of U.S. Dollars
2017 2016 2017
Merchandise ¥ 740 ¥ 738 $ 6,594
Work in process 216 184 1,929
Raw materials and supplies 1,819 1,936 16,212
Total ¥2,775 ¥2,858 $24,735
6. MARKETABLE AND INVESTMENT SECURITIES
Marketable and investment securities as of March 31, 2017 and 2016, consisted of the following:
Millions of YenThousands of U.S. Dollars
2017 2016 2017
Non-current:
Marketable equity securities ¥31,350 ¥29,216 $279,435
Non-marketable equity securities 743 719 6,627
Other 495 394 4,412
Total ¥32,588 ¥30,329 $290,474
Information regarding each category of the securities classified as available-for-sale at March 31, 2017 and 2016, is as follows:
Millions of Yen
2017
Cost Unrealized Gains Unrealized Losses Fair Value
Securities classified as:
Available-for-sale: Equity securities ¥15,815 ¥15,540 ¥5 ¥31,350
Millions of Yen
2016
Cost Unrealized Gains Unrealized Losses Fair Value
Securities classified as:
Available-for-sale: Equity securities ¥15,252 ¥14,048 ¥84 ¥29,216
Thousands of U.S. Dollars
2017
Cost Unrealized Gains Unrealized Losses Fair Value
Securities classified as:
Available-for-sale: Equity securities $140,968 $138,514 $47 $279,435
Information for available-for-sale securities, which were sold during the years ended March 31, 2017 and 2016, is as follows:
Millions of Yen
March 31, 2017 Proceeds Realized Gains Realized Losses
Available-for-sale: Equity securities ¥1,543 ¥600 ¥—
March 31, 2016
Available-for-sale: Equity securities ¥110 ¥54 ¥—
Thousands of U.S. Dollars
March 31, 2017 Proceeds Realized Gains Realized Losses
Available-for-sale: Equity securities $13,751 $5,347 $—
Loss on valuation of available-for-sale equity securities for the year ended March 31, 2017, was ¥1 million ($5 thousand).
38 YAMATO HOLDINGS CO., LTD. Annual Review 2017

7. LONG-LIVED ASSETS
The Group reviewed its long-lived assets for impairment as of the years ended March 31, 2017 and 2016. As a result, the Group recognized an impairment loss of ¥1,284 million ($11,447 thousand) as other expense for the asset groups of the Aomori Regional Branch of Yamato Transport Co., Ltd. and nine other asset groups for the year ended March 31, 2017, and ¥1,155 million as other expense for the asset groups of the Tokushima Regional Branch of Yamato Transport Co., Ltd. and eight other asset groups for the year ended March 31, 2016, due to continuous operating losses of those units or significant declines in market prices. The carry-ing amounts of the relevant asset groups were written down to their recoverable amounts. In the case where the net selling prices were used as recoverable amounts, the relevant asset groups were evaluated mainly based on Real Estate Appraisal Standards, assessed value of fixed assets, and posted land prices.
8. BANK LOANS AND LONG-TERM DEBT
Short-term bank loans at March 31, 2017 and 2016, consisted of notes to banks and bank overdrafts. The weighted-average interest rates applicable to the bank loans as of March 31, 2017 and 2016, were approximately 0.103% and 0.708%, respectively.Long-term debt at March 31, 2017 and 2016, consisted of the following:
Millions of YenThousands of U.S. Dollars
2017 2016 2017
0.010% to 0.430% loans from banks due 2017 to 2022 ¥130,776 $1,165,665
0.010% to 5.500% loans from banks due 2016 to 2020 ¥122,834
Lease obligations 7,295 7,898 65,018
Unsecured 0.050% bonds due in March 2019 10,000 10,000 89,135
Unsecured 0.090% bonds due in March 2021 10,000 10,000 89,135
Total 158,071 150,732 1,408,953
Less current portion (43,304) (34,829) (385,987)
Total ¥114,767 ¥115,903 $1,022,966
Annual maturities of long-term debt at March 31, 2017, are as follows:
Year Ending March 31 Millions of YenThousands of U.S. Dollars
2018 ¥ 43,304 $ 385,987
2019 45,680 407,170
2020 42,327 377,275
2021 16,246 144,809
2022 10,231 91,191
2023 and thereafter 283 2,521
Total ¥158,071 $1,408,953
39YAMATO HOLDINGS CO., LTD. Annual Review 2017
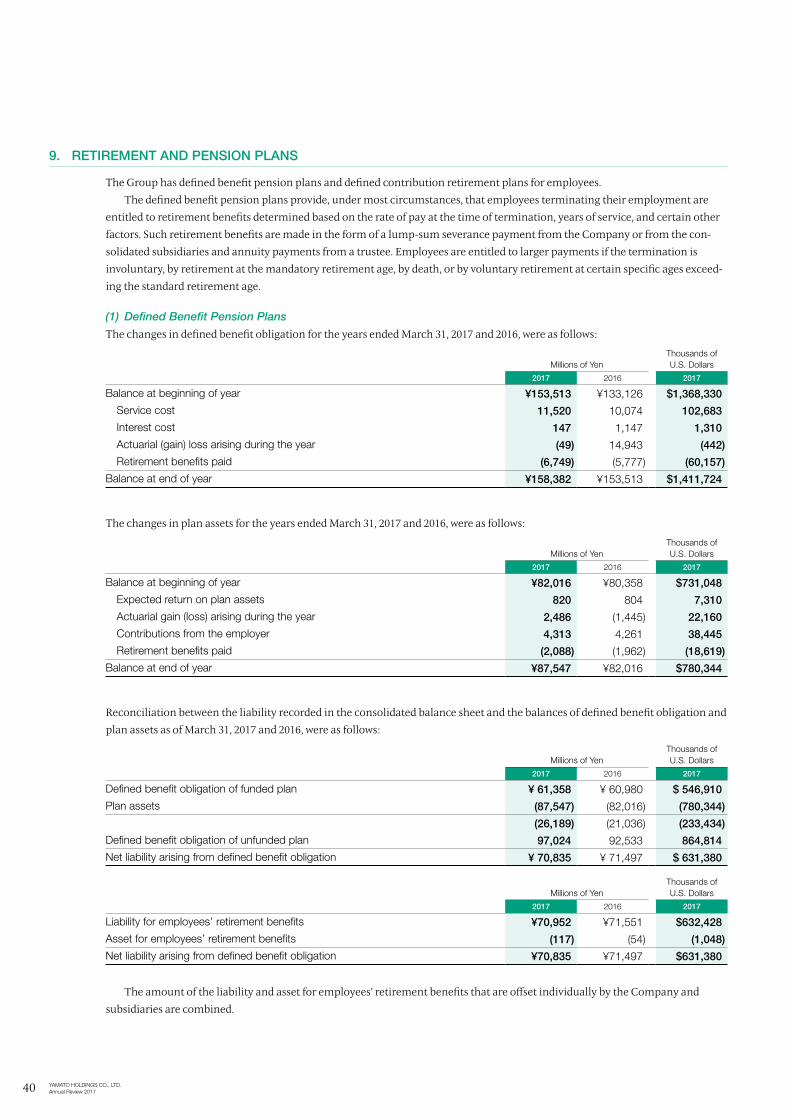
9. RETIREMENT AND PENSION PLANS
The Group has defined benefit pension plans and defined contribution retirement plans for employees.The defined benefit pension plans provide, under most circumstances, that employees terminating their employment are
entitled to retirement benefits determined based on the rate of pay at the time of termination, years of service, and certain other factors. Such retirement benefits are made in the form of a lump-sum severance payment from the Company or from the con-solidated subsidiaries and annuity payments from a trustee. Employees are entitled to larger payments if the termination is involuntary, by retirement at the mandatory retirement age, by death, or by voluntary retirement at certain specific ages exceed-ing the standard retirement age.
(1) Defined Benefit Pension Plans
The changes in defined benefit obligation for the years ended March 31, 2017 and 2016, were as follows:
Millions of YenThousands of U.S. Dollars
2017 2016 2017
Balance at beginning of year ¥153,513 ¥133,126 $1,368,330
Service cost 11,520 10,074 102,683
Interest cost 147 1,147 1,310
Actuarial (gain) loss arising during the year (49) 14,943 (442)
Retirement benefits paid (6,749) (5,777) (60,157)
Balance at end of year ¥158,382 ¥153,513 $1,411,724
The changes in plan assets for the years ended March 31, 2017 and 2016, were as follows:
Millions of YenThousands of U.S. Dollars
2017 2016 2017
Balance at beginning of year ¥82,016 ¥80,358 $731,048
Expected return on plan assets 820 804 7,310
Actuarial gain (loss) arising during the year 2,486 (1,445) 22,160
Contributions from the employer 4,313 4,261 38,445
Retirement benefits paid (2,088) (1,962) (18,619)
Balance at end of year ¥87,547 ¥82,016 $780,344
Reconciliation between the liability recorded in the consolidated balance sheet and the balances of defined benefit obligation and plan assets as of March 31, 2017 and 2016, were as follows:
Millions of YenThousands of U.S. Dollars
2017 2016 2017
Defined benefit obligation of funded plan ¥ 61,358 ¥ 60,980 $ 546,910
Plan assets (87,547) (82,016) (780,344)
(26,189) (21,036) (233,434)
Defined benefit obligation of unfunded plan 97,024 92,533 864,814
Net liability arising from defined benefit obligation ¥ 70,835 ¥ 71,497 $ 631,380
Millions of YenThousands of U.S. Dollars
2017 2016 2017
Liability for employees’ retirement benefits ¥70,952 ¥71,551 $632,428
Asset for employees’ retirement benefits (117) (54) (1,048)
Net liability arising from defined benefit obligation ¥70,835 ¥71,497 $631,380
The amount of the liability and asset for employees’ retirement benefits that are offset individually by the Company and subsidiaries are combined.
40 YAMATO HOLDINGS CO., LTD. Annual Review 2017
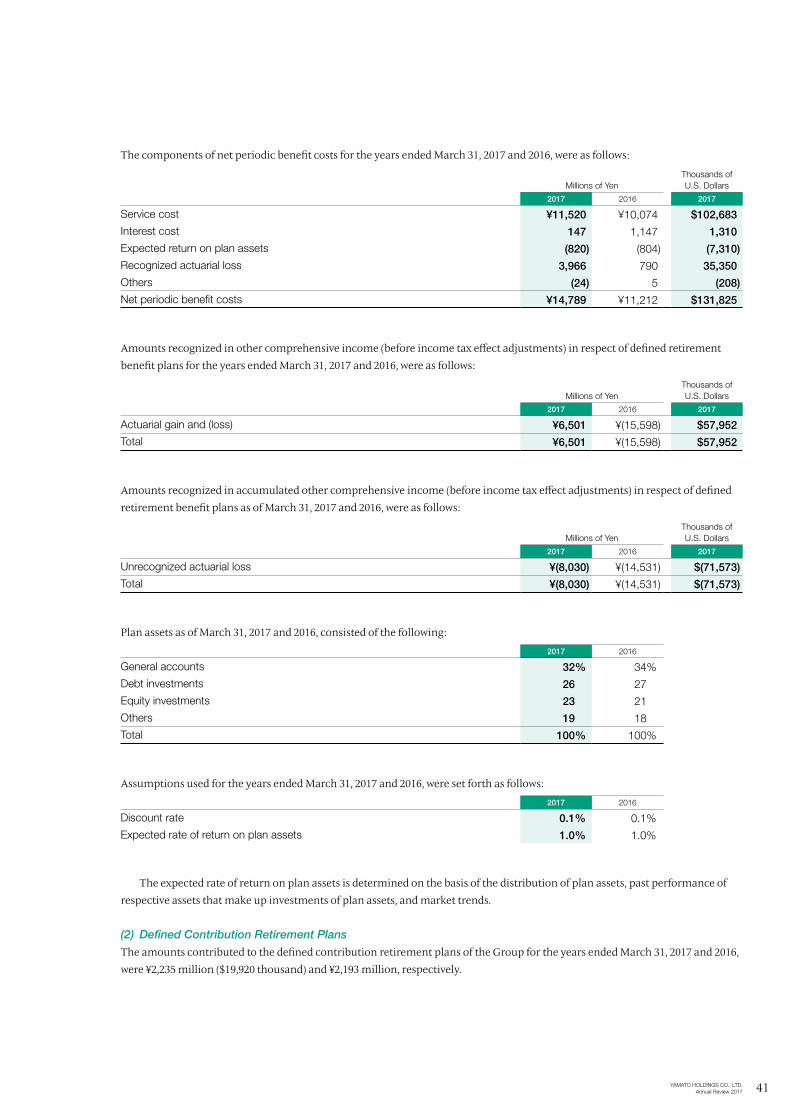
The components of net periodic benefit costs for the years ended March 31, 2017 and 2016, were as follows:
Millions of YenThousands of U.S. Dollars
2017 2016 2017
Service cost ¥11,520 ¥10,074 $102,683
Interest cost 147 1,147 1,310
Expected return on plan assets (820) (804) (7,310)
Recognized actuarial loss 3,966 790 35,350
Others (24) 5 (208)
Net periodic benefit costs ¥14,789 ¥11,212 $131,825
Amounts recognized in other comprehensive income (before income tax effect adjustments) in respect of defined retirement benefit plans for the years ended March 31, 2017 and 2016, were as follows:
Millions of YenThousands of U.S. Dollars
2017 2016 2017
Actuarial gain and (loss) ¥6,501 ¥(15,598) $57,952
Total ¥6,501 ¥(15,598) $57,952
Amounts recognized in accumulated other comprehensive income (before income tax effect adjustments) in respect of defined retirement benefit plans as of March 31, 2017 and 2016, were as follows:
Millions of YenThousands of U.S. Dollars
2017 2016 2017
Unrecognized actuarial loss ¥(8,030) ¥(14,531) $(71,573)
Total ¥(8,030) ¥(14,531) $(71,573)
Plan assets as of March 31, 2017 and 2016, consisted of the following:
2017 2016
General accounts 32% 34%
Debt investments 26 27
Equity investments 23 21
Others 19 18
Total 100% 100%
Assumptions used for the years ended March 31, 2017 and 2016, were set forth as follows:
2017 2016
Discount rate 0.1% 0.1%
Expected rate of return on plan assets 1.0% 1.0%
The expected rate of return on plan assets is determined on the basis of the distribution of plan assets, past performance of respective assets that make up investments of plan assets, and market trends.
(2) Defined Contribution Retirement Plans
The amounts contributed to the defined contribution retirement plans of the Group for the years ended March 31, 2017 and 2016, were ¥2,235 million ($19,920 thousand) and ¥2,193 million, respectively.
41YAMATO HOLDINGS CO., LTD. Annual Review 2017

10. ASSET RETIREMENT OBLIGATIONS
The changes in asset retirement obligations for the years ended March 31, 2017 and 2016, were as follows:
Millions of YenThousands of U.S. Dollars
2017 2016 2017
Balance at beginning of year ¥5,184 ¥4,980 $46,203
A dditional provisions associated with the acquisition of property, plant and equipment 326 150 2,905
Reconciliation associated with passage of time 99 95 886
Reconciliation associated with changes in accounting estimates 15 30 133
Reduction associated with settlement of asset retirement obligations (46) (61) (408)
Others (43) (10) (380)
Balance at end of year ¥5,535 ¥5,184 $49,339
Changes in accounting estimates were recorded as it became evident that the estimate of the discounted cash flows required for future asset retirement would change at the beginning of the year. A reconciliation has been prepared for the change, which resulted in an increase of the asset retirement obligation for the years ended March 31, 2017 and 2016, by ¥15 million ($133 thou-sand) and ¥30 million, respectively.
11. EQUITY
Japanese companies are subject to the Companies Act of Japan (the “Companies Act”). The significant provisions in the Companies Act that affect financial and accounting matters are summarized below:
a. Dividends
Under the Companies Act, companies can pay dividends at any time during the fiscal year in addition to the year-end dividend upon resolution at the shareholders’ meeting. For companies that meet certain criteria such as (1) having a Board of Directors, (2) having independent auditors, (3) having an Audit & Supervisory Board, and (4) the term of service of the directors being prescribed as one year rather than the normal two-year term by its articles of incorporation, the Board of Directors may declare dividends (except for dividends-in-kind) at any time during the fiscal year if the company has prescribed so in its articles of incor-poration. The Company meets all the above criteria.
The Companies Act permits companies to distribute dividends-in-kind (non-cash assets) to shareholders subject to a certain limitation and additional requirements.
Semiannual interim dividends may also be paid once a year upon resolution by the Board of Directors if the articles of incor-poration of the company so stipulate. The Companies Act provides certain limitations on the amounts available for dividends or the purchase of treasury stock. The limitation is defined as the amount available for distribution to the shareholders, but the amount of net assets after dividends must be maintained at no less than ¥3 million.
b. Increases/Decreases and Transfer of Common Stock, Reserve and Surplus
The Companies Act requires that an amount equal to 10% of dividends must be appropriated as a legal reserve (a component of retained earnings) or as additional paid-in capital (a component of capital surplus) depending on the equity account charged upon the payment of such dividends until the aggregate amount of legal reserve and additional paid-in capital equals 25% of the common stock. Under the Companies Act, the total amount of additional paid-in capital and legal reserve may be reversed without limitation. The Companies Act also provides that common stock, legal reserve, additional paid-in capital, other capital surplus, and retained earnings can be transferred among the accounts within equity under certain conditions upon resolution of the shareholders.
c. Treasury Stock
The Companies Act also provides for companies to purchase treasury stock and dispose of such treasury stock by resolution of the Board of Directors. The amount of treasury stock purchased cannot exceed the amount available for distribution to the sharehold-ers, which is determined by a specific formula. The Companies Act also provides that companies can purchase both treasury stock acquisition rights and treasury stock. Such treasury stock acquisition rights are presented as a separate component of equity.
42 YAMATO HOLDINGS CO., LTD. Annual Review 2017
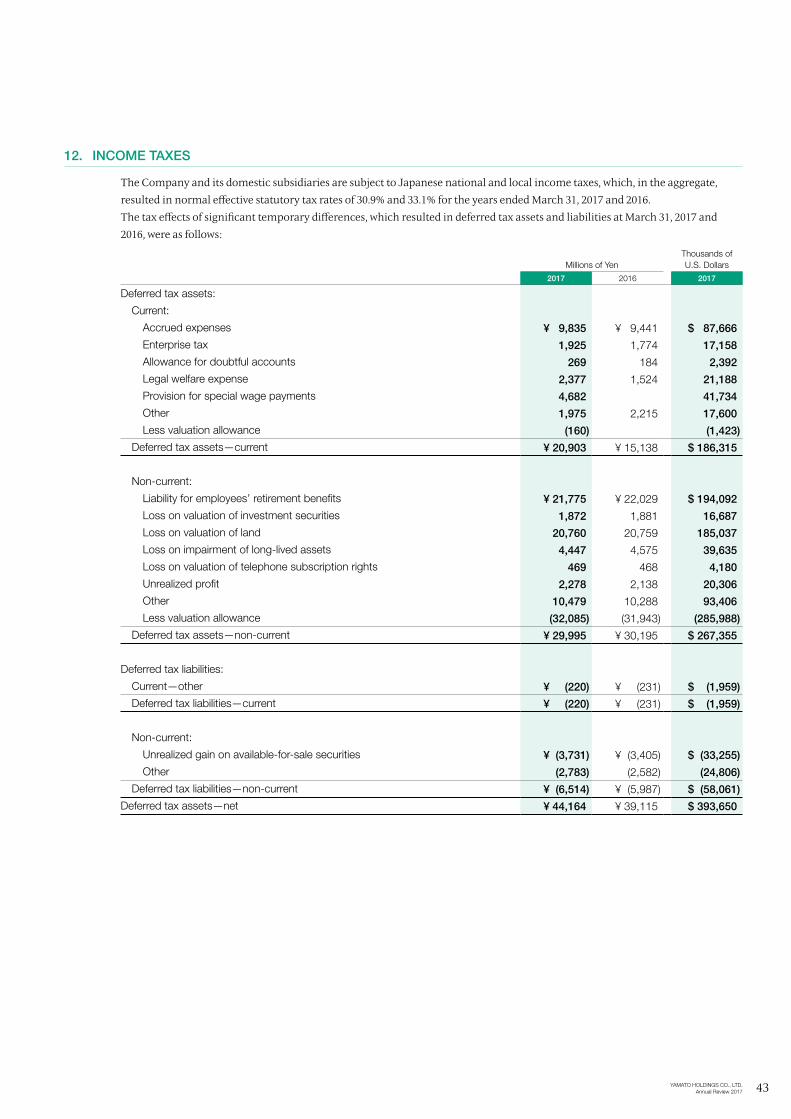
12. INCOME TAXES
The Company and its domestic subsidiaries are subject to Japanese national and local income taxes, which, in the aggregate, resulted in normal effective statutory tax rates of 30.9% and 33.1% for the years ended March 31, 2017 and 2016.The tax effects of significant temporary differences, which resulted in deferred tax assets and liabilities at March 31, 2017 and 2016, were as follows:
Millions of YenThousands of U.S. Dollars
2017 2016 2017
Deferred tax assets:
Current:
Accrued expenses ¥ 9,835 ¥ 9,441 $ 87,666
Enterprise tax 1,925 1,774 17,158
Allowance for doubtful accounts 269 184 2,392
Legal welfare expense 2,377 1,524 21,188
Provision for special wage payments 4,682 41,734
Other 1,975 2,215 17,600
Less valuation allowance (160) (1,423)
Deferred tax assets—current ¥ 20,903 ¥ 15,138 $ 186,315
Non-current:
Liability for employees’ retirement benefits ¥ 21,775 ¥ 22,029 $ 194,092
Loss on valuation of investment securities 1,872 1,881 16,687
Loss on valuation of land 20,760 20,759 185,037
Loss on impairment of long-lived assets 4,447 4,575 39,635
Loss on valuation of telephone subscription rights 469 468 4,180
Unrealized profit 2,278 2,138 20,306
Other 10,479 10,288 93,406
Less valuation allowance (32,085) (31,943) (285,988)
Deferred tax assets—non-current ¥ 29,995 ¥ 30,195 $ 267,355
Deferred tax liabilities:
Current—other ¥ (220) ¥ (231) $ (1,959)
Deferred tax liabilities—current ¥ (220) ¥ (231) $ (1,959)
Non-current:
Unrealized gain on available-for-sale securities ¥ (3,731) ¥ (3,405) $ (33,255)
Other (2,783) (2,582) (24,806)
Deferred tax liabilities—non-current ¥ (6,514) ¥ (5,987) $ (58,061)
Deferred tax assets—net ¥ 44,164 ¥ 39,115 $ 393,650
43YAMATO HOLDINGS CO., LTD. Annual Review 2017
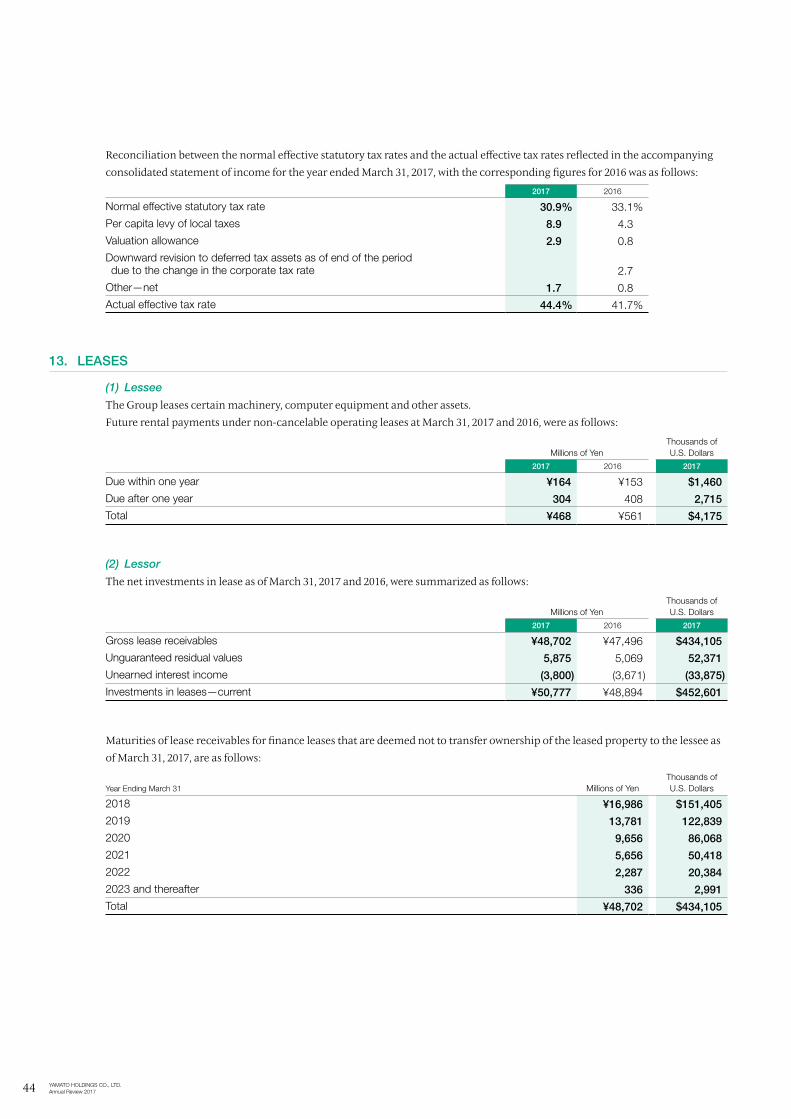
Reconciliation between the normal effective statutory tax rates and the actual effective tax rates reflected in the accompanying consolidated statement of income for the year ended March 31, 2017, with the corresponding figures for 2016 was as follows:
2017 2016
Normal effective statutory tax rate 30.9% 33.1%
Per capita levy of local taxes 8.9 4.3
Valuation allowance 2.9 0.8
Downward revision to deferred tax assets as of end of the period due to the change in the corporate tax rate 2.7
Other—net 1.7 0.8
Actual effective tax rate 44.4% 41.7%
13. LEASES
(1) Lessee
The Group leases certain machinery, computer equipment and other assets.Future rental payments under non-cancelable operating leases at March 31, 2017 and 2016, were as follows:
Millions of YenThousands of U.S. Dollars
2017 2016 2017
Due within one year ¥164 ¥153 $1,460
Due after one year 304 408 2,715
Total ¥468 ¥561 $4,175
(2) Lessor
The net investments in lease as of March 31, 2017 and 2016, were summarized as follows:
Millions of YenThousands of U.S. Dollars
2017 2016 2017
Gross lease receivables ¥48,702 ¥47,496 $434,105
Unguaranteed residual values 5,875 5,069 52,371
Unearned interest income (3,800) (3,671) (33,875)
Investments in leases—current ¥50,777 ¥48,894 $452,601
Maturities of lease receivables for finance leases that are deemed not to transfer ownership of the leased property to the lessee as of March 31, 2017, are as follows:
Year Ending March 31 Millions of YenThousands of U.S. Dollars
2018 ¥16,986 $151,405
2019 13,781 122,839
2020 9,656 86,068
2021 5,656 50,418
2022 2,287 20,384
2023 and thereafter 336 2,991
Total ¥48,702 $434,105
44 YAMATO HOLDINGS CO., LTD. Annual Review 2017
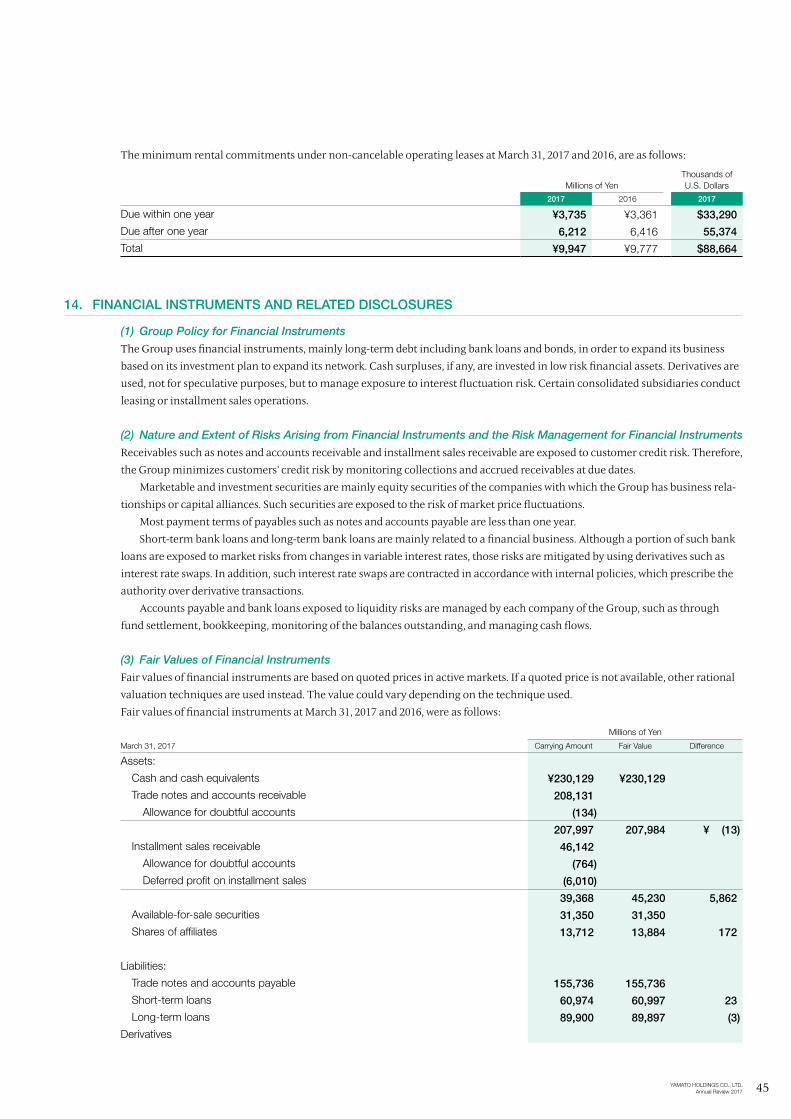
The minimum rental commitments under non-cancelable operating leases at March 31, 2017 and 2016, are as follows:
Millions of YenThousands of U.S. Dollars
2017 2016 2017
Due within one year ¥3,735 ¥3,361 $33,290
Due after one year 6,212 6,416 55,374
Total ¥9,947 ¥9,777 $88,664
14. FINANCIAL INSTRUMENTS AND RELATED DISCLOSURES
(1) Group Policy for Financial Instruments
The Group uses financial instruments, mainly long-term debt including bank loans and bonds, in order to expand its business based on its investment plan to expand its network. Cash surpluses, if any, are invested in low risk financial assets. Derivatives are used, not for speculative purposes, but to manage exposure to interest fluctuation risk. Certain consolidated subsidiaries conduct leasing or installment sales operations.
(2) Nature and Extent of Risks Arising from Financial Instruments and the Risk Management for Financial Instruments
Receivables such as notes and accounts receivable and installment sales receivable are exposed to customer credit risk. Therefore, the Group minimizes customers’ credit risk by monitoring collections and accrued receivables at due dates.
Marketable and investment securities are mainly equity securities of the companies with which the Group has business rela-tionships or capital alliances. Such securities are exposed to the risk of market price fluctuations.
Most payment terms of payables such as notes and accounts payable are less than one year.Short-term bank loans and long-term bank loans are mainly related to a financial business. Although a portion of such bank
loans are exposed to market risks from changes in variable interest rates, those risks are mitigated by using derivatives such as interest rate swaps. In addition, such interest rate swaps are contracted in accordance with internal policies, which prescribe the authority over derivative transactions.
Accounts payable and bank loans exposed to liquidity risks are managed by each company of the Group, such as through fund settlement, bookkeeping, monitoring of the balances outstanding, and managing cash flows.
(3) Fair Values of Financial Instruments
Fair values of financial instruments are based on quoted prices in active markets. If a quoted price is not available, other rational valuation techniques are used instead. The value could vary depending on the technique used.Fair values of financial instruments at March 31, 2017 and 2016, were as follows:
Millions of Yen
March 31, 2017 Carrying Amount Fair Value Difference
Assets:
Cash and cash equivalents ¥230,129 ¥230,129
Trade notes and accounts receivable 208,131
Allowance for doubtful accounts (134)
207,997 207,984 ¥ (13)
Installment sales receivable 46,142
Allowance for doubtful accounts (764)
Deferred profit on installment sales (6,010)
39,368 45,230 5,862
Available-for-sale securities 31,350 31,350
Shares of affiliates 13,712 13,884 172
Liabilities:
Trade notes and accounts payable 155,736 155,736
Short-term loans 60,974 60,997 23
Long-term loans 89,900 89,897 (3)
Derivatives
45YAMATO HOLDINGS CO., LTD. Annual Review 2017
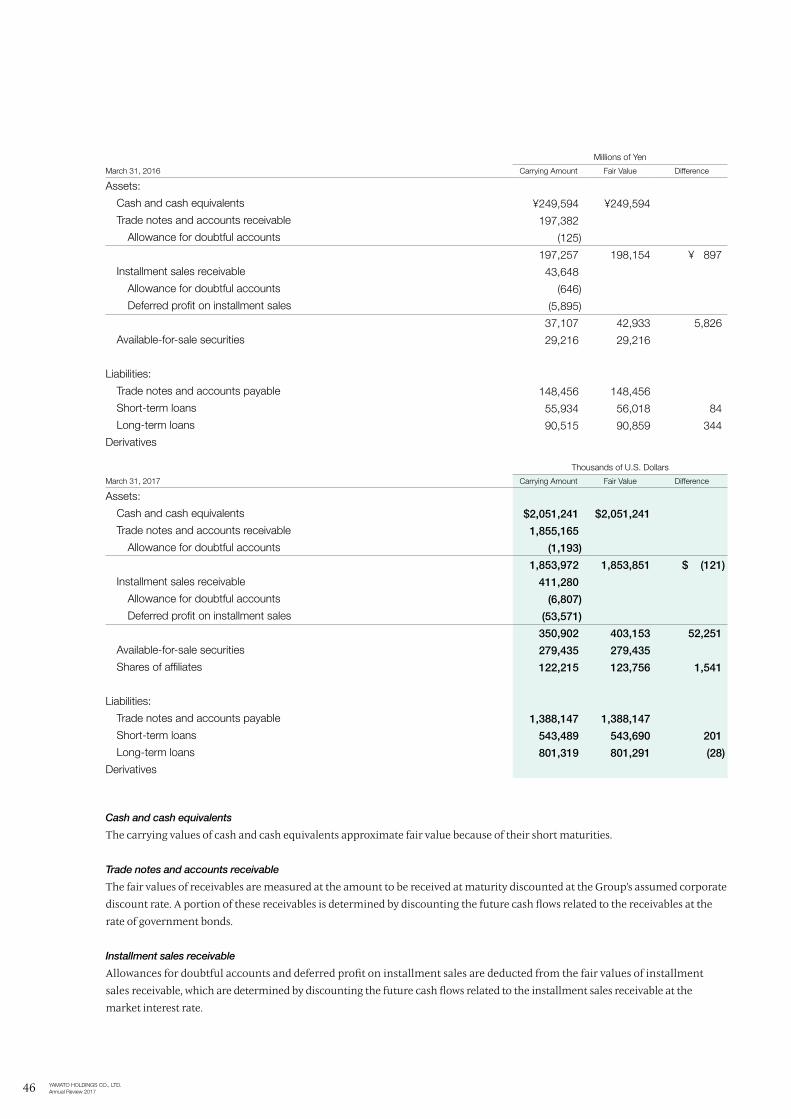
Millions of Yen
March 31, 2016 Carrying Amount Fair Value Difference
Assets:
Cash and cash equivalents ¥249,594 ¥249,594
Trade notes and accounts receivable 197,382
Allowance for doubtful accounts (125)
197,257 198,154 ¥ 897
Installment sales receivable 43,648
Allowance for doubtful accounts (646)
Deferred profit on installment sales (5,895)
37,107 42,933 5,826
Available-for-sale securities 29,216 29,216
Liabilities:
Trade notes and accounts payable 148,456 148,456
Short-term loans 55,934 56,018 84
Long-term loans 90,515 90,859 344
Derivatives
Thousands of U.S. Dollars
March 31, 2017 Carrying Amount Fair Value Difference
Assets:
Cash and cash equivalents $2,051,241 $2,051,241
Trade notes and accounts receivable 1,855,165
Allowance for doubtful accounts (1,193)
1,853,972 1,853,851 $ (121)
Installment sales receivable 411,280
Allowance for doubtful accounts (6,807)
Deferred profit on installment sales (53,571)
350,902 403,153 52,251
Available-for-sale securities 279,435 279,435
Shares of affiliates 122,215 123,756 1,541
Liabilities:
Trade notes and accounts payable 1,388,147 1,388,147
Short-term loans 543,489 543,690 201
Long-term loans 801,319 801,291 (28)
Derivatives
Cash and cash equivalents
The carrying values of cash and cash equivalents approximate fair value because of their short maturities.
Trade notes and accounts receivable
The fair values of receivables are measured at the amount to be received at maturity discounted at the Group’s assumed corporate discount rate. A portion of these receivables is determined by discounting the future cash flows related to the receivables at the rate of government bonds.
Installment sales receivable
Allowances for doubtful accounts and deferred profit on installment sales are deducted from the fair values of installment sales receivable, which are determined by discounting the future cash flows related to the installment sales receivable at the market interest rate.
46 YAMATO HOLDINGS CO., LTD. Annual Review 2017
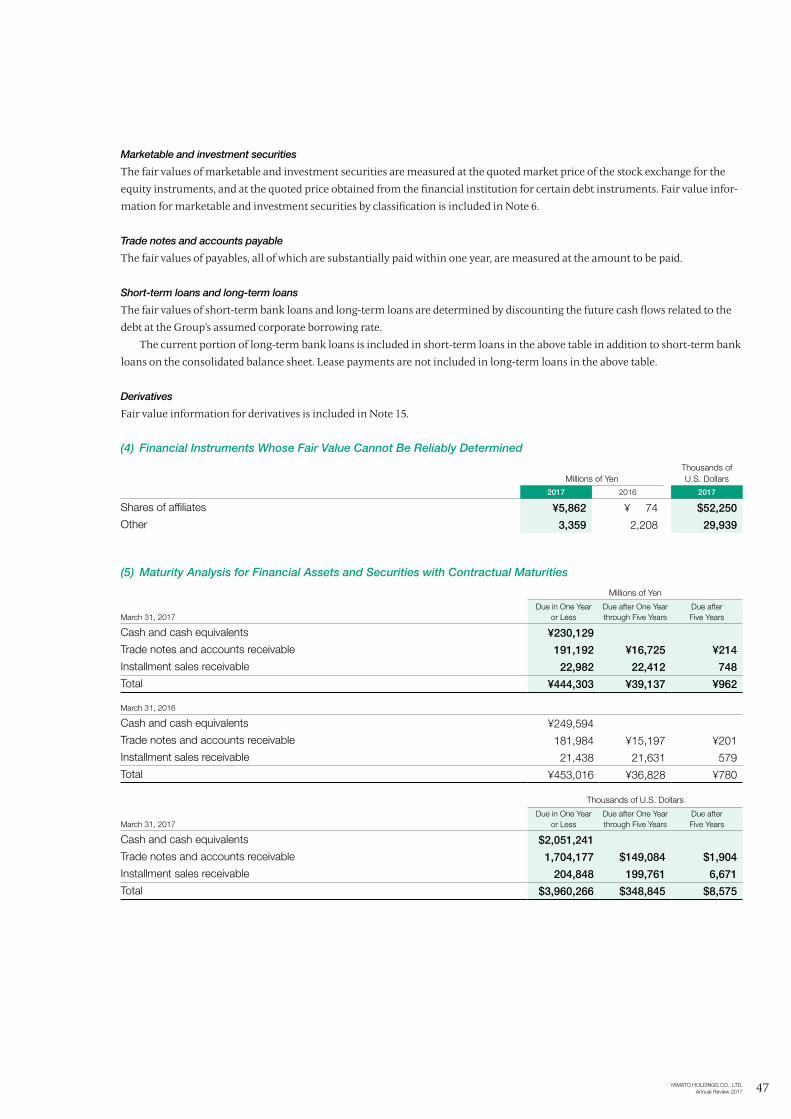
Marketable and investment securities
The fair values of marketable and investment securities are measured at the quoted market price of the stock exchange for the equity instruments, and at the quoted price obtained from the financial institution for certain debt instruments. Fair value infor-mation for marketable and investment securities by classification is included in Note 6.
Trade notes and accounts payable
The fair values of payables, all of which are substantially paid within one year, are measured at the amount to be paid.
Short-term loans and long-term loans
The fair values of short-term bank loans and long-term loans are determined by discounting the future cash flows related to the debt at the Group’s assumed corporate borrowing rate. The current portion of long-term bank loans is included in short-term loans in the above table in addition to short-term bank loans on the consolidated balance sheet. Lease payments are not included in long-term loans in the above table.
Derivatives
Fair value information for derivatives is included in Note 15.
(4) Financial Instruments Whose Fair Value Cannot Be Reliably Determined
Millions of YenThousands of U.S. Dollars
2017 2016 2017
Shares of affiliates ¥5,862 ¥ 74 $52,250
Other 3,359 2,208 29,939
(5) Maturity Analysis for Financial Assets and Securities with Contractual Maturities
Millions of Yen
March 31, 2017Due in One Year
or LessDue after One Year through Five Years
Due after Five Years
Cash and cash equivalents ¥230,129
Trade notes and accounts receivable 191,192 ¥16,725 ¥214
Installment sales receivable 22,982 22,412 748
Total ¥444,303 ¥39,137 ¥962
March 31, 2016
Cash and cash equivalents ¥249,594
Trade notes and accounts receivable 181,984 ¥15,197 ¥201
Installment sales receivable 21,438 21,631 579
Total ¥453,016 ¥36,828 ¥780
Thousands of U.S. Dollars
March 31, 2017Due in One Year
or LessDue after One Year through Five Years
Due after Five Years
Cash and cash equivalents $2,051,241
Trade notes and accounts receivable 1,704,177 $149,084 $1,904
Installment sales receivable 204,848 199,761 6,671
Total $3,960,266 $348,845 $8,575
47YAMATO HOLDINGS CO., LTD. Annual Review 2017
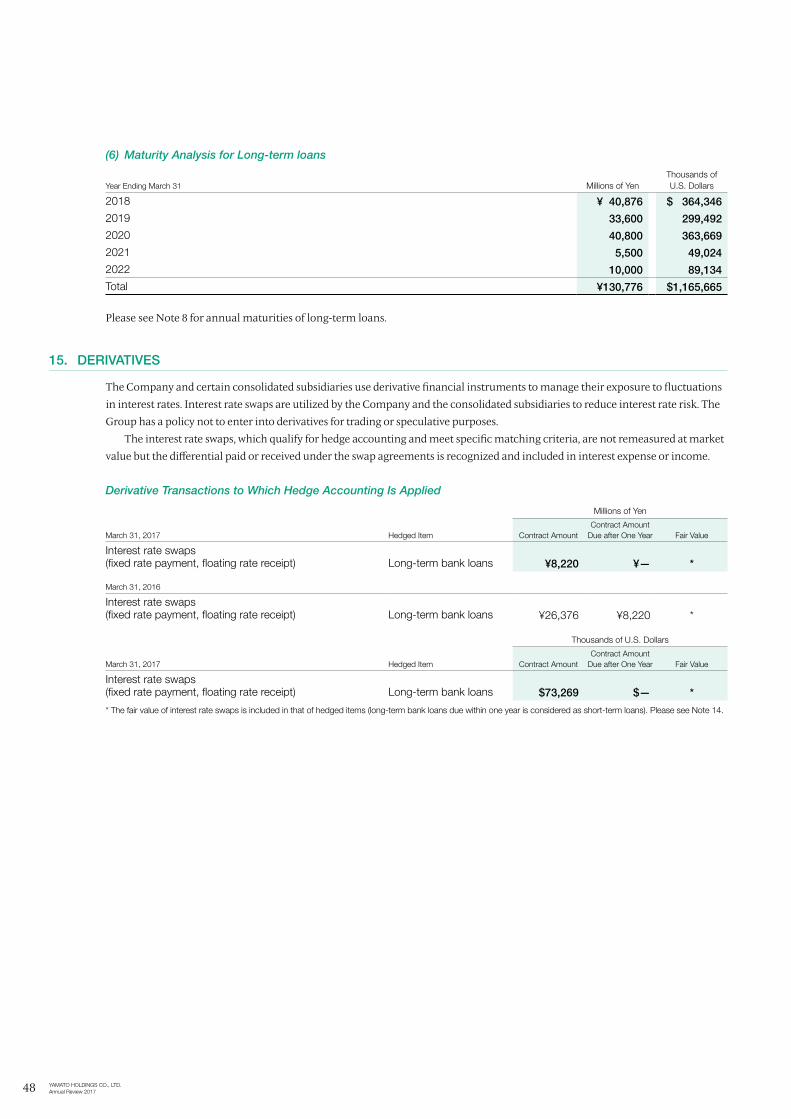
(6) Maturity Analysis for Long-term loans
Year Ending March 31 Millions of YenThousands of U.S. Dollars
2018 ¥ 40,876 $ 364,346
2019 33,600 299,492
2020 40,800 363,669
2021 5,500 49,024
2022 10,000 89,134
Total ¥130,776 $1,165,665
Please see Note 8 for annual maturities of long-term loans.
15. DERIVATIVES
The Company and certain consolidated subsidiaries use derivative financial instruments to manage their exposure to fluctuations in interest rates. Interest rate swaps are utilized by the Company and the consolidated subsidiaries to reduce interest rate risk. The Group has a policy not to enter into derivatives for trading or speculative purposes. The interest rate swaps, which qualify for hedge accounting and meet specific matching criteria, are not remeasured at market value but the differential paid or received under the swap agreements is recognized and included in interest expense or income.
Derivative Transactions to Which Hedge Accounting Is Applied
Millions of Yen
March 31, 2017 Hedged Item Contract AmountContract Amount
Due after One Year Fair Value
Interest rate swaps (fixed rate payment, floating rate receipt) Long-term bank loans ¥8,220 ¥— *
March 31, 2016
Interest rate swaps (fixed rate payment, floating rate receipt) Long-term bank loans ¥26,376 ¥8,220 *
Thousands of U.S. Dollars
March 31, 2017 Hedged Item Contract AmountContract Amount
Due after One Year Fair Value
Interest rate swaps (fixed rate payment, floating rate receipt) Long-term bank loans $73,269 $— *
* The fair value of interest rate swaps is included in that of hedged items (long-term bank loans due within one year is considered as short-term loans). Please see Note 14.
48 YAMATO HOLDINGS CO., LTD. Annual Review 2017
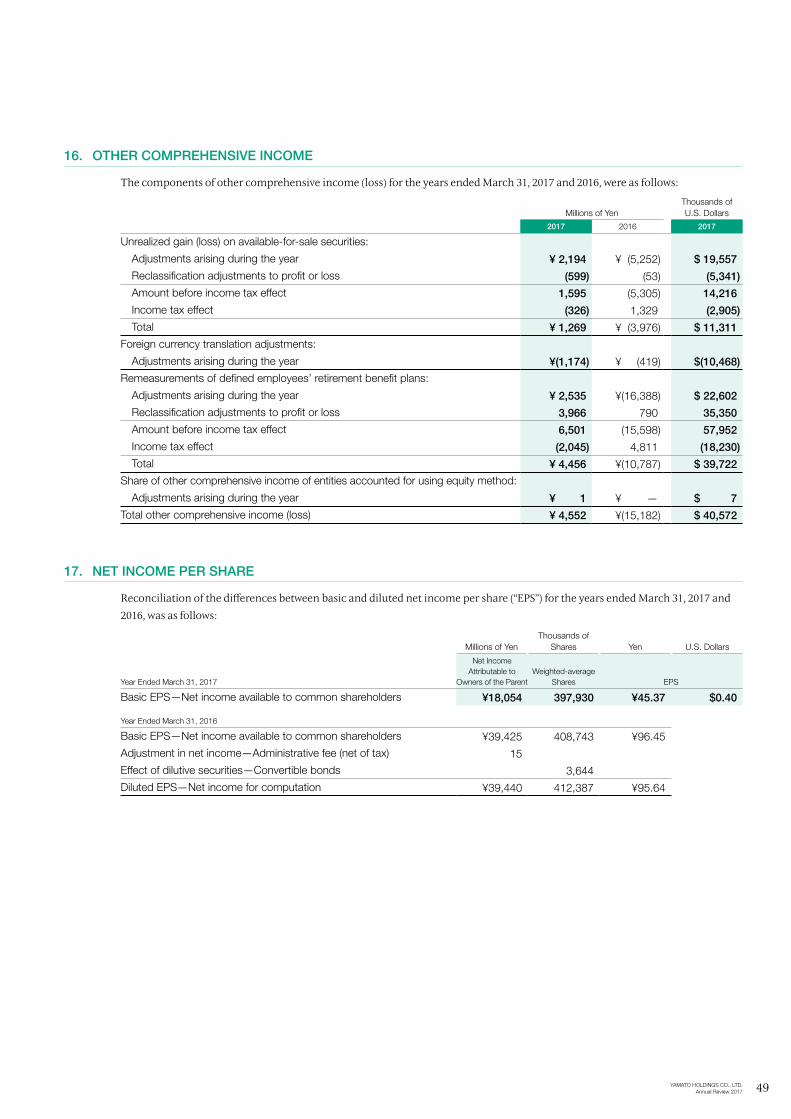
16. OTHER COMPREHENSIVE INCOME
The components of other comprehensive income (loss) for the years ended March 31, 2017 and 2016, were as follows:
Millions of YenThousands of U.S. Dollars
2017 2016 2017
Unrealized gain (loss) on available-for-sale securities:
Adjustments arising during the year ¥ 2,194 ¥ (5,252) $ 19,557
Reclassification adjustments to profit or loss (599) (53) (5,341)
Amount before income tax effect 1,595 (5,305) 14,216
Income tax effect (326) 1,329 (2,905)
Total ¥ 1,269 ¥ (3,976) $ 11,311
Foreign currency translation adjustments:
Adjustments arising during the year ¥(1,174) ¥ (419) $(10,468)
Remeasurements of defined employees’ retirement benefit plans:
Adjustments arising during the year ¥ 2,535 ¥(16,388) $ 22,602
Reclassification adjustments to profit or loss 3,966 790 35,350
Amount before income tax effect 6,501 (15,598) 57,952
Income tax effect (2,045) 4,811 (18,230)
Total ¥ 4,456 ¥(10,787) $ 39,722
Share of other comprehensive income of entities accounted for using equity method:
Adjustments arising during the year ¥ 1 ¥ — $ 7
Total other comprehensive income (loss) ¥ 4,552 ¥(15,182) $ 40,572
17. NET INCOME PER SHARE
Reconciliation of the differences between basic and diluted net income per share (“EPS”) for the years ended March 31, 2017 and 2016, was as follows:
Millions of YenThousands of
Shares Yen U.S. Dollars
Year Ended March 31, 2017
Net Income Attributable to
Owners of the ParentWeighted-average
Shares EPS
Basic EPS—Net income available to common shareholders ¥18,054 397,930 ¥45.37 $0.40
Year Ended March 31, 2016
Basic EPS—Net income available to common shareholders ¥39,425 408,743 ¥96.45
Adjustment in net income—Administrative fee (net of tax) 15
Effect of dilutive securities—Convertible bonds 3,644
Diluted EPS—Net income for computation ¥39,440 412,387 ¥95.64
49YAMATO HOLDINGS CO., LTD. Annual Review 2017
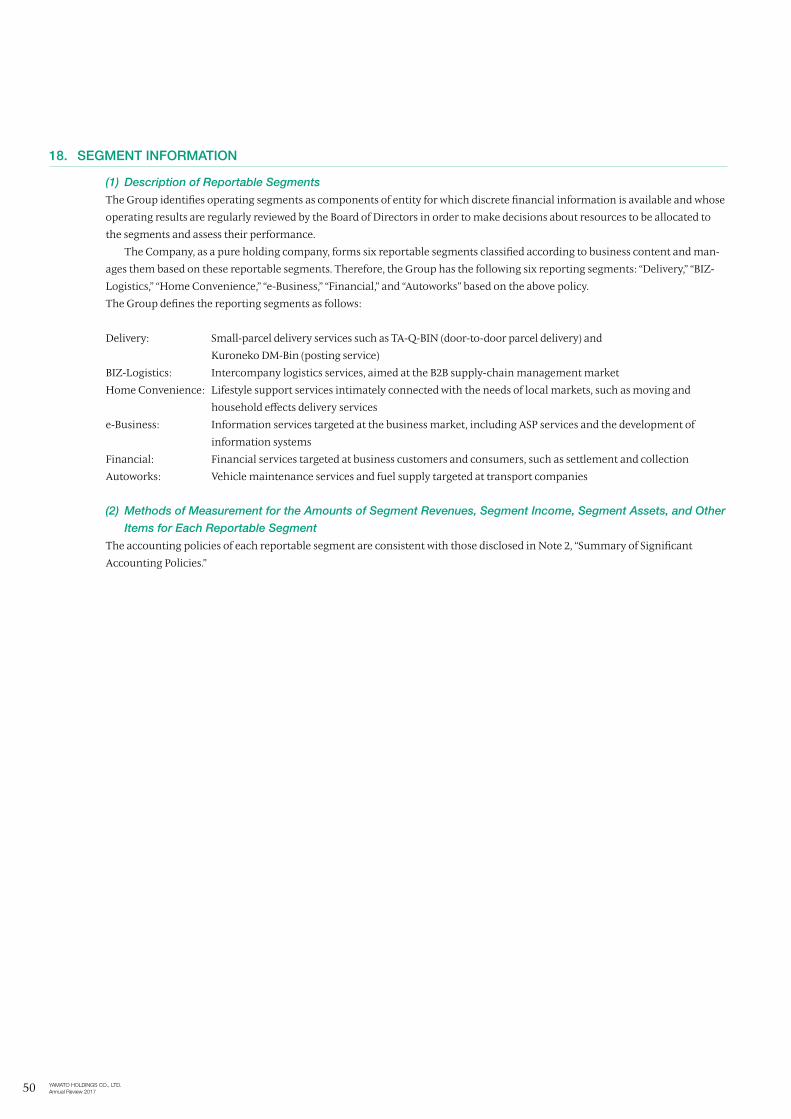
18. SEGMENT INFORMATION
(1) Description of Reportable Segments
The Group identifies operating segments as components of entity for which discrete financial information is available and whose operating results are regularly reviewed by the Board of Directors in order to make decisions about resources to be allocated to the segments and assess their performance.
The Company, as a pure holding company, forms six reportable segments classified according to business content and man-ages them based on these reportable segments. Therefore, the Group has the following six reporting segments: “Delivery,” “BIZ-Logistics,” “Home Convenience,” “e-Business,” “Financial,” and “Autoworks” based on the above policy.The Group defines the reporting segments as follows:
Delivery: Small-parcel delivery services such as TA-Q-BIN (door-to-door parcel delivery) and Kuroneko DM-Bin (posting service)
BIZ-Logistics: Intercompany logistics services, aimed at the B2B supply-chain management marketHome Convenience: Lifestyle support services intimately connected with the needs of local markets, such as moving and
household effects delivery servicese-Business: Information services targeted at the business market, including ASP services and the development of
information systemsFinancial: Financial services targeted at business customers and consumers, such as settlement and collectionAutoworks: Vehicle maintenance services and fuel supply targeted at transport companies
(2) Methods of Measurement for the Amounts of Segment Revenues, Segment Income, Segment Assets, and Other
Items for Each Reportable Segment
The accounting policies of each reportable segment are consistent with those disclosed in Note 2, “Summary of Significant Accounting Policies.”
50 YAMATO HOLDINGS CO., LTD. Annual Review 2017
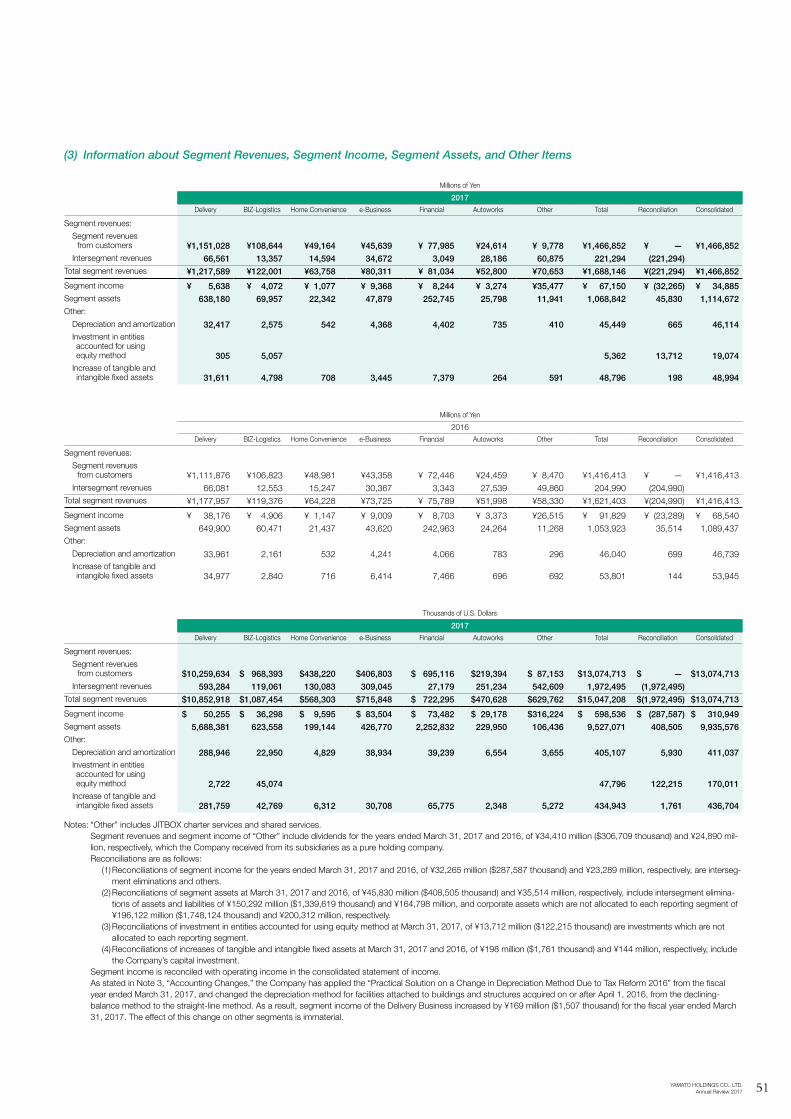
(3) Information about Segment Revenues, Segment Income, Segment Assets, and Other Items
Millions of Yen
2017
Delivery BIZ-Logistics Home Convenience e-Business Financial Autoworks Other Total Reconciliation Consolidated
Segment revenues:
S egment revenues from customers ¥1,151,028 ¥108,644 ¥49,164 ¥45,639 ¥ 77,985 ¥24,614 ¥ 9,778 ¥1,466,852 ¥ — ¥1,466,852
Intersegment revenues 66,561 13,357 14,594 34,672 3,049 28,186 60,875 221,294 (221,294)Total segment revenues ¥1,217,589 ¥122,001 ¥63,758 ¥80,311 ¥ 81,034 ¥52,800 ¥70,653 ¥1,688,146 ¥(221,294) ¥1,466,852
Segment income ¥ 5,638 ¥ 4,072 ¥ 1,077 ¥ 9,368 ¥ 8,244 ¥ 3,274 ¥35,477 ¥ 67,150 ¥ (32,265) ¥ 34,885Segment assets 638,180 69,957 22,342 47,879 252,745 25,798 11,941 1,068,842 45,830 1,114,672Other:
Depreciation and amortization 32,417 2,575 542 4,368 4,402 735 410 45,449 665 46,114 Investment in entities accounted for using
equity method 305 5,057 5,362 13,712 19,074 Increase of tangible and
intangible fixed assets 31,611 4,798 708 3,445 7,379 264 591 48,796 198 48,994
Millions of Yen
2016Delivery BIZ-Logistics Home Convenience e-Business Financial Autoworks Other Total Reconciliation Consolidated
Segment revenues:
S egment revenues from customers ¥1,111,876 ¥106,823 ¥48,981 ¥43,358 ¥ 72,446 ¥24,459 ¥ 8,470 ¥1,416,413 ¥ — ¥1,416,413
Intersegment revenues 66,081 12,553 15,247 30,367 3,343 27,539 49,860 204,990 (204,990)Total segment revenues ¥1,177,957 ¥119,376 ¥64,228 ¥73,725 ¥ 75,789 ¥51,998 ¥58,330 ¥1,621,403 ¥(204,990) ¥1,416,413
Segment income ¥ 38,176 ¥ 4,906 ¥ 1,147 ¥ 9,009 ¥ 8,703 ¥ 3,373 ¥26,515 ¥ 91,829 ¥ (23,289) ¥ 68,540Segment assets 649,900 60,471 21,437 43,620 242,963 24,264 11,268 1,053,923 35,514 1,089,437Other:
Depreciation and amortization 33,961 2,161 532 4,241 4,066 783 296 46,040 699 46,739 Increase of tangible and
intangible fixed assets 34,977 2,840 716 6,414 7,466 696 692 53,801 144 53,945
Thousands of U.S. Dollars
2017
Delivery BIZ-Logistics Home Convenience e-Business Financial Autoworks Other Total Reconciliation Consolidated
Segment revenues:
S egment revenues from customers $10,259,634 $ 968,393 $438,220 $406,803 $ 695,116 $219,394 $ 87,153 $13,074,713 $ — $13,074,713
Intersegment revenues 593,284 119,061 130,083 309,045 27,179 251,234 542,609 1,972,495 (1,972,495)Total segment revenues $10,852,918 $1,087,454 $568,303 $715,848 $ 722,295 $470,628 $629,762 $15,047,208 $(1,972,495) $13,074,713
Segment income $ 50,255 $ 36,298 $ 9,595 $ 83,504 $ 73,482 $ 29,178 $316,224 $ 598,536 $ (287,587) $ 310,949Segment assets 5,688,381 623,558 199,144 426,770 2,252,832 229,950 106,436 9,527,071 408,505 9,935,576Other:
Depreciation and amortization 288,946 22,950 4,829 38,934 39,239 6,554 3,655 405,107 5,930 411,037 Investment in entities accounted for using
equity method 2,722 45,074 47,796 122,215 170,011 Increase of tangible and intangible fixed assets 281,759 42,769 6,312 30,708 65,775 2,348 5,272 434,943 1,761 436,704
Notes: “Other” includes JITBOX charter services and shared services. Segment revenues and segment income of “Other” include dividends for the years ended March 31, 2017 and 2016, of ¥34,410 million ($306,709 thousand) and ¥24,890 mil-
lion, respectively, which the Company received from its subsidiaries as a pure holding company. Reconciliations are as follows: (1) Reconciliations of segment income for the years ended March 31, 2017 and 2016, of ¥32,265 million ($287,587 thousand) and ¥23,289 million, respectively, are interseg-
ment eliminations and others. (2) Reconciliations of segment assets at March 31, 2017 and 2016, of ¥45,830 million ($408,505 thousand) and ¥35,514 million, respectively, include intersegment elimina-
tions of assets and liabilities of ¥150,292 million ($1,339,619 thousand) and ¥164,798 million, and corporate assets which are not allocated to each reporting segment of ¥196,122 million ($1,748,124 thousand) and ¥200,312 million, respectively.
(3) Reconciliations of investment in entities accounted for using equity method at March 31, 2017, of ¥13,712 million ($122,215 thousand) are investments which are not allocated to each reporting segment.
(4) Reconciliations of increases of tangible and intangible fixed assets at March 31, 2017 and 2016, of ¥198 million ($1,761 thousand) and ¥144 million, respectively, include the Company’s capital investment.
Segment income is reconciled with operating income in the consolidated statement of income. As stated in Note 3, “Accounting Changes,” the Company has applied the “Practical Solution on a Change in Depreciation Method Due to Tax Reform 2016” from the fiscal
year ended March 31, 2017, and changed the depreciation method for facilities attached to buildings and structures acquired on or after April 1, 2016, from the declining-balance method to the straight-line method. As a result, segment income of the Delivery Business increased by ¥169 million ($1,507 thousand) for the fiscal year ended March 31, 2017. The effect of this change on other segments is immaterial.
51YAMATO HOLDINGS CO., LTD. Annual Review 2017
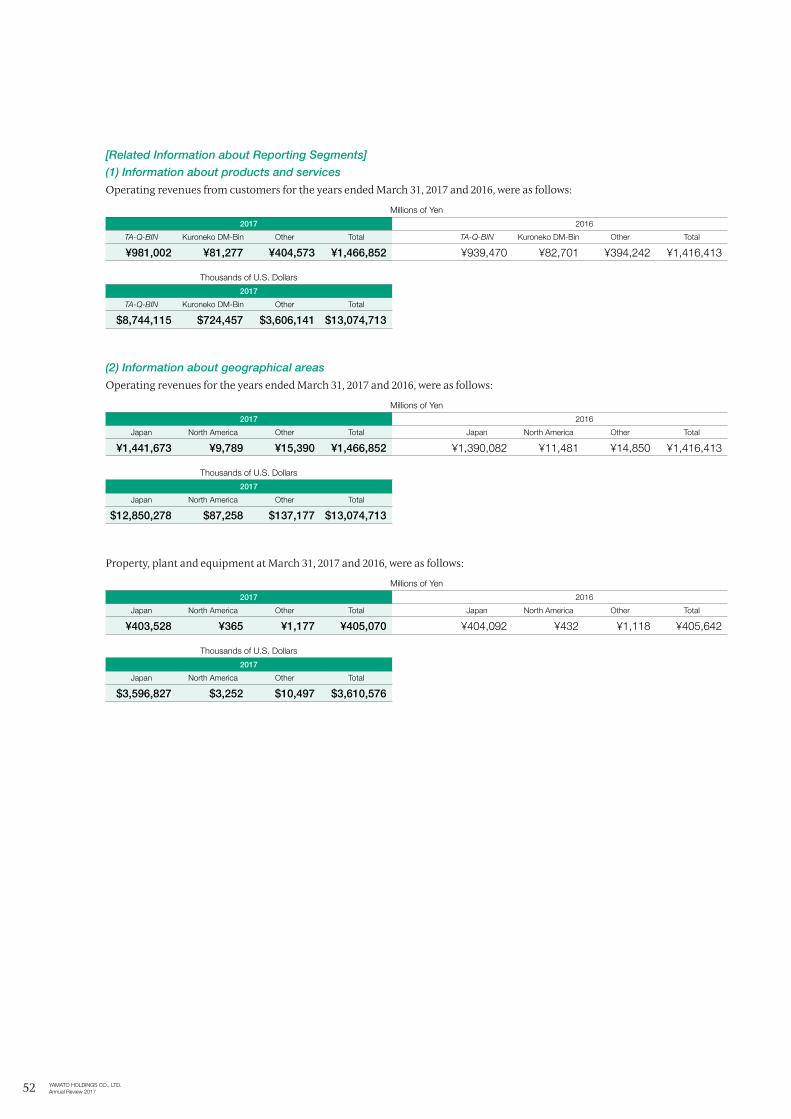
[Related Information about Reporting Segments]
(1) Information about products and services
Operating revenues from customers for the years ended March 31, 2017 and 2016, were as follows:
Millions of Yen
2017 2016
TA-Q-BIN Kuroneko DM-Bin Other Total TA-Q-BIN Kuroneko DM-Bin Other Total
¥981,002 ¥81,277 ¥404,573 ¥1,466,852 ¥939,470 ¥82,701 ¥394,242 ¥1,416,413
Thousands of U.S. Dollars
2017
TA-Q-BIN Kuroneko DM-Bin Other Total
$8,744,115 $724,457 $3,606,141 $13,074,713
(2) Information about geographical areas
Operating revenues for the years ended March 31, 2017 and 2016, were as follows:
Millions of Yen
2017 2016
Japan North America Other Total Japan North America Other Total
¥1,441,673 ¥9,789 ¥15,390 ¥1,466,852 ¥1,390,082 ¥11,481 ¥14,850 ¥1,416,413
Thousands of U.S. Dollars
2017
Japan North America Other Total
$12,850,278 $87,258 $137,177 $13,074,713
Property, plant and equipment at March 31, 2017 and 2016, were as follows:
Millions of Yen
2017 2016
Japan North America Other Total Japan North America Other Total
¥403,528 ¥365 ¥1,177 ¥405,070 ¥404,092 ¥432 ¥1,118 ¥405,642
Thousands of U.S. Dollars
2017
Japan North America Other Total
$3,596,827 $3,252 $10,497 $3,610,576
52 YAMATO HOLDINGS CO., LTD. Annual Review 2017
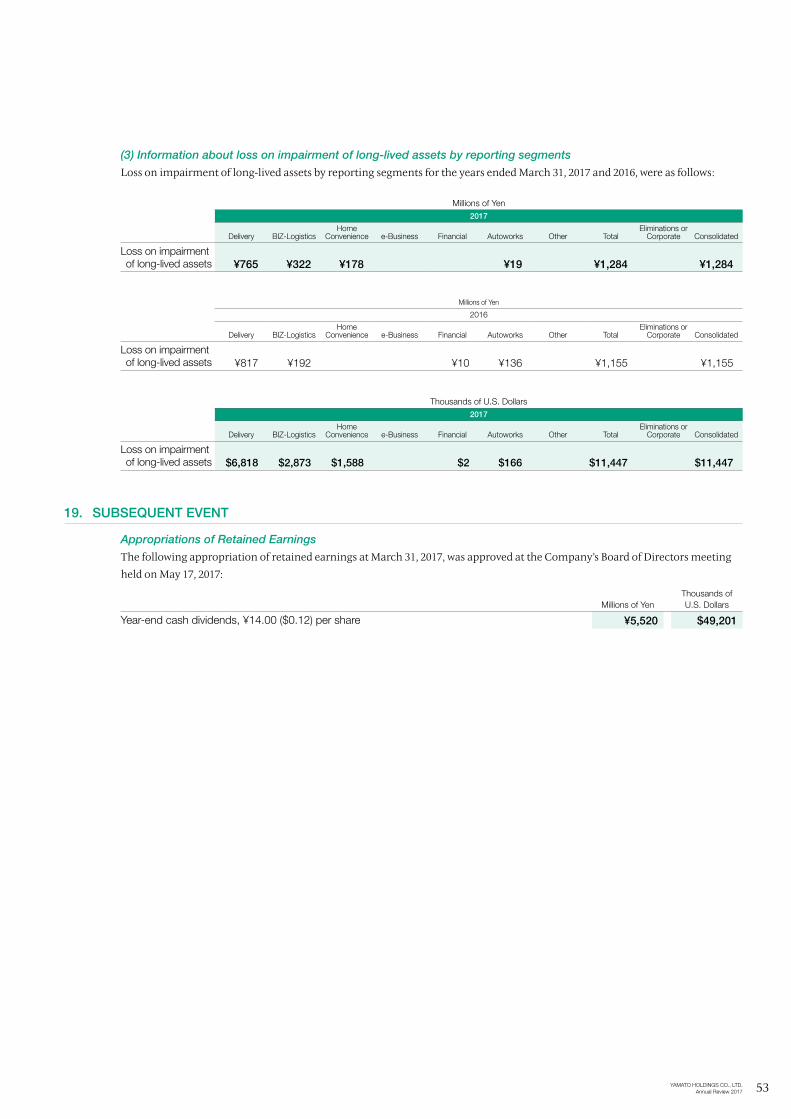
(3) Information about loss on impairment of long-lived assets by reporting segments
Loss on impairment of long-lived assets by reporting segments for the years ended March 31, 2017 and 2016, were as follows:
Millions of Yen2017
Delivery BIZ-LogisticsHome
Convenience e-Business Financial Autoworks Other TotalEliminations or
Corporate Consolidated
Loss on impairment of long-lived assets ¥765 ¥322 ¥178 ¥19 ¥1,284 ¥1,284
Millions of Yen
2016
Delivery BIZ-LogisticsHome
Convenience e-Business Financial Autoworks Other TotalEliminations or
Corporate Consolidated
Loss on impairment of long-lived assets ¥817 ¥192 ¥10 ¥136 ¥1,155 ¥1,155
Thousands of U.S. Dollars2017
Delivery BIZ-LogisticsHome
Convenience e-Business Financial Autoworks Other TotalEliminations or
Corporate Consolidated
Loss on impairment of long-lived assets $6,818 $2,873 $1,588 $2 $166 $11,447 $11,447
19. SUBSEQUENT EVENT
Appropriations of Retained Earnings
The following appropriation of retained earnings at March 31, 2017, was approved at the Company’s Board of Directors meeting held on May 17, 2017:
Millions of YenThousands of U.S. Dollars
Year-end cash dividends, ¥14.00 ($0.12) per share ¥5,520 $49,201
53YAMATO HOLDINGS CO., LTD. Annual Review 2017
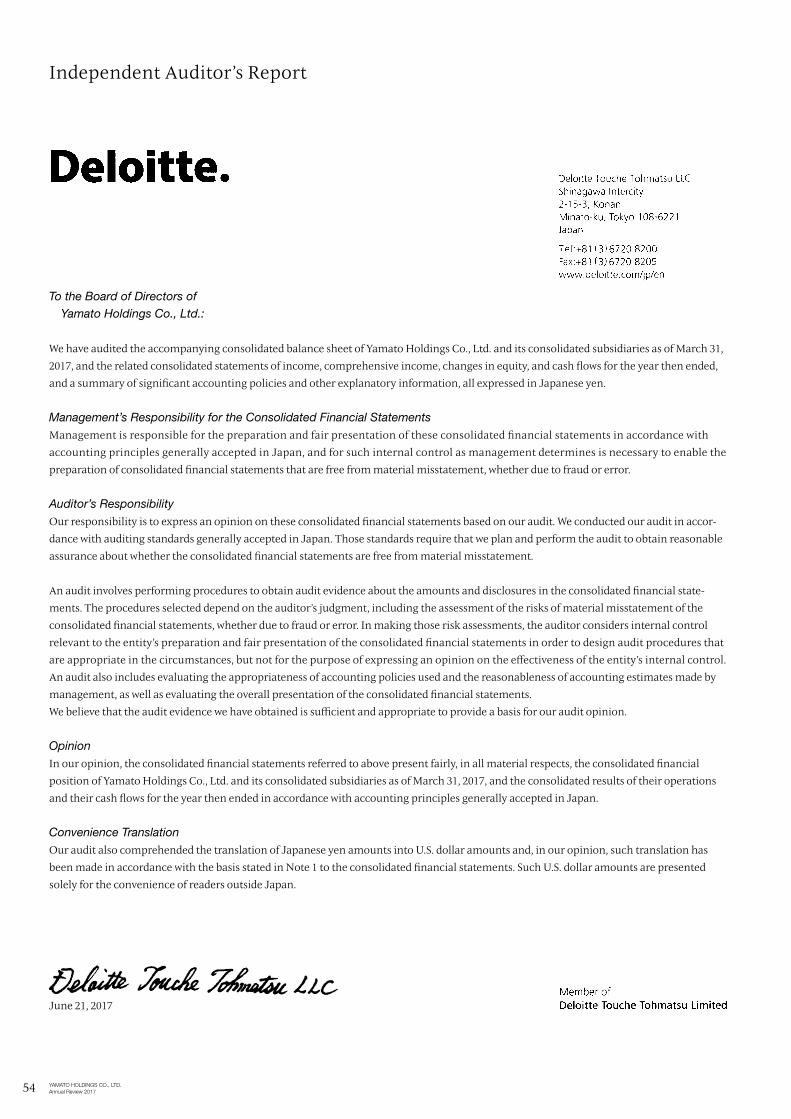
Independent Auditor’s Report
To the Board of Directors of Yamato Holdings Co., Ltd.:
We have audited the accompanying consolidated balance sheet of Yamato Holdings Co., Ltd. and its consolidated subsidiaries as of March 31, 2017, and the related consolidated statements of income, comprehensive income, changes in equity, and cash flows for the year then ended, and a summary of significant accounting policies and other explanatory information, all expressed in Japanese yen.
Management’s Responsibility for the Consolidated Financial StatementsManagement is responsible for the preparation and fair presentation of these consolidated financial statements in accordance with accounting principles generally accepted in Japan, and for such internal control as management determines is necessary to enable the preparation of consolidated financial statements that are free from material misstatement, whether due to fraud or error.
Auditor’s ResponsibilityOur responsibility is to express an opinion on these consolidated financial statements based on our audit. We conducted our audit in accor-dance with auditing standards generally accepted in Japan. Those standards require that we plan and perform the audit to obtain reasonable assurance about whether the consolidated financial statements are free from material misstatement.
An audit involves performing procedures to obtain audit evidence about the amounts and disclosures in the consolidated financial state-ments. The procedures selected depend on the auditor’s judgment, including the assessment of the risks of material misstatement of the consolidated financial statements, whether due to fraud or error. In making those risk assessments, the auditor considers internal control relevant to the entity’s preparation and fair presentation of the consolidated financial statements in order to design audit procedures that are appropriate in the circumstances, but not for the purpose of expressing an opinion on the effectiveness of the entity’s internal control. An audit also includes evaluating the appropriateness of accounting policies used and the reasonableness of accounting estimates made by management, as well as evaluating the overall presentation of the consolidated financial statements.We believe that the audit evidence we have obtained is sufficient and appropriate to provide a basis for our audit opinion.
OpinionIn our opinion, the consolidated financial statements referred to above present fairly, in all material respects, the consolidated financial position of Yamato Holdings Co., Ltd. and its consolidated subsidiaries as of March 31, 2017, and the consolidated results of their operations and their cash flows for the year then ended in accordance with accounting principles generally accepted in Japan.
Convenience TranslationOur audit also comprehended the translation of Japanese yen amounts into U.S. dollar amounts and, in our opinion, such translation has been made in accordance with the basis stated in Note 1 to the consolidated financial statements. Such U.S. dollar amounts are presented solely for the convenience of readers outside Japan.
June 21, 2017
54 YAMATO HOLDINGS CO., LTD. Annual Review 2017

Corporate Data / Stock InformationAs of March 31, 2017
322017
112111098765432112111098762015 2016
54321121110982014
76540
600
1,200
1,800
2,400
3,000
0
8,000
16,000
24,000
Company NameYamato Holdings Co., Ltd.
Head Office16-10, Ginza 2-chome, Chuo-ku, Tokyo104-8125 JapanTelephone: 81-3-3541-4141Facsimile: 81-3-5565-3427
EstablishedNovember 29, 1919
RegisteredApril 9, 1929
Paid-in Capital127,234,791,077 yen
Websitehttp://yamato-hd.co.jp/english/
Fiscal YearFrom April 1 to March 31
Common StockAuthorized: 1,787,541,000 sharesIssued: 411,339,992 shares
Stock Exchange ListingTokyo Stock Exchange
Transfer Agent and RegistrarMizuho Trust & Banking Co., Ltd.
General Meeting of ShareholdersHeld in June
AuditorDeloitte Touche Tohmatsu LLC
Principal ShareholdersPercentage of
total shares outstanding
The Master Trust Bank of Japan, Ltd. (Trust Account) 8.79%State Street Bank and Trust Company 505223 6.30%Japan Trustee Services Bank, Ltd. (Trust Account) 5.47%Yamato Employees’ Shareholding Association 4.55%Nippon Life Insurance Company 3.59%Meiji Yasuda Life Insurance Company 3.48%Mizuho Bank, Ltd. 3.22%Yamato Trading-Partner Shareholding Association 2.13%Japan Trustee Services Bank, Ltd. (Trust Account 5) 1.60%State Street Bank West Client Treaty 505234 1.54%Total 40.67%
0
10,000
20,000
30,000
40,000
50,000
60,000
70,000
322017
112111098765432112111098762015 2016
54321121110982014
7654
Stock Price Range / Trading Volume (Tokyo Stock Exchange)(Yen) (Yen)
(Thousand of Shares)
Trading Volume (left scale) Stock Price Range (left scale) Nikkei Stock Average (right scale)
55YAMATO HOLDINGS CO., LTD. Annual Review 2017

16-10, Ginza 2-chome, Chuo-ku, Tokyo104-8125 JapanTelephone: 81-3-3541-4141Facsimile: 81-3-5565-3427