Embed Size (px)
Citation preview
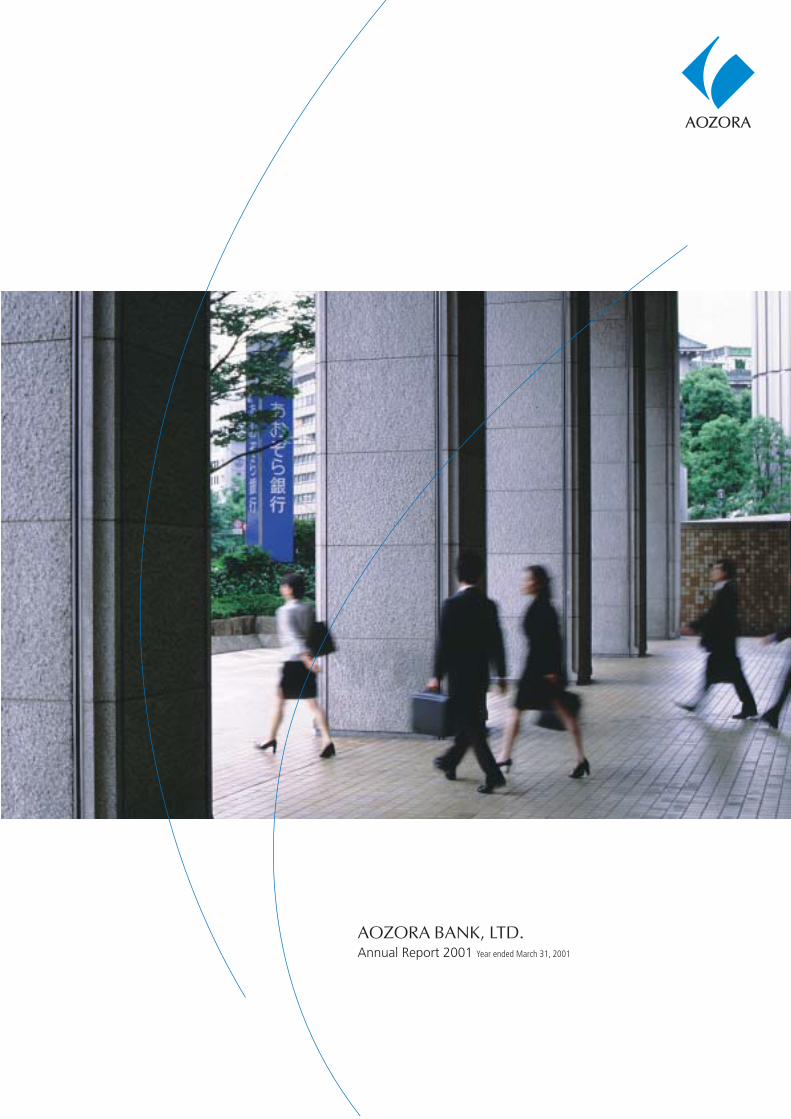
AOZORA BANK, LTD.Annual Report 2001 Year ended March 31, 2001
AO
ZO
RA
BA
NK
, LTD. A
nnual Report 2001
あおぞらBK AR E Cover 01.8.22, 4:01 PMPage 3 Adobe PageMaker 6.5J/PPC
P R O F I L E
(As of March 31, 2001 except number of branches at June 30, 2001)
Established ................................................................................... April 1957Capital ......................................................................................... ¥419.8 billionTotal assets ................................................................................... ¥6,174.9 billionConsolidated capital adequacy ratio (Domestic standard) .............. 15.13%Non-consolidated capital adequacy ratio (Domestic standard) ....... 15.10%Number of employees .................................................................. 1,438Branch network ............................................................................ Japan: 16 branches
Overseas: 1 branch, 5 representative officesHead office ................................................................................... 13-10, Kudan-kita 1 chome
Chiyoda-ku, Tokyo102-8660, Japan
C O N T E N T SC O N T E N T SC O N T E N T SC O N T E N T SC O N T E N T S
Annual Report 2001
President’s message ....................................................... 2
Business strategy ........................................................... 6
Banking operations ....................................................... 9
Corporate organization and management system ........ 18
Financial information and corporate data .................... 31
Published: August 2001Corporate Planning Division Aozora Bank, Ltd.
T
Y
T
J
T
あおぞらBK AR E Cover 01.8.22, 4:01 PMPage 4 Adobe PageMaker 6.5J/PPC
1
Aozora, the Japanese word for clear sky,embodies our aspirations to attain the highest standards of compliance,
transparency and fairness.As such, we decided to adopt Aozora Bank as our new name.
The bank’s logo represents a powerful stream rising into the sky,flowing into the future.
The blue diamond of our logo symbolizes intelligenceand trustworthiness and the central
white stream represents the driving force of hope for a better future.
Our logo symbolizes our firm commitment to enriching societyby addressing new challenges and possibilities in the finance industry.
We will do so by applying novel ideasand creativity that traditional banks cannot match.
The best is yet to come for Aozora Bank of the 21st century.
The Nippon Credit Bank, Ltd. was renamed Aozora Bank, Ltd. on January 4, 2001.
2
Aozora Bank started anew as a privately owned bank in September 2000. The bank’s
shareholders consist of 105 domestic and overseas companies, including SOFTBANK CORP.,
ORIX Corporation, The Tokio Marine and Fire Insurance Co., Ltd. and 93 regional financial
institutions. The bank drafted and submitted a Business Improvement Plan to the Financial
Reconstruction Commission (FRC). Following the approval of the plan by the FRC, the bank
issued preferred stocks totaling ¥260 billion in October 2000, which were subscribed by public
funds. I would like to express my sincere gratitude for the understanding and support for the
bank shown by every one involved during this period.
Aozora Bank: A New Transformation
The name Aozora Bank—aozora meaning clear sky in Japanese—embodies our commitment
to ensuring that all aspects of our bank, including management, are transparent to all.
Having made a fresh start at the dawn of the 21st century, we intend to play a distinctive role
in the social and economic environment of the new era by offering a wide range of functions
and services.
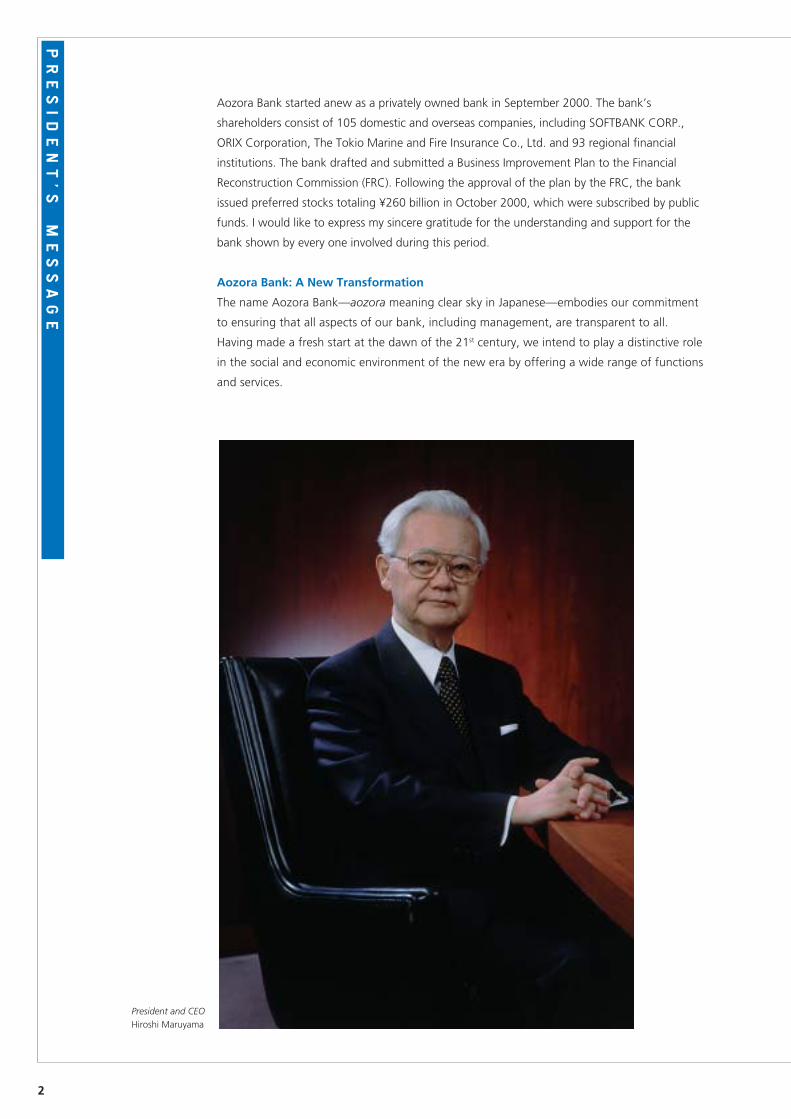
President and CEOHiroshi Maruyama
PRESIDENT’ S
M
ESSAGE
3
At present, in such a severe economic environment, competition is intensifying among
financial institutions the world over. With their very survival at stake, financial institutions are
clarifying core competences and other traits, such as proprietary know-how and other
competitive advantages, and are thus expected to become even more specialized. Moreover,
the rapid pace of change today underscores the importance of swift decision-making and
taking prompt action. We must squarely face the reality that without proactive self-
transformation, we may not stay competitive.
Even as society and the economy undergo remarkable changes, I believe that there are
still plenty of roles for the bank to fulfill and many opportunities for growth. Why? From now
on the quality of financial services will take precedence over business scale. And for this cause,
we must be prepared to undertake substantial reforms. Distinctive competitive advantages
and resources must be aggressively channeled into business areas with high growth potential.
As such, foresight and courage are of paramount importance. While thoroughly
implementing risk management, I am committed to realigning our operations to maximize
profitability and to building a competitive business structure.
To this end, Aozora Bank will provide financial services that leverage its distinctive expertise
and maximize synergies with its shareholders. Our primary customers will be small and medium-
sized enterprises engaged in the creation of new industries and those realigning their
businesses so as to focus on high growth areas. For instance, we will introduce new methods of
risk assessment, incorporating analysis of cash flows and business models, as well as novel
financing methods for which our overseas business partners have successful precedents. In this
way, we will work to propose creative solutions to a variety of issues faced by our customers.
Another key focus is retail banking. We will continue to extend systems, products and
services in this area. So far, we launched the sale of investment trusts in 1998, formed an online
partnership with the postal savings system in 2000 and rolled out telephone banking services
the same year. In April 2001, we launched “Aozora Super”—discounted debentures covered by
Japan’s deposit insurance system.
“Without being tied to the past, how will we achieve a change in our mindset and
behavior in the conduct of new businesses?” This question is the essence of the bank’s reforms.
My responsibility is to set forth a clear approach to this issue. Furthermore, I want to clarify two
concepts that are important, in my view, in dealing effectively with clients: “In pursuit of
specialization” and “In close touch with customer needs.”
In Pursuit of Specialization
In regard to specialization, we must find answers to two questions. First, how can we most
effectively and efficiently apply our core competencies and competitive advantages to the
execution of operations? Second, to what extent can we enhance the abilities of our officers,
and thus raise our ability to provide solutions that meet customer needs?
The ability to provide quality solutions requires that each officer realize his or her full
potential and achieve a higher degree of specialization. In particular, we must hone our
techniques and expertise in fields that are attracting the interest of our customers, such as real
estate financing, syndicated loans, structured finance, loan servicer operations and venture
business support. To this end, the bank is introducing compensation systems grounded in basic
policies that emphasize skills and ability as well as hiring people with specialized skills from
outside the bank.
4
To achieve a transformation from within, it is essential to flexibly incorporate a wide range
of new ideas and methodologies from outside the bank and enhance specialization in line with
current market demands. Aozora Bank has built up long-standing relationships with financial
institutions nationwide through the placement of debentures. At the same time, most of the
financial institutions we serve are also our shareholders. Another characteristic of Aozora Bank
is its network of shareholders from outside the financial services sector.
As we move to enhance specialization, strengthening relationships with shareholders and
creating synergies together is also paramount. A prime example of this is our support for Blue
Planet Corporation, which provides a portal for financial matters using information technology.
This project aims to provide a forum for an exchange of views among users, including regional
financial institutions and their customers, and also to serve as a channel to provide financial
services in cooperation with regional financial institutions. We will continue to concentrate a
substantial amount of resources on regional financial institutions, and providing financial
services that promote the development of local economies in cooperation with regional
financial institutions.
In Close Touch with Customer Needs
In order to support our clients with effective solutions, we must foster awareness and improve
the ability of all employees in two respects. One is the importance of a precise understanding of
customer needs, from their viewpoints. The other is meeting those needs directly by remaining
in close touch with our customers.
To accomplish this goal, we must become an organization capable of listening, thinking
and taking action at the frontlines of our business, where we interact with customers and are
closest to their needs. I am working to foster a strong awareness of this principle in all
employees. In more specific terms, human resources from peripheral and highly specialized
operations will be transferred to customer business divisions. We will seek to build a problem-
solving, proposal-oriented organizations comprising employees from frontline business, head
office operations, and specialized divisions. Moreover, we are set to upgrade our information
systems in order to optimize the efficiency of in-house collaboration.
Launched in April 2001, Aozora Club embodies these new principles guiding our activities.
The goal of this club is to provide a forum for an exchange of information that can help
companies grow. Targeted companies include not only existing customers, but also prospective
customers, particularly small and medium-sized customers and new enterprises. Aozora Club
project represents the very foundation for our own growth: a commitment to building lasting
relationships with customers that support mutual growth and prosperity.
Strong Management, a Sound Asset Portfolio, and Further Rationalization
Aozora Bank has instituted a new corporate governance system in which supervision and actual
execution of business are clearly separated, to establish a sound management base and faster
decision-making. External directors, including scholars and professionals independent from
shareholders, compose more than half of the Board of Directors, which is responsible for
supervising the execution of business strategies. The Internal Audit Committee, comprising
independent directors and auditors, was established to provide a check on management
practices that is completely autonomous of all shareholders. We have taken all possible
measures to ensure that we do not become a captive bank for any single company—the
Internal Audit Committee conducts strict audits of the bank’s transactions with parent
companies, the Credit Committee, which I chair, sets rigorous credit limits, and transparent
disclosure is maintained at all times.
5
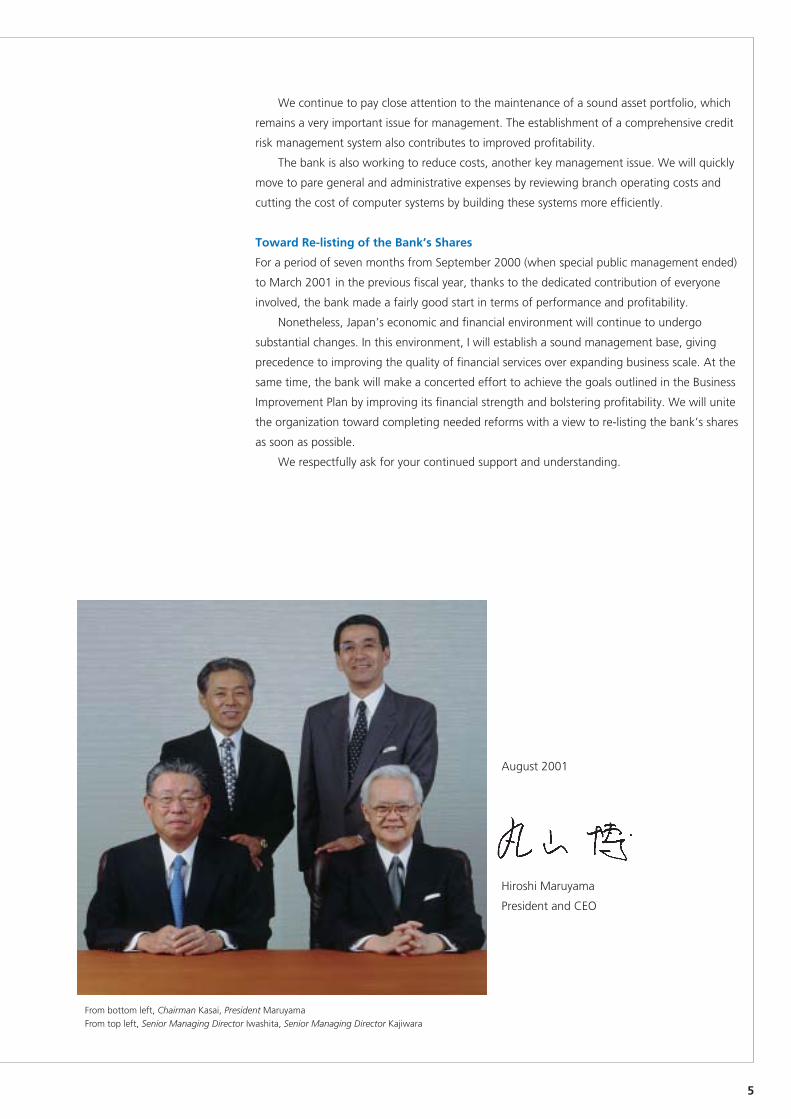
From bottom left, Chairman Kasai, President MaruyamaFrom top left, Senior Managing Director Iwashita, Senior Managing Director Kajiwara
We continue to pay close attention to the maintenance of a sound asset portfolio, which
remains a very important issue for management. The establishment of a comprehensive credit
risk management system also contributes to improved profitability.
The bank is also working to reduce costs, another key management issue. We will quickly
move to pare general and administrative expenses by reviewing branch operating costs and
cutting the cost of computer systems by building these systems more efficiently.
Toward Re-listing of the Bank’s Shares
For a period of seven months from September 2000 (when special public management ended)
to March 2001 in the previous fiscal year, thanks to the dedicated contribution of everyone
involved, the bank made a fairly good start in terms of performance and profitability.
Nonetheless, Japan’s economic and financial environment will continue to undergo
substantial changes. In this environment, I will establish a sound management base, giving
precedence to improving the quality of financial services over expanding business scale. At the
same time, the bank will make a concerted effort to achieve the goals outlined in the Business
Improvement Plan by improving its financial strength and bolstering profitability. We will unite
the organization toward completing needed reforms with a view to re-listing the bank’s shares
as soon as possible.
We respectfully ask for your continued support and understanding.
August 2001
Hiroshi Maruyama
President and CEO
6
In the years ahead, the quality of financial services will take precedence over scale, as banks
compete for customers. As such, there are still plenty of roles for the bank to fulfill and many
opportunities for growth. Aozora Bank aims to deliver quality financial services through the
single-minded pursuit of excellence in all banking operations and by narrowing down busi-
nesses to areas where client needs are greatest.
Quality Financial Services:
Corporate Clients
Aozora Bank aims to satisfy the needs of corporate clients seeking for business strategies that
enable them to enhance competency in the market. The bank offers financial services as well as
solutions on issues for both non-financial corporations and financial institutions.
The bank not only provides corporate finance services to meet financing needs of corporate
clients but is ready to hold a business relationships with new clients in sound financial conditions.
The Bank offers a wide range of financial instruments and services, including solutions on
investment and management strategy to clients from small-to-medium-sized enterprises, the
engine of Japan’s economy, high-growth enterprises like start-ups and high-tech venture
companies, to large corporations at the vanguard of Japan’s economy.
The Bank is also prepared with a broad array of financial products and services for financial
institutions, including tools for asset management, servicing, advisory on how to provide
solutions for the their own customers, as well as Internet-related services.
Individual Clients
The Bank maximizes customers satisfaction through enhancement of quality of asset manage-
ment service lineups to match customers’ needs at various stages in life. Professional advisors
are placed in every local branches to advise clients in person. The Bank has introduced new
access channels including ATM alliances and telephone banking as a step for service quality
improvement. One of the Bank’s current initiative is development of a new types of lending.
The Competitive Edge
One of the Aozora Bank’s most distinguished business strength in providing customers its
sophisticated financial services lies in the extensive network it has built over the years. The bank
has formed a wide variety of business relationships in the course of its history—indeed, it is one
of the core competitive edge.
Firstly, Aozora Bank has built strong relationships with regional financial institutions
through debenture issuance and offering of various financial services as a long-term credit
bank. The strong relationship is an invaluable asset that plays an crucial role in achieving our
strategic goals.
Now, the new shareholders of the Bank, have now joined as new members of the Bank’s
network and have become our business partners. We will collaborate with our shareholders in
different business fields in developing our competency as a solutions provider, and create new
business models.
The accomplishment of strategic goals in retail banking hinges on targeted customers—
most of Aozora Bank’s individual clients are comparatively wealthy individuals.
BUSINESS STRATEGY
7
The financial environment surrounding individual clients is undergoing substantial changes,
as exemplified by persistently low interest rates, commencement of the over-the-counter sale of
investment trusts and insurance at banks, the introduction of Japan’s own 401k plan, and the
government’s plan to limit deposit guarantees to ¥10 million per individual. In response, Aozora
Bank offers not only bonds and deposits, but also provides new financial services and operations
that foster long-term client relationships.
Strategies in Key Banking Operations
Aozora Bank will focus on highly specialized business areas, where client needs are
high, such as investment banking and market operations and further strive to improve
service quality.
At Aozora Bank, divisions for customer relationships and divisions on specialized operations work
in close collaborations in offering exceptional business solutions to clients tackling on issues
such as corporate restructuring, concentration of management resources and asset improvement.
The Bank offers a broad range of service lineups, in the areas of financial management, M&A,
spin-off, overseas business operations, taking good advantages of alliances with our major
shareholders. The Bank has a strong competence in problem loan disposals and real estate
financing where it holds notable achievements, and M&As and loan syndications in which our
network with regional financial institutions plays a pivotal role. Aozora Bank also assists
customers on risk management by providing customized products for risk-hedging.
Aozora Bank will expand investment and lending to venture businesses, a promising
growth area, under strict assessment on technological propriety and marketability of
emerging companies’ business plans.
Lending and investments are not only targeted to venture companies but also to early-stage
companies newly established through spin-offs, downsizing and outsourcing of large corpora-
tions. Aozora Bank works to bring our client’s visions to life, by providing exceptional business
solutions to the truly important issues clients must resolve, which will be identified by the
Bank’s feasibility studies on clients’ business plans and technological competency in fields of
growth potential.
Internet businesses provide new opportunities to develop innovative financial services
and greatly enhance our network of business relationships.
Internet is offered as an unprecedented types of new financial services. Aozora Club (p.8)
provides a virtual forum to exchange views and information among member corporations. It is
by no means a vehicle for one-way communication from the bank to clients. We begin by
asking the corporate members of this service about their financing needs. This stimulates
dialogue, which we value above all else. We aim to create innovative virtual forums and
systems that enable dialogue even among customers.
Retail banking services will be expanded by creating new marketing channels and
introducing innovative financial instruments.
8
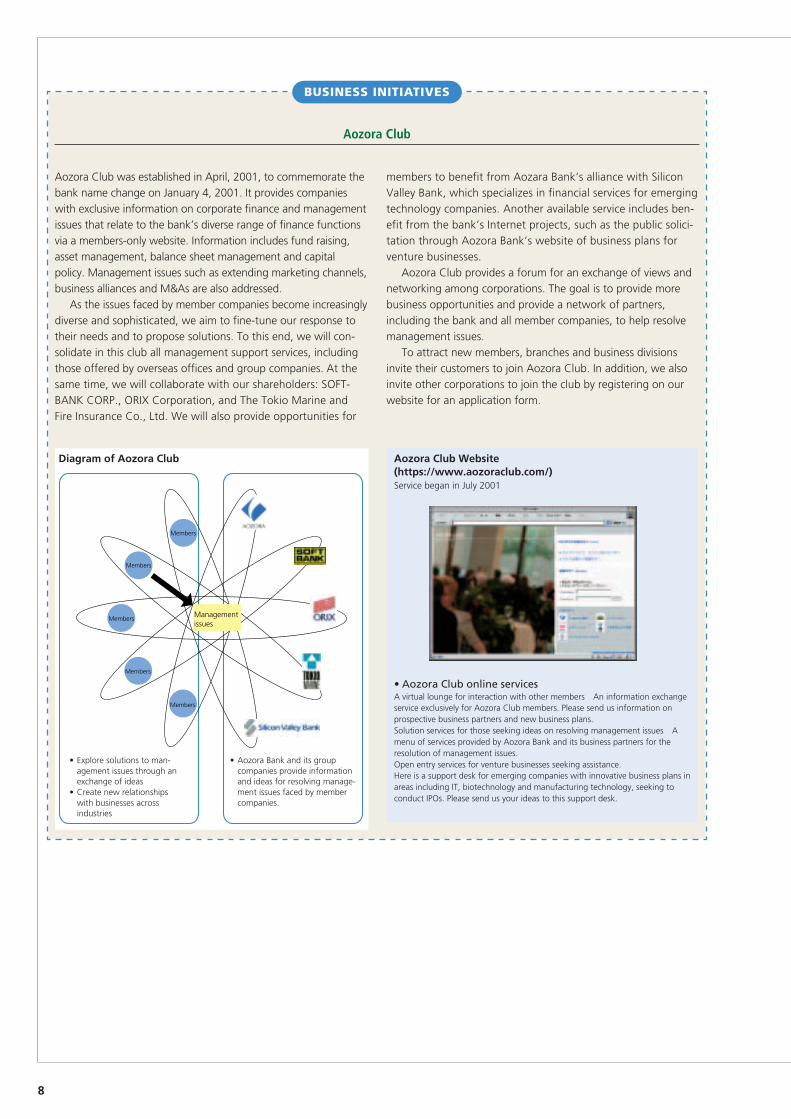
Aozora Club was established in April, 2001, to commemorate thebank name change on January 4, 2001. It provides companieswith exclusive information on corporate finance and managementissues that relate to the bank’s diverse range of finance functionsvia a members-only website. Information includes fund raising,asset management, balance sheet management and capitalpolicy. Management issues such as extending marketing channels,business alliances and M&As are also addressed.
As the issues faced by member companies become increasinglydiverse and sophisticated, we aim to fine-tune our response totheir needs and to propose solutions. To this end, we will con-solidate in this club all management support services, includingthose offered by overseas offices and group companies. At thesame time, we will collaborate with our shareholders: SOFT-BANK CORP., ORIX Corporation, and The Tokio Marine andFire Insurance Co., Ltd. We will also provide opportunities for
members to benefit from Aozara Bank’s alliance with SiliconValley Bank, which specializes in financial services for emergingtechnology companies. Another available service includes ben-efit from the bank’s Internet projects, such as the public solici-tation through Aozora Bank’s website of business plans forventure businesses.
Aozora Club provides a forum for an exchange of views andnetworking among corporations. The goal is to provide morebusiness opportunities and provide a network of partners,including the bank and all member companies, to help resolvemanagement issues.
To attract new members, branches and business divisionsinvite their customers to join Aozora Club. In addition, we alsoinvite other corporations to join the club by registering on ourwebsite for an application form.
BUSINESS INITIATIVES
Aozora Club
• Aozora Club online servicesA virtual lounge for interaction with other members An information exchangeservice exclusively for Aozora Club members. Please send us information onprospective business partners and new business plans.Solution services for those seeking ideas on resolving management issues Amenu of services provided by Aozora Bank and its business partners for theresolution of management issues.Open entry services for venture businesses seeking assistance.Here is a support desk for emerging companies with innovative business plans inareas including IT, biotechnology and manufacturing technology, seeking toconduct IPOs. Please send us your ideas to this support desk.
Aozora Club Website(https://www.aozoraclub.com/)Service began in July 2001
Diagram of Aozora Club
• Explore solutions to man-agement issues through anexchange of ideas
• Create new relationshipswith businesses acrossindustries
• Aozora Bank and its groupcompanies provide informationand ideas for resolving manage-ment issues faced by membercompanies.
Management issues
Members
Members
Members
Members
Members
9
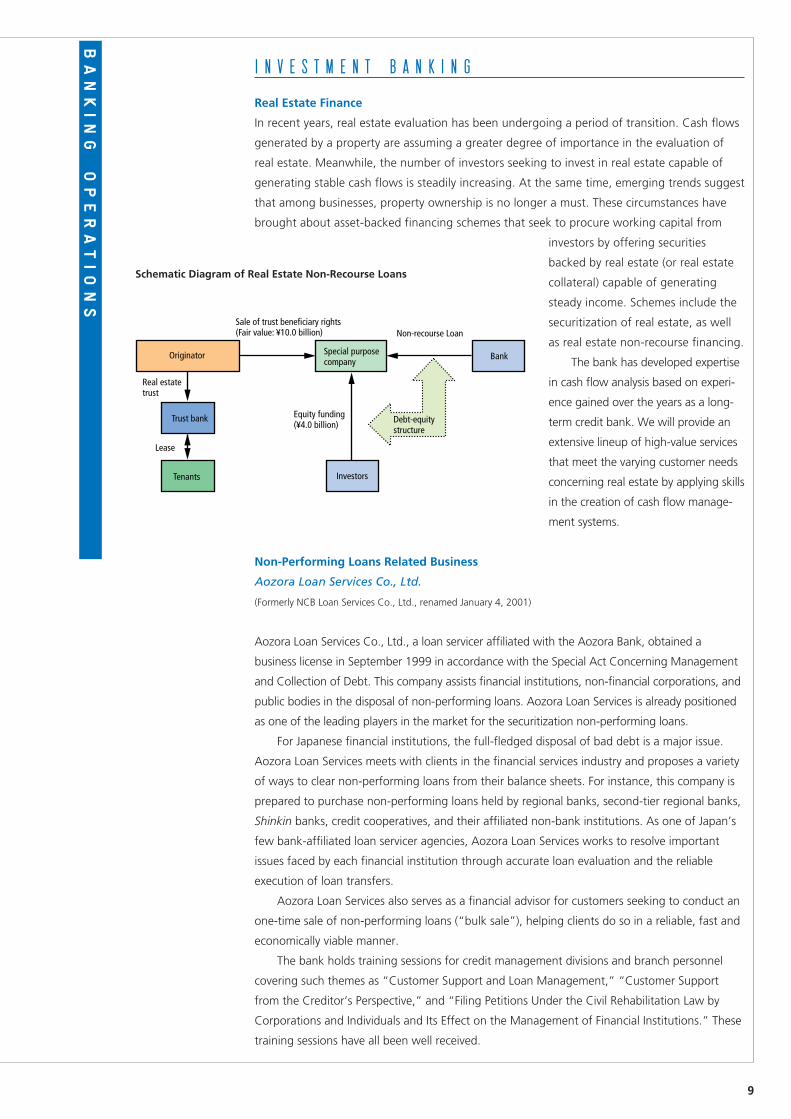
Sale of trust beneficiary rights(Fair value: ¥10.0 billion) Non-recourse Loan
Real estate trust
Equity funding(¥4.0 billion)
Lease
Tenants
Originator
Trust bank
Special purpose company
Bank
Investors
Debt-equity structure
Real Estate Finance
In recent years, real estate evaluation has been undergoing a period of transition. Cash flows
generated by a property are assuming a greater degree of importance in the evaluation of
real estate. Meanwhile, the number of investors seeking to invest in real estate capable of
generating stable cash flows is steadily increasing. At the same time, emerging trends suggest
that among businesses, property ownership is no longer a must. These circumstances have
brought about asset-backed financing schemes that seek to procure working capital from
investors by offering securities
backed by real estate (or real estate
collateral) capable of generating
steady income. Schemes include the
securitization of real estate, as well
as real estate non-recourse financing.
The bank has developed expertise
in cash flow analysis based on experi-
ence gained over the years as a long-
term credit bank. We will provide an
extensive lineup of high-value services
that meet the varying customer needs
concerning real estate by applying skills
in the creation of cash flow manage-
ment systems.
Non-Performing Loans Related Business
Aozora Loan Services Co., Ltd.
(Formerly NCB Loan Services Co., Ltd., renamed January 4, 2001)
Aozora Loan Services Co., Ltd., a loan servicer affiliated with the Aozora Bank, obtained a
business license in September 1999 in accordance with the Special Act Concerning Management
and Collection of Debt. This company assists financial institutions, non-financial corporations, and
public bodies in the disposal of non-performing loans. Aozora Loan Services is already positioned
as one of the leading players in the market for the securitization non-performing loans.
For Japanese financial institutions, the full-fledged disposal of bad debt is a major issue.
Aozora Loan Services meets with clients in the financial services industry and proposes a variety
of ways to clear non-performing loans from their balance sheets. For instance, this company is
prepared to purchase non-performing loans held by regional banks, second-tier regional banks,
Shinkin banks, credit cooperatives, and their affiliated non-bank institutions. As one of Japan’s
few bank-affiliated loan servicer agencies, Aozora Loan Services works to resolve important
issues faced by each financial institution through accurate loan evaluation and the reliable
execution of loan transfers.
Aozora Loan Services also serves as a financial advisor for customers seeking to conduct an
one-time sale of non-performing loans (“bulk sale”), helping clients do so in a reliable, fast and
economically viable manner.
The bank holds training sessions for credit management divisions and branch personnel
covering such themes as “Customer Support and Loan Management,” “Customer Support
from the Creditor’s Perspective,” and “Filing Petitions Under the Civil Rehabilitation Law by
Corporations and Individuals and Its Effect on the Management of Financial Institutions.” These
training sessions have all been well received.
I N V E S T M E N T B A N K I N G
Schematic Diagram of Real Estate Non-Recourse Loans
BANKING OPERATIONS
10
Japanese law prohibits Aozora Loan Services from assuming and collecting non-performing
assets held by non-financial corporations. However, the company can meet a wide variety of
asset securitization needs, including the accurate evaluation of non-performing loans, brokering
a sale of loans and advising on strategic planning related to the disposal of non-performing
loans. In response to the needs of public and nonpublic corporations, a number of training
sessions on themes such as “Initial Procedure for Indications of Bankruptcy and Payment
Default” are held, and have been well received.
Structured Finance
Aozora Bank arranges a wide range of financing schemes designed to meet ever diversifying
funding needs of its clients. These include the arrangement of syndicated loans, and the
securitization of assets including customers’ monetary claims.
Syndicated loans constitute a lending method where multiple financial institutions agree to
the same loan conditions and contract. As a relatively new means of funding in Japan, it has
rapidly gained popularity in recent years. Syndicated loans allow customers to procure funds in
an efficient manner, since negotiations and loan administration are centralized. Other merits
include allowing customers to extend their funding base and benefit from favorable public
relations. The bank conducts the arrangement of syndicated loans (“arranger”) and the
subsequent administrative operations of these loans (“agent”). In this way, the bank links its
business relationships with regional financial institutions to the funding needs of its customers.
The securitization of monetary claims such as notes and accounts receivable, lease assets, and
installment credit claims have grown to become just as common as bank loans and the issuance
of corporate bonds as a means of funding. Securitization provides several key merits for custom-
ers, including the diversification of funding sources, lower interest rates in funding achieved by
leveraging the credit of the monetary claims, and the streamlining of balance sheets. The bank
will endeavor to offer a broad range of securitization schemes so as to address these types of
customer needs.
Aozora Trust Bank, Ltd.
(Formerly The Nippon Credit Trust Bank, Ltd., renamed January 4, 2001)
Aozora Trust Bank, formerly The Nippon Credit Trust Bank, Ltd., was established in February
1994 to offer innovative financial products through the effective use of trust banking functions.
Ever since its establishment, the trust company has been a source of distinctive financial services
centered on the securitization of monetary claims.
The trust company provides beneficial rights to a variety of assets placed in trust accounts:
notes and accounts receivable, loans, lease assets and a variety of claims that arise in the course
of conducting business. Examples include claims to residential security deposits, remuneration
claims and accounts receivable related to the sale of condominiums. While providing innovative
fund-raising channels to corporations, these methods will also serve to streamline clients’
balance sheets and thus improve their overall financial position. Moreover, trust beneficiary
rights are widely favored as investment products by institutional investors, principally regional
financial institutions.
Of the various types of assets held in trust, we are especially focusing on the
securitization of aggregated receivables. Thus far, the securitization of small quantities of
notes receivable, medical fee claims and loans has been considered difficult. We aim to
amalgamate small-quantity receivables into a single trust. There is a significant need for this
type of service, since it can substantially reduce each customer’s transaction costs. In addi-
tion, we offer customer-segregated and general purpose money trusts.
11
We are committed to leveraging the agility that comes with being a trust bank that is a
subsidiary of a bank, and the manifold possibilities of trust functions, so as to meet diverse
customer needs. We will continue to provide innovative financial services unrestricted by any
traditional business practice.
M&As
The progress of globalization and deregulation has intensified competition, while selection and
focus on core businesses and high growth fields has spurred even more corporate restructuring.
Amid these developments, M&As have gained widespread acceptance as an effective way to
optimize the allocation of corporate resources.
Ever since the launch of M&A operations in 1988, Aozora Bank has handled a hundred and
several tens of these deals. By maximizing its wealth of experience and expertise in this area,
the bank offers advisory services on corporate mergers and the drafting of policies related to
business alliances, and transaction assessment including pricing. In this way, the bank has
assisted in expanding its customers’ business and improving their operating efficiency.
To offer customers highly specialized services in an expeditious manner, the bank has
established and maintains close ties with expert attorneys and accountants as well as external
institutions such as regional financial institutions and local chambers of commerce and industry.
The bank will apply its expertise to initiatives such as MBOs and business related to com-
pany reconstruction, which have attracted wide interest as effective means to promote the
revitalization of Japan’s economy.
Cross Border Operations
The bank provides advisory services tailored to the overseas business of small and medium-size
corporations, in areas including (1) establishing or withdrawing from overseas operations; (2)
minimizing operational risk of existing or new businesses and conducting effective financial
management. The bank also provides information required to resolve issues that emerge when
expanding overseas operations, including information on foreign exchange, economic trends, and
taxation and accounting systems of foreign countries, centered on the Asian region. This informa-
tion is published in the monthly newsletter “Aozora
Asia Business” and in various other reports.
PFI (Private Financial Initiative)
The bank provides financial advisory services on PFI
utilizing its extensive expertise in overseas project
finance. While being consulted by various non-
financial corporations interested in PFIs, the bank
also supports regional financial institutions seeking
to become financial advisors on local PFI projects in
a variety of ways.
The bank is also actively engaged in project
finance for those newly involved in the indepen-
dent power generation business, a field that has
emerged in the wake of Japan’s liberalization of
the electric power market.
Advisory Services on Market Risk Management
Changes in bank management techniques brought about by the advance of
financial technology and the disclosure of financial inspection manuals have
underscored the importance of maintaining sound risk management systems at
financial institutions. Accordingly, Aozora Bank and several regional financial
institutions have entered into an “Advisory Contract Related to Market Risk
Management.” Under this arrangement, Aozora Bank’s Risk Management
Division helps customers improve market risk management systems.
Aozora Bank’s involvement in risk management dates back to 1988. The
bank began market risk management by assessing maximum estimated losses,
using these figures to set limits on market exposure for the entire bank and
other risk controls. In particular, the early development of a value-at-risk
management system utilizing proprietary PC software developed by the bank
(patent pending) has been highly acclaimed.
Aozora Bank has thus far entered into market risk management advisory contracts
with approximately 30 customers including regional banks, second-tier regional banks
and Shinkin banks.
12
Risk Hedging Tools That Utilize Derivatives
In line with each customer’s stance toward market risks, Aozora Bank provides detailed and
fine-spun advice about risk-hedging methods from medium and long-term perspectives.
Financial instruments offered by the bank are intended to minimize and control the influence of
fluctuations in foreign exchange rates, interest rates and other risk factors. Customers can thus
shield operating results from market volatility or reduce their funding costs. New instruments
are being added to cover more uncertainties. One is weather derivatives, which allow compa-
nies to cover losses caused by unfavorable weather movements. Another being credit deriva-
tives, which allow companies to cover losses caused by a default of reference entity in the
investment portfolio.
Bank divisions involved in market-related activities have two groups. One group supports
business divisions and branches, and the other group develops new products that tap the latest
advances in financial engineering. By working together, the two groups create a base for
supplying customers with order-made financial products in a timely and effective way. The bank
provides after-deal services such as market price information, information on outsorcing of
backoffice operations for derivative transactions.
Sophisticated Financial Engineering Techniques and Market Information
Aozora Bank provides customers with various market-linked products while using its sophisti-
cated global dealer type risk management system to participate actively in the interbank
market. The bank deals with interest rate derivatives, bonds, foreign exchange contracts and
other products globally. This yields opportunities to develop new products, analyze various risks
and seek gains through arbitrage trading. For customers, this breadth makes Aozora Bank a
reliable source of advice on investments, hedging strategies and other critical subjects.
Our analysts with each area of specialization supply customers with a wide scope of
information required to make their savvy investment decisions. Reports extend from fundamen-
tal analyses to outlooks for foreign exchange rates, interest rates, etc. Comments of analysts are
made public through various media, earning the bank’s analysts a widespread reputation for
their excellent work quality.
Aozora Bank has now developed several system trading models utilizing artificial intelli-
gence (AI). These models have already been applied to Japanese government bond futures and
foreign exchange transactions. Results have been particularly strong in the JGB futures market.
And efforts will continue to be made to upgrade these systems for the service of our customers.
Investment Trusts Distributed Through Private Offerings
Aozora Bank has started offering quality and high value-added investment trusts mainly to
financial institutions. The first trust was formed in January 2001: Aozora Japanese Stock
Active Open (“Hit & Run”) a product of Aozora Asset Management Co.,Ltd. Next came in
May 2001: Tokio Marine and Fire AM Long-Short Fund, a product of Tokio Marine and Fire
Asset Management.
M A R K E T A C T I V I T I E S
13
Full-fledged Financing for New Enterprises
What is vital for young venture businesses—newly established or in an early stage of their
growth—is to draw up proper business plans and to secure needed funds based on those
drafted business plans. Aozora Bank complies with their specific fund needs in the form of
extending loans to them. In addition, Aozora Investment Co., Ltd., our venture capital sub-
sidiary, assists their fund-raising activities in the form of investing in them.
Two elements are essential to loan and investment schemes for new enterprises: First, the
bank must conduct an accurate evaluation of the technical aspects of those companies and
marketability of their planned products. Second, we must provide appropriate management
advice to them to enhance their corporate value. By forming a wide range of
alliances with venture capital companies, business incubators, universities,
non-financial corporations, and auditors, the bank is well prepared to resolve
any issues faced by them.
For instance, recent advances in the field of biotechnology are expected
to widely impact industry as a whole—from medicine/pharmaceuticals, to
foods, environment, chemicals, machinery and bioinformatics, a new disci-
pline combining IT and life sciences. Focusing on this dynamic discipline, the
bank will aggressively support venture businesses specializing in biotechnology,
as we harness a network of experts in academia and business consultants as
a source of expertise. The growth of biotechnology ventures depends even
more so than other industries on strategic business alliances. As such, the
bank will actively provide advisory services on business alliance-making.
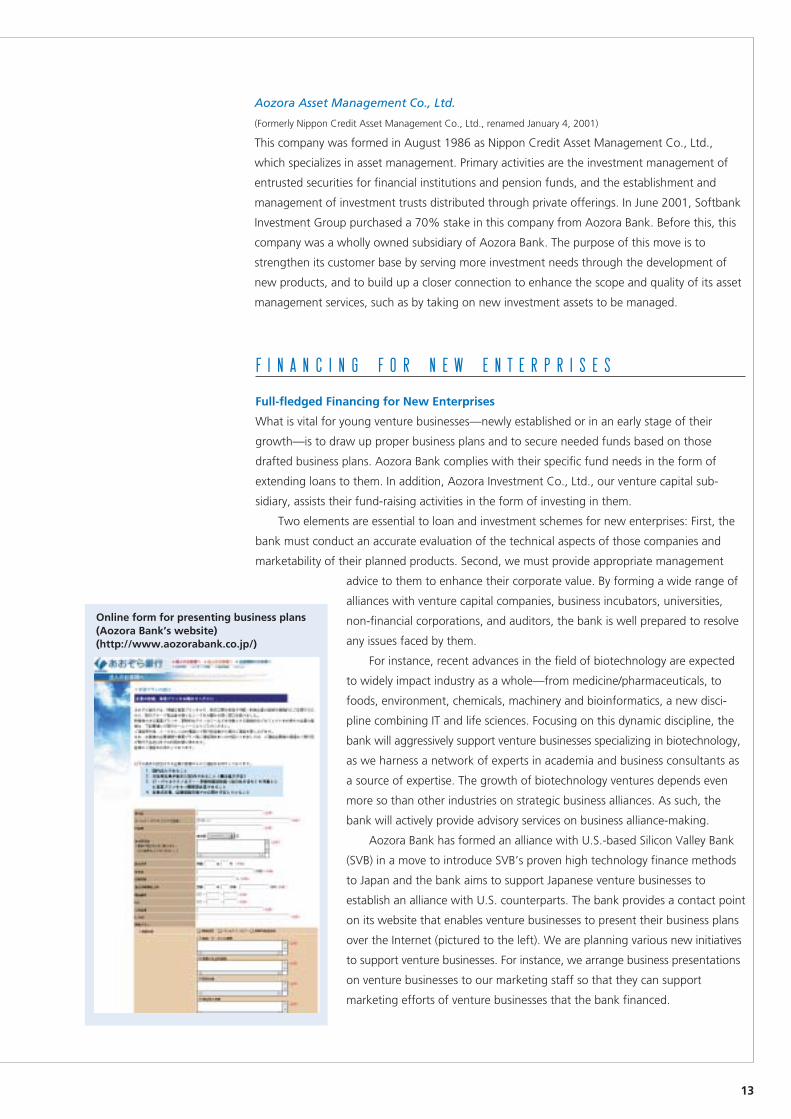
Aozora Bank has formed an alliance with U.S.-based Silicon Valley Bank
(SVB) in a move to introduce SVB’s proven high technology finance methods
to Japan and the bank aims to support Japanese venture businesses to
establish an alliance with U.S. counterparts. The bank provides a contact point
on its website that enables venture businesses to present their business plans
over the Internet (pictured to the left). We are planning various new initiatives
to support venture businesses. For instance, we arrange business presentations
on venture businesses to our marketing staff so that they can support
marketing efforts of venture businesses that the bank financed.
F I N A N C I N G F O R N E W E N T E R P R I S E S
Online form for presenting business plans(Aozora Bank’s website)(http://www.aozorabank.co.jp/)
Aozora Asset Management Co., Ltd.
(Formerly Nippon Credit Asset Management Co., Ltd., renamed January 4, 2001)
This company was formed in August 1986 as Nippon Credit Asset Management Co., Ltd.,
which specializes in asset management. Primary activities are the investment management of
entrusted securities for financial institutions and pension funds, and the establishment and
management of investment trusts distributed through private offerings. In June 2001, Softbank
Investment Group purchased a 70% stake in this company from Aozora Bank. Before this, this
company was a wholly owned subsidiary of Aozora Bank. The purpose of this move is to
strengthen its customer base by serving more investment needs through the development of
new products, and to build up a closer connection to enhance the scope and quality of its asset
management services, such as by taking on new investment assets to be managed.
14
New Funding Schemes
One example of the bank’s distinguished fund-raising initiatives for new enterprises is a finance
scheme for companies engaged in franchising operations. In the first project, the bank and QB
NET CO., LTD., a new-type hair salon chain operator (offering hair cut services at lower prices),
created a joint investment fund to open and develop new “QB house” outlets.
Under this scheme, funds required to open new franchised stores are provided from the
investment fund, while the store operator is charged with staff recruiting, staff training, etc.
Aozora Investment Co., Ltd. assesses growth potential of prospective new franchisees and
authorizes funding.
Besides investment funds for chain store operators, the bank has a proven record in
investment funds arrangement for home video game software development. Our finance
schemes are by no means limited to conventional forms of loans and investments. The bank
will continue to offer a diverse range of financing arrangements for venture businesses.
Aozora Investment Co., Ltd.
(Formerly NCB Private Equity Co., Ltd., renamed January 4, 2001)
Aozora Investment Co., Ltd., a wholly owned subsidiary of Aozora Bank, Ltd, has enhanced its
IPO support operations—its mainstay business for more than 10 years—and started anew in
July 1999 a venture capital business in order to offer comprehensive support services for
venture businesses.
The Aozora Bank Group applies its expertise and business network to meet various
needs of entrepreneurs planning for initial public offerings (IPOs). With a view to maximizing
potential of emerging companies, Aozora Investment Co., Ltd. provides
consultation services on drafting business plans that address issues faced by
each customer and on venture capital fund-raising schemes. In addition,
Aozora Investment Co., Ltd. is involved in equity finance such as underwrit-
ing equities, warrant bonds and convertible bonds. In this way, we offer
comprehensive supporting services to venture businesses.
The company is deeply involved in the development of new schemes such
as investments in specific projects, and providing support to business develop-
ment through arranging funds. And, this is one of the Aozora Investment’s
unique features as a venture capital. The company has been highly successful
in arranging investment funds for companies expanding their franchised
stores’ network and in arranging investment funds for home video game
software companies.
By harnessing the entire Aozora Bank Group’s expertise and its business
network, Aozora Investment will continue to meet various needs of entrepre-
neurs, to support the development of prospective venture businesses and help
them make IPOs.
Aozora Investment’s Website(http://www.aozora-invest.co.jp/)
15
BUSINESS INITIATIVES
Alliance with Silicon Valley Bank
Silicon Valley Bank (SVB) of the United States has a clout infinancing high-technology startup companies. In April 2001,Aozora Bank and SVB agreed to collaborate in areas such asfinancing high-tech venture companies.
Through this alliance, Aozora Bank aims to serve as abridge between Japanese customers and Silicon Valley compa-nies, providing an interface leading to new value creation. Tothis end, the two banks will be in full cooperation in providingservices both in Japan and in the U.S. Specific steps includesetting up of a “Japan Desk” at SVB to connect U.S. com-panies with Japanese companies. In addition, SVB’s websitecontents will be available in Japanese on Aozora Bank’shomepage. The two banks will hold joint conferences andseminars, that provide not only lectures on the latest themes,but also serve as forums for interaction with local businessesand venture capitalists.
Aozora Bank will attempt to absorb SVB’s excellent busi-ness expertise in specialized fields of finance focusing onSilicon Valley companies, the epicenter of IT and life sciencesindustries. To this end, we will dispatch our employees to SVB.
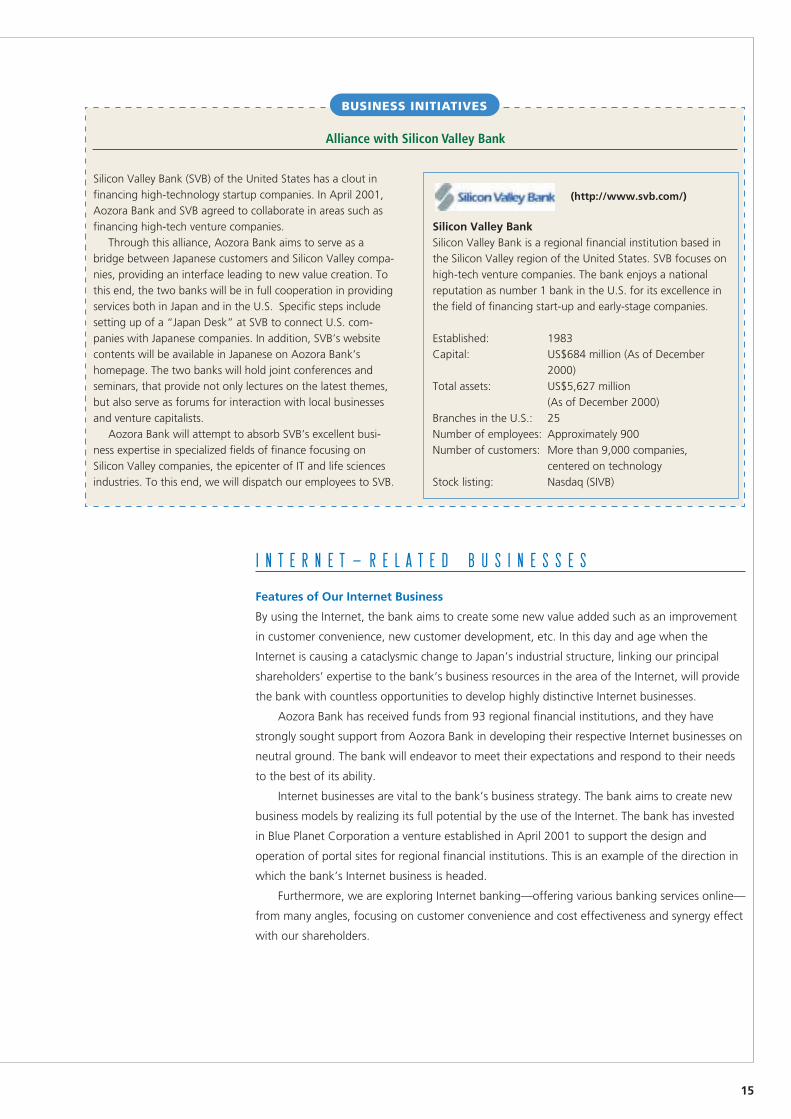
Silicon Valley BankSilicon Valley Bank is a regional financial institution based inthe Silicon Valley region of the United States. SVB focuses onhigh-tech venture companies. The bank enjoys a nationalreputation as number 1 bank in the U.S. for its excellence inthe field of financing start-up and early-stage companies.
Established: 1983Capital: US$684 million (As of December
2000)Total assets: US$5,627 million
(As of December 2000)Branches in the U.S.: 25Number of employees: Approximately 900Number of customers: More than 9,000 companies,
centered on technologyStock listing: Nasdaq (SIVB)
(http://www.svb.com/)
Features of Our Internet Business
By using the Internet, the bank aims to create some new value added such as an improvement
in customer convenience, new customer development, etc. In this day and age when the
Internet is causing a cataclysmic change to Japan’s industrial structure, linking our principal
shareholders’ expertise to the bank’s business resources in the area of the Internet, will provide
the bank with countless opportunities to develop highly distinctive Internet businesses.
Aozora Bank has received funds from 93 regional financial institutions, and they have
strongly sought support from Aozora Bank in developing their respective Internet businesses on
neutral ground. The bank will endeavor to meet their expectations and respond to their needs
to the best of its ability.
Internet businesses are vital to the bank’s business strategy. The bank aims to create new
business models by realizing its full potential by the use of the Internet. The bank has invested
in Blue Planet Corporation a venture established in April 2001 to support the design and
operation of portal sites for regional financial institutions. This is an example of the direction in
which the bank’s Internet business is headed.
Furthermore, we are exploring Internet banking—offering various banking services online—
from many angles, focusing on customer convenience and cost effectiveness and synergy effect
with our shareholders.
I N T E R N E T — R E L A T E D B U S I N E S S E S
16
Small and medium-sized companies
Customer
Customer
Customer
Customer
Customer
Customer
Use of servicesSupport services for small and medium-sized companies Shinkin Bank B
SOFTBANK EC HOLDINGS
F&M
Aozora Bank
Others
Bank A
Community services
Area newsletters
Services for corporations
Advisory services on subsidies
Administrative contents
Various Information
Accounting Payroll calculationManagement, accounting, tax
Legal consultingMarketing support
Purchase of indirect materials
E-commerce shops
Support services for small and medium-sized companies
Blue Planet
Outsourcing services
Shopping mallCorporate informationBusiness networking
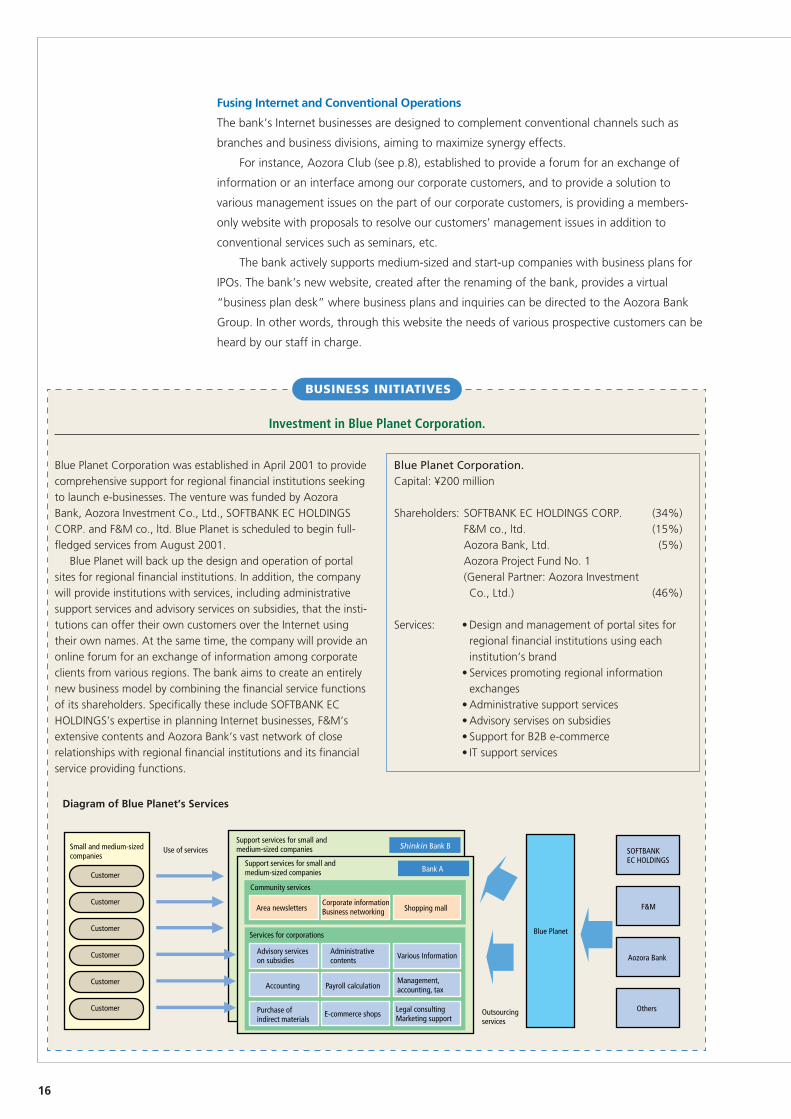
Blue Planet Corporation was established in April 2001 to providecomprehensive support for regional financial institutions seekingto launch e-businesses. The venture was funded by AozoraBank, Aozora Investment Co., Ltd., SOFTBANK EC HOLDINGSCORP. and F&M co., ltd. Blue Planet is scheduled to begin full-fledged services from August 2001.
Blue Planet will back up the design and operation of portalsites for regional financial institutions. In addition, the companywill provide institutions with services, including administrativesupport services and advisory services on subsidies, that the insti-tutions can offer their own customers over the Internet usingtheir own names. At the same time, the company will provide anonline forum for an exchange of information among corporateclients from various regions. The bank aims to create an entirelynew business model by combining the financial service functionsof its shareholders. Specifically these include SOFTBANK ECHOLDINGS’s expertise in planning Internet businesses, F&M’sextensive contents and Aozora Bank’s vast network of closerelationships with regional financial institutions and its financialservice providing functions.
Blue Planet Corporation.Capital: ¥200 million
Shareholders: SOFTBANK EC HOLDINGS CORP. (34%)F&M co., ltd. (15%)Aozora Bank, Ltd. (5%)Aozora Project Fund No. 1(General Partner: Aozora InvestmentCo., Ltd.) (46%)
Services: • Design and management of portal sites forregional financial institutions using eachinstitution’s brand
• Services promoting regional informationexchanges
• Administrative support services• Advisory servises on subsidies• Support for B2B e-commerce• IT support services
BUSINESS INITIATIVES
Investment in Blue Planet Corporation.
Diagram of Blue Planet’s Services
Fusing Internet and Conventional Operations
The bank’s Internet businesses are designed to complement conventional channels such as
branches and business divisions, aiming to maximize synergy effects.
For instance, Aozora Club (see p.8), established to provide a forum for an exchange of
information or an interface among our corporate customers, and to provide a solution to
various management issues on the part of our corporate customers, is providing a members-
only website with proposals to resolve our customers’ management issues in addition to
conventional services such as seminars, etc.
The bank actively supports medium-sized and start-up companies with business plans for
IPOs. The bank’s new website, created after the renaming of the bank, provides a virtual
“business plan desk” where business plans and inquiries can be directed to the Aozora Bank
Group. In other words, through this website the needs of various prospective customers can be
heard by our staff in charge.
17
R E T A I L B A N K I N G
To serve individual clients’ various needs, Aozora Bank offers financial instruments such as time
deposits, savings plans, and investment trusts which banks started dealing in December 1998.
The bank is currently planning to provide new types of loans, such as innovative housing loans
and credit card loans.
The bank is putting stronger fucus on financial advisory services. For instance, licensed
financial planners, tax accountants and attorneys are stationed at branches to offer consulting
services free of charge on selected days. Internationally accredited, certified financial planners
are at the disposal of customers seeking even more comprehensive and detailed financial
advice. Meanwhile, the bank is aggressively moving ahead with the expansion of service
channels and financial instruments. To bolster its branch network, Aozora Bank has entered
into an ATM alliance with various financial institutions, including city and trust banks. Tele-
phone banking was initiated in November 2000, and was followed by the successive launch of
new services. For instance, “Aozora Direct Time Deposit,” a time deposit exclusively offered
through telephone banking, was rolled out in April 2001. In this way, we will continue to
enhance our menu of services so as to combine both benefit and convenience for customers
and develop a rich variety of new financial instruments.
Addressing New Businesses Created by the Internet
Thanks to the prevalence and development of the Internet, a wide variety of unprecedented
businesses have recently been created. Addressing the needs of these new businesses is one of
our critical tasks.
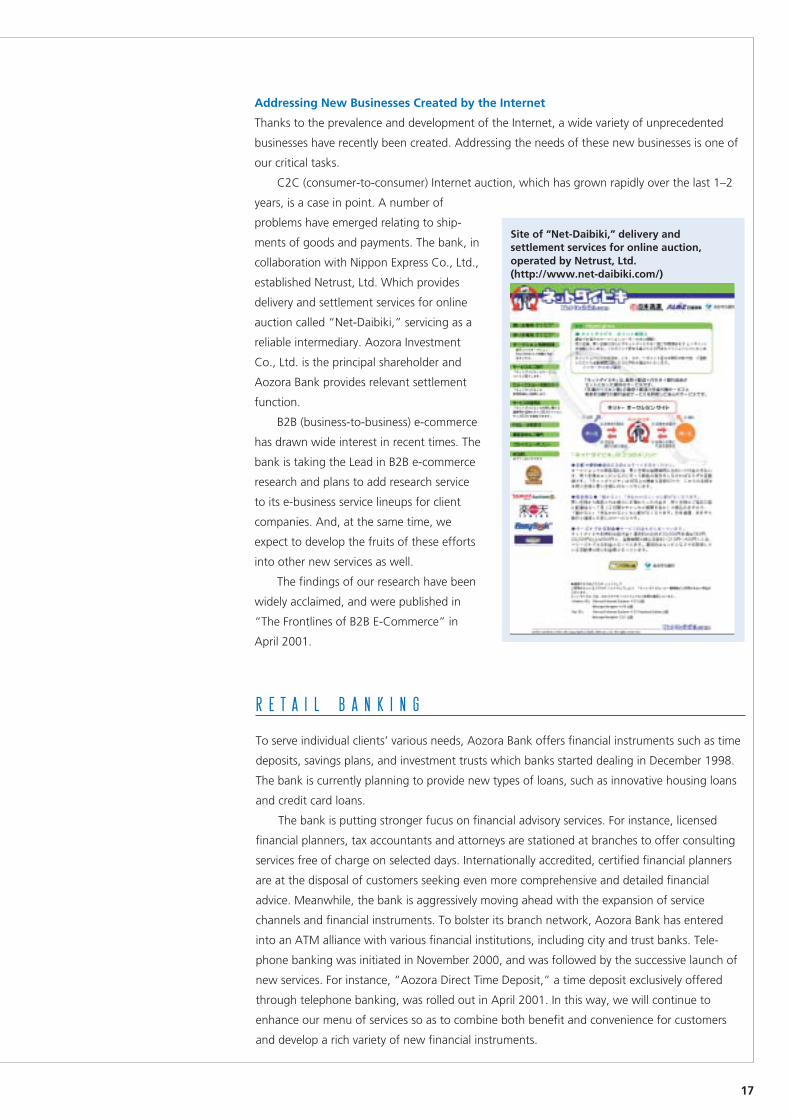
C2C (consumer-to-consumer) Internet auction, which has grown rapidly over the last 1–2
years, is a case in point. A number of
problems have emerged relating to ship-
ments of goods and payments. The bank, in
collaboration with Nippon Express Co., Ltd.,
established Netrust, Ltd. Which provides
delivery and settlement services for online
auction called “Net-Daibiki,” servicing as a
reliable intermediary. Aozora Investment
Co., Ltd. is the principal shareholder and
Aozora Bank provides relevant settlement
function.
B2B (business-to-business) e-commerce
has drawn wide interest in recent times. The
bank is taking the Lead in B2B e-commerce
research and plans to add research service
to its e-business service lineups for client
companies. And, at the same time, we
expect to develop the fruits of these efforts
into other new services as well.
The findings of our research have been
widely acclaimed, and were published in
“The Frontlines of B2B E-Commerce” in
April 2001.
Site of “Net-Daibiki,” delivery andsettlement services for online auction,operated by Netrust, Ltd.(http://www.net-daibiki.com/)
18
Nomination and Remuneration Committee
Inspection Division
Banking Portfolio Management Division
Investment Banking Division
Capital Investment and Finance Division
Net Banking Division
Corporate Planning Division
Treasury Division
Treasury Planning Division
Financial Markets Division
Accounting Division
Markets & International Administration Division
Personnel Division
Marketing Division
General Administration Division
Retail Marketing Division
Corporate Business Division I
Operations Planning Division
Corporate Business Division II
Corporate Business Division III
Banking Administration Division
Corporate Business Division IV
Corporate Business Division V
Systems Planning Division
Corporate Business Division VI
Corporate Business Division VII
Computer Operations Division
Corporate Business Division VIII
Corporate Business Division IX
Economic Research Division
Market Business Division
Public Institutions Division
Credit Division
Financial Institutions Division I
Financial Institutions Division II
Risk Management Division
Debenture & Deposit Division
Compliance Management Division
Branches
(Osaka, Nagoya, Fukuoka, Sendai, Hiroshima, Sapporo, Takamatsu, Kanazawa, Shinjyuku, Umeda, Yokohama, Kyoto, Shibuya, Ueno, Ikebukuro, Chiba, Grand Cayman)
Representative Offices
(New York, Shingapore, Beijing, Seoul, Jakarta)
Shareholders' Meeting
Board of Corporate Auditors
Internal Audit Committee Board of Directors
Corporate Auditors' Division Executive Committee
Corporate Auditors
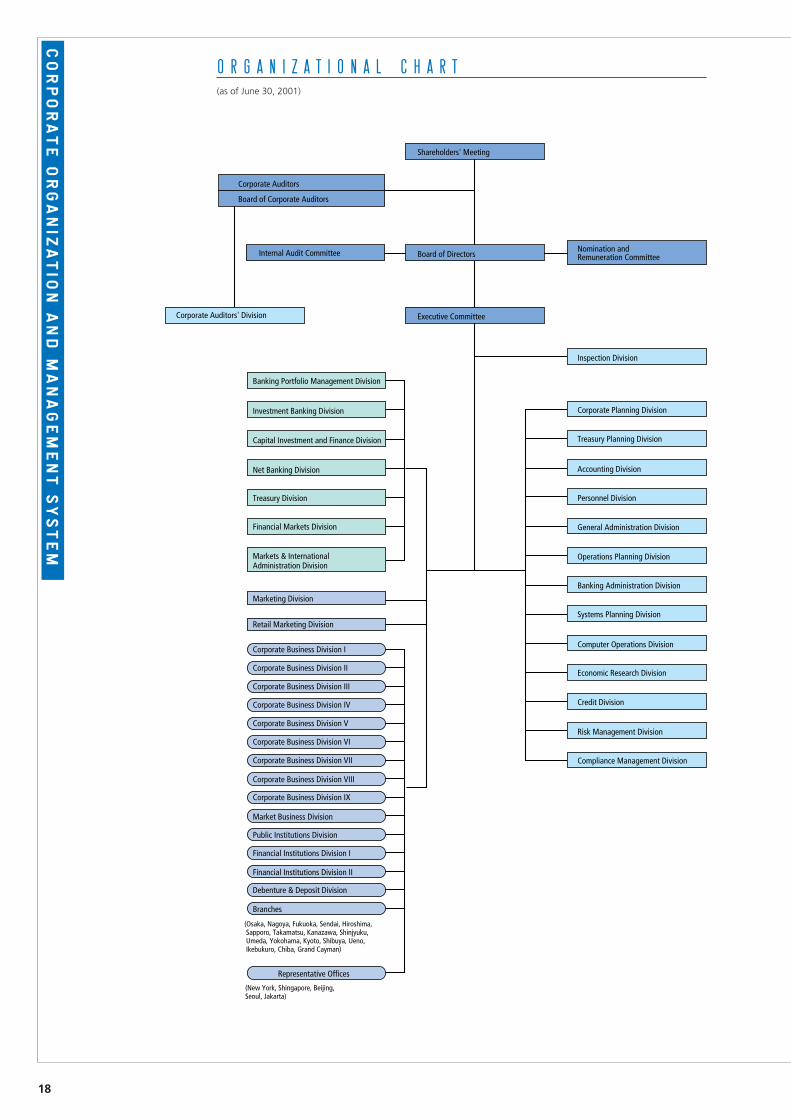
O R G A N I Z A T I O N A L C H A R T(as of June 30, 2001)
CORPORATE O
RGANI Z
ATIO
N A
ND M
ANAGEMENT S
YSTEM
19
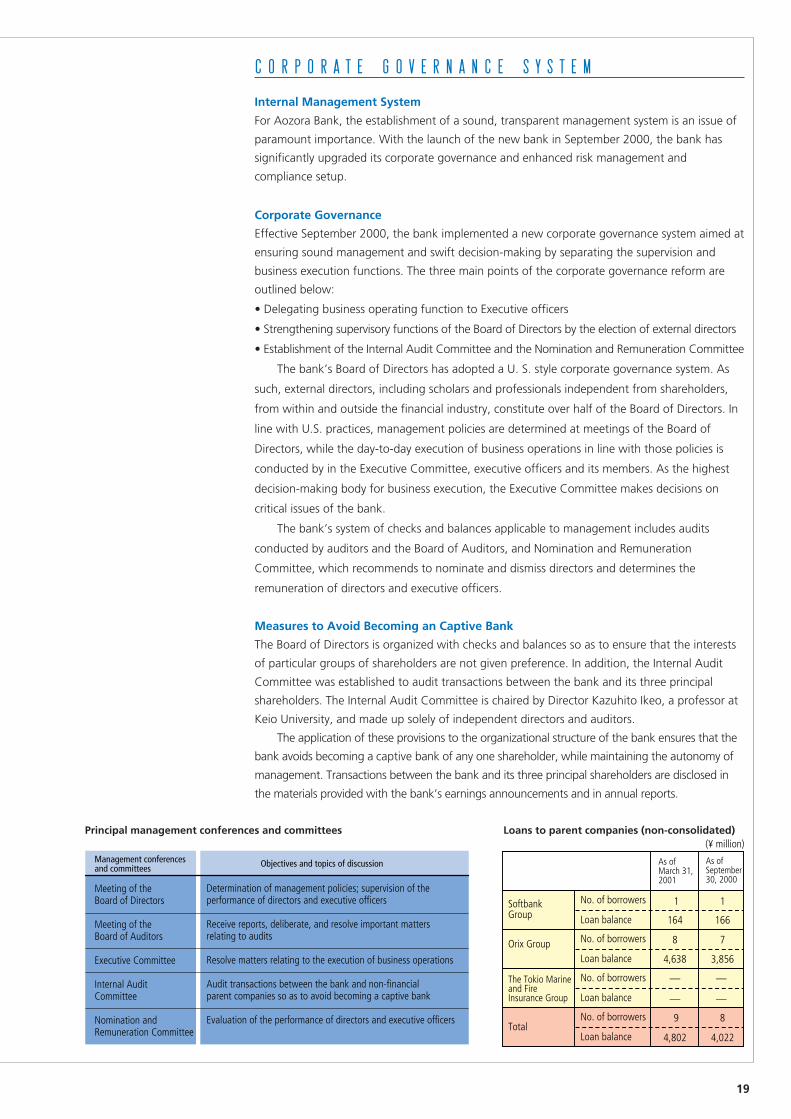
Management conferences and committees
Meeting of the Board of Directors
Meeting of the Board of Auditors
Executive Committee
Internal Audit Committee
Nomination and Remuneration Committee
Determination of management policies; supervision of the performance of directors and executive officers
Receive reports, deliberate, and resolve important matters relating to audits
Resolve matters relating to the execution of business operations
Audit transactions between the bank and non-financial parent companies so as to avoid becoming a captive bank
Evaluation of the performance of directors and executive officers
Objectives and topics of discussion
(¥ million)
As of March 31, 2001
As of September 30, 2000
Softbank Group
No. of borrowers 1 1
Loan balance 164 166
Orix Group 8 7
4,638 3,856
The Tokio Marine and Fire Insurance Group
― ―
― ―
Total 9 8
4,802 4,022
No. of borrowers
Loan balance
No. of borrowers
Loan balance
No. of borrowers
Loan balance
Internal Management System
For Aozora Bank, the establishment of a sound, transparent management system is an issue of
paramount importance. With the launch of the new bank in September 2000, the bank has
significantly upgraded its corporate governance and enhanced risk management and
compliance setup.
Corporate Governance
Effective September 2000, the bank implemented a new corporate governance system aimed at
ensuring sound management and swift decision-making by separating the supervision and
business execution functions. The three main points of the corporate governance reform are
outlined below:
• Delegating business operating function to Executive officers
• Strengthening supervisory functions of the Board of Directors by the election of external directors
• Establishment of the Internal Audit Committee and the Nomination and Remuneration Committee
The bank’s Board of Directors has adopted a U. S. style corporate governance system. As
such, external directors, including scholars and professionals independent from shareholders,
from within and outside the financial industry, constitute over half of the Board of Directors. In
line with U.S. practices, management policies are determined at meetings of the Board of
Directors, while the day-to-day execution of business operations in line with those policies is
conducted by in the Executive Committee, executive officers and its members. As the highest
decision-making body for business execution, the Executive Committee makes decisions on
critical issues of the bank.
The bank’s system of checks and balances applicable to management includes audits
conducted by auditors and the Board of Auditors, and Nomination and Remuneration
Committee, which recommends to nominate and dismiss directors and determines the
remuneration of directors and executive officers.
Measures to Avoid Becoming an Captive Bank
The Board of Directors is organized with checks and balances so as to ensure that the interests
of particular groups of shareholders are not given preference. In addition, the Internal Audit
Committee was established to audit transactions between the bank and its three principal
shareholders. The Internal Audit Committee is chaired by Director Kazuhito Ikeo, a professor at
Keio University, and made up solely of independent directors and auditors.
The application of these provisions to the organizational structure of the bank ensures that the
bank avoids becoming a captive bank of any one shareholder, while maintaining the autonomy of
management. Transactions between the bank and its three principal shareholders are disclosed in
the materials provided with the bank’s earnings announcements and in annual reports.
C O R P O R A T E G O V E R N A N C E S Y S T E M
Principal management conferences and committees Loans to parent companies (non-consolidated)
20
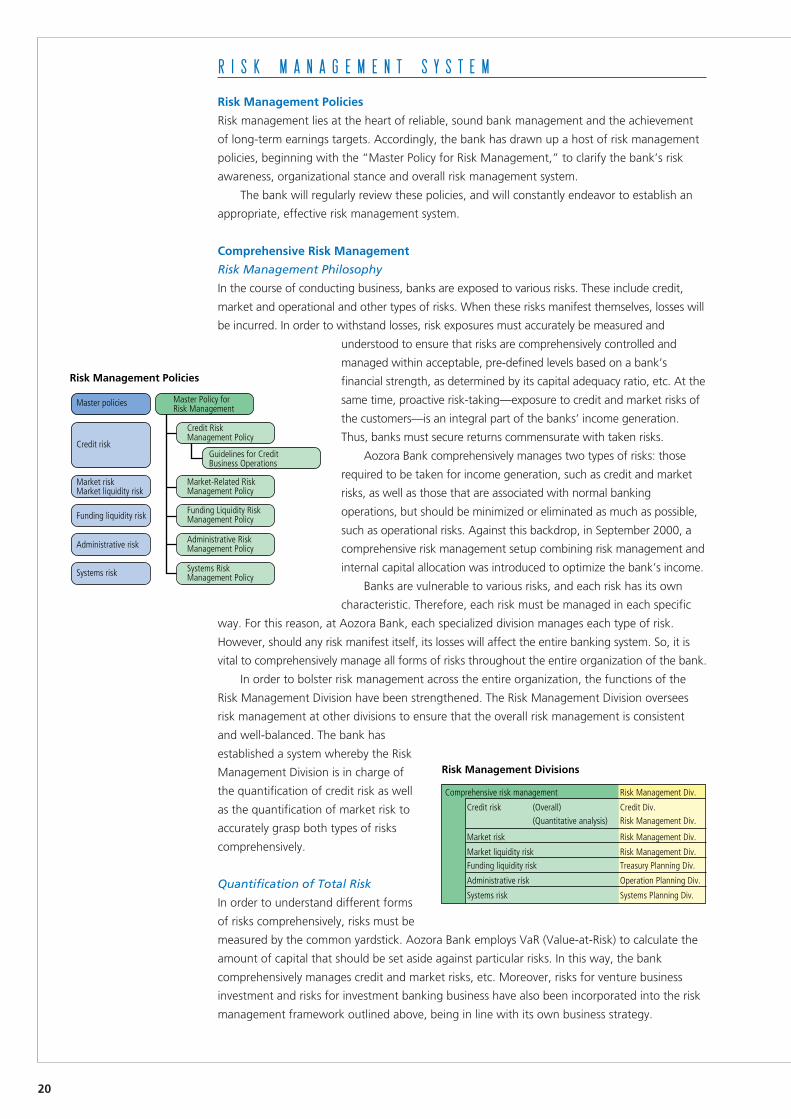
Risk Management Policies
Master policies
Credit risk
Market riskMarket liquidity risk
Funding liquidity risk
Administrative risk
Systems risk
Master Policy for Risk Management
Credit Risk Management Policy
Market-Related Risk Management Policy
Funding Liquidity Risk Management Policy
Administrative Risk Management Policy
Systems Risk Management Policy
Guidelines for Credit Business Operations
Risk Management Divisions
Comprehensive risk management Risk Management Div.
Credit risk (Overall) Credit Div.
(Quantitative analysis) Risk Management Div.
Market risk Risk Management Div.
Market liquidity risk Risk Management Div.
Funding liquidity risk Treasury Planning Div.
Administrative risk Operation Planning Div.
Systems risk Systems Planning Div.
R I S K M A N A G E M E N T S Y S T E M
Risk Management Policies
Risk management lies at the heart of reliable, sound bank management and the achievement
of long-term earnings targets. Accordingly, the bank has drawn up a host of risk management
policies, beginning with the “Master Policy for Risk Management,” to clarify the bank’s risk
awareness, organizational stance and overall risk management system.
The bank will regularly review these policies, and will constantly endeavor to establish an
appropriate, effective risk management system.
Comprehensive Risk Management
Risk Management Philosophy
In the course of conducting business, banks are exposed to various risks. These include credit,
market and operational and other types of risks. When these risks manifest themselves, losses will
be incurred. In order to withstand losses, risk exposures must accurately be measured and
understood to ensure that risks are comprehensively controlled and
managed within acceptable, pre-defined levels based on a bank’s
financial strength, as determined by its capital adequacy ratio, etc. At the
same time, proactive risk-taking—exposure to credit and market risks of
the customers—is an integral part of the banks’ income generation.
Thus, banks must secure returns commensurate with taken risks.
Aozora Bank comprehensively manages two types of risks: those
required to be taken for income generation, such as credit and market
risks, as well as those that are associated with normal banking
operations, but should be minimized or eliminated as much as possible,
such as operational risks. Against this backdrop, in September 2000, a
comprehensive risk management setup combining risk management and
internal capital allocation was introduced to optimize the bank’s income.
Banks are vulnerable to various risks, and each risk has its own
characteristic. Therefore, each risk must be managed in each specific
way. For this reason, at Aozora Bank, each specialized division manages each type of risk.
However, should any risk manifest itself, its losses will affect the entire banking system. So, it is
vital to comprehensively manage all forms of risks throughout the entire organization of the bank.
In order to bolster risk management across the entire organization, the functions of the
Risk Management Division have been strengthened. The Risk Management Division oversees
risk management at other divisions to ensure that the overall risk management is consistent
and well-balanced. The bank has
established a system whereby the Risk
Management Division is in charge of
the quantification of credit risk as well
as the quantification of market risk to
accurately grasp both types of risks
comprehensively.
Quantification of Total Risk
In order to understand different forms
of risks comprehensively, risks must be
measured by the common yardstick. Aozora Bank employs VaR (Value-at-Risk) to calculate the
amount of capital that should be set aside against particular risks. In this way, the bank
comprehensively manages credit and market risks, etc. Moreover, risks for venture business
investment and risks for investment banking business have also been incorporated into the risk
management framework outlined above, being in line with its own business strategy.
21
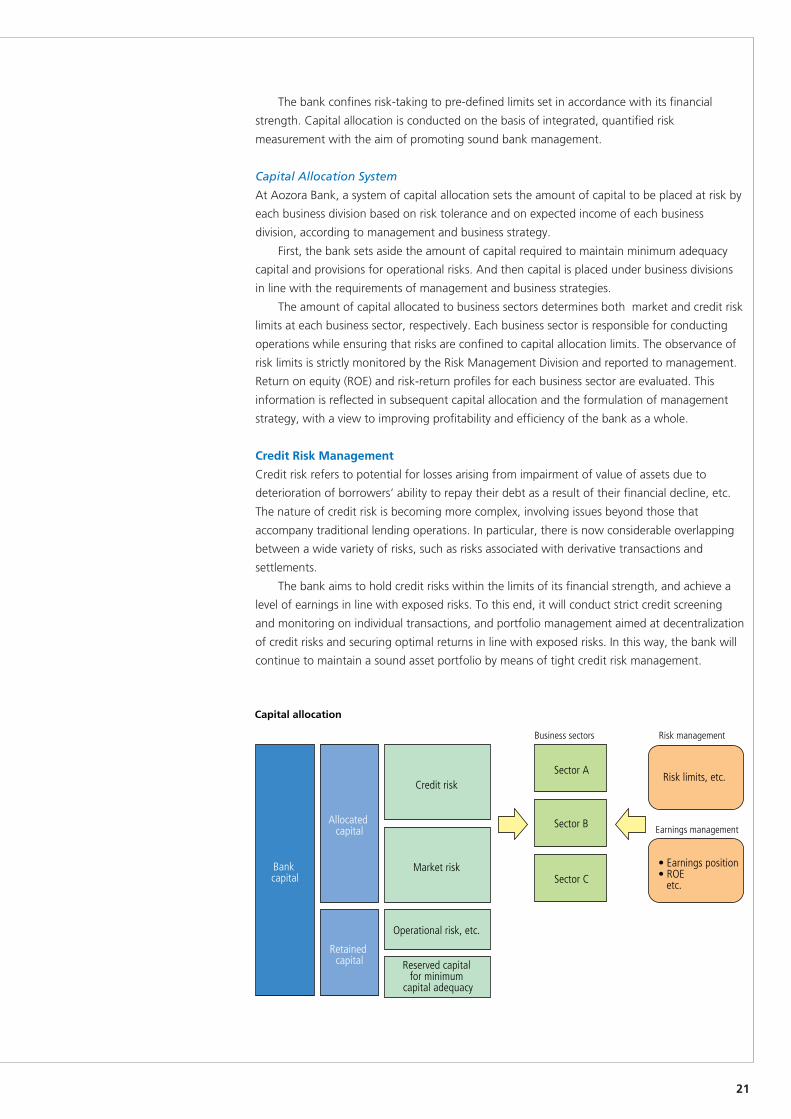
Capital allocation
Bank capital
Allocated capital
Credit risk
Market risk
Operational risk, etc.
Retained capital Reserved capital
for minimum capital adequacy
Business sectors
Sector A
Sector B
Sector C
Risk management
Risk limits, etc.
Earnings management
• Earnings position• ROE etc.
The bank confines risk-taking to pre-defined limits set in accordance with its financial
strength. Capital allocation is conducted on the basis of integrated, quantified risk
measurement with the aim of promoting sound bank management.
Capital Allocation System
At Aozora Bank, a system of capital allocation sets the amount of capital to be placed at risk by
each business division based on risk tolerance and on expected income of each business
division, according to management and business strategy.
First, the bank sets aside the amount of capital required to maintain minimum adequacy
capital and provisions for operational risks. And then capital is placed under business divisions
in line with the requirements of management and business strategies.
The amount of capital allocated to business sectors determines both market and credit risk
limits at each business sector, respectively. Each business sector is responsible for conducting
operations while ensuring that risks are confined to capital allocation limits. The observance of
risk limits is strictly monitored by the Risk Management Division and reported to management.
Return on equity (ROE) and risk-return profiles for each business sector are evaluated. This
information is reflected in subsequent capital allocation and the formulation of management
strategy, with a view to improving profitability and efficiency of the bank as a whole.
Credit Risk Management
Credit risk refers to potential for losses arising from impairment of value of assets due to
deterioration of borrowers’ ability to repay their debt as a result of their financial decline, etc.
The nature of credit risk is becoming more complex, involving issues beyond those that
accompany traditional lending operations. In particular, there is now considerable overlapping
between a wide variety of risks, such as risks associated with derivative transactions and
settlements.
The bank aims to hold credit risks within the limits of its financial strength, and achieve a
level of earnings in line with exposed risks. To this end, it will conduct strict credit screening
and monitoring on individual transactions, and portfolio management aimed at decentralization
of credit risks and securing optimal returns in line with exposed risks. In this way, the bank will
continue to maintain a sound asset portfolio by means of tight credit risk management.
22
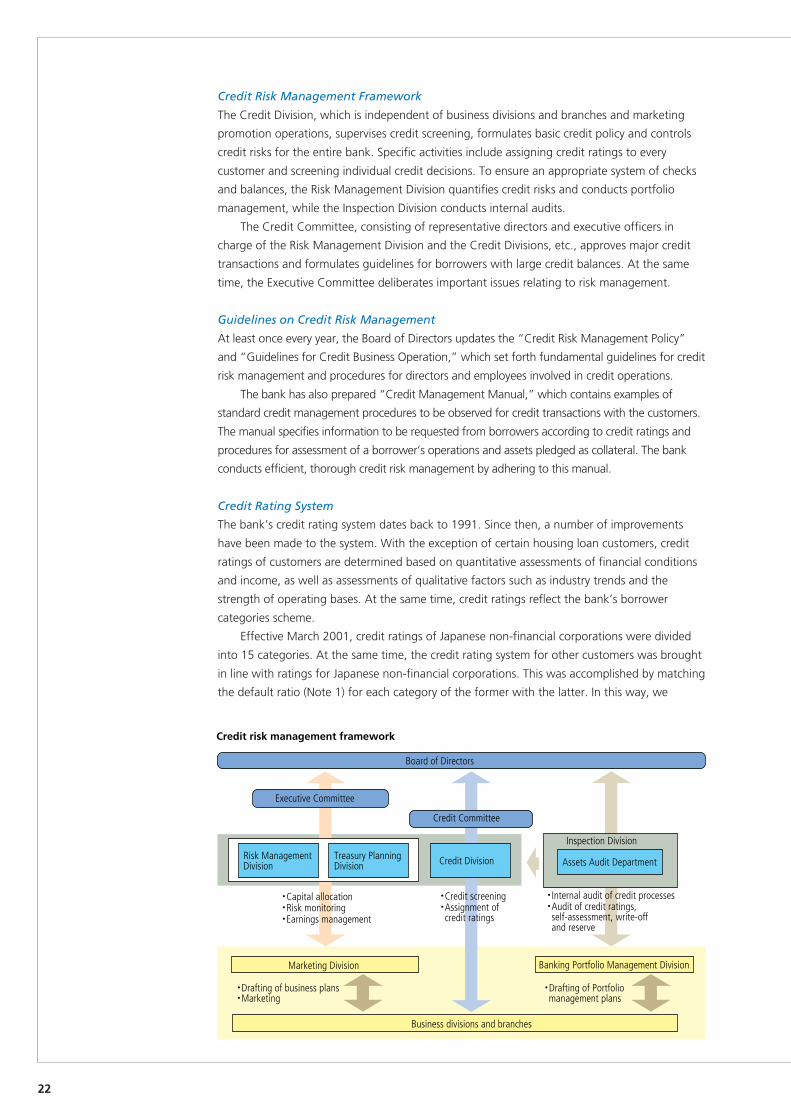
・Capital allocation・Risk monitoring・Earnings management
・Credit screening・Assignment of credit ratings
・Internal audit of credit processes・Audit of credit ratings, self-assessment, write-off and reserve
・Drafting of business plans・Marketing
・Drafting of Portfolio management plans
Banking Portfolio Management DivisionMarketing Division
Business divisions and branches
Credit risk management framework
Executive Committee
Inspection Division
Assets Audit Department
Credit Committee
Credit Division
Board of Directors
Treasury Planning Division
Risk Management Division
Credit Risk Management Framework
The Credit Division, which is independent of business divisions and branches and marketing
promotion operations, supervises credit screening, formulates basic credit policy and controls
credit risks for the entire bank. Specific activities include assigning credit ratings to every
customer and screening individual credit decisions. To ensure an appropriate system of checks
and balances, the Risk Management Division quantifies credit risks and conducts portfolio
management, while the Inspection Division conducts internal audits.
The Credit Committee, consisting of representative directors and executive officers in
charge of the Risk Management Division and the Credit Divisions, etc., approves major credit
transactions and formulates guidelines for borrowers with large credit balances. At the same
time, the Executive Committee deliberates important issues relating to risk management.
Guidelines on Credit Risk Management
At least once every year, the Board of Directors updates the “Credit Risk Management Policy”
and “Guidelines for Credit Business Operation,” which set forth fundamental guidelines for credit
risk management and procedures for directors and employees involved in credit operations.
The bank has also prepared “Credit Management Manual,” which contains examples of
standard credit management procedures to be observed for credit transactions with the customers.
The manual specifies information to be requested from borrowers according to credit ratings and
procedures for assessment of a borrower’s operations and assets pledged as collateral. The bank
conducts efficient, thorough credit risk management by adhering to this manual.
Credit Rating System
The bank’s credit rating system dates back to 1991. Since then, a number of improvements
have been made to the system. With the exception of certain housing loan customers, credit
ratings of customers are determined based on quantitative assessments of financial conditions
and income, as well as assessments of qualitative factors such as industry trends and the
strength of operating bases. At the same time, credit ratings reflect the bank’s borrower
categories scheme.
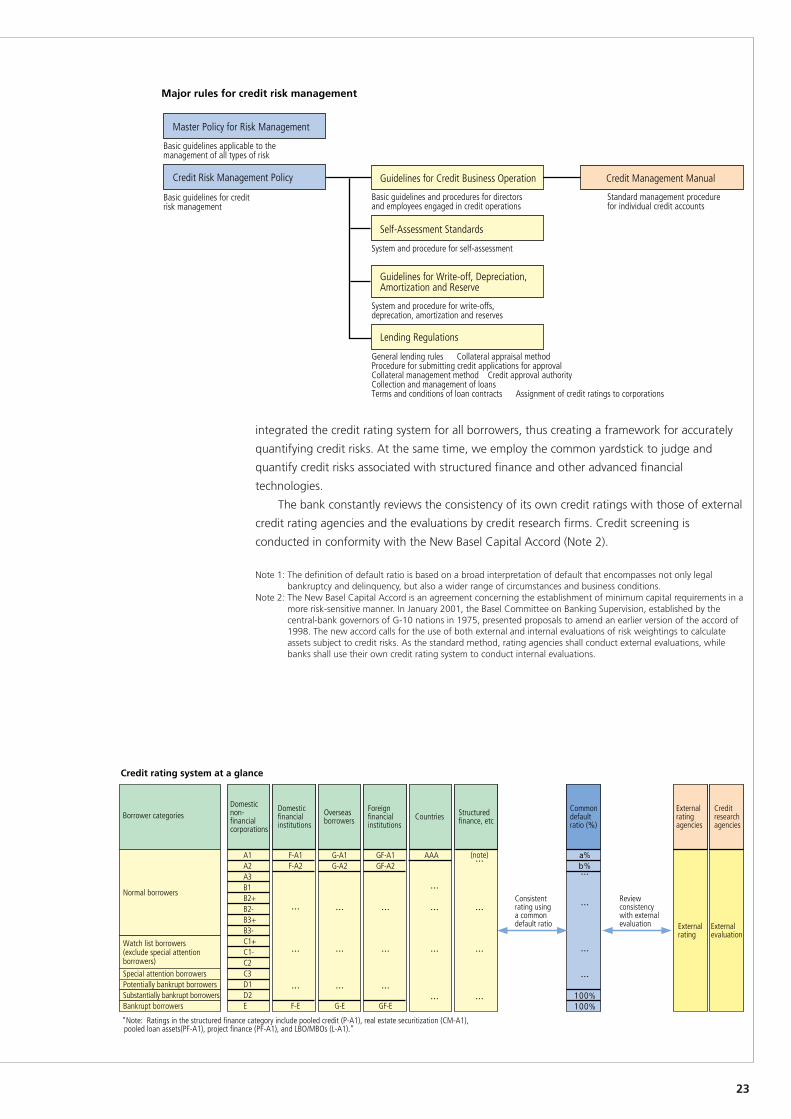
Effective March 2001, credit ratings of Japanese non-financial corporations were divided
into 15 categories. At the same time, the credit rating system for other customers was brought
in line with ratings for Japanese non-financial corporations. This was accomplished by matching
the default ratio (Note 1) for each category of the former with the latter. In this way, we
23
Major rules for credit risk management
Master Policy for Risk Management
Basic guidelines applicable to the management of all types of risk
Credit Risk Management Policy
Basic guidelines for credit risk management
Guidelines for Credit Business Operation Credit Management Manual
Standard management procedurefor individual credit accounts
Self-Assessment Standards
System and procedure for self-assessment
Guidelines for Write-off, Depreciation, Amortization and Reserve
System and procedure for write-offs, deprecation, amortization and reserves
Lending Regulations
General lending rules Collateral appraisal methodProcedure for submitting credit applications for approval Collateral management method Credit approval authority Collection and management of loansTerms and conditions of loan contracts Assignment of credit ratings to corporations
Basic guidelines and procedures for directors and employees engaged in credit operations
Borrower categoriesDomestic non-financial corporations
Domestic financial institutions
Overseas borrowers
Foreign financial institutions
Countries Structured finance, etc
Common default ratio (%)
External rating agencies
External rating
Credit research agencies
Review consistency with external evaluation
Consistent rating using a common default ratio
Credit rating system at a glance
A1 F-A1 G-A1 GF-A1 AAA (note) a%A2 F-A2 G-A2 GF-A2 b%A3B1B2+B2-B3+B3-C1+C1-C2
Special attention borrowers C3Potentially bankrupt borrowers D1Substantially bankrupt borrowers D2 100%Bankrupt borrowers E F-E G-E GF-E 100%
“Note: Ratings in the structured finance category include pooled credit (P-A1), real estate securitization (CM-A1), pooled loan assets(PF-A1), project finance (PF-A1), and LBO/MBOs (L-A1).”
Normal borrowers
Watch list borrowers(exclude special attention borrowers)
…
…
…
… …
… …
… …
… … … …
…
…
…
… … …
… …
…
…
External evaluation
integrated the credit rating system for all borrowers, thus creating a framework for accurately
quantifying credit risks. At the same time, we employ the common yardstick to judge and
quantify credit risks associated with structured finance and other advanced financial
technologies.
The bank constantly reviews the consistency of its own credit ratings with those of external
credit rating agencies and the evaluations by credit research firms. Credit screening is
conducted in conformity with the New Basel Capital Accord (Note 2).
Note 1: The definition of default ratio is based on a broad interpretation of default that encompasses not only legalbankruptcy and delinquency, but also a wider range of circumstances and business conditions.
Note 2: The New Basel Capital Accord is an agreement concerning the establishment of minimum capital requirements in amore risk-sensitive manner. In January 2001, the Basel Committee on Banking Supervision, established by thecentral-bank governors of G-10 nations in 1975, presented proposals to amend an earlier version of the accord of1998. The new accord calls for the use of both external and internal evaluations of risk weightings to calculateassets subject to credit risks. As the standard method, rating agencies shall conduct external evaluations, whilebanks shall use their own credit rating system to conduct internal evaluations.
24
Credit Management Centered on Ratings
At Aozora Bank, credit ratings are integral to credit management. Credit ratings affect credit
screening procedures, and constitute one of many important criteria for credit approval,
including criteria for interest spread and credit limits. Credit ratings are also used to conduct
self-assessments and are employed as benchmarks to quantify credit risks. The following
procedures are followed in assigning credit ratings.
• Business divisions and branches conduct preliminary evaluations of borrowers. Subsequently,
the Credit Division, which is independent of the former, is responsible for making the final
decision, and to ensure sufficient checks and balances, the final assignment of a credit rating
is reviewed by the Assets Audit Department and an auditor.
• Decision-making authority is delegated based on a combination of two factors: credit ratings
and credit exposure.
• Credit limits for each rating are determined based on bank capital and credit costs for each
rating. As such, ratings are a key indicator used to hold credit risks within appropriate limits.
• In April 2001, the bank adopted credit ratings linked to certain financing schemes, such as
structured finance, where collection is independent of a borrower’s ability to repay a debt.
We will continue to refine credit rating systems. For instance, we will develop initiatives such
as credit ratings for venture businesses based on evaluation of business models.
Credit Screening on Individual Transactions
Credit ratings are nothing more than indicators for borrowers’ creditworthiness, based on
default ratios. As such, actual credit screening must be conducted in such a way to evaluate
borrowers and their credit requirements on individual transactions.
Business divisions and branches are responsible for preliminary screenings. Subsequently,
experienced analysts in the Credit Division conduct secondary screenings, which involves, in
particular, a careful review of the business plans, the appropriateness of fund usage and its
financial soundness. Analysts also give consideration to the future availability of funds for
repayment, repayment methods, and the duration of the loan.
Credit monitoring is conducted in accordance with guidelines stipulated in Lending
Regulations and the Credit Management Manual. The bank carefully monitors the
creditworthiness of borrowers and the value of collateral. In this way, the bank works to
uncover problems at an early stage, with a view to preventing a possible occurrence of non-
performing loans.
Portfolio Management
To maintain the soundness of assets vulnerable to credit risks, the bank evaluates and manages
risks associated with each borrower and loan application along with estimated earnings from the
loan. At the same time, the bank analyzes and manages aggregate risks in the entire loan
portfolio. In August 2000, the Risk Management Division was strengthened and improved. The
division monitors portfolio from various angles, such as by industry, by internal credit ratings and
by category of large borrower. The division regularly reports and puts forward recommendations
to the Executive Committee and the Board of Directors. This allows the bank to avoid over-
exposure in a single category, and thus promotes an effective control of credit risks involved. In
this way, the bank is able to optimize a level of earnings in line with exposed risks.
The bank has implemented a system whereby credit risks can be grasped on a consolidated
basis including those of subsidiaries and affiliates.
Quantifying Credit Risk
In May 2000, the bank introduced a new proprietary numerical model to quantify credit risks.
With the use of this model, the bank calculates credit risks based on such objective data as
credit ratings, default ratios, collection prospects, etc. concerning not only on-balance
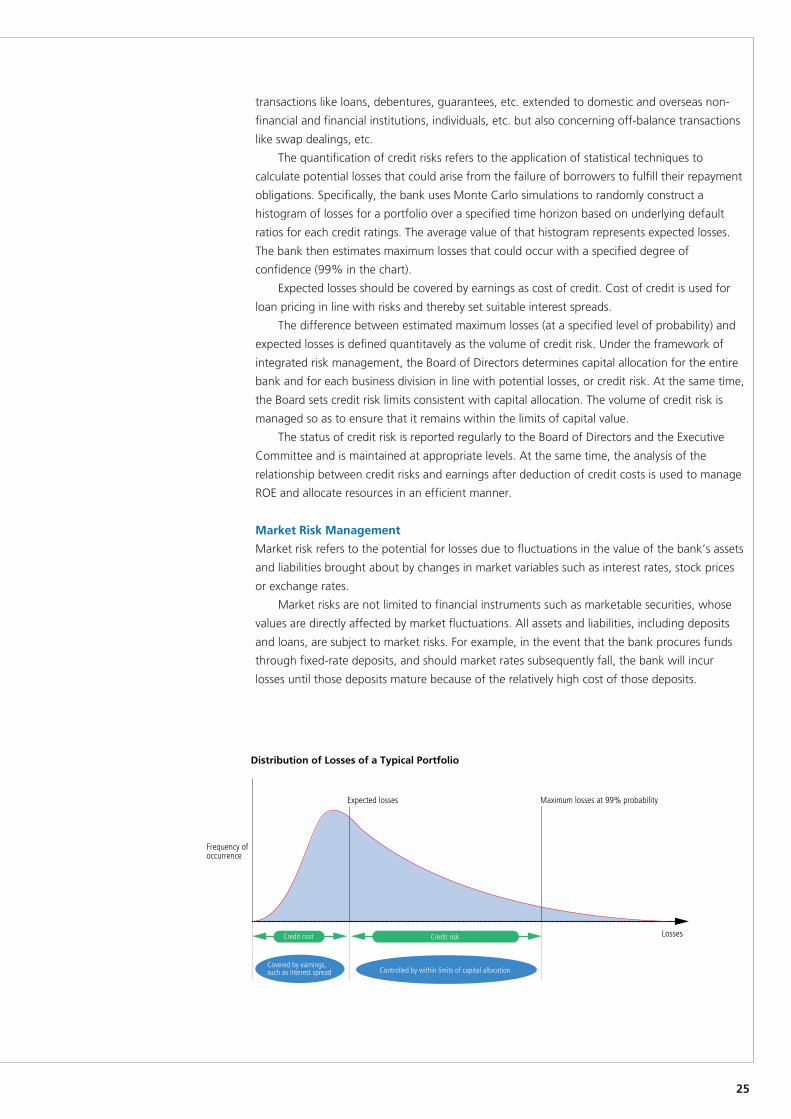
25
Expected losses
Frequency of occurrence
Losses
Maximum losses at 99% probability
Distribution of Losses of a Typical Portfolio
Credit riskCredit cost
Controlled by within limits of capital allocationCovered by earnings, such as interest spread
transactions like loans, debentures, guarantees, etc. extended to domestic and overseas non-
financial and financial institutions, individuals, etc. but also concerning off-balance transactions
like swap dealings, etc.
The quantification of credit risks refers to the application of statistical techniques to
calculate potential losses that could arise from the failure of borrowers to fulfill their repayment
obligations. Specifically, the bank uses Monte Carlo simulations to randomly construct a
histogram of losses for a portfolio over a specified time horizon based on underlying default
ratios for each credit ratings. The average value of that histogram represents expected losses.
The bank then estimates maximum losses that could occur with a specified degree of
confidence (99% in the chart).
Expected losses should be covered by earnings as cost of credit. Cost of credit is used for
loan pricing in line with risks and thereby set suitable interest spreads.
The difference between estimated maximum losses (at a specified level of probability) and
expected losses is defined quantitavely as the volume of credit risk. Under the framework of
integrated risk management, the Board of Directors determines capital allocation for the entire
bank and for each business division in line with potential losses, or credit risk. At the same time,
the Board sets credit risk limits consistent with capital allocation. The volume of credit risk is
managed so as to ensure that it remains within the limits of capital value.
The status of credit risk is reported regularly to the Board of Directors and the Executive
Committee and is maintained at appropriate levels. At the same time, the analysis of the
relationship between credit risks and earnings after deduction of credit costs is used to manage
ROE and allocate resources in an efficient manner.
Market Risk Management
Market risk refers to the potential for losses due to fluctuations in the value of the bank’s assets
and liabilities brought about by changes in market variables such as interest rates, stock prices
or exchange rates.
Market risks are not limited to financial instruments such as marketable securities, whose
values are directly affected by market fluctuations. All assets and liabilities, including deposits
and loans, are subject to market risks. For example, in the event that the bank procures funds
through fixed-rate deposits, and should market rates subsequently fall, the bank will incur
losses until those deposits mature because of the relatively high cost of those deposits.
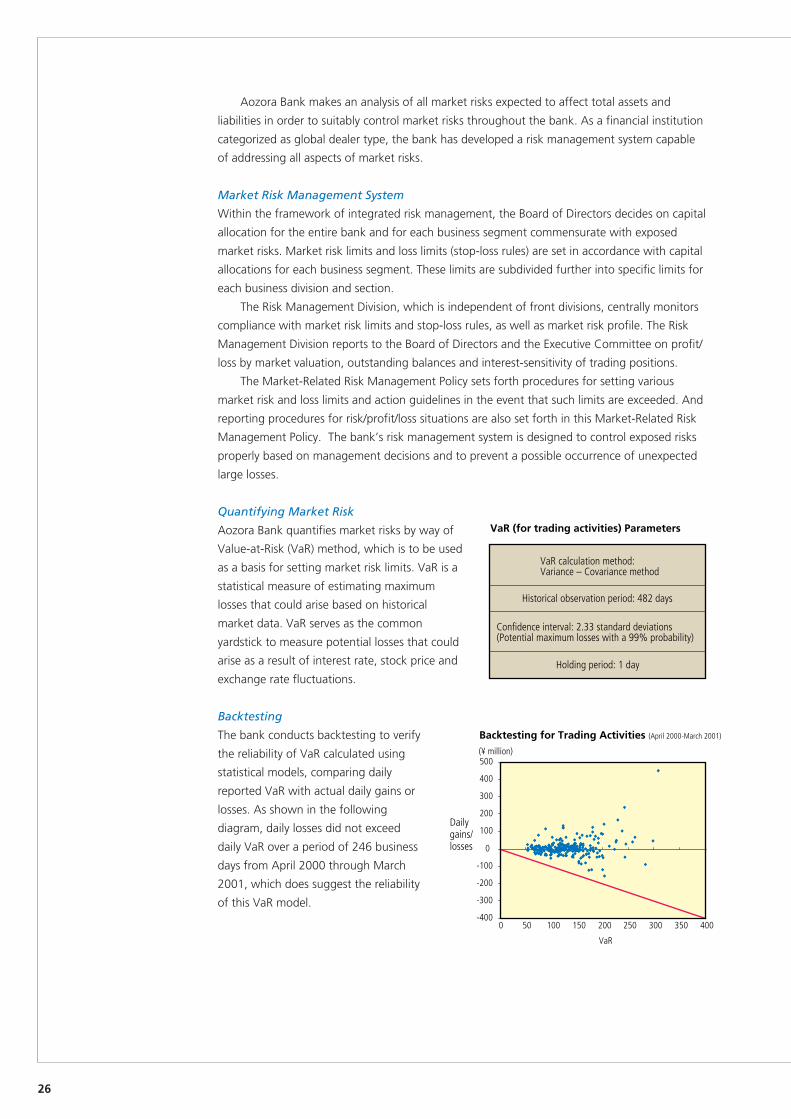
26
VaR (for trading activities) Parameters
VaR calculation method: Variance – Covariance method
Holding period: 1 day
Historical observation period: 482 days
Confidence interval: 2.33 standard deviations(Potential maximum losses with a 99% probability)
(¥ million)
Backtesting for Trading Activities (April 2000-March 2001)
-400
-300
-200
-100
0
100
200
300
400
500
0 50 100 150 200 250 300 350 400
VaR
Daily gains/losses
Aozora Bank makes an analysis of all market risks expected to affect total assets and
liabilities in order to suitably control market risks throughout the bank. As a financial institution
categorized as global dealer type, the bank has developed a risk management system capable
of addressing all aspects of market risks.
Market Risk Management System
Within the framework of integrated risk management, the Board of Directors decides on capital
allocation for the entire bank and for each business segment commensurate with exposed
market risks. Market risk limits and loss limits (stop-loss rules) are set in accordance with capital
allocations for each business segment. These limits are subdivided further into specific limits for
each business division and section.
The Risk Management Division, which is independent of front divisions, centrally monitors
compliance with market risk limits and stop-loss rules, as well as market risk profile. The Risk
Management Division reports to the Board of Directors and the Executive Committee on profit/
loss by market valuation, outstanding balances and interest-sensitivity of trading positions.
The Market-Related Risk Management Policy sets forth procedures for setting various
market risk and loss limits and action guidelines in the event that such limits are exceeded. And
reporting procedures for risk/profit/loss situations are also set forth in this Market-Related Risk
Management Policy. The bank’s risk management system is designed to control exposed risks
properly based on management decisions and to prevent a possible occurrence of unexpected
large losses.
Quantifying Market Risk
Aozora Bank quantifies market risks by way of
Value-at-Risk (VaR) method, which is to be used
as a basis for setting market risk limits. VaR is a
statistical measure of estimating maximum
losses that could arise based on historical
market data. VaR serves as the common
yardstick to measure potential losses that could
arise as a result of interest rate, stock price and
exchange rate fluctuations.
Backtesting
The bank conducts backtesting to verify
the reliability of VaR calculated using
statistical models, comparing daily
reported VaR with actual daily gains or
losses. As shown in the following
diagram, daily losses did not exceed
daily VaR over a period of 246 business
days from April 2000 through March
2001, which does suggest the reliability
of this VaR model.
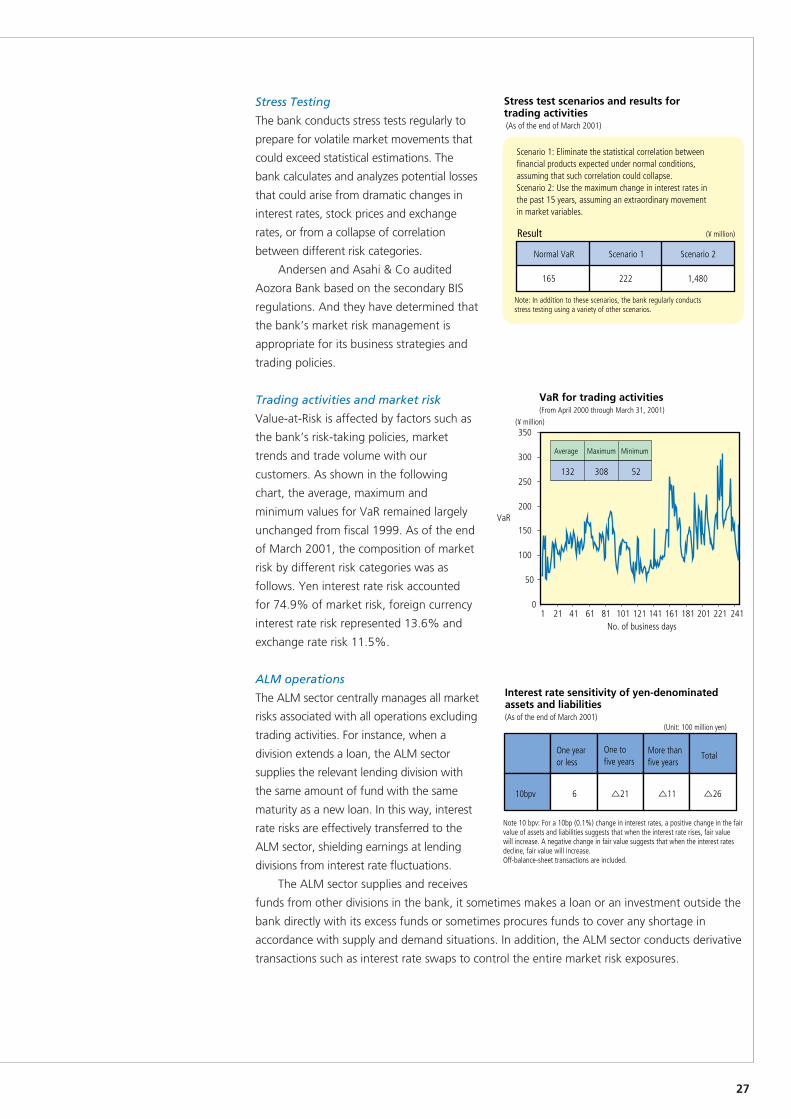
27
Stress test scenarios and results for trading activities (As of the end of March 2001)
Scenario 1: Eliminate the statistical correlation between financial products expected under normal conditions, assuming that such correlation could collapse.Scenario 2: Use the maximum change in interest rates in the past 15 years, assuming an extraordinary movement in market variables.
Result (¥ million)
Normal VaR Scenario 1 Scenario 2
165 222 1,480
Note: In addition to these scenarios, the bank regularly conducts stress testing using a variety of other scenarios.
Stress Testing
The bank conducts stress tests regularly to
prepare for volatile market movements that
could exceed statistical estimations. The
bank calculates and analyzes potential losses
that could arise from dramatic changes in
interest rates, stock prices and exchange
rates, or from a collapse of correlation
between different risk categories.
Andersen and Asahi & Co audited
Aozora Bank based on the secondary BIS
regulations. And they have determined that
the bank’s market risk management is
appropriate for its business strategies and
trading policies.
Trading activities and market risk
Value-at-Risk is affected by factors such as
the bank’s risk-taking policies, market
trends and trade volume with our
customers. As shown in the following
chart, the average, maximum and
minimum values for VaR remained largely
unchanged from fiscal 1999. As of the end
of March 2001, the composition of market
risk by different risk categories was as
follows. Yen interest rate risk accounted
for 74.9% of market risk, foreign currency
interest rate risk represented 13.6% and
exchange rate risk 11.5%.
ALM operations
The ALM sector centrally manages all market
risks associated with all operations excluding
trading activities. For instance, when a
division extends a loan, the ALM sector
supplies the relevant lending division with
the same amount of fund with the same
maturity as a new loan. In this way, interest
rate risks are effectively transferred to the
ALM sector, shielding earnings at lending
divisions from interest rate fluctuations.
The ALM sector supplies and receives
funds from other divisions in the bank, it sometimes makes a loan or an investment outside the
bank directly with its excess funds or sometimes procures funds to cover any shortage in
accordance with supply and demand situations. In addition, the ALM sector conducts derivative
transactions such as interest rate swaps to control the entire market risk exposures.
(¥ million)
VaR for trading activities (From April 2000 through March 31, 2001)
0
50
100
150
200
250
300
350
1 21 41 61 81 101 121 141 161 181 201 221 241No. of business days
VaR
132 308 52
Average Maximum Minimum
Interest rate sensitivity of yen-denominated assets and liabilities(As of the end of March 2001)
(Unit: 100 million yen)
One year or less
One to five years
More than five years
Total
10bpv 6 △21 △11 △26
Note 10 bpv: For a 10bp (0.1%) change in interest rates, a positive change in the fair value of assets and liabilities suggests that when the interest rate rises, fair value will increase. A negative change in fair value suggests that when the interest rates decline, fair value will increase. Off-balance-sheet transactions are included.
28
Liquidity Risk Management
There are two types of liquidity risks. One is funding liquidity risk, which refers to a risk that the
bank is unable to raise funds needed for various fund settlements. The other being market
liquidity risk, caused by the inability of the bank to unwind trading positions at reasonable
market prices due to a variety of factors, including market confusions.
Funding Liquidity Risk Management
The Treasury Planning Division centrally manages yen and foreign-currency denominated funds.
The division works to ensure that the bank’s funding capabilities are sufficient to meet its
contractual obligations. The Board of Directors and other bodies prepare monthly and semi-
annual plans for the investment and procurement of funds. The Treasury Planning Division
reports directly to top management on liquidity issues on a daily basis.
Market Liquidity Risk Management
The Risk Management Division analyzes trading positions relative to market scale, and reports
daily to top management on market liquidity risks. Close attention is paid so that trading
positions may not become excessive.
Operational Risk Management
Besides conventional credit, market and liquidity risks, the bank is also required to control
“operational risk,” defined as “the risk of direct or indirect losses that may result from
inadequate or failed internal processes, people or systems or from external events.”
The bank is continually refining its operational risk management systems and processes.
Administrative Risk Management
Administrative risk is defined as potential losses that may arise from the failure of directors and
employees to handle clerical work accurately as well as from accidents or irregularities by them.
In Aozora Bank, Administrative Risk Management Policy was approved by its Board of Directors.
At the same time, the Operations Planning Division, independent of business divisions and
branches controls administrative risks.
The Operations Planning Division formulate clerical procedures and manuals tailored to
each business operation. These clerical procedures are mandatory for all directors and
employees to observe. The Operations Planning Division aims to enhance the reliability of
clerical procedures by providing guidance on specific processes, holding training sessions and
responding to inquiries regarding clerical procedures. And, the bank aims to establish a
framework of clerical work processes where it can minimize human errors as much as possible
by continuously reviewing and implementing automation and systematization of more
processes and centralization of clerical procedures.
We will continue to explore ways to quantify clerical risks so as to refine our risk management
system still further.
Systems Risk Management
Systems risk is defined as potential losses resulting from the failure of computer systems due to
internal and external factors including shutdown, malfunction, inappropriate use of computer
systems and computer viruses. With the advance in networking and diversification of bank
operations, the social consequences of systems failures are becoming increasingly serious.
At Aozora Bank, we believe that the entire bank must make a concerted effort to control
systems risk. To this end, the Board of Directors has approved the Systems Risk Management
Policy. The Systems Planning Division is making every effort to protect systems from natural
disasters and other contingencies to ensure their stable operation. Indeed, the bank has taken
various steps to protect computer systems from a wide range of natural disasters and criminal
29
activities and to protect sensitive information. The bank’s computer center has an earthquake-
resistant structure with vibration-resistant floors, dual communications cables, a back-up power
generator and strict access controls.
Systems development (Systems Planning Division) and systems operation (Computer
Operation Division) are clearly separated to ensure adequate checks and balances between the
two divisions. The bank regularly conducts internal inspections of systems-related planning,
development, maintenance and operation to ensure strict management of the computer systems.
Legal Risk Management
Legal risk is defined as potential losses resulting from lawsuits filed against the bank by
customers or other third parties for damage indemnification as well as other legal conflicts that
could arise in the course of various banking operations. Legal risk also includes a situation
where unforeseeable losses that arise from not illegal, yet inappropriate activities resulting in a
breach of trust between the bank and its customers, as well as inappropriate contracts that
require the bank to assume obligations that would be dispensable in the normal situation.
At Aozora Bank, the Compliance Management Division supervises legal affairs and
compliance, to prevent a possible occurrence of unforeseeable losses. At the same time, this
division checks critical documents such as major contracts and confirms that all operations
comply with relevant laws and other regulations to ensure that all operations are being
conducted properly.
Settlement Risk Management
Settlement risk management refers to potential losses arising from the failure to finalize
settlements as planned. Settlement risk encompasses a wide range of risks, such as credit,
market and liquidity risks.
A prime settlement risk is caused by timing differences that arise between payment and
receipt of funds. This type of risk is not limited to foreign exchange transactions, which arises
from the timing of settlements across international time zones, but also occurs within domestic
transactions in a variety of contexts.
The bank is proactively taking steps to reduce settlement risks. We have set limits on
settlement volumes for foreign exchange transactions by each customer. At the same time, the
bank has adopted a policy of reducing settlement volumes by using netting techniques and is
working to shorten time intervals between payment and receipt of funds.
In participating in various settlement systems, the bank has utilized various risk reduction
measures such as collateral-pledging, loss-sharing, etc. after a thorough understanding of the
relevant rules of such settlement systems. And in addition to these risk-reduction measures,
ever since the introduction of Real-Time Gross Settlement (RTGS) under the Bank of Japan
Financial Network System in January 2001, the bank has been controlling settlement risks by
monitoring actual settlement situations real time.
Internal Inspection and Audit
At Aozora Bank, the Inspection Division, an autonomous body, assesses whether the bank’s risk
management systems are functioning effectively. In this way, the bank maintains an
appropriate system of checks and balances to secure sound, suitable banking operations.
New Financial Products and New Businesses
As a rule, the Executive Committee authorizes all new products and new business initiatives,
after thorough deliberations from compliance and risk management perspectives.
30
The bank has established internal systems and regulations that ensure due compliance with all
legal requirements and the conduct of all operations with perfect integrity. The bank works to
foster a corporate culture that places priority on these goals.
Master Policy on Compliance
The bank has instituted the “Master Policy on Compliance,” which sets forth internal systems
and basic principles needed to maintain compliance with all legal requirements for all banking
operations. In addition, the “Compliance Program,” which is updated every business year,
specifies action guidelines and compliance standards. All directors and employees are required
to have a thorough understanding of the contents of these documents.
Organization and System
Primary responsibility for supervising compliance throughout the bank rests with the
Compliance Management Division, which conducts compliance checks based on the relevant
laws. The division provides internal legal consultations, making a review and a legal check of
contracts, and formulates and monitors the internal regulations.
Compliance leaders have been appointed at all divisions and branches. Their duties include
consulting activities, as well as compliance audits and steps to promote awareness of
compliance-related issues. In December 2000, the bank appointed Compliance Officer
completely independent of the divisions and branches he/she oversees. Compliance Officers
directly monitor compliance procedures and systems at business divisions.
Compliance Training and Promotion of Awareness
Training sessions for compliance leaders are conducted annually, in order to ensure a thorough
understanding of key compliance issues and promote awareness of the importance of legal
compliance. After completing this session, compliance leaders then train staff at their respective
divisions and branches. In this way, all directors and employees throughout the bank are
thoroughly trained and updated in the current compliance issues.
Training sessions for new employees and newly appointed section managers, as well as for
all of the bank’s operations, also include compliance related themes. In March 2001, external
specialists were invited to provide compliance training sessions for the bank’s directors who
themselves are currently committed to the issue of compliance in a proactive way.
On the occasion of enactment or amendment of the relevant regulations, the bank
identifies key compliance issues as “Current Key Compliance Issues.” And centering around
compliance leaders, bank employees discuss these current key compliance issues in their
respective divisions, and branches to check whether these current key compliance issues are
suitably addressed and observed.
C O M P L I A N C E S Y S T E M
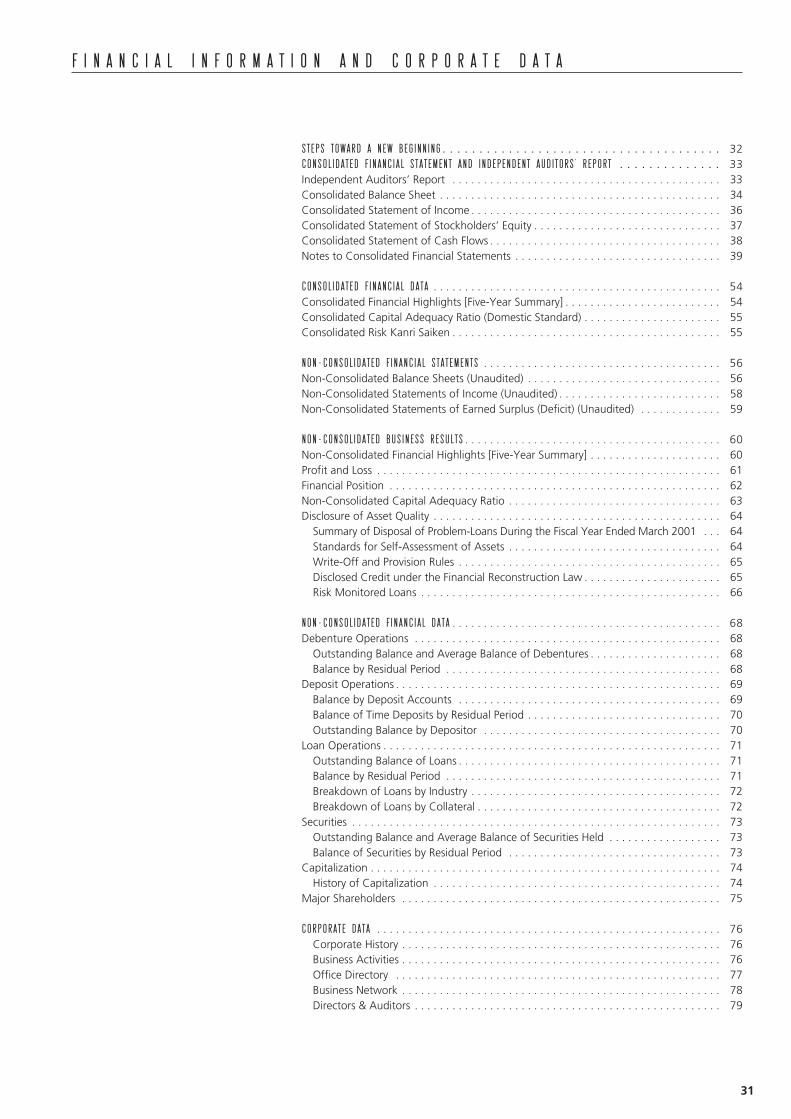
31
STEPS TOWARD A NEW BEGINNING . . . . . . . . . . . . . . . . . . . . . . . . . . . . . . . . . . . . . . 32CONSOLIDATED FINANCIAL STATEMENT AND INDEPENDENT AUDITORS’ REPORT . . . . . . . . . . . . . . 33Independent Auditors’ Report . . . . . . . . . . . . . . . . . . . . . . . . . . . . . . . . . . . . . . . . . . . 33Consolidated Balance Sheet . . . . . . . . . . . . . . . . . . . . . . . . . . . . . . . . . . . . . . . . . . . . . 34Consolidated Statement of Income . . . . . . . . . . . . . . . . . . . . . . . . . . . . . . . . . . . . . . . . 36Consolidated Statement of Stockholders’ Equity . . . . . . . . . . . . . . . . . . . . . . . . . . . . . . 37Consolidated Statement of Cash Flows . . . . . . . . . . . . . . . . . . . . . . . . . . . . . . . . . . . . . 38Notes to Consolidated Financial Statements . . . . . . . . . . . . . . . . . . . . . . . . . . . . . . . . . 39
CONSOLIDATED FINANCIAL DATA . . . . . . . . . . . . . . . . . . . . . . . . . . . . . . . . . . . . . . . . . . . . . . 54Consolidated Financial Highlights [Five-Year Summary] . . . . . . . . . . . . . . . . . . . . . . . . . 54Consolidated Capital Adequacy Ratio (Domestic Standard) . . . . . . . . . . . . . . . . . . . . . . 55Consolidated Risk Kanri Saiken . . . . . . . . . . . . . . . . . . . . . . . . . . . . . . . . . . . . . . . . . . . 55
NON-CONSOLIDATED FINANCIAL STATEMENTS . . . . . . . . . . . . . . . . . . . . . . . . . . . . . . . . . . . . . . 56Non-Consolidated Balance Sheets (Unaudited) . . . . . . . . . . . . . . . . . . . . . . . . . . . . . . . 56Non-Consolidated Statements of Income (Unaudited) . . . . . . . . . . . . . . . . . . . . . . . . . . 58Non-Consolidated Statements of Earned Surplus (Deficit) (Unaudited) . . . . . . . . . . . . . 59
NON-CONSOLIDATED BUSINESS RESULTS . . . . . . . . . . . . . . . . . . . . . . . . . . . . . . . . . . . . . . . . . 60Non-Consolidated Financial Highlights [Five-Year Summary] . . . . . . . . . . . . . . . . . . . . . 60Profit and Loss . . . . . . . . . . . . . . . . . . . . . . . . . . . . . . . . . . . . . . . . . . . . . . . . . . . . . . . 61Financial Position . . . . . . . . . . . . . . . . . . . . . . . . . . . . . . . . . . . . . . . . . . . . . . . . . . . . . 62Non-Consolidated Capital Adequacy Ratio . . . . . . . . . . . . . . . . . . . . . . . . . . . . . . . . . . 63Disclosure of Asset Quality . . . . . . . . . . . . . . . . . . . . . . . . . . . . . . . . . . . . . . . . . . . . . . 64
Summary of Disposal of Problem-Loans During the Fiscal Year Ended March 2001 . . . 64Standards for Self-Assessment of Assets . . . . . . . . . . . . . . . . . . . . . . . . . . . . . . . . . . 64Write-Off and Provision Rules . . . . . . . . . . . . . . . . . . . . . . . . . . . . . . . . . . . . . . . . . . 65Disclosed Credit under the Financial Reconstruction Law . . . . . . . . . . . . . . . . . . . . . . 65Risk Monitored Loans . . . . . . . . . . . . . . . . . . . . . . . . . . . . . . . . . . . . . . . . . . . . . . . . 66
NON-CONSOLIDATED FINANCIAL DATA . . . . . . . . . . . . . . . . . . . . . . . . . . . . . . . . . . . . . . . . . . . 68Debenture Operations . . . . . . . . . . . . . . . . . . . . . . . . . . . . . . . . . . . . . . . . . . . . . . . . . 68
Outstanding Balance and Average Balance of Debentures . . . . . . . . . . . . . . . . . . . . . 68Balance by Residual Period . . . . . . . . . . . . . . . . . . . . . . . . . . . . . . . . . . . . . . . . . . . . 68
Deposit Operations . . . . . . . . . . . . . . . . . . . . . . . . . . . . . . . . . . . . . . . . . . . . . . . . . . . . 69Balance by Deposit Accounts . . . . . . . . . . . . . . . . . . . . . . . . . . . . . . . . . . . . . . . . . . 69Balance of Time Deposits by Residual Period . . . . . . . . . . . . . . . . . . . . . . . . . . . . . . . 70Outstanding Balance by Depositor . . . . . . . . . . . . . . . . . . . . . . . . . . . . . . . . . . . . . . 70
Loan Operations . . . . . . . . . . . . . . . . . . . . . . . . . . . . . . . . . . . . . . . . . . . . . . . . . . . . . . 71Outstanding Balance of Loans . . . . . . . . . . . . . . . . . . . . . . . . . . . . . . . . . . . . . . . . . . 71Balance by Residual Period . . . . . . . . . . . . . . . . . . . . . . . . . . . . . . . . . . . . . . . . . . . . 71Breakdown of Loans by Industry . . . . . . . . . . . . . . . . . . . . . . . . . . . . . . . . . . . . . . . . 72Breakdown of Loans by Collateral . . . . . . . . . . . . . . . . . . . . . . . . . . . . . . . . . . . . . . . 72
Securities . . . . . . . . . . . . . . . . . . . . . . . . . . . . . . . . . . . . . . . . . . . . . . . . . . . . . . . . . . . 73Outstanding Balance and Average Balance of Securities Held . . . . . . . . . . . . . . . . . . 73Balance of Securities by Residual Period . . . . . . . . . . . . . . . . . . . . . . . . . . . . . . . . . . 73
Capitalization . . . . . . . . . . . . . . . . . . . . . . . . . . . . . . . . . . . . . . . . . . . . . . . . . . . . . . . . 74History of Capitalization . . . . . . . . . . . . . . . . . . . . . . . . . . . . . . . . . . . . . . . . . . . . . . 74
Major Shareholders . . . . . . . . . . . . . . . . . . . . . . . . . . . . . . . . . . . . . . . . . . . . . . . . . . . 75
CORPORATE DATA . . . . . . . . . . . . . . . . . . . . . . . . . . . . . . . . . . . . . . . . . . . . . . . . . . . . . . . 76Corporate History . . . . . . . . . . . . . . . . . . . . . . . . . . . . . . . . . . . . . . . . . . . . . . . . . . . 76Business Activities . . . . . . . . . . . . . . . . . . . . . . . . . . . . . . . . . . . . . . . . . . . . . . . . . . . 76Office Directory . . . . . . . . . . . . . . . . . . . . . . . . . . . . . . . . . . . . . . . . . . . . . . . . . . . . 77Business Network . . . . . . . . . . . . . . . . . . . . . . . . . . . . . . . . . . . . . . . . . . . . . . . . . . . 78Directors & Auditors . . . . . . . . . . . . . . . . . . . . . . . . . . . . . . . . . . . . . . . . . . . . . . . . . 79
F I N A N C I A L I N F O R M A T I O N A N D C O R P O R A T E D A T A
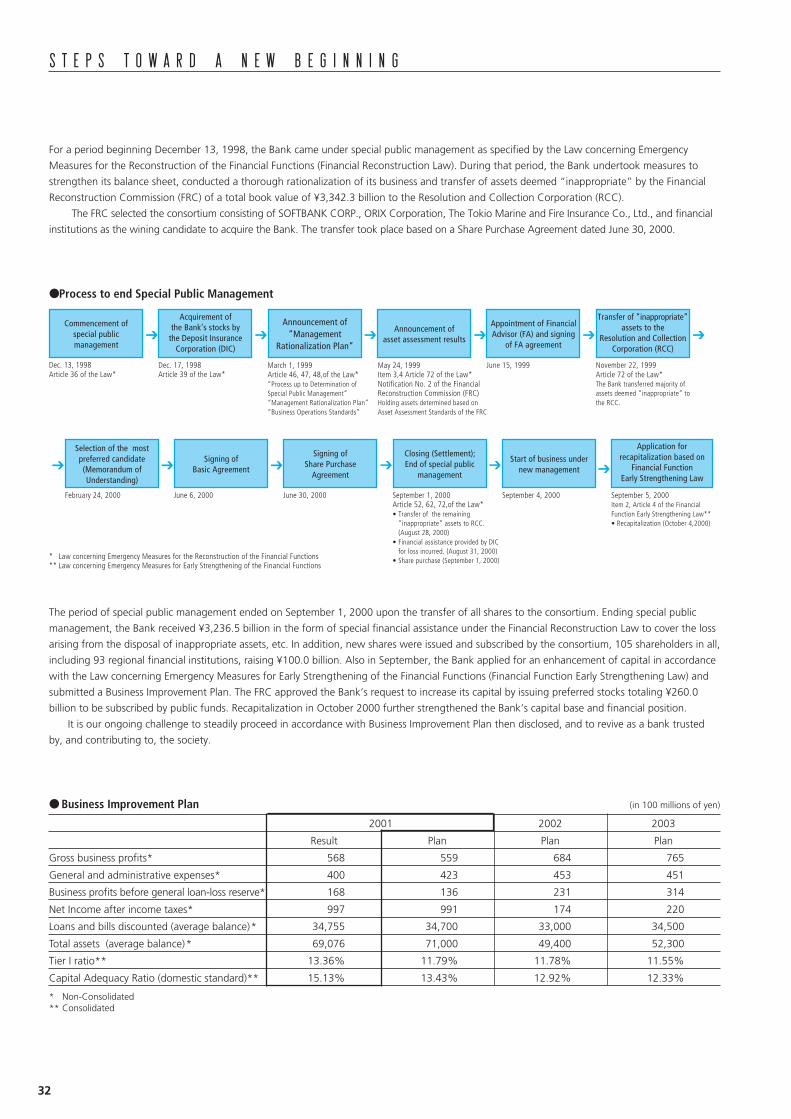
32
S T E P S T O W A R D A N E W B E G I N N I N G
For a period beginning December 13, 1998, the Bank came under special public management as specified by the Law concerning Emergency
Measures for the Reconstruction of the Financial Functions (Financial Reconstruction Law). During that period, the Bank undertook measures to
strengthen its balance sheet, conducted a thorough rationalization of its business and transfer of assets deemed “inappropriate” by the Financial
Reconstruction Commission (FRC) of a total book value of ¥3,342.3 billion to the Resolution and Collection Corporation (RCC).
The FRC selected the consortium consisting of SOFTBANK CORP., ORIX Corporation, The Tokio Marine and Fire Insurance Co., Ltd., and financial
institutions as the wining candidate to acquire the Bank. The transfer took place based on a Share Purchase Agreement dated June 30, 2000.
● Business Improvement Plan (in 100 millions of yen)
2001 2002 2003
Result Plan Plan Plan
Gross business profits* 568 559 684 765
General and administrative expenses* 400 423 453 451
Business profits before general loan-loss reserve* 168 136 231 314
Net Income after income taxes* 997 991 174 220
Loans and bills discounted (average balance)* 34,755 34,700 33,000 34,500
Total assets (average balance)* 69,076 71,000 49,400 52,300
Tier I ratio** 13.36% 11.79% 11.78% 11.55%
Capital Adequacy Ratio (domestic standard)** 15.13% 13.43% 12.92% 12.33%
* Non-Consolidated** Consolidated
The period of special public management ended on September 1, 2000 upon the transfer of all shares to the consortium. Ending special public
management, the Bank received ¥3,236.5 billion in the form of special financial assistance under the Financial Reconstruction Law to cover the loss
arising from the disposal of inappropriate assets, etc. In addition, new shares were issued and subscribed by the consortium, 105 shareholders in all,
including 93 regional financial institutions, raising ¥100.0 billion. Also in September, the Bank applied for an enhancement of capital in accordance
with the Law concerning Emergency Measures for Early Strengthening of the Financial Functions (Financial Function Early Strengthening Law) and
submitted a Business Improvement Plan. The FRC approved the Bank’s request to increase its capital by issuing preferred stocks totaling ¥260.0
billion to be subscribed by public funds. Recapitalization in October 2000 further strengthened the Bank’s capital base and financial position.
It is our ongoing challenge to steadily proceed in accordance with Business Improvement Plan then disclosed, and to revive as a bank trusted
by, and contributing to, the society.
Commencement ofspecial publicmanagement
● Process to end Special Public Management
Dec. 13, 1998Article 36 of the Law*
Dec. 17, 1998Article 39 of the Law*
March 1, 1999Article 46, 47, 48,of the Law*“Process up to Determination ofSpecial Public Management”“Management Rationalization Plan”“Business Operations Standards”
May 24, 1999Item 3,4 Article 72 of the Law*Notification No. 2 of the FinancialReconstruction Commission (FRC)Holding assets determined based onAsset Assessment Standards of the FRC
June 15, 1999
February 24, 2000 June 6, 2000 September 1, 2000Article 52, 62, 72,of the Law*• Transfer of the remaining
“inappropriate” assets to RCC.(August 28, 2000)
• Financial assistance provided by DICfor loss incurred. (August 31, 2000)
• Share purchase (September 1, 2000)* Law concerning Emergency Measures for the Reconstruction of the Financial Functions** Law concerning Emergency Measures for Early Strengthening of the Financial Functions
Acquirement ofthe Bank’s stocks by
the Deposit InsuranceCorporation (DIC)
Announcement of“Management
Rationalization Plan”
Announcement ofasset assessment results
Appointment of FinancialAdvisor (FA) and signing
of FA agreement
Selection of the mostpreferred candidate(Memorandum ofUnderstanding)
Signing ofBasic Agreement
Signing ofShare Purchase
Agreement
Closing (Settlement);End of special public
management
➔ ➔ ➔ ➔
June 30, 2000 September 5, 2000Item 2, Article 4 of the FinancialFunction Early Strengthening Law**• Recapitalization (October 4,2000)
Application forrecapitalization based on
Financial FunctionEarly Strengthening Law
➔ ➔ ➔ ➔ ➔
November 22, 1999Article 72 of the Law*The Bank transferred majority ofassets deemed “inappropriate” tothe RCC.
Transfer of “inappropriate”assets to the
Resolution and CollectionCorporation (RCC)
➔ ➔
September 4, 2000
Start of business undernew management ➔
33
C O N S O L I D A T E D F I N A N C I A L S T A T E M E N T A N DI N D E P E N D E N T A U D I T O R S ’ R E P O R T
Tohmatsu & Co.MS Shibaura Building13-23, Shibaura 4-chome,Minato-ku, Tokyo 108-8530, Japan
Tel: +81-3-3457-7321Fax: +81-3-3769-8508www.tohmatsu.co.jp
INDEPENDENT AUDITORS’ REPORT
To the Board of Directors and Stockholders ofAozora Bank, Ltd.:
We have examined the consolidated balance sheet of Aozora Bank, Ltd. (the “Bank,” formerly The NipponCredit Bank, Ltd.) and consolidated subsidiaries as of March 31, 2001, and the related consolidated
statements of income, stockholders’ equity, and cash flows for the year then ended, all expressed inJapanese yen. Our examination was made in accordance with auditing standards, procedures and practicesgenerally accepted and applied in Japan and, accordingly, included such tests of the accounting recordsand such other auditing procedures as we considered necessary in the circumstances.
In our opinion, the consolidated financial statements referred to above present fairly the financial positionof Aozora Bank, Ltd. and consolidated subsidiaries as of March 31, 2001, and the results of their opera-
tions and their cash flows for the year then ended in conformity with accounting principles and practicesgenerally accepted in Japan applied on a basis consistent with that of the preceding year.
As discussed in Note 2, effective April 1, 2000, the consolidated financial statements have been preparedin accordance with new accounting standards for employees’ retirement benefits and financial instrumentsand a revised accounting standard for foreign currency transactions.
Our examination also comprehended the translation of Japanese yen amounts into U.S. dollar amountsand, in our opinion, such translation has been made in conformity with the basis stated in Note 1. Such
U.S. dollar amounts are presented solely for the convenience of readers outside Japan.
June 22, 2001
Independent Auditors’ Report
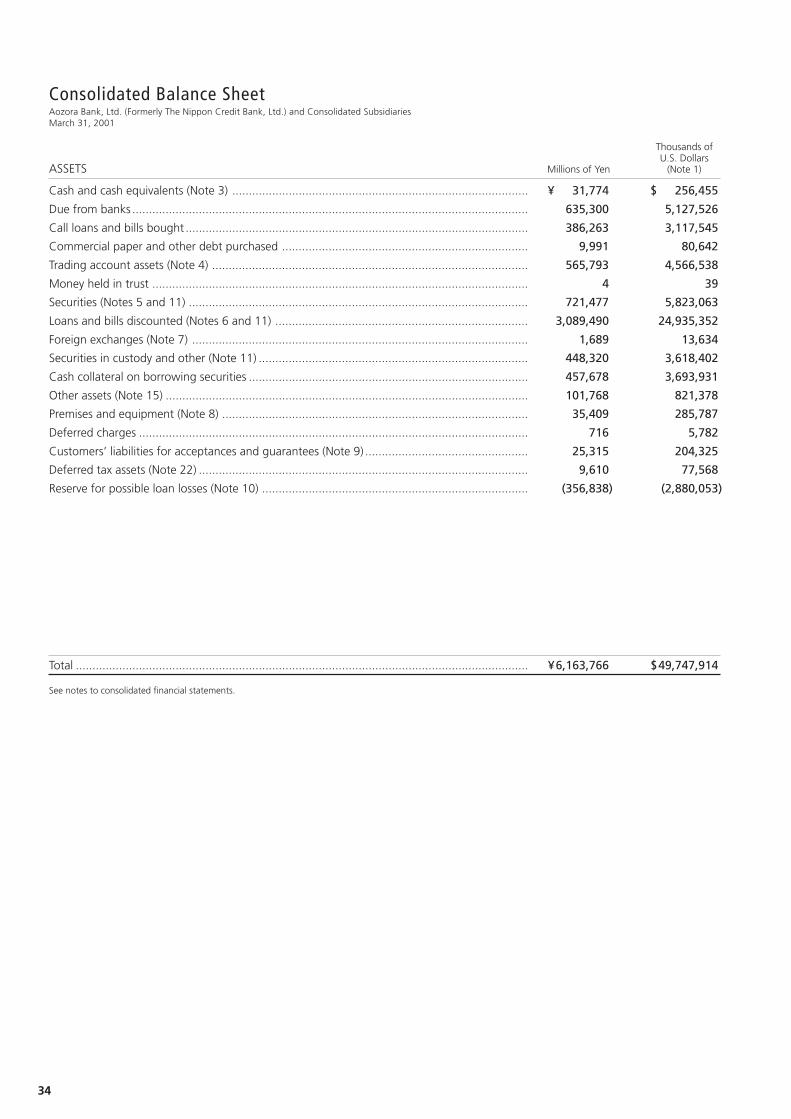
34
Consolidated Balance SheetAozora Bank, Ltd. (Formerly The Nippon Credit Bank, Ltd.) and Consolidated SubsidiariesMarch 31, 2001
Thousands ofU.S. Dollars
ASSETS Millions of Yen (Note 1)
Cash and cash equivalents (Note 3) ......................................................................................... ¥ 31,774 $ 256,455
Due from banks ....................................................................................................................... 635,300 5,127,526
Call loans and bills bought ....................................................................................................... 386,263 3,117,545
Commercial paper and other debt purchased .......................................................................... 9,991 80,642
Trading account assets (Note 4) ............................................................................................... 565,793 4,566,538
Money held in trust ................................................................................................................. 4 39
Securities (Notes 5 and 11) ...................................................................................................... 721,477 5,823,063
Loans and bills discounted (Notes 6 and 11) ............................................................................ 3,089,490 24,935,352
Foreign exchanges (Note 7) ..................................................................................................... 1,689 13,634
Securities in custody and other (Note 11) ................................................................................. 448,320 3,618,402
Cash collateral on borrowing securities .................................................................................... 457,678 3,693,931
Other assets (Note 15) ............................................................................................................. 101,768 821,378
Premises and equipment (Note 8) ............................................................................................ 35,409 285,787
Deferred charges ..................................................................................................................... 716 5,782
Customers’ liabilities for acceptances and guarantees (Note 9) ................................................. 25,315 204,325
Deferred tax assets (Note 22) ................................................................................................... 9,610 77,568
Reserve for possible loan losses (Note 10) ................................................................................ (356,838) (2,880,053)
Total ........................................................................................................................................ ¥6,163,766 $49,747,914
See notes to consolidated financial statements.
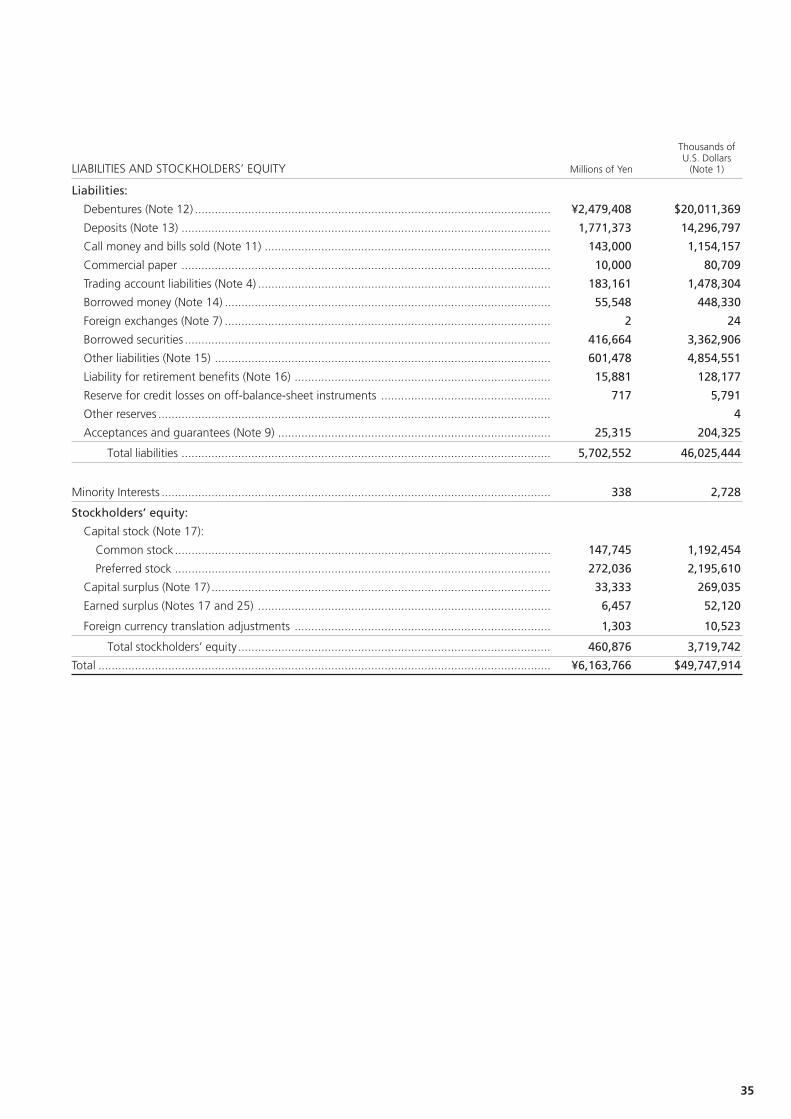
35
Thousands ofU.S. Dollars
LIABILITIES AND STOCKHOLDERS’ EQUITY Millions of Yen (Note 1)
Liabilities:
Debentures (Note 12) ........................................................................................................... ¥2,479,408 $20,011,369
Deposits (Note 13) ............................................................................................................... 1,771,373 14,296,797
Call money and bills sold (Note 11) ...................................................................................... 143,000 1,154,157
Commercial paper ............................................................................................................... 10,000 80,709
Trading account liabilities (Note 4) ........................................................................................ 183,161 1,478,304
Borrowed money (Note 14) .................................................................................................. 55,548 448,330
Foreign exchanges (Note 7) .................................................................................................. 2 24
Borrowed securities .............................................................................................................. 416,664 3,362,906
Other liabilities (Note 15) ..................................................................................................... 601,478 4,854,551
Liability for retirement benefits (Note 16) ............................................................................. 15,881 128,177
Reserve for credit losses on off-balance-sheet instruments ................................................... 717 5,791
Other reserves ...................................................................................................................... 4
Acceptances and guarantees (Note 9) .................................................................................. 25,315 204,325
Total liabilities ............................................................................................................... 5,702,552 46,025,444
Minority Interests ..................................................................................................................... 338 2,728
Stockholders’ equity:
Capital stock (Note 17):
Common stock................................................................................................................. 147,745 1,192,454
Preferred stock ................................................................................................................. 272,036 2,195,610
Capital surplus (Note 17) ...................................................................................................... 33,333 269,035
Earned surplus (Notes 17 and 25) ........................................................................................ 6,457 52,120
Foreign currency translation adjustments ............................................................................. 1,303 10,523
Total stockholders’ equity .............................................................................................. 460,876 3,719,742
Total ........................................................................................................................................ ¥6,163,766 $49,747,914
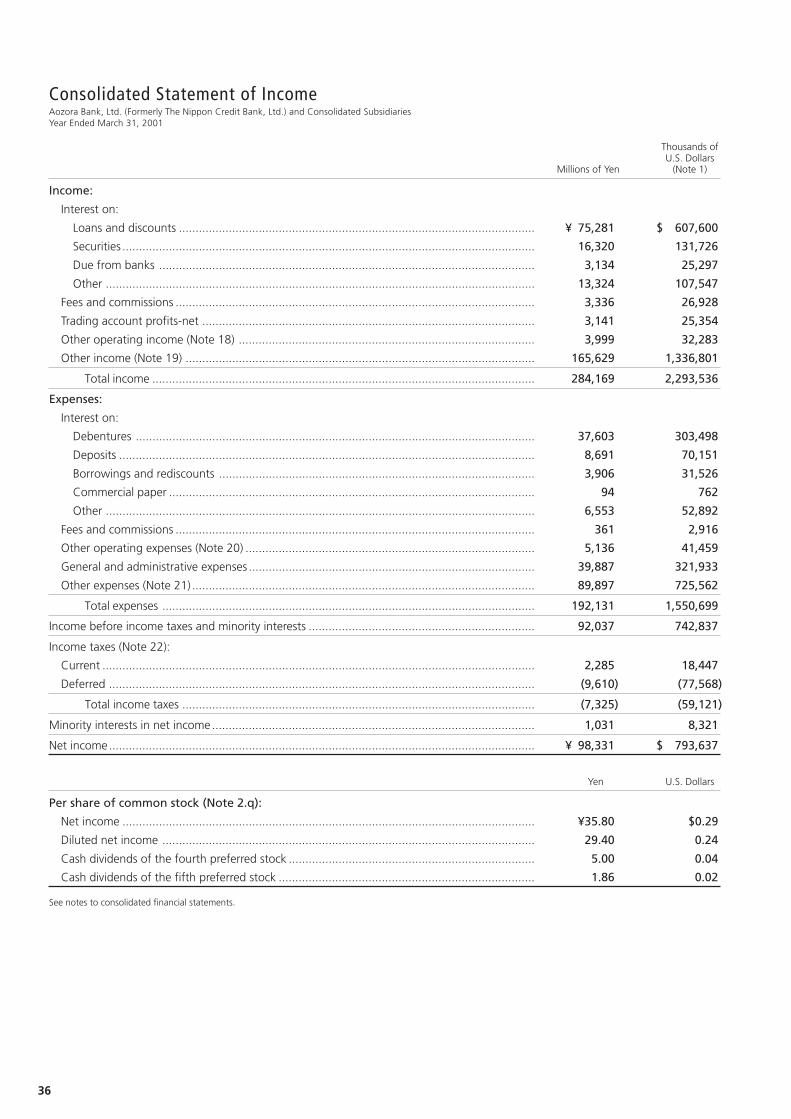
36
Consolidated Statement of IncomeAozora Bank, Ltd. (Formerly The Nippon Credit Bank, Ltd.) and Consolidated SubsidiariesYear Ended March 31, 2001
Thousands ofU.S. Dollars
Millions of Yen (Note 1)
Income:
Interest on:
Loans and discounts ........................................................................................................... ¥ 75,281 $ 607,600
Securities ............................................................................................................................ 16,320 131,726
Due from banks ................................................................................................................. 3,134 25,297
Other ................................................................................................................................. 13,324 107,547
Fees and commissions ............................................................................................................ 3,336 26,928
Trading account profits-net .................................................................................................... 3,141 25,354
Other operating income (Note 18) ......................................................................................... 3,999 32,283
Other income (Note 19) ......................................................................................................... 165,629 1,336,801
Total income ................................................................................................................... 284,169 2,293,536
Expenses:
Interest on:
Debentures ........................................................................................................................ 37,603 303,498
Deposits ............................................................................................................................. 8,691 70,151
Borrowings and rediscounts ............................................................................................... 3,906 31,526
Commercial paper .............................................................................................................. 94 762
Other ................................................................................................................................. 6,553 52,892
Fees and commissions ............................................................................................................ 361 2,916
Other operating expenses (Note 20) ....................................................................................... 5,136 41,459
General and administrative expenses ...................................................................................... 39,887 321,933
Other expenses (Note 21) ....................................................................................................... 89,897 725,562
Total expenses ................................................................................................................ 192,131 1,550,699
Income before income taxes and minority interests .................................................................... 92,037 742,837
Income taxes (Note 22):
Current .................................................................................................................................. 2,285 18,447
Deferred ................................................................................................................................ (9,610) (77,568)
Total income taxes .......................................................................................................... (7,325) (59,121)
Minority interests in net income ................................................................................................. 1,031 8,321
Net income................................................................................................................................ ¥ 98,331 $ 793,637
Yen U.S. Dollars
Per share of common stock (Note 2.q):
Net income ............................................................................................................................ ¥35.80 $0.29
Diluted net income ................................................................................................................ 29.40 0.24
Cash dividends of the fourth preferred stock .......................................................................... 5.00 0.04
Cash dividends of the fifth preferred stock ............................................................................. 1.86 0.02
See notes to consolidated financial statements.
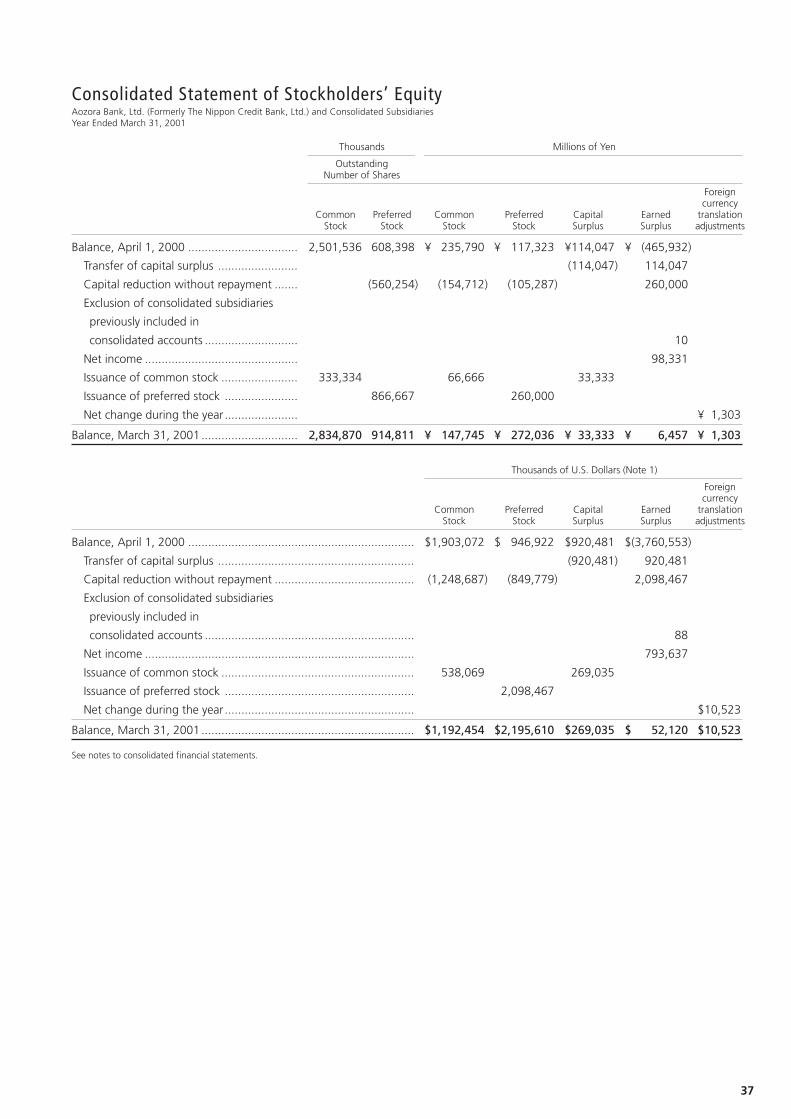
37
Consolidated Statement of Stockholders’ EquityAozora Bank, Ltd. (Formerly The Nippon Credit Bank, Ltd.) and Consolidated SubsidiariesYear Ended March 31, 2001
Thousands Millions of Yen
OutstandingNumber of Shares
Foreigncurrency
Common Preferred Common Preferred Capital Earned translationStock Stock Stock Stock Surplus Surplus adjustments
Balance, April 1, 2000 ................................. 2,501,536 608,398 ¥ 235,790 ¥ 117,323 ¥114,047 ¥ (465,932)
Transfer of capital surplus ........................ (114,047) 114,047
Capital reduction without repayment ....... (560,254) (154,712) (105,287) 260,000
Exclusion of consolidated subsidiaries
previously included in
consolidated accounts ............................ 10
Net income .............................................. 98,331
Issuance of common stock ....................... 333,334 66,666 33,333
Issuance of preferred stock ...................... 866,667 260,000
Net change during the year ...................... ¥ 1,303
Balance, March 31, 2001 ............................. 2,834,870 914,811 ¥ 147,745 ¥ 272,036 ¥ 33,333 ¥ 6,457 ¥ 1,303
Thousands of U.S. Dollars (Note 1)
Foreigncurrency
Common Preferred Capital Earned translationStock Stock Surplus Surplus adjustments
Balance, April 1, 2000 .................................................................... $1,903,072 $ 946,922 $920,481 $(3,760,553)
Transfer of capital surplus ........................................................... (920,481) 920,481
Capital reduction without repayment .......................................... (1,248,687) (849,779) 2,098,467
Exclusion of consolidated subsidiaries
previously included in
consolidated accounts ............................................................... 88
Net income ................................................................................. 793,637
Issuance of common stock .......................................................... 538,069 269,035
Issuance of preferred stock ......................................................... 2,098,467
Net change during the year ......................................................... $10,523
Balance, March 31, 2001 ................................................................ $1,192,454 $2,195,610 $269,035 $ 52,120 $10,523
See notes to consolidated financial statements.
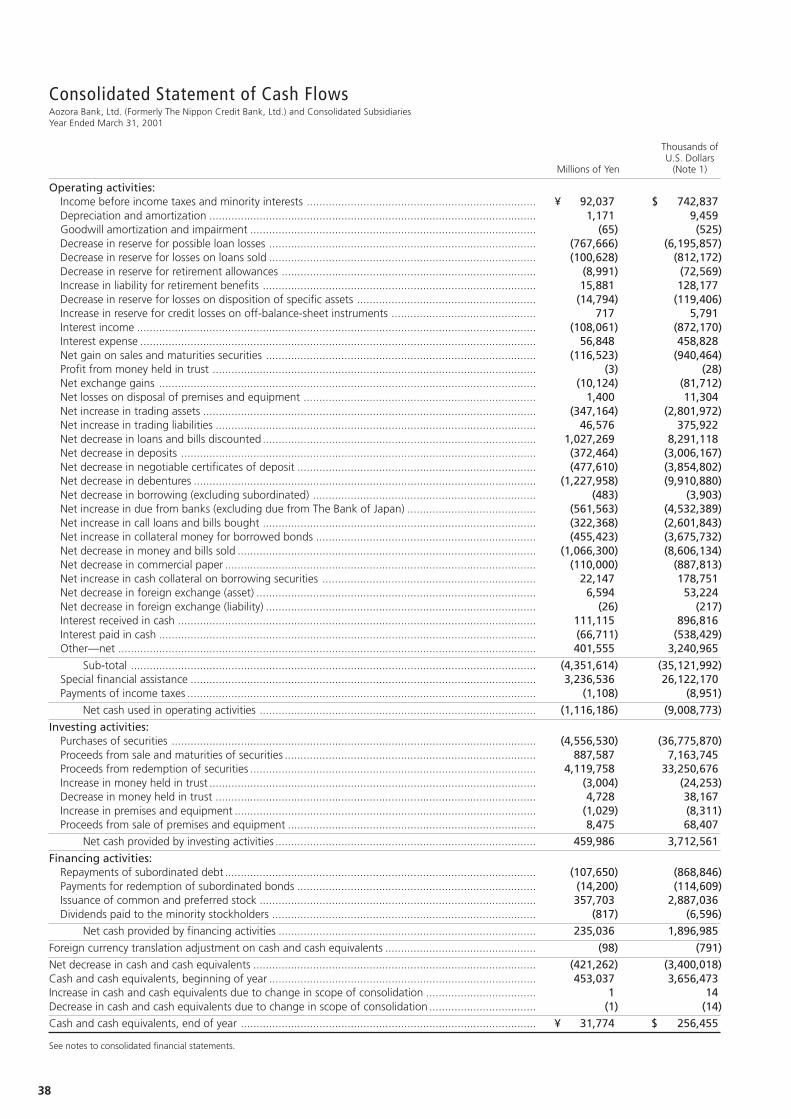
38
Consolidated Statement of Cash FlowsAozora Bank, Ltd. (Formerly The Nippon Credit Bank, Ltd.) and Consolidated SubsidiariesYear Ended March 31, 2001
Thousands ofU.S. Dollars
Millions of Yen (Note 1)
Operating activities:Income before income taxes and minority interests ......................................................................... ¥ 92,037 $ 742,837Depreciation and amortization ........................................................................................................ 1,171 9,459Goodwill amortization and impairment ........................................................................................... (65) (525)Decrease in reserve for possible loan losses ..................................................................................... (767,666) (6,195,857)Decrease in reserve for losses on loans sold ..................................................................................... (100,628) (812,172)Decrease in reserve for retirement allowances ................................................................................. (8,991) (72,569)Increase in liability for retirement benefits ....................................................................................... 15,881 128,177Decrease in reserve for losses on disposition of specific assets ......................................................... (14,794) (119,406)Increase in reserve for credit losses on off-balance-sheet instruments .............................................. 717 5,791Interest income ............................................................................................................................... (108,061) (872,170)Interest expense .............................................................................................................................. 56,848 458,828Net gain on sales and maturities securities ...................................................................................... (116,523) (940,464)Profit from money held in trust ....................................................................................................... (3) (28)Net exchange gains ........................................................................................................................ (10,124) (81,712)Net losses on disposal of premises and equipment .......................................................................... 1,400 11,304Net increase in trading assets .......................................................................................................... (347,164) (2,801,972)Net increase in trading liabilities ...................................................................................................... 46,576 375,922Net decrease in loans and bills discounted ....................................................................................... 1,027,269 8,291,118Net decrease in deposits ................................................................................................................. (372,464) (3,006,167)Net decrease in negotiable certificates of deposit ............................................................................ (477,610) (3,854,802)Net decrease in debentures ............................................................................................................. (1,227,958) (9,910,880)Net decrease in borrowing (excluding subordinated) ....................................................................... (483) (3,903)Net increase in due from banks (excluding due from The Bank of Japan) ......................................... (561,563) (4,532,389)Net increase in call loans and bills bought ....................................................................................... (322,368) (2,601,843)Net increase in collateral money for borrowed bonds ...................................................................... (455,423) (3,675,732)Net decrease in money and bills sold ............................................................................................... (1,066,300) (8,606,134)Net decrease in commercial paper ................................................................................................... (110,000) (887,813)Net increase in cash collateral on borrowing securities .................................................................... 22,147 178,751Net decrease in foreign exchange (asset) ......................................................................................... 6,594 53,224Net decrease in foreign exchange (liability) ...................................................................................... (26) (217)Interest received in cash .................................................................................................................. 111,115 896,816Interest paid in cash ........................................................................................................................ (66,711) (538,429)Other—net ..................................................................................................................................... 401,555 3,240,965
Sub-total ................................................................................................................................. (4,351,614) (35,121,992)Special financial assistance .............................................................................................................. 3,236,536 26,122,170Payments of income taxes ............................................................................................................... (1,108) (8,951)
Net cash used in operating activities ........................................................................................ (1,116,186) (9,008,773)
Investing activities:Purchases of securities .................................................................................................................... (4,556,530) (36,775,870)Proceeds from sale and maturities of securities ................................................................................ 887,587 7,163,745Proceeds from redemption of securities ........................................................................................... 4,119,758 33,250,676Increase in money held in trust ........................................................................................................ (3,004) (24,253)Decrease in money held in trust ...................................................................................................... 4,728 38,167Increase in premises and equipment ................................................................................................ (1,029) (8,311)Proceeds from sale of premises and equipment ............................................................................... 8,475 68,407
Net cash provided by investing activities ................................................................................... 459,986 3,712,561
Financing activities:Repayments of subordinated debt ................................................................................................... (107,650) (868,846)Payments for redemption of subordinated bonds ............................................................................ (14,200) (114,609)Issuance of common and preferred stock ........................................................................................ 357,703 2,887,036Dividends paid to the minority stockholders .................................................................................... (817) (6,596)
Net cash provided by financing activities .................................................................................. 235,036 1,896,985
Foreign currency translation adjustment on cash and cash equivalents ................................................ (98) (791)
Net decrease in cash and cash equivalents .......................................................................................... (421,262) (3,400,018)Cash and cash equivalents, beginning of year ..................................................................................... 453,037 3,656,473Increase in cash and cash equivalents due to change in scope of consolidation ................................... 1 14Decrease in cash and cash equivalents due to change in scope of consolidation .................................. (1) (14)
Cash and cash equivalents, end of year .............................................................................................. ¥ 31,774 $ 256,455
See notes to consolidated financial statements.
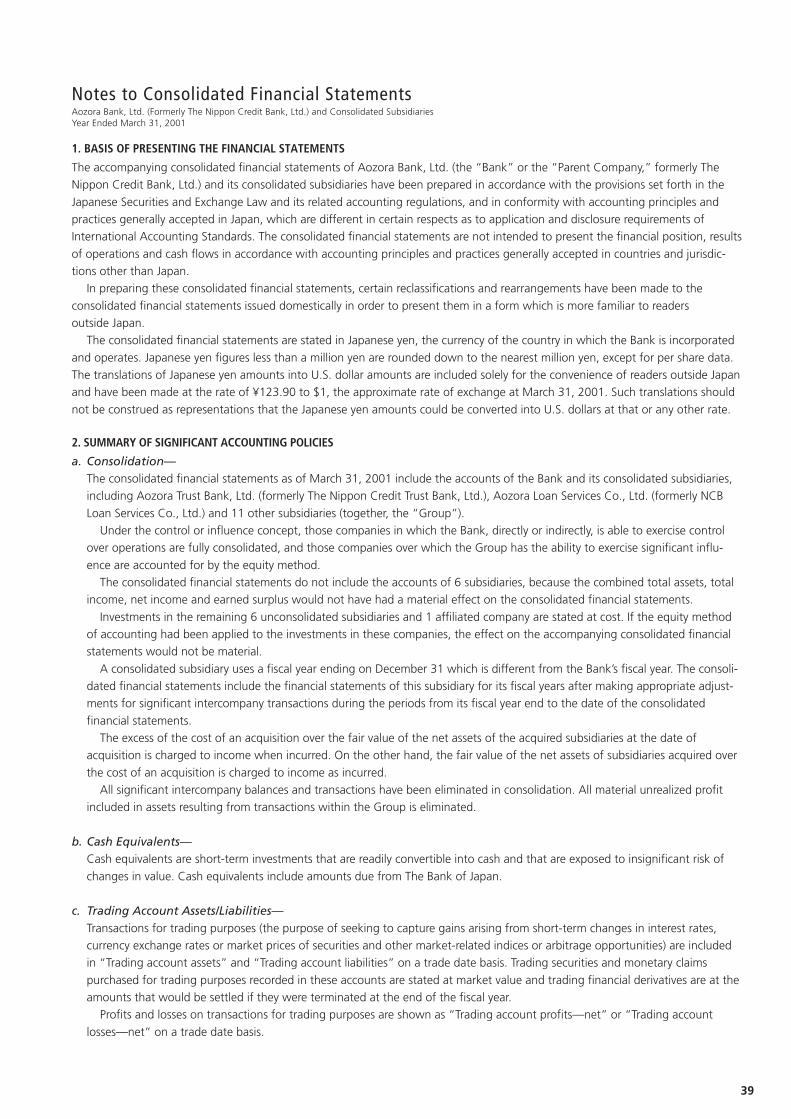
39
Notes to Consolidated Financial StatementsAozora Bank, Ltd. (Formerly The Nippon Credit Bank, Ltd.) and Consolidated SubsidiariesYear Ended March 31, 2001
1. BASIS OF PRESENTING THE FINANCIAL STATEMENTS
The accompanying consolidated financial statements of Aozora Bank, Ltd. (the “Bank” or the “Parent Company,” formerly TheNippon Credit Bank, Ltd.) and its consolidated subsidiaries have been prepared in accordance with the provisions set forth in the
Japanese Securities and Exchange Law and its related accounting regulations, and in conformity with accounting principles andpractices generally accepted in Japan, which are different in certain respects as to application and disclosure requirements ofInternational Accounting Standards. The consolidated financial statements are not intended to present the financial position, results
of operations and cash flows in accordance with accounting principles and practices generally accepted in countries and jurisdic-tions other than Japan.
In preparing these consolidated financial statements, certain reclassifications and rearrangements have been made to the
consolidated financial statements issued domestically in order to present them in a form which is more familiar to readersoutside Japan.
The consolidated financial statements are stated in Japanese yen, the currency of the country in which the Bank is incorporated
and operates. Japanese yen figures less than a million yen are rounded down to the nearest million yen, except for per share data.The translations of Japanese yen amounts into U.S. dollar amounts are included solely for the convenience of readers outside Japanand have been made at the rate of ¥123.90 to $1, the approximate rate of exchange at March 31, 2001. Such translations should
not be construed as representations that the Japanese yen amounts could be converted into U.S. dollars at that or any other rate.
2. SUMMARY OF SIGNIFICANT ACCOUNTING POLICIES
a. Consolidation—The consolidated financial statements as of March 31, 2001 include the accounts of the Bank and its consolidated subsidiaries,including Aozora Trust Bank, Ltd. (formerly The Nippon Credit Trust Bank, Ltd.), Aozora Loan Services Co., Ltd. (formerly NCB
Loan Services Co., Ltd.) and 11 other subsidiaries (together, the “Group”).Under the control or influence concept, those companies in which the Bank, directly or indirectly, is able to exercise control
over operations are fully consolidated, and those companies over which the Group has the ability to exercise significant influ-
ence are accounted for by the equity method.The consolidated financial statements do not include the accounts of 6 subsidiaries, because the combined total assets, total
income, net income and earned surplus would not have had a material effect on the consolidated financial statements.
Investments in the remaining 6 unconsolidated subsidiaries and 1 affiliated company are stated at cost. If the equity methodof accounting had been applied to the investments in these companies, the effect on the accompanying consolidated financialstatements would not be material.
A consolidated subsidiary uses a fiscal year ending on December 31 which is different from the Bank’s fiscal year. The consoli-dated financial statements include the financial statements of this subsidiary for its fiscal years after making appropriate adjust-ments for significant intercompany transactions during the periods from its fiscal year end to the date of the consolidated
financial statements.The excess of the cost of an acquisition over the fair value of the net assets of the acquired subsidiaries at the date of
acquisition is charged to income when incurred. On the other hand, the fair value of the net assets of subsidiaries acquired over
the cost of an acquisition is charged to income as incurred.All significant intercompany balances and transactions have been eliminated in consolidation. All material unrealized profit
included in assets resulting from transactions within the Group is eliminated.
b. Cash Equivalents—Cash equivalents are short-term investments that are readily convertible into cash and that are exposed to insignificant risk of
changes in value. Cash equivalents include amounts due from The Bank of Japan.
c. Trading Account Assets/Liabilities—Transactions for trading purposes (the purpose of seeking to capture gains arising from short-term changes in interest rates,currency exchange rates or market prices of securities and other market-related indices or arbitrage opportunities) are includedin “Trading account assets” and “Trading account liabilities” on a trade date basis. Trading securities and monetary claims
purchased for trading purposes recorded in these accounts are stated at market value and trading financial derivatives are at theamounts that would be settled if they were terminated at the end of the fiscal year.
Profits and losses on transactions for trading purposes are shown as “Trading account profits—net” or “Trading account
losses—net” on a trade date basis.
40
d. Securities—Effective April 1, 2000, the Group adopted a new accounting standard for financial instruments, including securities.
The standard requires all applicable securities to be classified and accounted for, depending on management’s intent, as
follows: (1) trading securities which are held for the purpose of earning capital gains in the near term are stated at market value,and the related unrealized gains and losses are included in earnings, (2) held-to-maturity debt securities which are expected tobe held to maturity with the positive intent and ability to hold to maturity are stated at amortized cost, and (3) available-for-sale
securities which are not classified as either of the aforementioned securities are reported at average cost or amortized cost aspermitted by transitional accounting, although available-for-sale securities shall be stated at market value for the year endingMarch 31, 2002 in accordance with the new accounting standard.
Securities included in monies held in trust on behalf of the Bank are stated at market value, and the related unrealized gainsand losses are included in earnings.
The effect of adopting the new standard was to decrease income before income taxes and minority interests by ¥977 million
($7,889 thousand).
e. Derivatives and Hedging Activities—Derivatives for purposes other than trading are stated at market value.
The Bank has adopted so-called “macro hedging,” a strategy to employ derivative transactions and control interest rate risksarising from financial assets and liabilities, such as loans, debentures and deposits, etc. within a set range, with aims to reduce
risk as a whole. This strategy is a risk management method of the risk adjustment approach prescribed in “Temporary Treatmentfor Accounting and Auditing of Application of Accounting Standard for Financial Instruments in Banking Industry” (IndustryAudit Committee Report No. 15 of the Japanese Institute of Certified Public Accountants). The Bank adopts this risk adjustment
approach as the temporary accounting prescribed in the above Industry Audit Committee Report No. 15 of the JapaneseInstitute of Certified Public Accountants.
f. Premises and Equipment—Premises and equipment are stated at cost. Depreciation of premises and equipment of the Bank and its consolidated domesticsubsidiaries is computed by the declining-balance method at rates based on the estimated useful lives of the assets, while the
straight-line method is applied to buildings. The range of useful lives is principally 50 years for buildings and from 3 to 15 yearsfor other premises and equipment.
g. Software—The purchased software costs are depreciated over the estimated useful lives of the software (principally 5 years).
h. Deferred Charges—The Bank’s deferred charges are amortized as follows.
Discounts on discount debentures are amortized by the straight-line method over the terms of the debentures. Debenture
issuance expenses are amortized by the straight-line method over the shorter of the terms of the debentures or the 3-year periodstipulated in the Commercial Code of Japan (the ”Code“).
Stock issuance costs are charged to income as incurred.
Subsidiaries’ deferred charges on issuance of debentures are amortized by the straight-line method over 5 years.
i. Write-off of Loans and Reserve for Possible Loan Losses—Write-off of loans and reserve for possible loan losses of the Bank are accounted for as follows in accordance with internal write-off and reserve standards.
Loans to borrowers under legal proceedings, such as bankruptcy, and loans in similar conditions, are written off by the
amount of loans exceeding the estimated realizable value of collateral and guarantees. The amount written off in the currentfiscal year amounted to ¥126,396 million ($1,020,153 thousand).
For loans to borrowers not yet bankrupt but likely to fall into bankruptcy, the necessary specific reserve amounts are provided
for through an overall assessment of the borrowers’ ability to pay, after subtracting from the loan balance the amount collectibleon disposal of collateral or execution of guarantees. As to other loans, the Bank provides for a general reserve by applying thehistorical loan-loss ratio determined over a certain period.
41
The Bank has also taken into account the precondition of exercise of the cancellation right in determining the necessaryreserve amount. Under the clause of “Warranty of Loan Related Assets” described in the Share Purchase Agreement (see Note17), a precondition of exercise of the cancellation right is the existence of a defect and a 20% deterioration of assets in value.
All loans are subject to asset quality assessment conducted by the business-related divisions in accordance with the Self-Assessment Standards, and the results of the assessments are reviewed by the Asset Audit Division, which is independent frombusiness-related divisions, before the reserve amount is finally determined.
As to general loans, consolidated subsidiaries provide for a necessary reserve by applying the historical loan-loss ratio. Fordoubtful loans, consolidated subsidiaries provide a specific reserve in the amount deemed irrecoverable based on the individualloan’s assessment.
j. Retirement Benefits and Pension Plans—Effective April 1, 2000, the Group adopted a new accounting standard for employees’ retirement benefits and accounted for the
liability for retirement benefits based on the projected benefit obligations and plan assets at the balance sheet date.The full amount of the transitional obligation of ¥6,356 million ($51,304 thousand), determined as of the beginning of year,
is charged to income and included in other expense in the income statement. As a result of adoption of the new standard,
income before income taxes and minority interests decreased by ¥7,361 million ($59,415 thousand).
k. Reserve for Credit Losses on Off-balance-sheet Instruments—Reserve for credit losses on off-balance-sheet instruments is provided for credit losses on commitments to extend loans andother off-balance-sheet financial instruments based on an estimated loss ratio determined by the same methodology which isused in determining the reserve for loan losses.
Effective April 1, 2000, the Bank changed its method of accounting for credit losses on off-balance-sheet instruments,especially commitments to extend loans, from providing the reserve for losses on loans extended after the exercise ofsuch commitments to providing the reserve for credit losses on commitments to extend loans. The effect of this change
was to decrease income before income taxes and minority interests for the year ended March 31, 2001, by ¥717 million($5,791 thousand).
l. Other Reserves—Other reserves include the reserve for securities transaction liabilities.
The reserve for securities transaction liabilities is required to be provided under the Securities and Exchange Law of Japan.
m.Lease Transactions—All leases of the Bank and its domestic consolidated subsidiaries are accounted for as operating leases. Under Japanese
accounting standards for leases, finance leases that deem to transfer ownership of the leased property to the lessee are to becapitalized, while other finance leases are permitted to be accounted for as operating lease transactions if certain “as if capital-ized” information is disclosed in the notes to the consolidated financial statements.
n. Income Taxes—Deferred income taxes are recorded to reflect the impact of temporary differences between assets and liabilities recognized for
financial reporting purposes and such amounts recognized for tax purposes. These deferred taxes are measured by applyingcurrently enacted tax laws to the temporary differences.
o. Foreign Currency Items—The balance sheet accounts of the consolidated foreign subsidiaries are translated into Japanese yen at the current exchangerate as of the balance sheet date except for stockholders’ equity, which is translated at the historical rate.
Such differences are shown as “Foreign currency translation adjustments” in a separate component of stockholders’ equity inaccordance with the revised accounting standard for foreign currency transactions.
Assets and liabilities denominated in foreign currencies held by the Bank at the year end are translated into Japanese yen at
exchange rates prevailing at the end of fiscal year except that certain special accounts are translated at historical rates. Accountsof the Bank’s foreign branches are translated into Japanese yen at exchange rates prevailing at the end of the fiscal year.
Foreign currency accounts held by consolidated foreign subsidiaries are translated into the currency of the subsidiaries at
exchange rates prevailing at the end of the respective fiscal year.
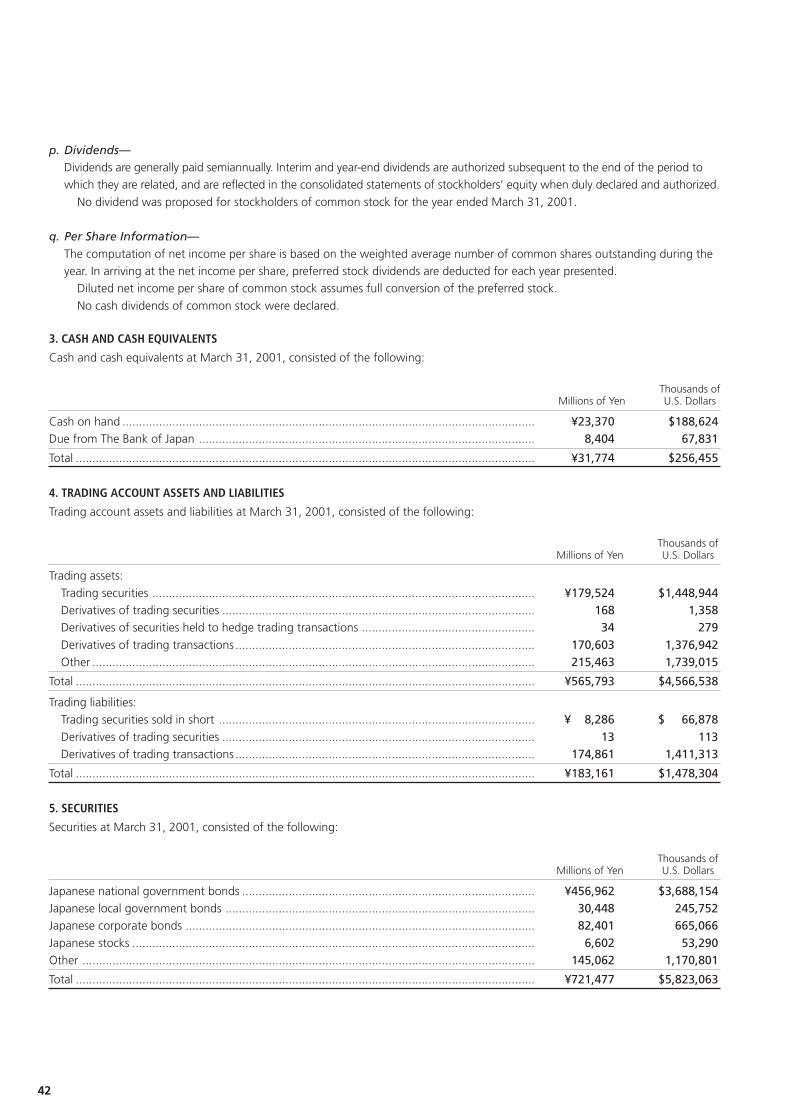
42
p. Dividends—Dividends are generally paid semiannually. Interim and year-end dividends are authorized subsequent to the end of the period towhich they are related, and are reflected in the consolidated statements of stockholders’ equity when duly declared and authorized.
No dividend was proposed for stockholders of common stock for the year ended March 31, 2001.
q. Per Share Information—The computation of net income per share is based on the weighted average number of common shares outstanding during theyear. In arriving at the net income per share, preferred stock dividends are deducted for each year presented.
Diluted net income per share of common stock assumes full conversion of the preferred stock.
No cash dividends of common stock were declared.
3. CASH AND CASH EQUIVALENTS
Cash and cash equivalents at March 31, 2001, consisted of the following:
Thousands ofMillions of Yen U.S. Dollars
Cash on hand ............................................................................................................................ ¥23,370 $188,624Due from The Bank of Japan ..................................................................................................... 8,404 67,831
Total .......................................................................................................................................... ¥31,774 $256,455
4. TRADING ACCOUNT ASSETS AND LIABILITIES
Trading account assets and liabilities at March 31, 2001, consisted of the following:
Thousands ofMillions of Yen U.S. Dollars
Trading assets:
Trading securities ................................................................................................................... ¥179,524 $1,448,944Derivatives of trading securities .............................................................................................. 168 1,358Derivatives of securities held to hedge trading transactions .................................................... 34 279Derivatives of trading transactions .......................................................................................... 170,603 1,376,942Other ..................................................................................................................................... 215,463 1,739,015
Total .......................................................................................................................................... ¥565,793 $4,566,538
Trading liabilities:Trading securities sold in short ............................................................................................... ¥ 8,286 $ 66,878Derivatives of trading securities .............................................................................................. 13 113Derivatives of trading transactions .......................................................................................... 174,861 1,411,313
Total .......................................................................................................................................... ¥183,161 $1,478,304
5. SECURITIES
Securities at March 31, 2001, consisted of the following:
Thousands ofMillions of Yen U.S. Dollars
Japanese national government bonds ........................................................................................ ¥456,962 $3,688,154Japanese local government bonds ............................................................................................. 30,448 245,752Japanese corporate bonds ......................................................................................................... 82,401 665,066Japanese stocks ......................................................................................................................... 6,602 53,290Other ........................................................................................................................................ 145,062 1,170,801
Total .......................................................................................................................................... ¥721,477 $5,823,063
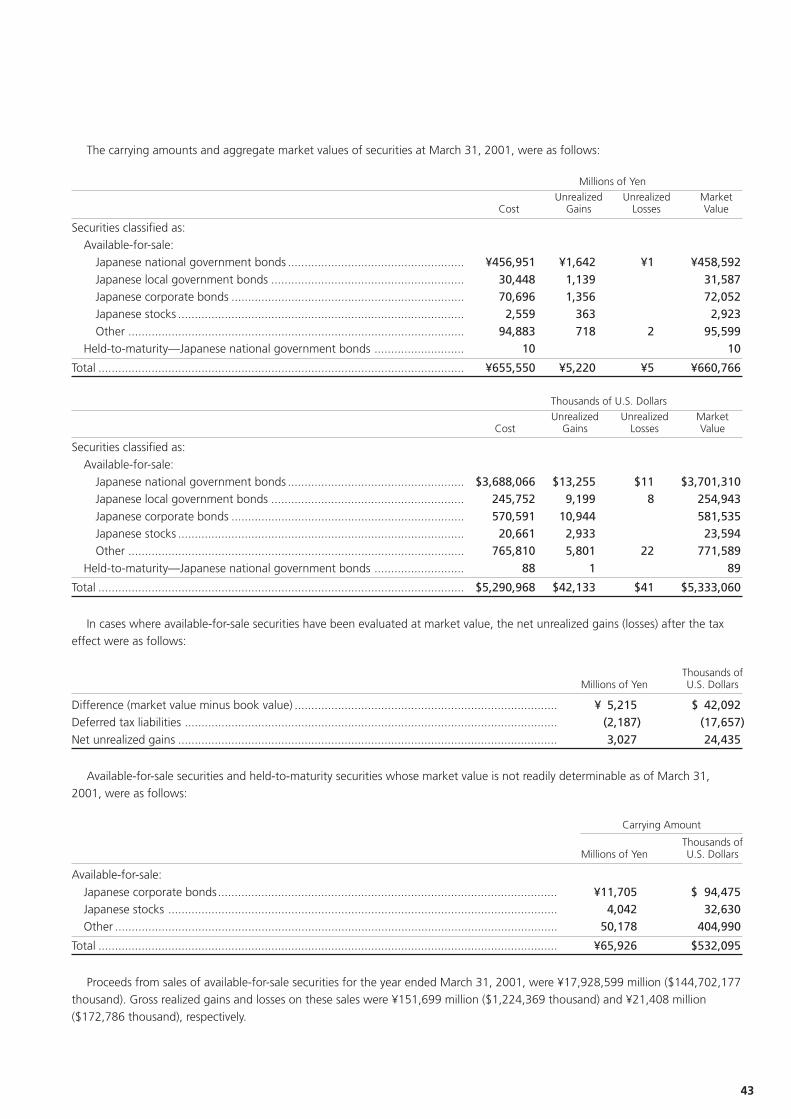
43
The carrying amounts and aggregate market values of securities at March 31, 2001, were as follows:
Millions of Yen
Unrealized Unrealized MarketCost Gains Losses Value
Securities classified as:Available-for-sale:
Japanese national government bonds ..................................................... ¥456,951 ¥1,642 ¥1 ¥458,592Japanese local government bonds .......................................................... 30,448 1,139 31,587Japanese corporate bonds ...................................................................... 70,696 1,356 72,052Japanese stocks ...................................................................................... 2,559 363 2,923Other ..................................................................................................... 94,883 718 2 95,599
Held-to-maturity—Japanese national government bonds ........................... 10 10
Total .............................................................................................................. ¥655,550 ¥5,220 ¥5 ¥660,766
Thousands of U.S. Dollars
Unrealized Unrealized MarketCost Gains Losses Value
Securities classified as:
Available-for-sale:Japanese national government bonds ..................................................... $3,688,066 $13,255 $11 $3,701,310Japanese local government bonds .......................................................... 245,752 9,199 8 254,943Japanese corporate bonds ...................................................................... 570,591 10,944 581,535Japanese stocks ...................................................................................... 20,661 2,933 23,594Other ..................................................................................................... 765,810 5,801 22 771,589
Held-to-maturity—Japanese national government bonds ........................... 88 1 89
Total .............................................................................................................. $5,290,968 $42,133 $41 $5,333,060
In cases where available-for-sale securities have been evaluated at market value, the net unrealized gains (losses) after the taxeffect were as follows:
Thousands ofMillions of Yen U.S. Dollars
Difference (market value minus book value) ............................................................................... ¥ 5,215 $ 42,092Deferred tax liabilities ................................................................................................................ (2,187) (17,657)Net unrealized gains .................................................................................................................. 3,027 24,435
Available-for-sale securities and held-to-maturity securities whose market value is not readily determinable as of March 31,2001, were as follows:
Carrying Amount
Thousands ofMillions of Yen U.S. Dollars
Available-for-sale:
Japanese corporate bonds...................................................................................................... ¥11,705 $ 94,475Japanese stocks ..................................................................................................................... 4,042 32,630Other ..................................................................................................................................... 50,178 404,990
Total .......................................................................................................................................... ¥65,926 $532,095
Proceeds from sales of available-for-sale securities for the year ended March 31, 2001, were ¥17,928,599 million ($144,702,177thousand). Gross realized gains and losses on these sales were ¥151,699 million ($1,224,369 thousand) and ¥21,408 million($172,786 thousand), respectively.
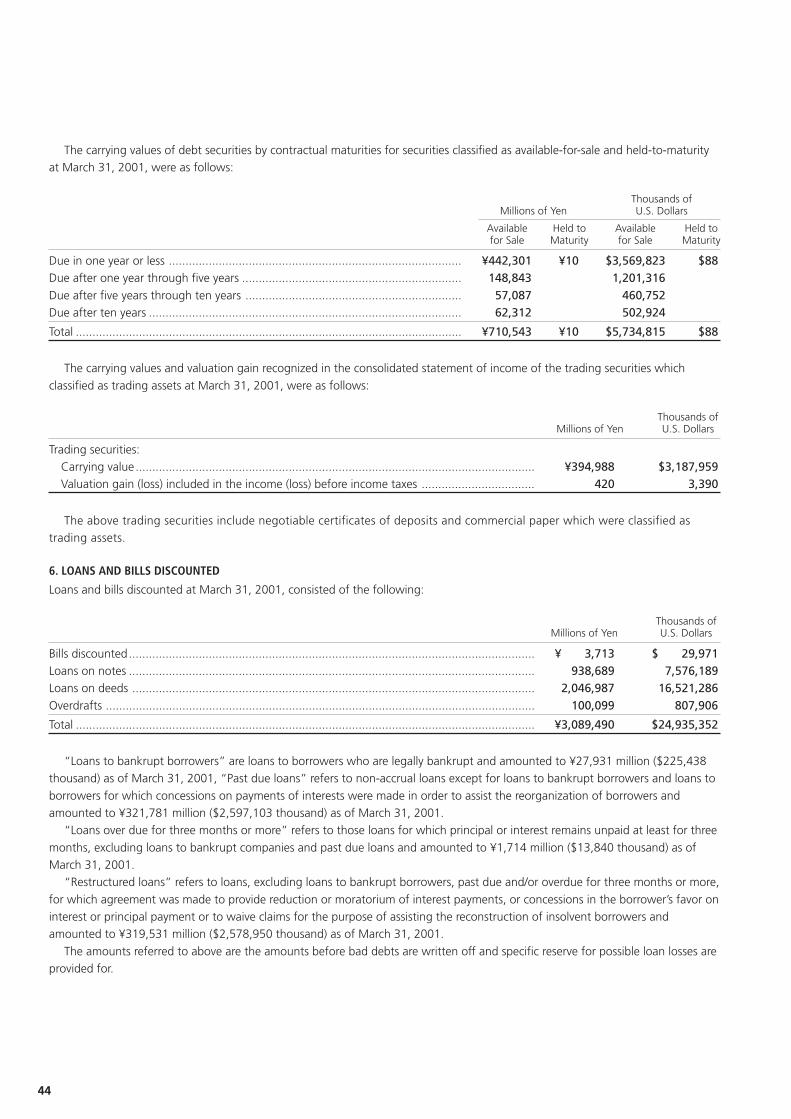
44
The carrying values of debt securities by contractual maturities for securities classified as available-for-sale and held-to-maturityat March 31, 2001, were as follows:
Thousands ofMillions of Yen U.S. Dollars
Available Held to Available Held tofor Sale Maturity for Sale Maturity
Due in one year or less ........................................................................................ ¥442,301 ¥10 $3,569,823 $88Due after one year through five years .................................................................. 148,843 1,201,316Due after five years through ten years ................................................................. 57,087 460,752Due after ten years .............................................................................................. 62,312 502,924
Total .................................................................................................................... ¥710,543 ¥10 $5,734,815 $88
The carrying values and valuation gain recognized in the consolidated statement of income of the trading securities which
classified as trading assets at March 31, 2001, were as follows:
Thousands ofMillions of Yen U.S. Dollars
Trading securities:Carrying value ........................................................................................................................ ¥394,988 $3,187,959Valuation gain (loss) included in the income (loss) before income taxes .................................. 420 3,390
The above trading securities include negotiable certificates of deposits and commercial paper which were classified astrading assets.
6. LOANS AND BILLS DISCOUNTED
Loans and bills discounted at March 31, 2001, consisted of the following:
Thousands ofMillions of Yen U.S. Dollars
Bills discounted.......................................................................................................................... ¥ 3,713 $ 29,971Loans on notes .......................................................................................................................... 938,689 7,576,189Loans on deeds ......................................................................................................................... 2,046,987 16,521,286Overdrafts ................................................................................................................................. 100,099 807,906
Total .......................................................................................................................................... ¥3,089,490 $24,935,352
“Loans to bankrupt borrowers” are loans to borrowers who are legally bankrupt and amounted to ¥27,931 million ($225,438thousand) as of March 31, 2001, “Past due loans” refers to non-accrual loans except for loans to bankrupt borrowers and loans to
borrowers for which concessions on payments of interests were made in order to assist the reorganization of borrowers andamounted to ¥321,781 million ($2,597,103 thousand) as of March 31, 2001.
“Loans over due for three months or more” refers to those loans for which principal or interest remains unpaid at least for three
months, excluding loans to bankrupt companies and past due loans and amounted to ¥1,714 million ($13,840 thousand) as ofMarch 31, 2001.
“Restructured loans” refers to loans, excluding loans to bankrupt borrowers, past due and/or overdue for three months or more,
for which agreement was made to provide reduction or moratorium of interest payments, or concessions in the borrower’s favor oninterest or principal payment or to waive claims for the purpose of assisting the reconstruction of insolvent borrowers andamounted to ¥319,531 million ($2,578,950 thousand) as of March 31, 2001.
The amounts referred to above are the amounts before bad debts are written off and specific reserve for possible loan losses areprovided for.
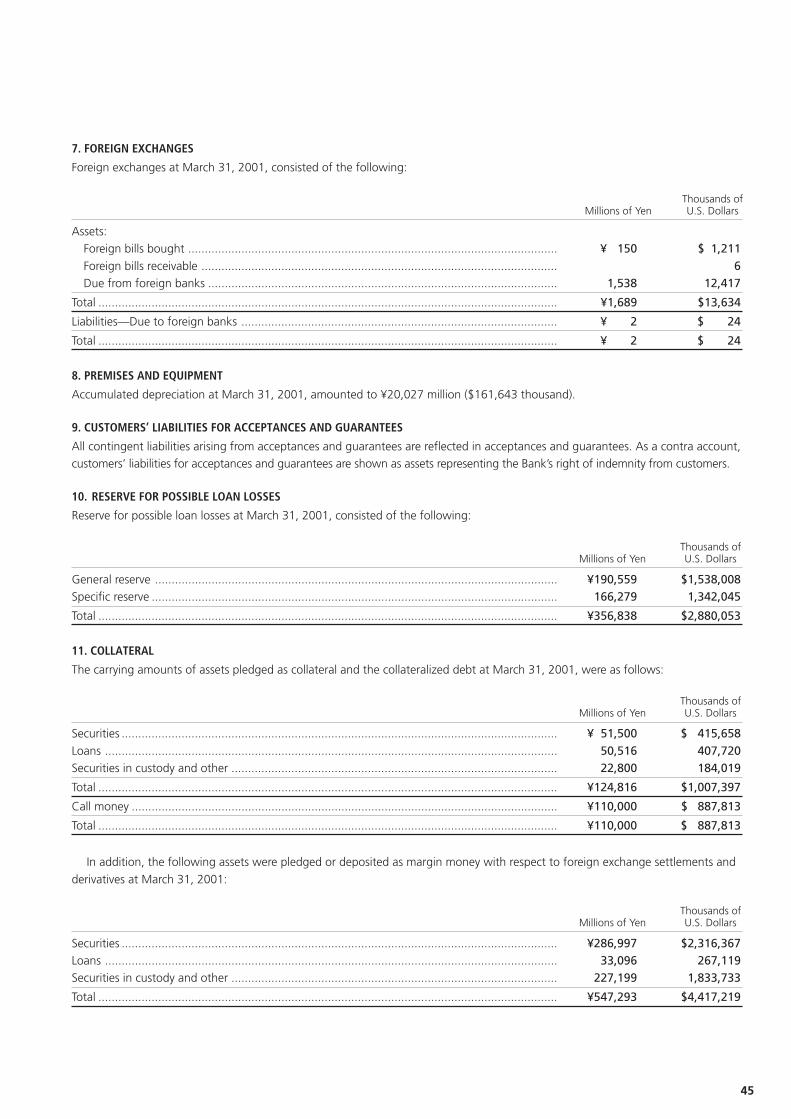
45
7. FOREIGN EXCHANGES
Foreign exchanges at March 31, 2001, consisted of the following:
Thousands ofMillions of Yen U.S. Dollars
Assets:Foreign bills bought ............................................................................................................... ¥ 150 $ 1,211Foreign bills receivable ........................................................................................................... 6Due from foreign banks ......................................................................................................... 1,538 12,417
Total .......................................................................................................................................... ¥1,689 $13,634
Liabilities—Due to foreign banks ............................................................................................... ¥ 2 $ 24
Total .......................................................................................................................................... ¥ 2 $ 24
8. PREMISES AND EQUIPMENT
Accumulated depreciation at March 31, 2001, amounted to ¥20,027 million ($161,643 thousand).
9. CUSTOMERS’ LIABILITIES FOR ACCEPTANCES AND GUARANTEES
All contingent liabilities arising from acceptances and guarantees are reflected in acceptances and guarantees. As a contra account,customers’ liabilities for acceptances and guarantees are shown as assets representing the Bank’s right of indemnity from customers.
10. RESERVE FOR POSSIBLE LOAN LOSSES
Reserve for possible loan losses at March 31, 2001, consisted of the following:
Thousands ofMillions of Yen U.S. Dollars
General reserve ......................................................................................................................... ¥190,559 $1,538,008Specific reserve .......................................................................................................................... 166,279 1,342,045
Total .......................................................................................................................................... ¥356,838 $2,880,053
11. COLLATERAL
The carrying amounts of assets pledged as collateral and the collateralized debt at March 31, 2001, were as follows:
Thousands ofMillions of Yen U.S. Dollars
Securities ................................................................................................................................... ¥ 51,500 $ 415,658Loans ........................................................................................................................................ 50,516 407,720Securities in custody and other .................................................................................................. 22,800 184,019
Total .......................................................................................................................................... ¥124,816 $1,007,397
Call money ................................................................................................................................ ¥110,000 $ 887,813
Total .......................................................................................................................................... ¥110,000 $ 887,813
In addition, the following assets were pledged or deposited as margin money with respect to foreign exchange settlements and
derivatives at March 31, 2001:
Thousands ofMillions of Yen U.S. Dollars
Securities ................................................................................................................................... ¥286,997 $2,316,367Loans ........................................................................................................................................ 33,096 267,119Securities in custody and other .................................................................................................. 227,199 1,833,733
Total .......................................................................................................................................... ¥547,293 $4,417,219
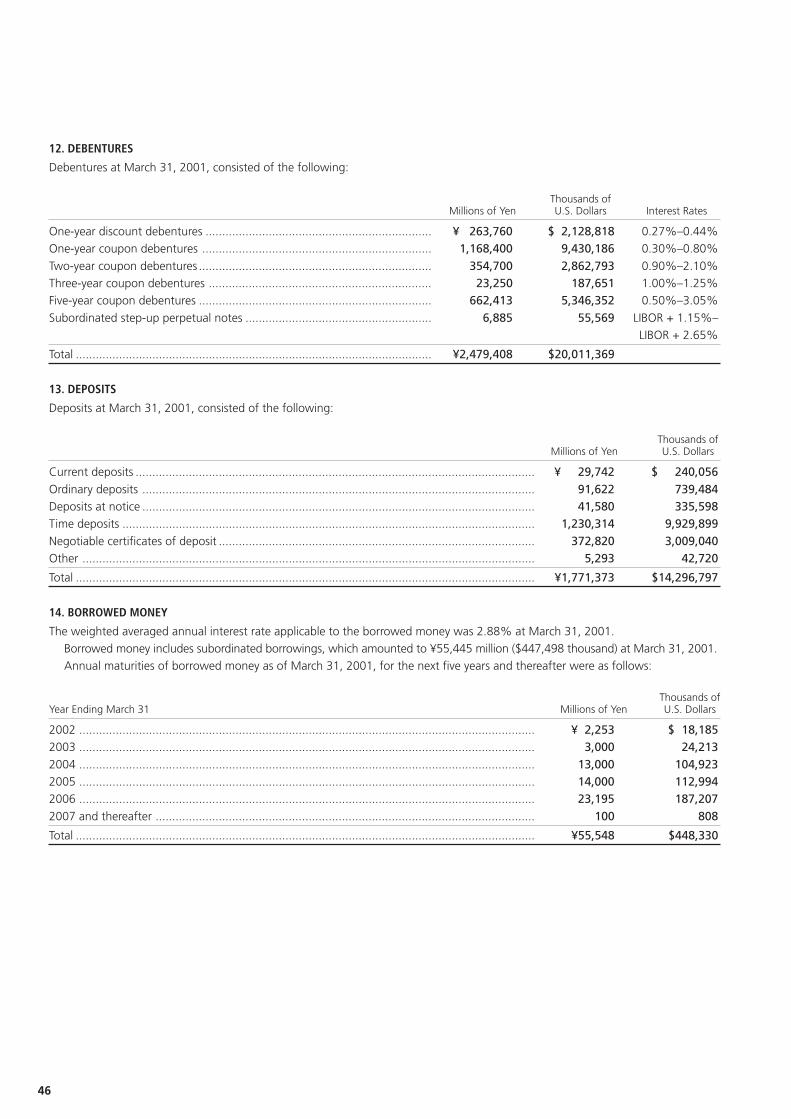
46
12. DEBENTURES
Debentures at March 31, 2001, consisted of the following:
Thousands ofMillions of Yen U.S. Dollars Interest Rates
One-year discount debentures .................................................................... ¥ 263,760 $ 2,128,818 0.27%–0.44%One-year coupon debentures ..................................................................... 1,168,400 9,430,186 0.30%–0.80%
Two-year coupon debentures ...................................................................... 354,700 2,862,793 0.90%–2.10%Three-year coupon debentures ................................................................... 23,250 187,651 1.00%–1.25%Five-year coupon debentures ...................................................................... 662,413 5,346,352 0.50%–3.05%
Subordinated step-up perpetual notes ........................................................ 6,885 55,569 LIBOR + 1.15%–LIBOR + 2.65%
Total ........................................................................................................... ¥2,479,408 $20,011,369
13. DEPOSITS
Deposits at March 31, 2001, consisted of the following:
Thousands ofMillions of Yen U.S. Dollars
Current deposits ........................................................................................................................ ¥ 29,742 $ 240,056Ordinary deposits ...................................................................................................................... 91,622 739,484Deposits at notice ...................................................................................................................... 41,580 335,598Time deposits ............................................................................................................................ 1,230,314 9,929,899Negotiable certificates of deposit ............................................................................................... 372,820 3,009,040Other ........................................................................................................................................ 5,293 42,720
Total .......................................................................................................................................... ¥1,771,373 $14,296,797
14. BORROWED MONEY
The weighted averaged annual interest rate applicable to the borrowed money was 2.88% at March 31, 2001.Borrowed money includes subordinated borrowings, which amounted to ¥55,445 million ($447,498 thousand) at March 31, 2001.Annual maturities of borrowed money as of March 31, 2001, for the next five years and thereafter were as follows:
Thousands ofYear Ending March 31 Millions of Yen U.S. Dollars
2002 ......................................................................................................................................... ¥ 2,253 $ 18,1852003 ......................................................................................................................................... 3,000 24,2132004 ......................................................................................................................................... 13,000 104,9232005 ......................................................................................................................................... 14,000 112,9942006 ......................................................................................................................................... 23,195 187,2072007 and thereafter .................................................................................................................. 100 808
Total .......................................................................................................................................... ¥55,548 $448,330
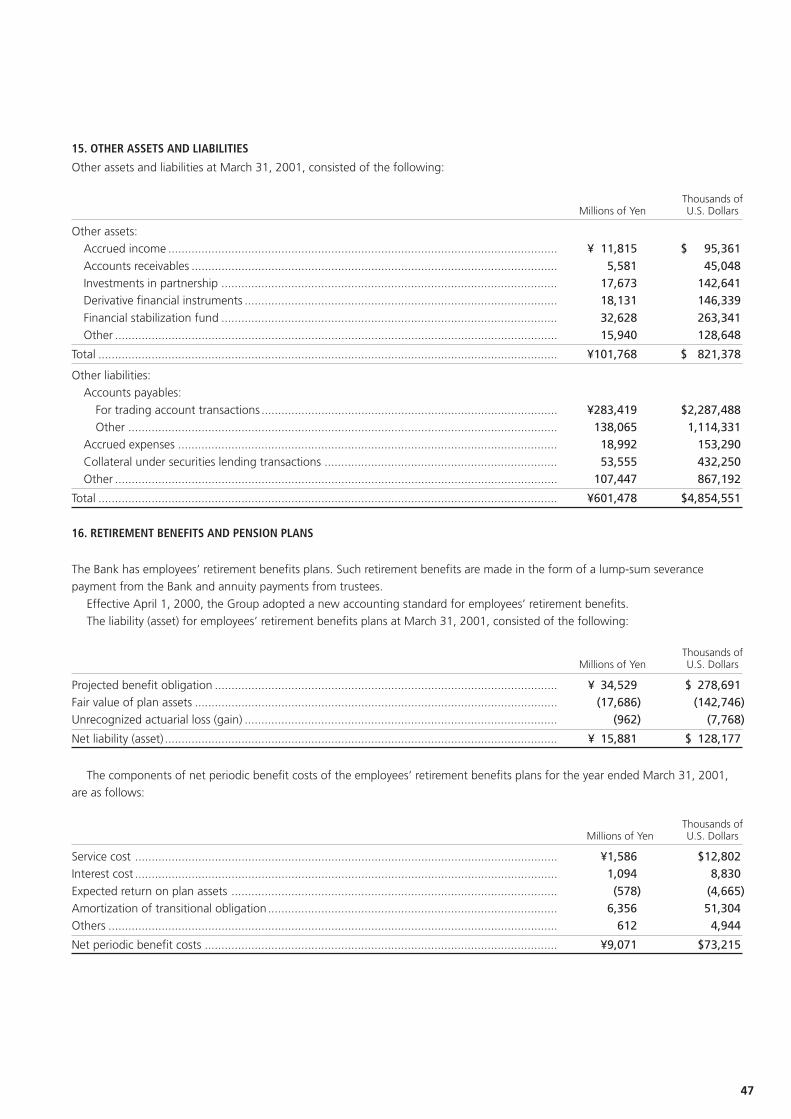
47
15. OTHER ASSETS AND LIABILITIES
Other assets and liabilities at March 31, 2001, consisted of the following:
Thousands ofMillions of Yen U.S. Dollars
Other assets:Accrued income ..................................................................................................................... ¥ 11,815 $ 95,361Accounts receivables .............................................................................................................. 5,581 45,048Investments in partnership ..................................................................................................... 17,673 142,641Derivative financial instruments .............................................................................................. 18,131 146,339Financial stabilization fund ..................................................................................................... 32,628 263,341Other ..................................................................................................................................... 15,940 128,648
Total .......................................................................................................................................... ¥101,768 $ 821,378
Other liabilities:Accounts payables:
For trading account transactions ......................................................................................... ¥283,419 $2,287,488Other ................................................................................................................................. 138,065 1,114,331
Accrued expenses .................................................................................................................. 18,992 153,290Collateral under securities lending transactions ...................................................................... 53,555 432,250Other ..................................................................................................................................... 107,447 867,192
Total .......................................................................................................................................... ¥601,478 $4,854,551
16. RETIREMENT BENEFITS AND PENSION PLANS
The Bank has employees’ retirement benefits plans. Such retirement benefits are made in the form of a lump-sum severancepayment from the Bank and annuity payments from trustees.
Effective April 1, 2000, the Group adopted a new accounting standard for employees’ retirement benefits.The liability (asset) for employees’ retirement benefits plans at March 31, 2001, consisted of the following:
Thousands ofMillions of Yen U.S. Dollars
Projected benefit obligation ....................................................................................................... ¥ 34,529 $ 278,691Fair value of plan assets ............................................................................................................. (17,686) (142,746)Unrecognized actuarial loss (gain) .............................................................................................. (962) (7,768)
Net liability (asset) ...................................................................................................................... ¥ 15,881 $ 128,177
The components of net periodic benefit costs of the employees’ retirement benefits plans for the year ended March 31, 2001,are as follows:
Thousands ofMillions of Yen U.S. Dollars
Service cost ............................................................................................................................... ¥1,586 $12,802Interest cost ............................................................................................................................... 1,094 8,830Expected return on plan assets .................................................................................................. (578) (4,665)Amortization of transitional obligation....................................................................................... 6,356 51,304Others ....................................................................................................................................... 612 4,944
Net periodic benefit costs .......................................................................................................... ¥9,071 $73,215
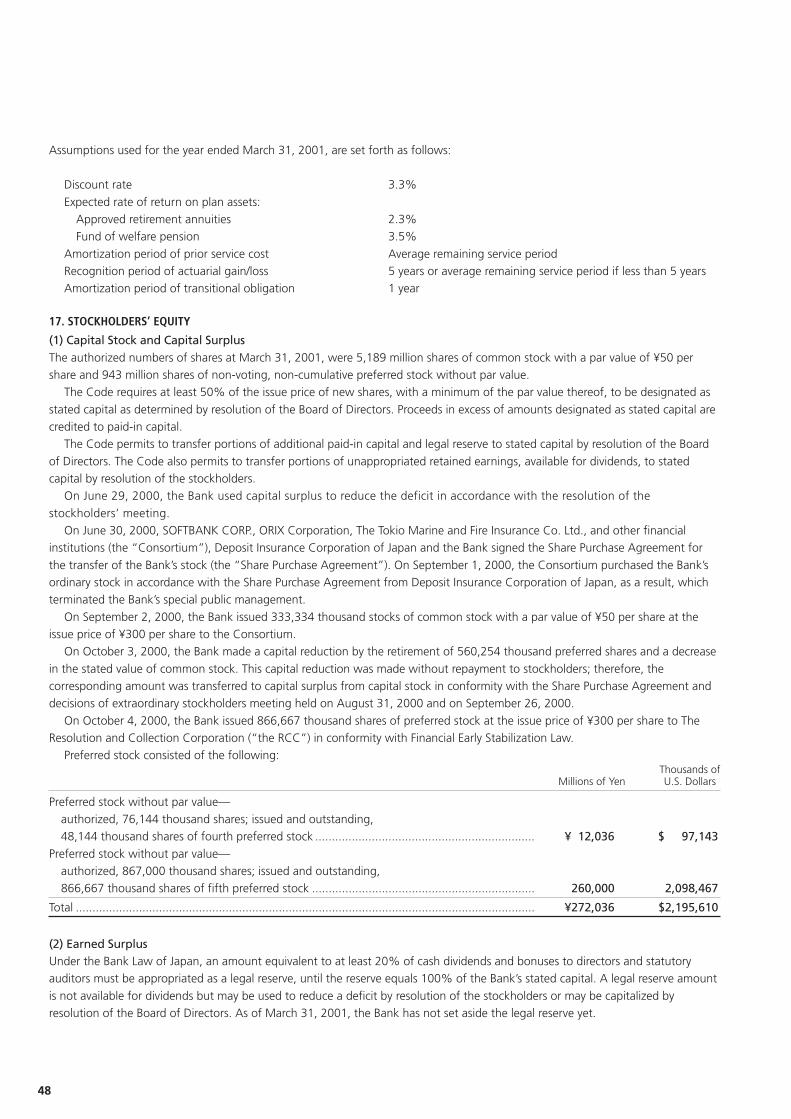
48
Assumptions used for the year ended March 31, 2001, are set forth as follows:
Discount rate 3.3%
Expected rate of return on plan assets:Approved retirement annuities 2.3%Fund of welfare pension 3.5%
Amortization period of prior service cost Average remaining service periodRecognition period of actuarial gain/loss 5 years or average remaining service period if less than 5 yearsAmortization period of transitional obligation 1 year
17. STOCKHOLDERS’ EQUITY
(1) Capital Stock and Capital SurplusThe authorized numbers of shares at March 31, 2001, were 5,189 million shares of common stock with a par value of ¥50 pershare and 943 million shares of non-voting, non-cumulative preferred stock without par value.
The Code requires at least 50% of the issue price of new shares, with a minimum of the par value thereof, to be designated as
stated capital as determined by resolution of the Board of Directors. Proceeds in excess of amounts designated as stated capital arecredited to paid-in capital.
The Code permits to transfer portions of additional paid-in capital and legal reserve to stated capital by resolution of the Board
of Directors. The Code also permits to transfer portions of unappropriated retained earnings, available for dividends, to statedcapital by resolution of the stockholders.
On June 29, 2000, the Bank used capital surplus to reduce the deficit in accordance with the resolution of the
stockholders’ meeting.On June 30, 2000, SOFTBANK CORP., ORIX Corporation, The Tokio Marine and Fire Insurance Co. Ltd., and other financial
institutions (the “Consortium”), Deposit Insurance Corporation of Japan and the Bank signed the Share Purchase Agreement for
the transfer of the Bank’s stock (the “Share Purchase Agreement”). On September 1, 2000, the Consortium purchased the Bank’sordinary stock in accordance with the Share Purchase Agreement from Deposit Insurance Corporation of Japan, as a result, whichterminated the Bank’s special public management.
On September 2, 2000, the Bank issued 333,334 thousand stocks of common stock with a par value of ¥50 per share at theissue price of ¥300 per share to the Consortium.
On October 3, 2000, the Bank made a capital reduction by the retirement of 560,254 thousand preferred shares and a decrease
in the stated value of common stock. This capital reduction was made without repayment to stockholders; therefore, thecorresponding amount was transferred to capital surplus from capital stock in conformity with the Share Purchase Agreement anddecisions of extraordinary stockholders meeting held on August 31, 2000 and on September 26, 2000.
On October 4, 2000, the Bank issued 866,667 thousand shares of preferred stock at the issue price of ¥300 per share to TheResolution and Collection Corporation (“the RCC”) in conformity with Financial Early Stabilization Law.
Preferred stock consisted of the following:Thousands of
Millions of Yen U.S. Dollars
Preferred stock without par value—authorized, 76,144 thousand shares; issued and outstanding,48,144 thousand shares of fourth preferred stock .................................................................. ¥ 12,036 $ 97,143
Preferred stock without par value—authorized, 867,000 thousand shares; issued and outstanding,866,667 thousand shares of fifth preferred stock ................................................................... 260,000 2,098,467
Total .......................................................................................................................................... ¥272,036 $2,195,610
(2) Earned SurplusUnder the Bank Law of Japan, an amount equivalent to at least 20% of cash dividends and bonuses to directors and statutoryauditors must be appropriated as a legal reserve, until the reserve equals 100% of the Bank’s stated capital. A legal reserve amount
is not available for dividends but may be used to reduce a deficit by resolution of the stockholders or may be capitalized byresolution of the Board of Directors. As of March 31, 2001, the Bank has not set aside the legal reserve yet.
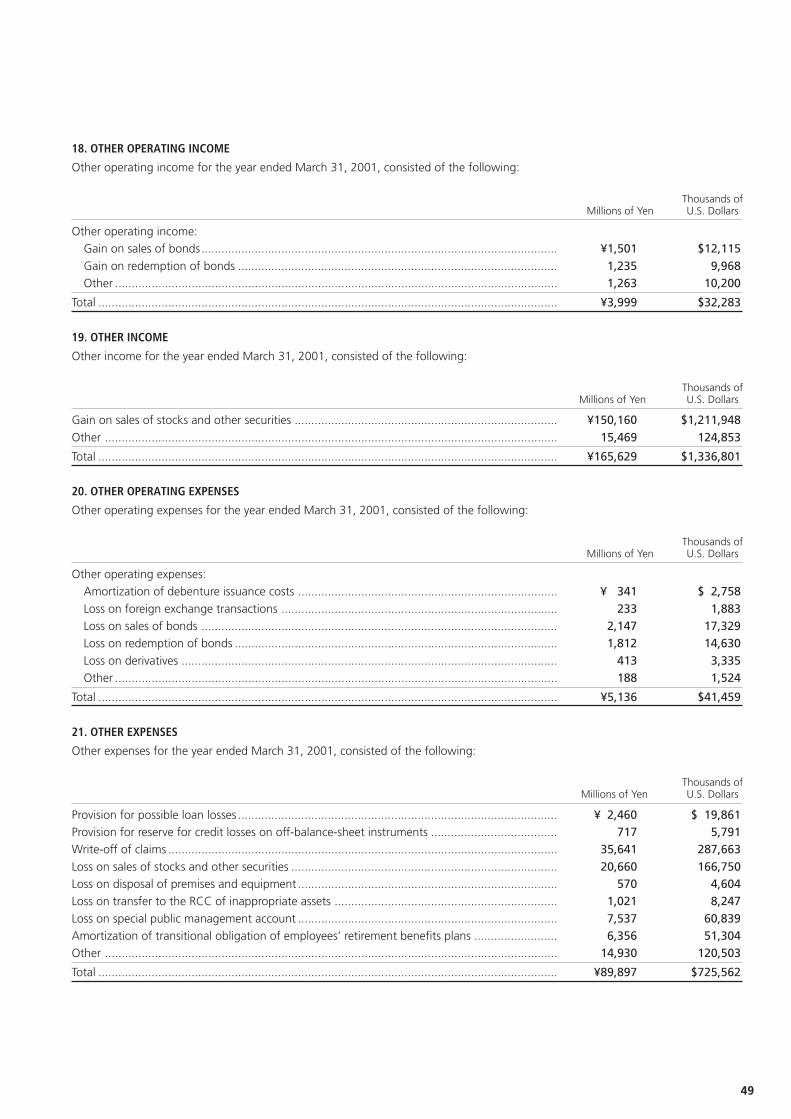
49
18. OTHER OPERATING INCOME
Other operating income for the year ended March 31, 2001, consisted of the following:
Thousands ofMillions of Yen U.S. Dollars
Other operating income:Gain on sales of bonds........................................................................................................... ¥1,501 $12,115Gain on redemption of bonds ................................................................................................ 1,235 9,968Other ..................................................................................................................................... 1,263 10,200
Total .......................................................................................................................................... ¥3,999 $32,283
19. OTHER INCOME
Other income for the year ended March 31, 2001, consisted of the following:
Thousands ofMillions of Yen U.S. Dollars
Gain on sales of stocks and other securities ............................................................................... ¥150,160 $1,211,948Other ........................................................................................................................................ 15,469 124,853
Total .......................................................................................................................................... ¥165,629 $1,336,801
20. OTHER OPERATING EXPENSES
Other operating expenses for the year ended March 31, 2001, consisted of the following:
Thousands ofMillions of Yen U.S. Dollars
Other operating expenses:Amortization of debenture issuance costs .............................................................................. ¥ 341 $ 2,758Loss on foreign exchange transactions ................................................................................... 233 1,883Loss on sales of bonds ........................................................................................................... 2,147 17,329Loss on redemption of bonds ................................................................................................. 1,812 14,630Loss on derivatives ................................................................................................................. 413 3,335Other ..................................................................................................................................... 188 1,524
Total .......................................................................................................................................... ¥5,136 $41,459
21. OTHER EXPENSES
Other expenses for the year ended March 31, 2001, consisted of the following:
Thousands ofMillions of Yen U.S. Dollars
Provision for possible loan losses ................................................................................................ ¥ 2,460 $ 19,861Provision for reserve for credit losses on off-balance-sheet instruments ...................................... 717 5,791Write-off of claims ..................................................................................................................... 35,641 287,663Loss on sales of stocks and other securities ................................................................................ 20,660 166,750Loss on disposal of premises and equipment .............................................................................. 570 4,604Loss on transfer to the RCC of inappropriate assets ................................................................... 1,021 8,247Loss on special public management account .............................................................................. 7,537 60,839Amortization of transitional obligation of employees’ retirement benefits plans ......................... 6,356 51,304Other ........................................................................................................................................ 14,930 120,503
Total .......................................................................................................................................... ¥89,897 $725,562
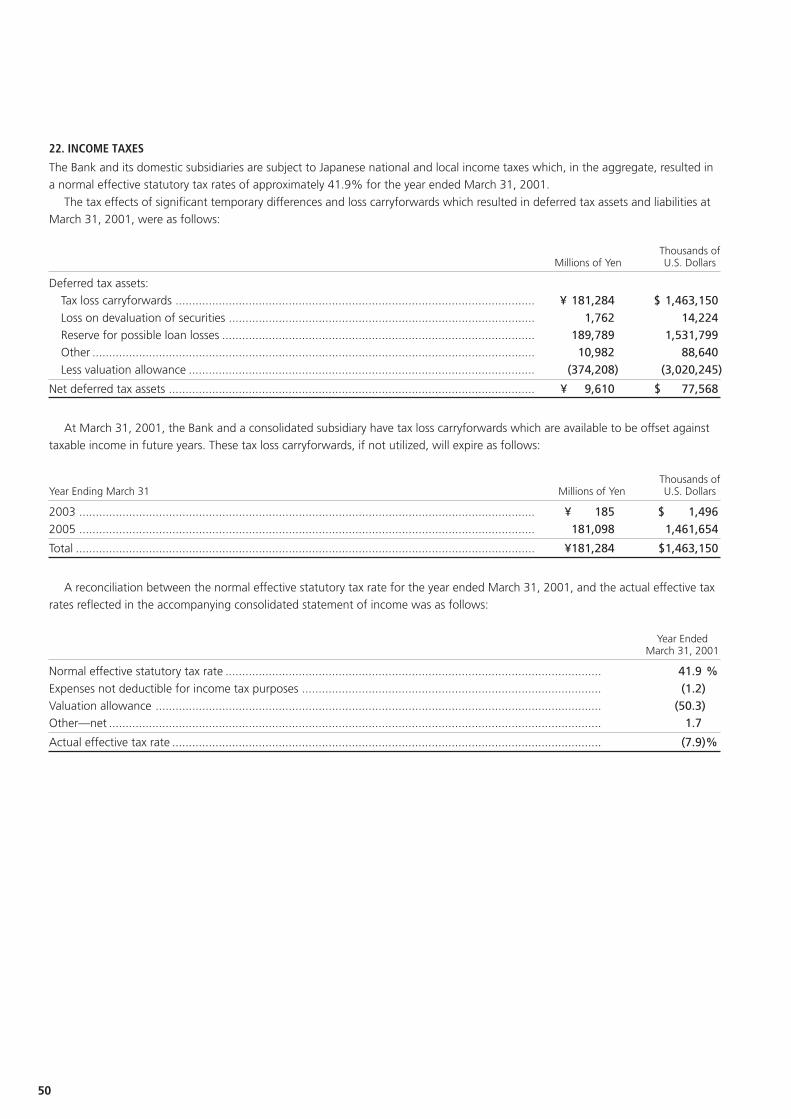
50
22. INCOME TAXES
The Bank and its domestic subsidiaries are subject to Japanese national and local income taxes which, in the aggregate, resulted ina normal effective statutory tax rates of approximately 41.9% for the year ended March 31, 2001.
The tax effects of significant temporary differences and loss carryforwards which resulted in deferred tax assets and liabilities atMarch 31, 2001, were as follows:
Thousands ofMillions of Yen U.S. Dollars
Deferred tax assets:Tax loss carryforwards ............................................................................................................ ¥ 181,284 $ 1,463,150Loss on devaluation of securities ............................................................................................ 1,762 14,224Reserve for possible loan losses .............................................................................................. 189,789 1,531,799Other ..................................................................................................................................... 10,982 88,640Less valuation allowance ........................................................................................................ (374,208) (3,020,245)
Net deferred tax assets .............................................................................................................. ¥ 9,610 $ 77,568
At March 31, 2001, the Bank and a consolidated subsidiary have tax loss carryforwards which are available to be offset againsttaxable income in future years. These tax loss carryforwards, if not utilized, will expire as follows:
Thousands ofYear Ending March 31 Millions of Yen U.S. Dollars
2003 ......................................................................................................................................... ¥ 185 $ 1,4962005 ......................................................................................................................................... 181,098 1,461,654
Total .......................................................................................................................................... ¥181,284 $1,463,150
A reconciliation between the normal effective statutory tax rate for the year ended March 31, 2001, and the actual effective taxrates reflected in the accompanying consolidated statement of income was as follows:
Year EndedMarch 31, 2001
Normal effective statutory tax rate ................................................................................................................. 41.9 %Expenses not deductible for income tax purposes .......................................................................................... (1.2)Valuation allowance ...................................................................................................................................... (50.3)Other—net .................................................................................................................................................... 1.7
Actual effective tax rate ................................................................................................................................. (7.9)%
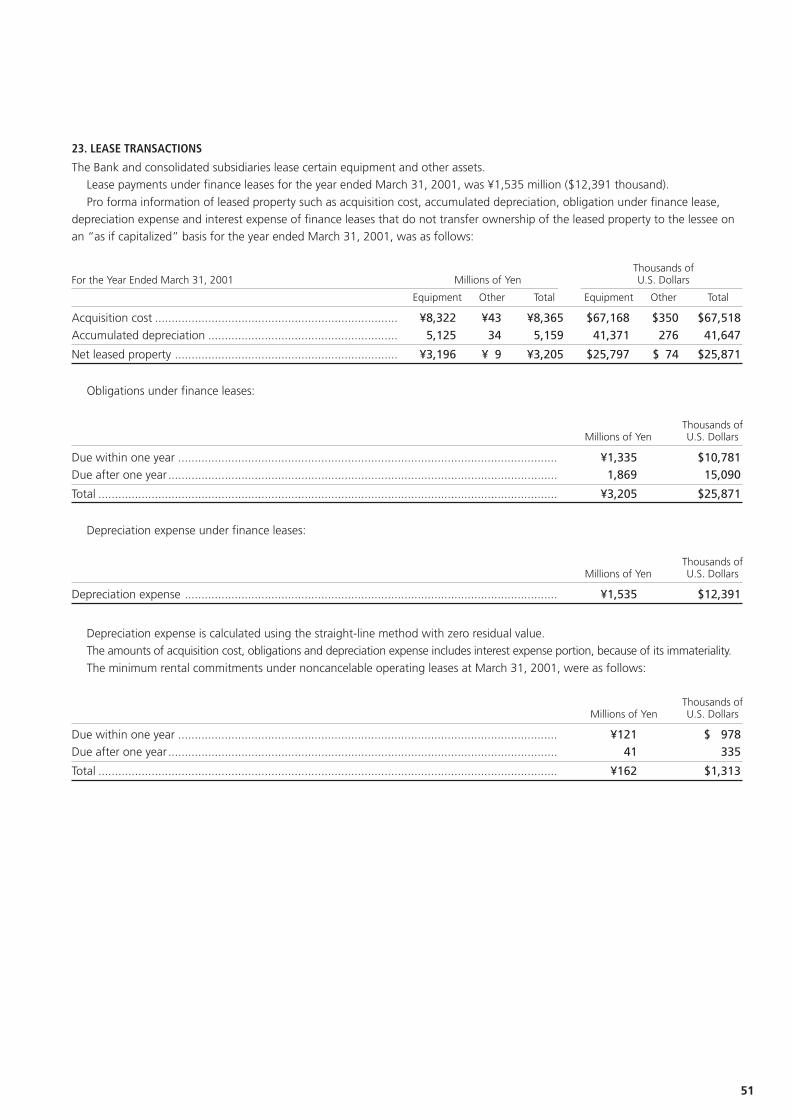
51
23. LEASE TRANSACTIONS
The Bank and consolidated subsidiaries lease certain equipment and other assets.Lease payments under finance leases for the year ended March 31, 2001, was ¥1,535 million ($12,391 thousand).
Pro forma information of leased property such as acquisition cost, accumulated depreciation, obligation under finance lease,depreciation expense and interest expense of finance leases that do not transfer ownership of the leased property to the lessee onan “as if capitalized” basis for the year ended March 31, 2001, was as follows:
Thousands ofFor the Year Ended March 31, 2001 Millions of Yen U.S. Dollars
Equipment Other Total Equipment Other Total
Acquisition cost ......................................................................... ¥8,322 ¥43 ¥8,365 $67,168 $350 $67,518Accumulated depreciation ......................................................... 5,125 34 5,159 41,371 276 41,647
Net leased property ................................................................... ¥3,196 ¥ 9 ¥3,205 $25,797 $ 74 $25,871
Obligations under finance leases:
Thousands ofMillions of Yen U.S. Dollars
Due within one year .................................................................................................................. ¥1,335 $10,781Due after one year ..................................................................................................................... 1,869 15,090
Total .......................................................................................................................................... ¥3,205 $25,871
Depreciation expense under finance leases:
Thousands ofMillions of Yen U.S. Dollars
Depreciation expense ................................................................................................................ ¥1,535 $12,391
Depreciation expense is calculated using the straight-line method with zero residual value.The amounts of acquisition cost, obligations and depreciation expense includes interest expense portion, because of its immateriality.
The minimum rental commitments under noncancelable operating leases at March 31, 2001, were as follows:
Thousands ofMillions of Yen U.S. Dollars
Due within one year .................................................................................................................. ¥121 $ 978Due after one year ..................................................................................................................... 41 335
Total .......................................................................................................................................... ¥162 $1,313
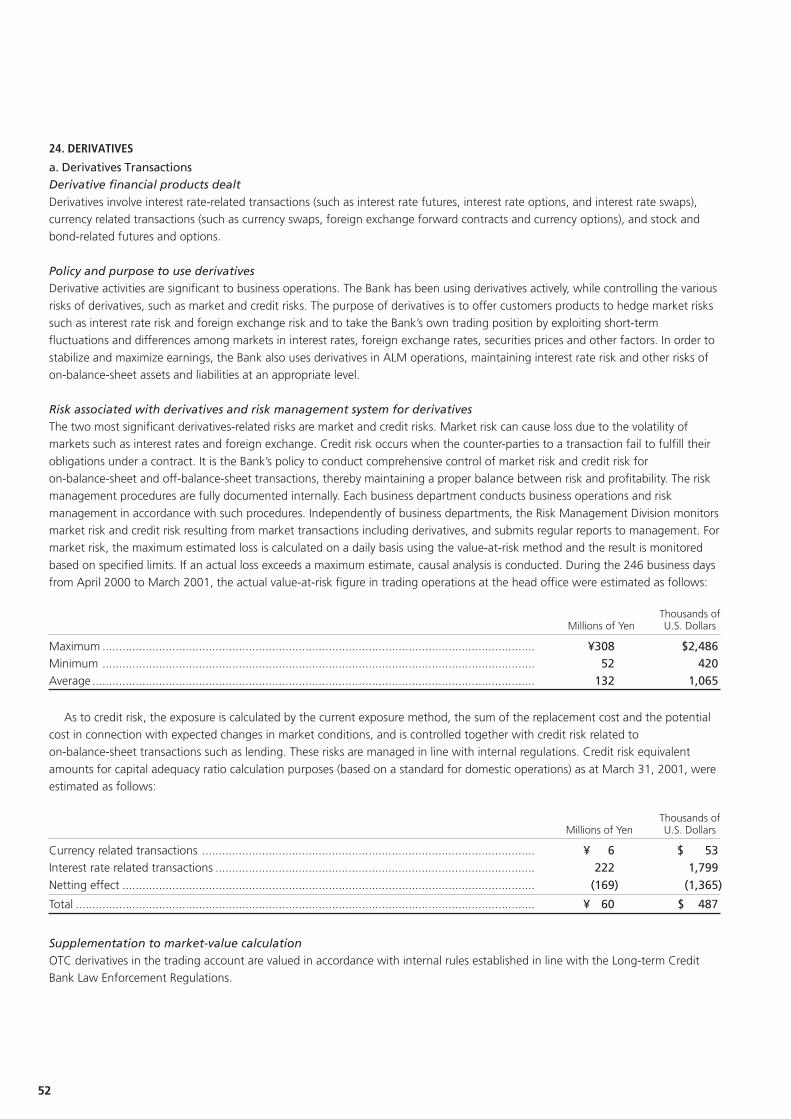
52
24. DERIVATIVES
a. Derivatives TransactionsDerivative financial products dealtDerivatives involve interest rate-related transactions (such as interest rate futures, interest rate options, and interest rate swaps),currency related transactions (such as currency swaps, foreign exchange forward contracts and currency options), and stock andbond-related futures and options.
Policy and purpose to use derivativesDerivative activities are significant to business operations. The Bank has been using derivatives actively, while controlling the various
risks of derivatives, such as market and credit risks. The purpose of derivatives is to offer customers products to hedge market riskssuch as interest rate risk and foreign exchange risk and to take the Bank’s own trading position by exploiting short-termfluctuations and differences among markets in interest rates, foreign exchange rates, securities prices and other factors. In order to
stabilize and maximize earnings, the Bank also uses derivatives in ALM operations, maintaining interest rate risk and other risks ofon-balance-sheet assets and liabilities at an appropriate level.
Risk associated with derivatives and risk management system for derivativesThe two most significant derivatives-related risks are market and credit risks. Market risk can cause loss due to the volatility ofmarkets such as interest rates and foreign exchange. Credit risk occurs when the counter-parties to a transaction fail to fulfill their
obligations under a contract. It is the Bank’s policy to conduct comprehensive control of market risk and credit risk foron-balance-sheet and off-balance-sheet transactions, thereby maintaining a proper balance between risk and profitability. The riskmanagement procedures are fully documented internally. Each business department conducts business operations and risk
management in accordance with such procedures. Independently of business departments, the Risk Management Division monitorsmarket risk and credit risk resulting from market transactions including derivatives, and submits regular reports to management. Formarket risk, the maximum estimated loss is calculated on a daily basis using the value-at-risk method and the result is monitored
based on specified limits. If an actual loss exceeds a maximum estimate, causal analysis is conducted. During the 246 business daysfrom April 2000 to March 2001, the actual value-at-risk figure in trading operations at the head office were estimated as follows:
Thousands ofMillions of Yen U.S. Dollars
Maximum .................................................................................................................................. ¥308 $2,486Minimum .................................................................................................................................. 52 420Average ..................................................................................................................................... 132 1,065
As to credit risk, the exposure is calculated by the current exposure method, the sum of the replacement cost and the potentialcost in connection with expected changes in market conditions, and is controlled together with credit risk related toon-balance-sheet transactions such as lending. These risks are managed in line with internal regulations. Credit risk equivalent
amounts for capital adequacy ratio calculation purposes (based on a standard for domestic operations) as at March 31, 2001, wereestimated as follows:
Thousands ofMillions of Yen U.S. Dollars
Currency related transactions .................................................................................................... ¥ 6 $ 53Interest rate related transactions ................................................................................................ 222 1,799Netting effect ............................................................................................................................ (169) (1,365)
Total .......................................................................................................................................... ¥ 60 $ 487
Supplementation to market-value calculationOTC derivatives in the trading account are valued in accordance with internal rules established in line with the Long-term CreditBank Law Enforcement Regulations.
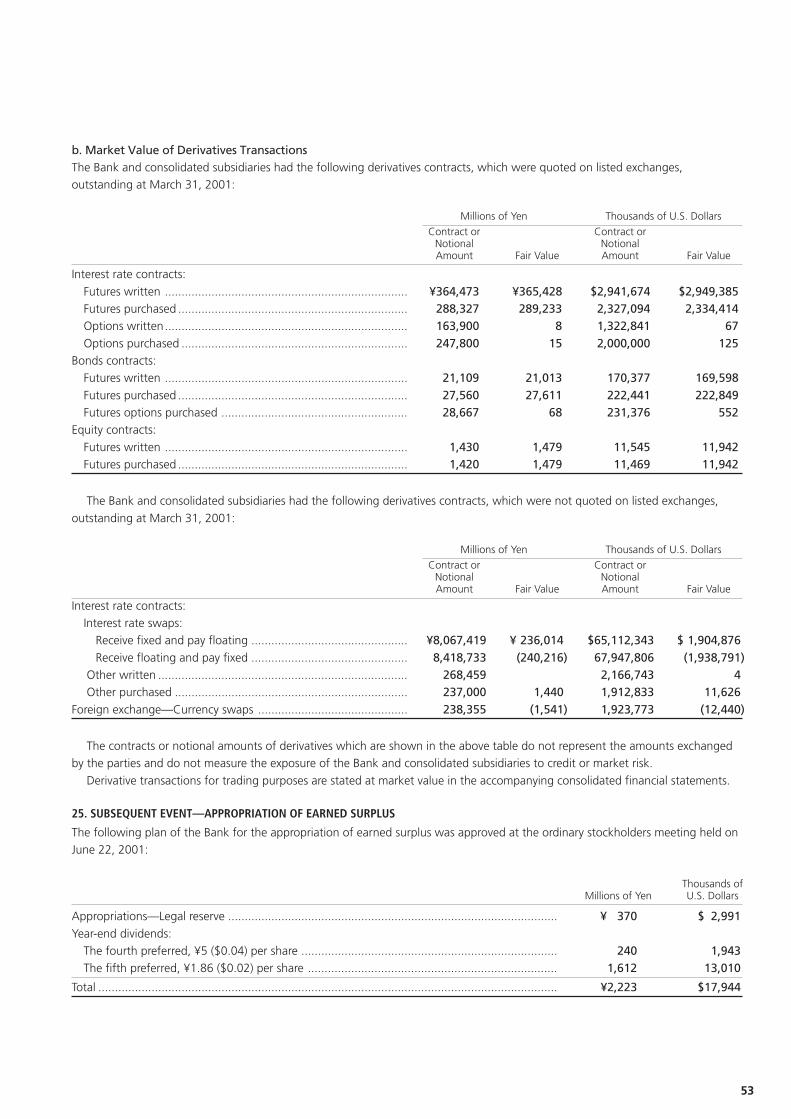
53
b. Market Value of Derivatives TransactionsThe Bank and consolidated subsidiaries had the following derivatives contracts, which were quoted on listed exchanges,outstanding at March 31, 2001:
Millions of Yen Thousands of U.S. Dollars
Contract or Contract orNotional NotionalAmount Fair Value Amount Fair Value
Interest rate contracts:
Futures written ......................................................................... ¥364,473 ¥365,428 $2,941,674 $2,949,385Futures purchased ..................................................................... 288,327 289,233 2,327,094 2,334,414Options written......................................................................... 163,900 8 1,322,841 67Options purchased .................................................................... 247,800 15 2,000,000 125
Bonds contracts:Futures written ......................................................................... 21,109 21,013 170,377 169,598Futures purchased ..................................................................... 27,560 27,611 222,441 222,849Futures options purchased ........................................................ 28,667 68 231,376 552
Equity contracts:
Futures written ......................................................................... 1,430 1,479 11,545 11,942Futures purchased ..................................................................... 1,420 1,479 11,469 11,942
The Bank and consolidated subsidiaries had the following derivatives contracts, which were not quoted on listed exchanges,
outstanding at March 31, 2001:
Millions of Yen Thousands of U.S. Dollars
Contract or Contract orNotional NotionalAmount Fair Value Amount Fair Value
Interest rate contracts:Interest rate swaps:
Receive fixed and pay floating ............................................... ¥8,067,419 ¥ 236,014 $65,112,343 $ 1,904,876Receive floating and pay fixed ............................................... 8,418,733 (240,216) 67,947,806 (1,938,791)
Other written ........................................................................... 268,459 2,166,743 4Other purchased ...................................................................... 237,000 1,440 1,912,833 11,626
Foreign exchange—Currency swaps ............................................. 238,355 (1,541) 1,923,773 (12,440)
The contracts or notional amounts of derivatives which are shown in the above table do not represent the amounts exchangedby the parties and do not measure the exposure of the Bank and consolidated subsidiaries to credit or market risk.
Derivative transactions for trading purposes are stated at market value in the accompanying consolidated financial statements.
25. SUBSEQUENT EVENT—APPROPRIATION OF EARNED SURPLUS
The following plan of the Bank for the appropriation of earned surplus was approved at the ordinary stockholders meeting held onJune 22, 2001:
Thousands ofMillions of Yen U.S. Dollars
Appropriations—Legal reserve ................................................................................................... ¥ 370 $ 2,991Year-end dividends:
The fourth preferred, ¥5 ($0.04) per share ............................................................................. 240 1,943The fifth preferred, ¥1.86 ($0.02) per share ........................................................................... 1,612 13,010
Total .......................................................................................................................................... ¥2,223 $17,944
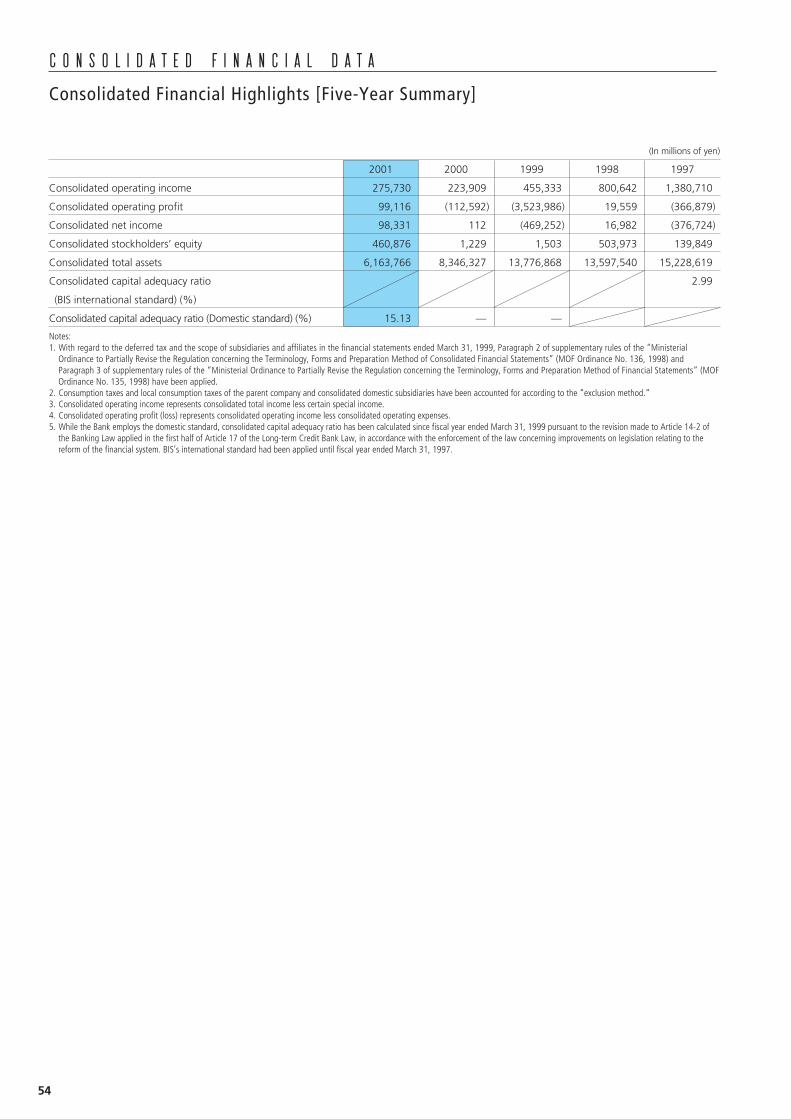
54
Consolidated Financial Highlights [Five-Year Summary]
(In millions of yen)
2001 2000 1999 1998 1997
Consolidated operating income 275,730 223,909 455,333 800,642 1,380,710
Consolidated operating profit 99,116 (112,592) (3,523,986) 19,559 (366,879)
Consolidated net income 98,331 112 (469,252) 16,982 (376,724)
Consolidated stockholders’ equity 460,876 1,229 1,503 503,973 139,849
Consolidated total assets 6,163,766 8,346,327 13,776,868 13,597,540 15,228,619
Consolidated capital adequacy ratio 2.99
(BIS international standard) (%)
Consolidated capital adequacy ratio (Domestic standard) (%) 15.13 — —
Notes:1. With regard to the deferred tax and the scope of subsidiaries and affiliates in the financial statements ended March 31, 1999, Paragraph 2 of supplementary rules of the “Ministerial
Ordinance to Partially Revise the Regulation concerning the Terminology, Forms and Preparation Method of Consolidated Financial Statements” (MOF Ordinance No. 136, 1998) andParagraph 3 of supplementary rules of the “Ministerial Ordinance to Partially Revise the Regulation concerning the Terminology, Forms and Preparation Method of Financial Statements” (MOFOrdinance No. 135, 1998) have been applied.
2. Consumption taxes and local consumption taxes of the parent company and consolidated domestic subsidiaries have been accounted for according to the “exclusion method.”3. Consolidated operating income represents consolidated total income less certain special income.4. Consolidated operating profit (loss) represents consolidated operating income less consolidated operating expenses.5. While the Bank employs the domestic standard, consolidated capital adequacy ratio has been calculated since fiscal year ended March 31, 1999 pursuant to the revision made to Article 14-2 of
the Banking Law applied in the first half of Article 17 of the Long-term Credit Bank Law, in accordance with the enforcement of the law concerning improvements on legislation relating to thereform of the financial system. BIS’s international standard had been applied until fiscal year ended March 31, 1997.
C O N S O L I D A T E D F I N A N C I A L D A T A
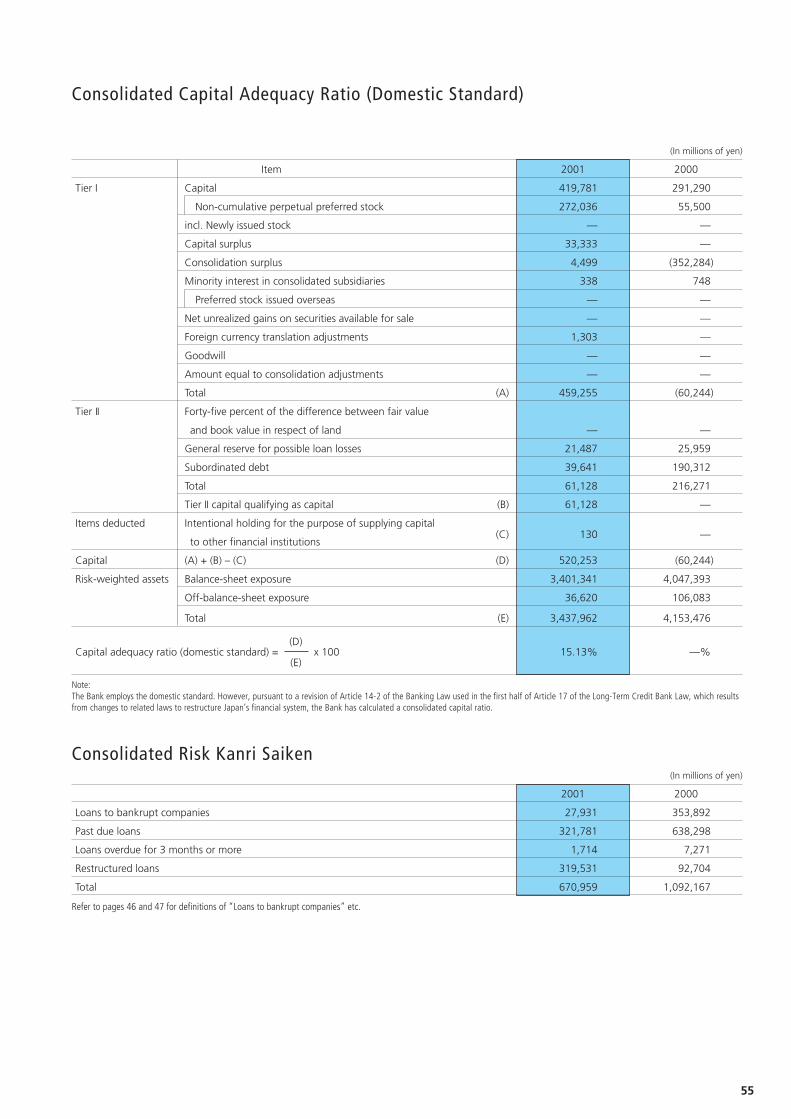
55
Consolidated Capital Adequacy Ratio (Domestic Standard)
(In millions of yen)
Item 2001 2000
Tier I Capital 419,781 291,290
Non-cumulative perpetual preferred stock 272,036 55,500
incl. Newly issued stock — —
Capital surplus 33,333 —
Consolidation surplus 4,499 (352,284)
Minority interest in consolidated subsidiaries 338 748
Preferred stock issued overseas — —
Net unrealized gains on securities available for sale — —
Foreign currency translation adjustments 1,303 —
Goodwill — —
Amount equal to consolidation adjustments — —
Total (A) 459,255 (60,244)
Tier II Forty-five percent of the difference between fair value
and book value in respect of land — —
General reserve for possible loan losses 21,487 25,959
Subordinated debt 39,641 190,312
Total 61,128 216,271
Tier II capital qualifying as capital (B) 61,128 —
Items deducted Intentional holding for the purpose of supplying capital
to other financial institutions(C) 130 —
Capital (A) + (B) – (C) (D) 520,253 (60,244)
Risk-weighted assets Balance-sheet exposure 3,401,341 4,047,393
Off-balance-sheet exposure 36,620 106,083
Total (E) 3,437,962 4,153,476
(D)Capital adequacy ratio (domestic standard) = x 100 15.13% —%
(E)
Note:The Bank employs the domestic standard. However, pursuant to a revision of Article 14-2 of the Banking Law used in the first half of Article 17 of the Long-Term Credit Bank Law, which resultsfrom changes to related laws to restructure Japan’s financial system, the Bank has calculated a consolidated capital ratio.
Consolidated Risk Kanri Saiken(In millions of yen)
2001 2000
Loans to bankrupt companies 27,931 353,892
Past due loans 321,781 638,298
Loans overdue for 3 months or more 1,714 7,271
Restructured loans 319,531 92,704
Total 670,959 1,092,167
Refer to pages 46 and 47 for definitions of “Loans to bankrupt companies” etc.
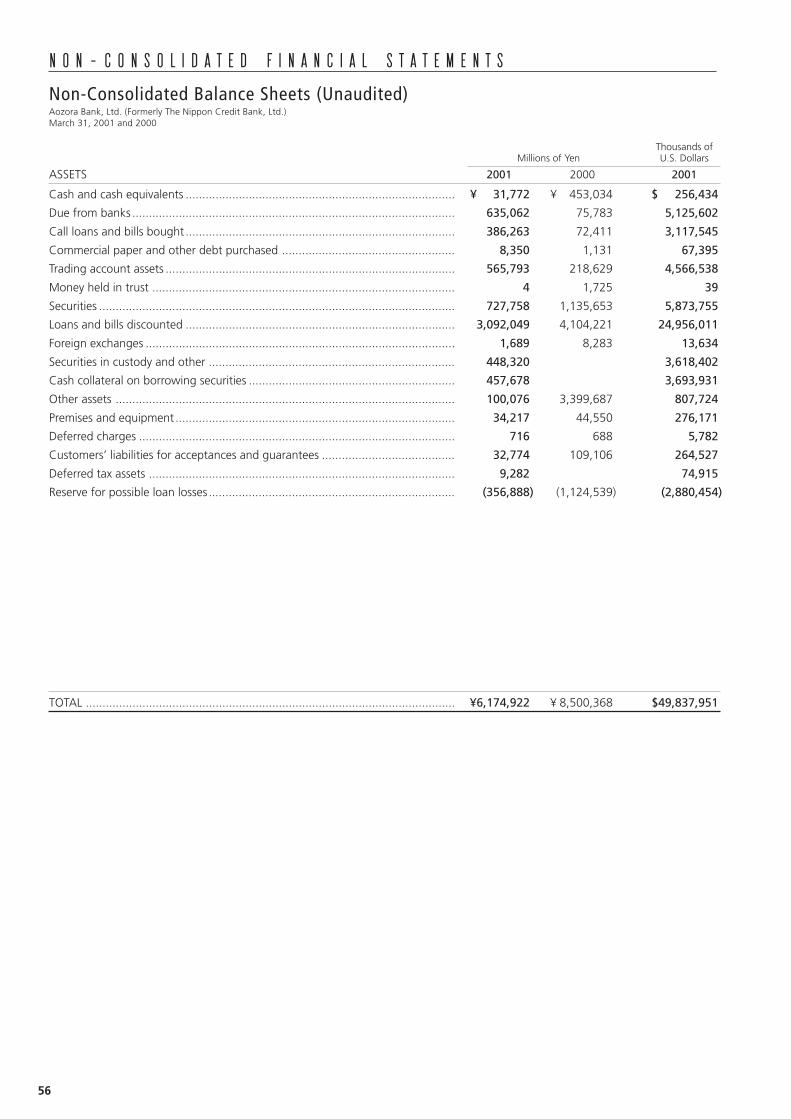
56
Thousands ofMillions of Yen U.S. Dollars
ASSETS 2001 2000 2001
Cash and cash equivalents ................................................................................. ¥ 31,772 ¥ 453,034 $ 256,434
Due from banks ................................................................................................. 635,062 75,783 5,125,602
Call loans and bills bought ................................................................................. 386,263 72,411 3,117,545
Commercial paper and other debt purchased .................................................... 8,350 1,131 67,395
Trading account assets ....................................................................................... 565,793 218,629 4,566,538
Money held in trust ........................................................................................... 4 1,725 39
Securities ........................................................................................................... 727,758 1,135,653 5,873,755
Loans and bills discounted ................................................................................. 3,092,049 4,104,221 24,956,011
Foreign exchanges ............................................................................................. 1,689 8,283 13,634
Securities in custody and other .......................................................................... 448,320 3,618,402
Cash collateral on borrowing securities .............................................................. 457,678 3,693,931
Other assets ...................................................................................................... 100,076 3,399,687 807,724
Premises and equipment .................................................................................... 34,217 44,550 276,171
Deferred charges ............................................................................................... 716 688 5,782
Customers’ liabilities for acceptances and guarantees ........................................ 32,774 109,106 264,527
Deferred tax assets ............................................................................................ 9,282 74,915
Reserve for possible loan losses .......................................................................... (356,888) (1,124,539) (2,880,454)
TOTAL ............................................................................................................... ¥6,174,922 ¥ 8,500,368 $49,837,951
Non-Consolidated Balance Sheets (Unaudited)Aozora Bank, Ltd. (Formerly The Nippon Credit Bank, Ltd.)March 31, 2001 and 2000
N O N – C O N S O L I D A T E D F I N A N C I A L S T A T E M E N T S
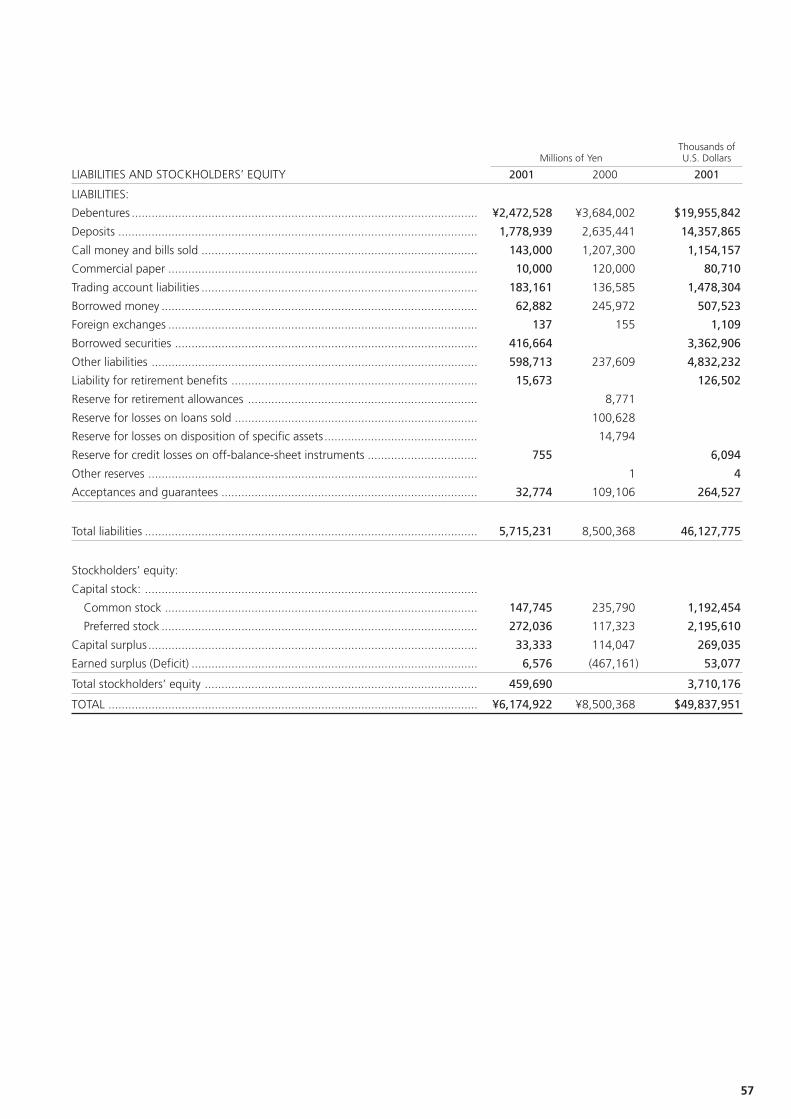
57
Thousands ofMillions of Yen U.S. Dollars
LIABILITIES AND STOCKHOLDERS’ EQUITY 2001 2000 2001
LIABILITIES:
Debentures ........................................................................................................ ¥2,472,528 ¥3,684,002 $19,955,842
Deposits ............................................................................................................ 1,778,939 2,635,441 14,357,865
Call money and bills sold ................................................................................... 143,000 1,207,300 1,154,157
Commercial paper ............................................................................................. 10,000 120,000 80,710
Trading account liabilities ................................................................................... 183,161 136,585 1,478,304
Borrowed money ............................................................................................... 62,882 245,972 507,523
Foreign exchanges ............................................................................................. 137 155 1,109
Borrowed securities ........................................................................................... 416,664 3,362,906
Other liabilities .................................................................................................. 598,713 237,609 4,832,232
Liability for retirement benefits .......................................................................... 15,673 126,502
Reserve for retirement allowances ..................................................................... 8,771
Reserve for losses on loans sold ......................................................................... 100,628
Reserve for losses on disposition of specific assets .............................................. 14,794
Reserve for credit losses on off-balance-sheet instruments ................................. 755 6,094
Other reserves ................................................................................................... 1 4
Acceptances and guarantees ............................................................................. 32,774 109,106 264,527
Total liabilities .................................................................................................... 5,715,231 8,500,368 46,127,775
Stockholders’ equity:
Capital stock: ....................................................................................................
Common stock .............................................................................................. 147,745 235,790 1,192,454
Preferred stock ............................................................................................... 272,036 117,323 2,195,610
Capital surplus ................................................................................................... 33,333 114,047 269,035
Earned surplus (Deficit) ...................................................................................... 6,576 (467,161) 53,077
Total stockholders’ equity .................................................................................. 459,690 3,710,176
TOTAL ............................................................................................................... ¥6,174,922 ¥8,500,368 $49,837,951
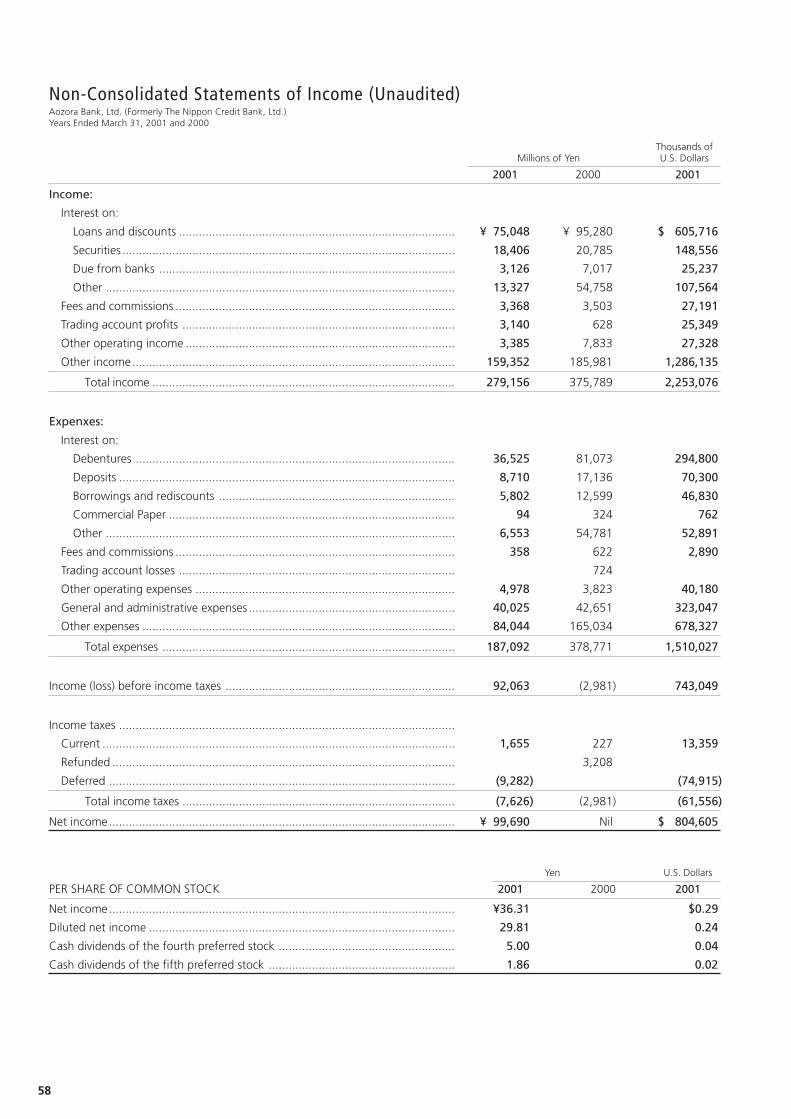
58
Non-Consolidated Statements of Income (Unaudited)Aozora Bank, Ltd. (Formerly The Nippon Credit Bank, Ltd.)Years Ended March 31, 2001 and 2000
Thousands ofMillions of Yen U.S. Dollars
2001 2000 2001
Income:
Interest on:
Loans and discounts ................................................................................... ¥ 75,048 ¥ 95,280 $ 605,716
Securities .................................................................................................... 18,406 20,785 148,556
Due from banks ......................................................................................... 3,126 7,017 25,237
Other ......................................................................................................... 13,327 54,758 107,564
Fees and commissions .................................................................................... 3,368 3,503 27,191
Trading account profits .................................................................................. 3,140 628 25,349
Other operating income ................................................................................. 3,385 7,833 27,328
Other income................................................................................................. 159,352 185,981 1,286,135
Total income ........................................................................................... 279,156 375,789 2,253,076
Expenxes:
Interest on:
Debentures ................................................................................................ 36,525 81,073 294,800
Deposits ..................................................................................................... 8,710 17,136 70,300
Borrowings and rediscounts ....................................................................... 5,802 12,599 46,830
Commercial Paper ...................................................................................... 94 324 762
Other ......................................................................................................... 6,553 54,781 52,891
Fees and commissions .................................................................................... 358 622 2,890
Trading account losses ................................................................................... 724
Other operating expenses .............................................................................. 4,978 3,823 40,180
General and administrative expenses .............................................................. 40,025 42,651 323,047
Other expenses .............................................................................................. 84,044 165,034 678,327
Total expenses ........................................................................................ 187,092 378,771 1,510,027
Income (loss) before income taxes ..................................................................... 92,063 (2,981) 743,049
Income taxes .....................................................................................................
Current .......................................................................................................... 1,655 227 13,359
Refunded ....................................................................................................... 3,208
Deferred ........................................................................................................ (9,282) (74,915)
Total income taxes .................................................................................. (7,626) (2,981) (61,556)
Net income........................................................................................................ ¥ 99,690 Nil $ 804,605
Yen U.S. Dollars
PER SHARE OF COMMON STOCK 2001 2000 2001
Net income........................................................................................................ ¥36.31 $0.29
Diluted net income ............................................................................................ 29.81 0.24
Cash dividends of the fourth preferred stock ..................................................... 5.00 0.04
Cash dividends of the fifth preferred stock ........................................................ 1.86 0.02
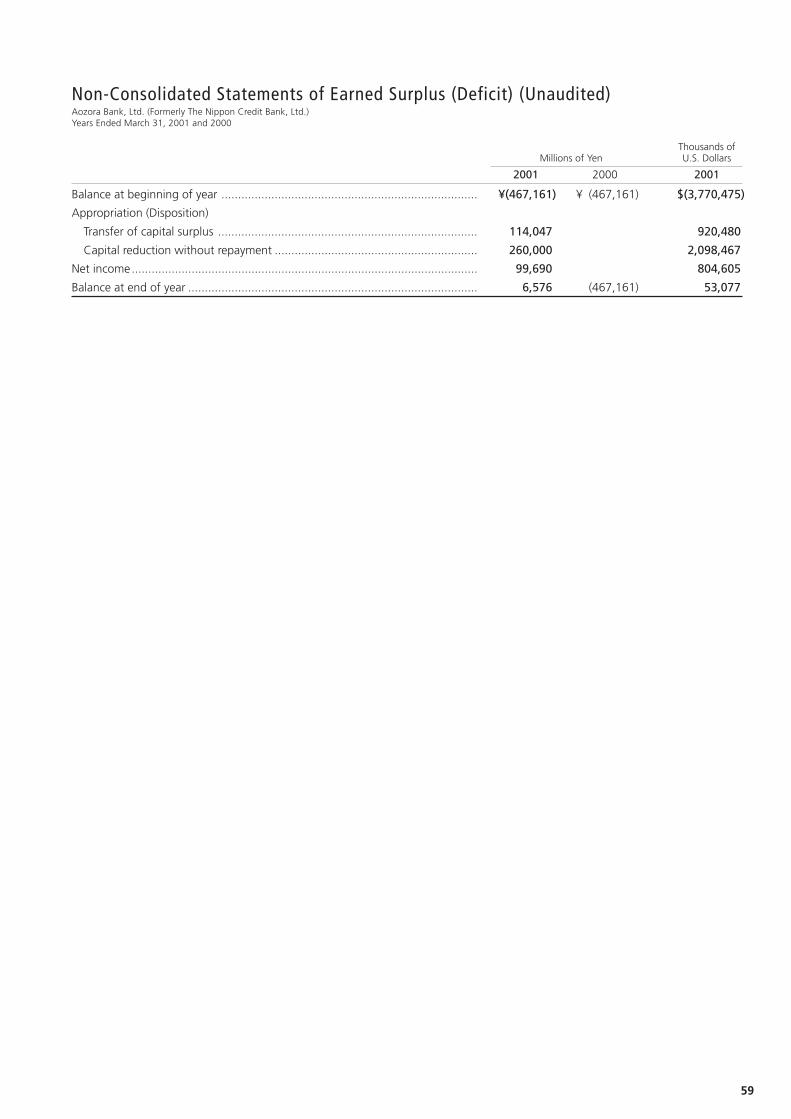
59
Non-Consolidated Statements of Earned Surplus (Deficit) (Unaudited)Aozora Bank, Ltd. (Formerly The Nippon Credit Bank, Ltd.)Years Ended March 31, 2001 and 2000
Thousands ofMillions of Yen U.S. Dollars
2001 2000 2001
Balance at beginning of year ............................................................................. ¥(467,161) ¥ (467,161) $(3,770,475)
Appropriation (Disposition)
Transfer of capital surplus .............................................................................. 114,047 920,480
Capital reduction without repayment ............................................................. 260,000 2,098,467
Net income........................................................................................................ 99,690 804,605
Balance at end of year ....................................................................................... 6,576 (467,161) 53,077
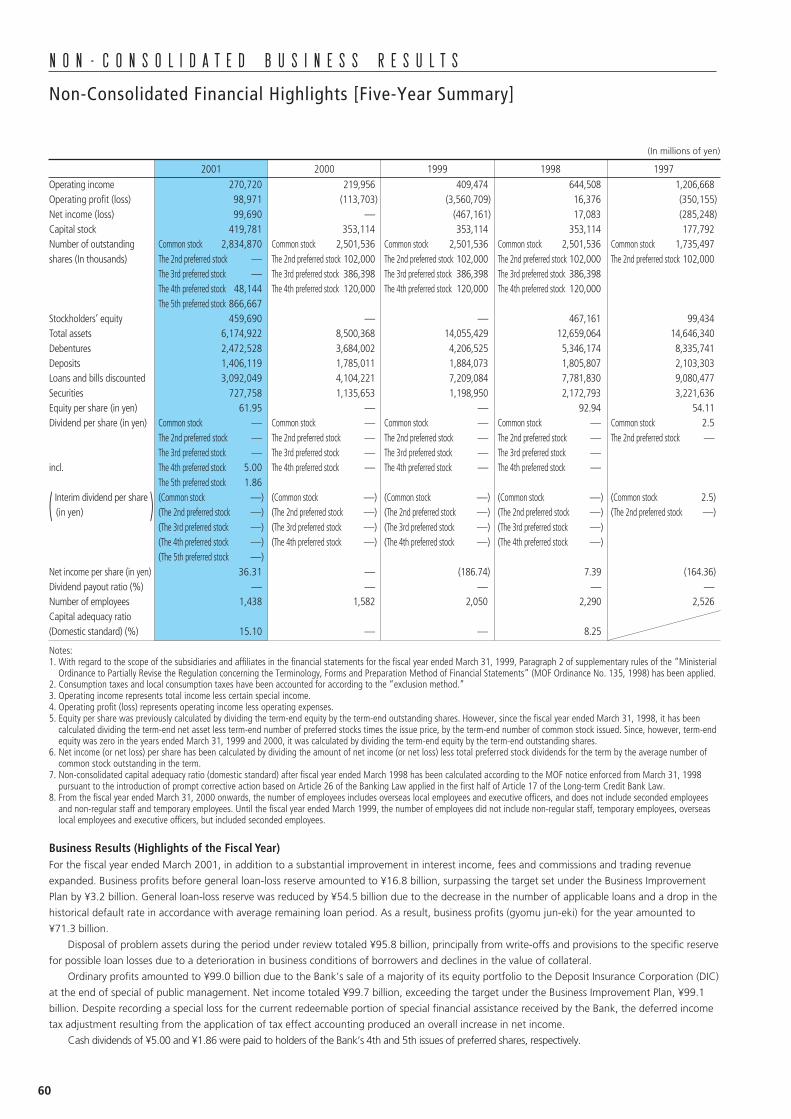
60
(In millions of yen)
2001 2000 1999 1998 1997
Operating income 270,720 219,956 409,474 644,508 1,206,668Operating profit (loss) 98,971 (113,703) (3,560,709) 16,376 (350,155)Net income (loss) 99,690 — (467,161) 17,083 (285,248)Capital stock 419,781 353,114 353,114 353,114 177,792Number of outstanding Common stock 2,834,870 Common stock 2,501,536 Common stock 2,501,536 Common stock 2,501,536 Common stock 1,735,497shares (In thousands) The 2nd preferred stock — The 2nd preferred stock 102,000 The 2nd preferred stock 102,000 The 2nd preferred stock 102,000 The 2nd preferred stock 102,000
The 3rd preferred stock — The 3rd preferred stock 386,398 The 3rd preferred stock 386,398 The 3rd preferred stock 386,398The 4th preferred stock 48,144 The 4th preferred stock 120,000 The 4th preferred stock 120,000 The 4th preferred stock 120,000The 5th preferred stock 866,667
Stockholders’ equity 459,690 — — 467,161 99,434Total assets 6,174,922 8,500,368 14,055,429 12,659,064 14,646,340Debentures 2,472,528 3,684,002 4,206,525 5,346,174 8,335,741Deposits 1,406,119 1,785,011 1,884,073 1,805,807 2,103,303Loans and bills discounted 3,092,049 4,104,221 7,209,084 7,781,830 9,080,477Securities 727,758 1,135,653 1,198,950 2,172,793 3,221,636Equity per share (in yen) 61.95 — — 92.94 54.11Dividend per share (in yen) Common stock — Common stock — Common stock — Common stock — Common stock 2.5
The 2nd preferred stock — The 2nd preferred stock — The 2nd preferred stock — The 2nd preferred stock — The 2nd preferred stock —The 3rd preferred stock — The 3rd preferred stock — The 3rd preferred stock — The 3rd preferred stock —
incl. The 4th preferred stock 5.00 The 4th preferred stock — The 4th preferred stock — The 4th preferred stock —The 5th preferred stock 1.86
( Interim dividend per share ) (Common stock —) (Common stock —) (Common stock —) (Common stock —) (Common stock 2.5)(in yen) (The 2nd preferred stock —) (The 2nd preferred stock —) (The 2nd preferred stock —) (The 2nd preferred stock —) (The 2nd preferred stock —)
(The 3rd preferred stock —) (The 3rd preferred stock —) (The 3rd preferred stock —) (The 3rd preferred stock —)(The 4th preferred stock —) (The 4th preferred stock —) (The 4th preferred stock —) (The 4th preferred stock —)(The 5th preferred stock —)
Net income per share (in yen) 36.31 — (186.74) 7.39 (164.36)Dividend payout ratio (%) — — — — —Number of employees 1,438 1,582 2,050 2,290 2,526Capital adequacy ratio(Domestic standard) (%) 15.10 — — 8.25
Notes:1. With regard to the scope of the subsidiaries and affiliates in the financial statements for the fiscal year ended March 31, 1999, Paragraph 2 of supplementary rules of the “Ministerial
Ordinance to Partially Revise the Regulation concerning the Terminology, Forms and Preparation Method of Financial Statements” (MOF Ordinance No. 135, 1998) has been applied.2. Consumption taxes and local consumption taxes have been accounted for according to the “exclusion method.”3. Operating income represents total income less certain special income.4. Operating profit (loss) represents operating income less operating expenses.5. Equity per share was previously calculated by dividing the term-end equity by the term-end outstanding shares. However, since the fiscal year ended March 31, 1998, it has been
calculated dividing the term-end net asset less term-end number of preferred stocks times the issue price, by the term-end number of common stock issued. Since, however, term-endequity was zero in the years ended March 31, 1999 and 2000, it was calculated by dividing the term-end equity by the term-end outstanding shares.
6. Net income (or net loss) per share has been calculated by dividing the amount of net income (or net loss) less total preferred stock dividends for the term by the average number ofcommon stock outstanding in the term.
7. Non-consolidated capital adequacy ratio (domestic standard) after fiscal year ended March 1998 has been calculated according to the MOF notice enforced from March 31, 1998pursuant to the introduction of prompt corrective action based on Article 26 of the Banking Law applied in the first half of Article 17 of the Long-term Credit Bank Law.
8. From the fiscal year ended March 31, 2000 onwards, the number of employees includes overseas local employees and executive officers, and does not include seconded employeesand non-regular staff and temporary employees. Until the fiscal year ended March 1999, the number of employees did not include non-regular staff, temporary employees, overseaslocal employees and executive officers, but included seconded employees.
Business Results (Highlights of the Fiscal Year)For the fiscal year ended March 2001, in addition to a substantial improvement in interest income, fees and commissions and trading revenue
expanded. Business profits before general loan-loss reserve amounted to ¥16.8 billion, surpassing the target set under the Business Improvement
Plan by ¥3.2 billion. General loan-loss reserve was reduced by ¥54.5 billion due to the decrease in the number of applicable loans and a drop in the
historical default rate in accordance with average remaining loan period. As a result, business profits (gyomu jun-eki) for the year amounted to
¥71.3 billion.
Disposal of problem assets during the period under review totaled ¥95.8 billion, principally from write-offs and provisions to the specific reserve
for possible loan losses due to a deterioration in business conditions of borrowers and declines in the value of collateral.
Ordinary profits amounted to ¥99.0 billion due to the Bank’s sale of a majority of its equity portfolio to the Deposit Insurance Corporation (DIC)
at the end of special of public management. Net income totaled ¥99.7 billion, exceeding the target under the Business Improvement Plan, ¥99.1
billion. Despite recording a special loss for the current redeemable portion of special financial assistance received by the Bank, the deferred income
tax adjustment resulting from the application of tax effect accounting produced an overall increase in net income.
Cash dividends of ¥5.00 and ¥1.86 were paid to holders of the Bank’s 4th and 5th issues of preferred shares, respectively.
Non-Consolidated Financial Highlights [Five-Year Summary]
N O N - C O N S O L I D A T E D B U S I N E S S R E S U L T S
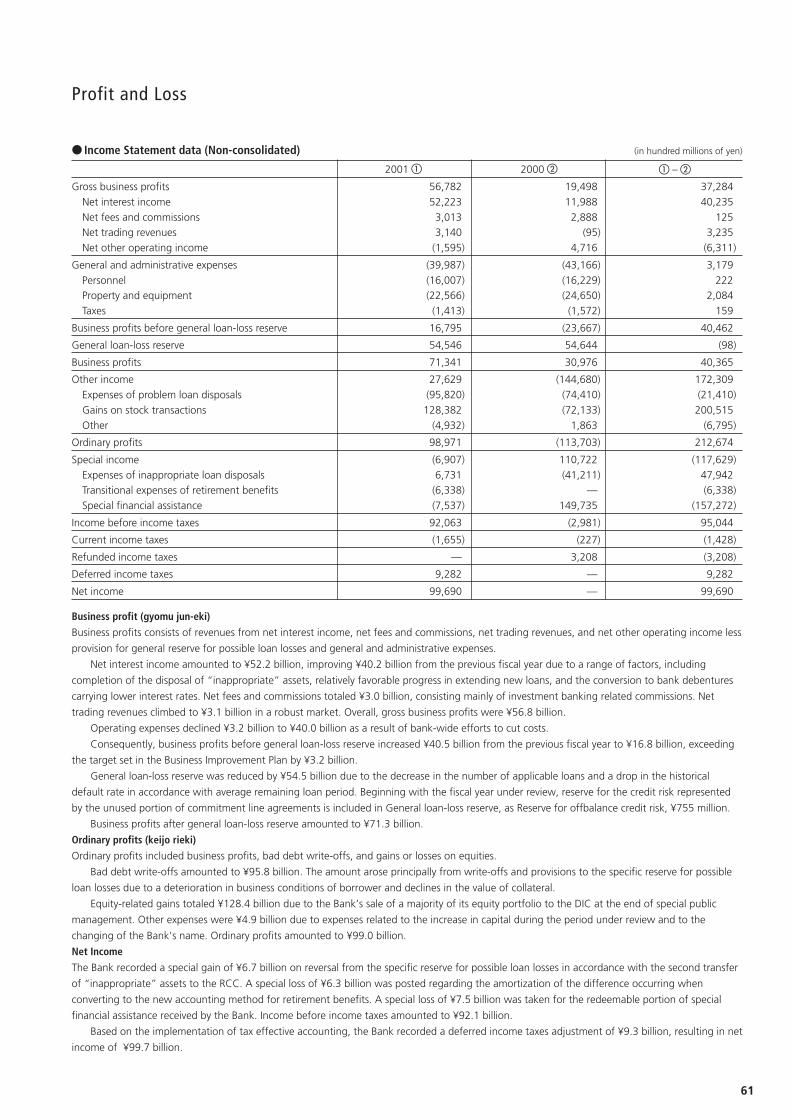
61
● Income Statement data (Non-consolidated) (in hundred millions of yen)
2001 � 2000 � � – �
Gross business profits 56,782 19,498 37,284Net interest income 52,223 11,988 40,235Net fees and commissions 3,013 2,888 125Net trading revenues 3,140 (95) 3,235Net other operating income (1,595) 4,716 (6,311)
General and administrative expenses (39,987) (43,166) 3,179Personnel (16,007) (16,229) 222Property and equipment (22,566) (24,650) 2,084Taxes (1,413) (1,572) 159
Business profits before general loan-loss reserve 16,795 (23,667) 40,462
General loan-loss reserve 54,546 54,644 (98)
Business profits 71,341 30,976 40,365
Other income 27,629 (144,680) 172,309Expenses of problem loan disposals (95,820) (74,410) (21,410)Gains on stock transactions 128,382 (72,133) 200,515Other (4,932) 1,863 (6,795)
Ordinary profits 98,971 (113,703) 212,674
Special income (6,907) 110,722 (117,629)Expenses of inappropriate loan disposals 6,731 (41,211) 47,942Transitional expenses of retirement benefits (6,338) — (6,338)Special financial assistance (7,537) 149,735 (157,272)
Income before income taxes 92,063 (2,981) 95,044
Current income taxes (1,655) (227) (1,428)
Refunded income taxes — 3,208 (3,208)
Deferred income taxes 9,282 — 9,282
Net income 99,690 — 99,690
Business profit (gyomu jun-eki)
Business profits consists of revenues from net interest income, net fees and commissions, net trading revenues, and net other operating income less
provision for general reserve for possible loan losses and general and administrative expenses.
Net interest income amounted to ¥52.2 billion, improving ¥40.2 billion from the previous fiscal year due to a range of factors, including
completion of the disposal of “inappropriate” assets, relatively favorable progress in extending new loans, and the conversion to bank debentures
carrying lower interest rates. Net fees and commissions totaled ¥3.0 billion, consisting mainly of investment banking related commissions. Net
trading revenues climbed to ¥3.1 billion in a robust market. Overall, gross business profits were ¥56.8 billion.
Operating expenses declined ¥3.2 billion to ¥40.0 billion as a result of bank-wide efforts to cut costs.
Consequently, business profits before general loan-loss reserve increased ¥40.5 billion from the previous fiscal year to ¥16.8 billion, exceeding
the target set in the Business Improvement Plan by ¥3.2 billion.
General loan-loss reserve was reduced by ¥54.5 billion due to the decrease in the number of applicable loans and a drop in the historical
default rate in accordance with average remaining loan period. Beginning with the fiscal year under review, reserve for the credit risk represented
by the unused portion of commitment line agreements is included in General loan-loss reserve, as Reserve for offbalance credit risk, ¥755 million.
Business profits after general loan-loss reserve amounted to ¥71.3 billion.
Ordinary profits (keijo rieki)
Ordinary profits included business profits, bad debt write-offs, and gains or losses on equities.
Bad debt write-offs amounted to ¥95.8 billion. The amount arose principally from write-offs and provisions to the specific reserve for possible
loan losses due to a deterioration in business conditions of borrower and declines in the value of collateral.
Equity-related gains totaled ¥128.4 billion due to the Bank’s sale of a majority of its equity portfolio to the DIC at the end of special public
management. Other expenses were ¥4.9 billion due to expenses related to the increase in capital during the period under review and to the
changing of the Bank’s name. Ordinary profits amounted to ¥99.0 billion.
Net Income
The Bank recorded a special gain of ¥6.7 billion on reversal from the specific reserve for possible loan losses in accordance with the second transfer
of “inappropriate” assets to the RCC. A special loss of ¥6.3 billion was posted regarding the amortization of the difference occurring when
converting to the new accounting method for retirement benefits. A special loss of ¥7.5 billion was taken for the redeemable portion of special
financial assistance received by the Bank. Income before income taxes amounted to ¥92.1 billion.
Based on the implementation of tax effective accounting, the Bank recorded a deferred income taxes adjustment of ¥9.3 billion, resulting in net
income of ¥99.7 billion.
Profit and Loss
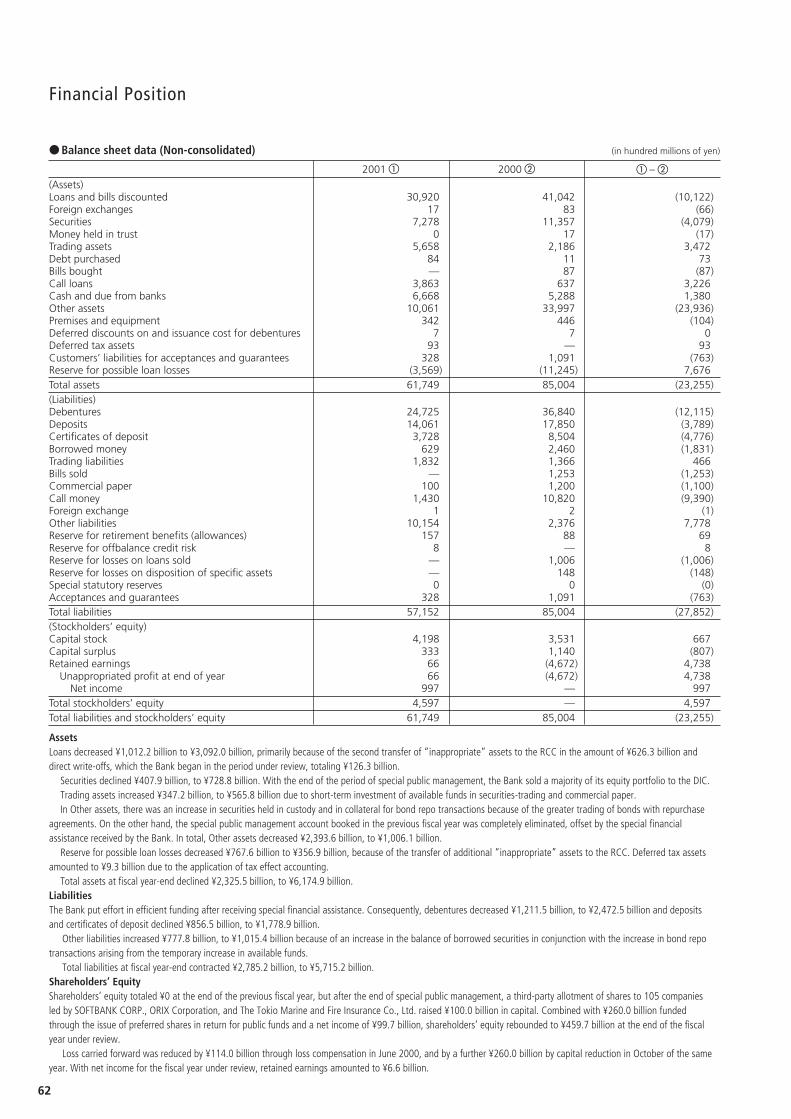
62
● Balance sheet data (Non-consolidated) (in hundred millions of yen)
2001 � 2000 � � – �
(Assets)Loans and bills discounted 30,920 41,042 (10,122)Foreign exchanges 17 83 (66)Securities 7,278 11,357 (4,079)Money held in trust 0 17 (17)Trading assets 5,658 2,186 3,472Debt purchased 84 11 73Bills bought — 87 (87)Call loans 3,863 637 3,226Cash and due from banks 6,668 5,288 1,380Other assets 10,061 33,997 (23,936)Premises and equipment 342 446 (104)Deferred discounts on and issuance cost for debentures 7 7 0Deferred tax assets 93 — 93Customers’ liabilities for acceptances and guarantees 328 1,091 (763)Reserve for possible loan losses (3,569) (11,245) 7,676Total assets 61,749 85,004 (23,255)(Liabilities)Debentures 24,725 36,840 (12,115)Deposits 14,061 17,850 (3,789)Certificates of deposit 3,728 8,504 (4,776)Borrowed money 629 2,460 (1,831)Trading liabilities 1,832 1,366 466Bills sold — 1,253 (1,253)Commercial paper 100 1,200 (1,100)Call money 1,430 10,820 (9,390)Foreign exchange 1 2 (1)Other liabilities 10,154 2,376 7,778Reserve for retirement benefits (allowances) 157 88 69Reserve for offbalance credit risk 8 — 8Reserve for losses on loans sold — 1,006 (1,006)Reserve for losses on disposition of specific assets — 148 (148)Special statutory reserves 0 0 (0)Acceptances and guarantees 328 1,091 (763)Total liabilities 57,152 85,004 (27,852)(Stockholders’ equity)Capital stock 4,198 3,531 667Capital surplus 333 1,140 (807)Retained earnings 66 (4,672) 4,738
Unappropriated profit at end of year 66 (4,672) 4,738Net income 997 — 997
Total stockholders’ equity 4,597 — 4,597Total liabilities and stockholders’ equity 61,749 85,004 (23,255)
AssetsLoans decreased ¥1,012.2 billion to ¥3,092.0 billion, primarily because of the second transfer of “inappropriate” assets to the RCC in the amount of ¥626.3 billion anddirect write-offs, which the Bank began in the period under review, totaling ¥126.3 billion.
Securities declined ¥407.9 billion, to ¥728.8 billion. With the end of the period of special public management, the Bank sold a majority of its equity portfolio to the DIC.Trading assets increased ¥347.2 billion, to ¥565.8 billion due to short-term investment of available funds in securities-trading and commercial paper.In Other assets, there was an increase in securities held in custody and in collateral for bond repo transactions because of the greater trading of bonds with repurchase
agreements. On the other hand, the special public management account booked in the previous fiscal year was completely eliminated, offset by the special financialassistance received by the Bank. In total, Other assets decreased ¥2,393.6 billion, to ¥1,006.1 billion.
Reserve for possible loan losses decreased ¥767.6 billion to ¥356.9 billion, because of the transfer of additional “inappropriate” assets to the RCC. Deferred tax assetsamounted to ¥9.3 billion due to the application of tax effect accounting.
Total assets at fiscal year-end declined ¥2,325.5 billion, to ¥6,174.9 billion.LiabilitiesThe Bank put effort in efficient funding after receiving special financial assistance. Consequently, debentures decreased ¥1,211.5 billion, to ¥2,472.5 billion and depositsand certificates of deposit declined ¥856.5 billion, to ¥1,778.9 billion.
Other liabilities increased ¥777.8 billion, to ¥1,015.4 billion because of an increase in the balance of borrowed securities in conjunction with the increase in bond repotransactions arising from the temporary increase in available funds.
Total liabilities at fiscal year-end contracted ¥2,785.2 billion, to ¥5,715.2 billion.Shareholders’ EquityShareholders’ equity totaled ¥0 at the end of the previous fiscal year, but after the end of special public management, a third-party allotment of shares to 105 companiesled by SOFTBANK CORP., ORIX Corporation, and The Tokio Marine and Fire Insurance Co., Ltd. raised ¥100.0 billion in capital. Combined with ¥260.0 billion fundedthrough the issue of preferred shares in return for public funds and a net income of ¥99.7 billion, shareholders’ equity rebounded to ¥459.7 billion at the end of the fiscalyear under review.
Loss carried forward was reduced by ¥114.0 billion through loss compensation in June 2000, and by a further ¥260.0 billion by capital reduction in October of the sameyear. With net income for the fiscal year under review, retained earnings amounted to ¥6.6 billion.
Financial Position
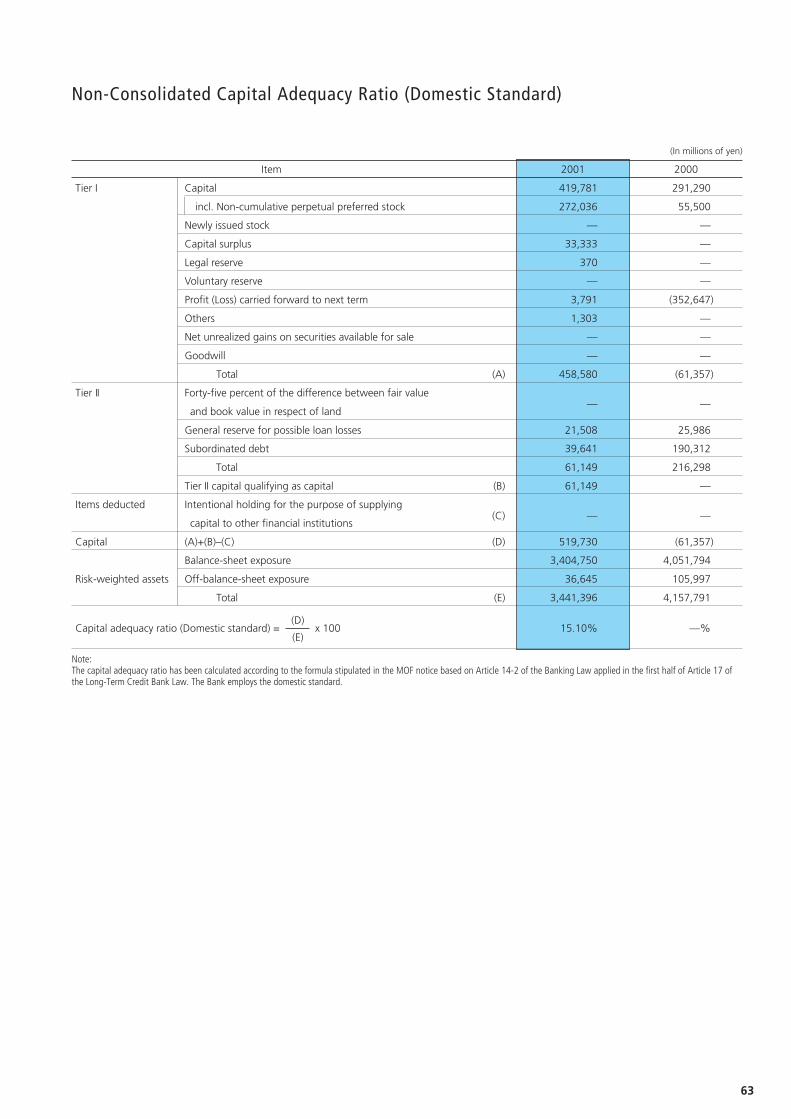
63
(In millions of yen)
Item 2001 2000
Tier I Capital 419,781 291,290
incl. Non-cumulative perpetual preferred stock 272,036 55,500
Newly issued stock — —
Capital surplus 33,333 —
Legal reserve 370 —
Voluntary reserve — —
Profit (Loss) carried forward to next term 3,791 (352,647)
Others 1,303 —
Net unrealized gains on securities available for sale — —
Goodwill — —
Total (A) 458,580 (61,357)
Tier II Forty-five percent of the difference between fair value
and book value in respect of land— —
General reserve for possible loan losses 21,508 25,986
Subordinated debt 39,641 190,312
Total 61,149 216,298
Tier II capital qualifying as capital (B) 61,149 —
Items deducted Intentional holding for the purpose of supplying
capital to other financial institutions (C) — —
Capital (A)+(B)–(C) (D) 519,730 (61,357)
Balance-sheet exposure 3,404,750 4,051,794
Risk-weighted assets Off-balance-sheet exposure 36,645 105,997
Total (E) 3,441,396 4,157,791
(D)Capital adequacy ratio (Domestic standard) = x 100 15.10% —%
(E)
Note:The capital adequacy ratio has been calculated according to the formula stipulated in the MOF notice based on Article 14-2 of the Banking Law applied in the first half of Article 17 ofthe Long-Term Credit Bank Law. The Bank employs the domestic standard.
Non-Consolidated Capital Adequacy Ratio (Domestic Standard)
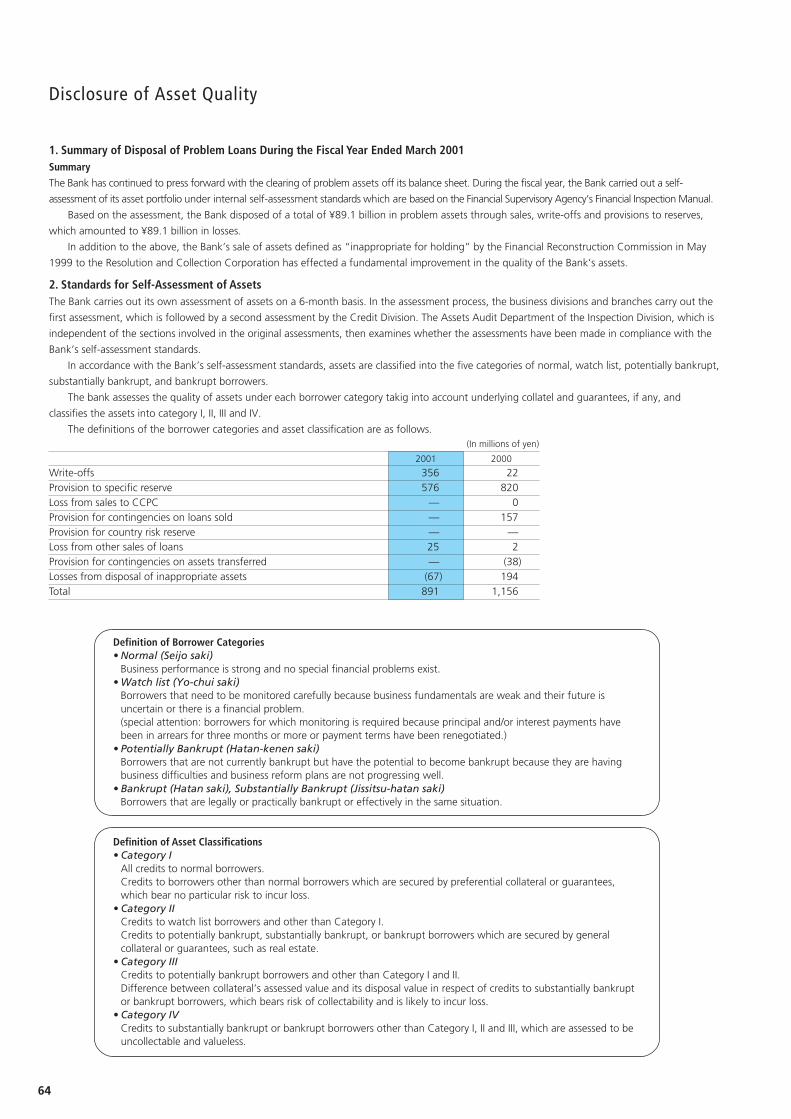
64
Disclosure of Asset Quality
1. Summary of Disposal of Problem Loans During the Fiscal Year Ended March 2001Summary
The Bank has continued to press forward with the clearing of problem assets off its balance sheet. During the fiscal year, the Bank carried out a self-
assessment of its asset portfolio under internal self-assessment standards which are based on the Financial Supervisory Agency’s Financial Inspection Manual.
Based on the assessment, the Bank disposed of a total of ¥89.1 billion in problem assets through sales, write-offs and provisions to reserves,
which amounted to ¥89.1 billion in losses.
In addition to the above, the Bank’s sale of assets defined as “inappropriate for holding” by the Financial Reconstruction Commission in May
1999 to the Resolution and Collection Corporation has effected a fundamental improvement in the quality of the Bank’s assets.
2. Standards for Self-Assessment of AssetsThe Bank carries out its own assessment of assets on a 6-month basis. In the assessment process, the business divisions and branches carry out the
first assessment, which is followed by a second assessment by the Credit Division. The Assets Audit Department of the Inspection Division, which is
independent of the sections involved in the original assessments, then examines whether the assessments have been made in compliance with the
Bank’s self-assessment standards.
In accordance with the Bank’s self-assessment standards, assets are classified into the five categories of normal, watch list, potentially bankrupt,
substantially bankrupt, and bankrupt borrowers.
The bank assesses the quality of assets under each borrower category takig into account underlying collatel and guarantees, if any, and
classifies the assets into category I, II, III and IV.
The definitions of the borrower categories and asset classification are as follows.(In millions of yen)
2001 2000
Write-offs 356 22Provision to specific reserve 576 820Loss from sales to CCPC — 0Provision for contingencies on loans sold — 157Provision for country risk reserve — —Loss from other sales of loans 25 2Provision for contingencies on assets transferred — (38)Losses from disposal of inappropriate assets (67) 194Total 891 1,156
Definition of Borrower Categories• Normal (Seijo saki)
Business performance is strong and no special financial problems exist.• Watch list (Yo-chui saki)
Borrowers that need to be monitored carefully because business fundamentals are weak and their future isuncertain or there is a financial problem.(special attention: borrowers for which monitoring is required because principal and/or interest payments havebeen in arrears for three months or more or payment terms have been renegotiated.)
• Potentially Bankrupt (Hatan-kenen saki)Borrowers that are not currently bankrupt but have the potential to become bankrupt because they are havingbusiness difficulties and business reform plans are not progressing well.
• Bankrupt (Hatan saki), Substantially Bankrupt (Jissitsu-hatan saki)Borrowers that are legally or practically bankrupt or effectively in the same situation.
Definition of Asset Classifications• Category I
All credits to normal borrowers.Credits to borrowers other than normal borrowers which are secured by preferential collateral or guarantees,which bear no particular risk to incur loss.
• Category IICredits to watch list borrowers and other than Category I.Credits to potentially bankrupt, substantially bankrupt, or bankrupt borrowers which are secured by generalcollateral or guarantees, such as real estate.
• Category IIICredits to potentially bankrupt borrowers and other than Category I and II.Difference between collateral’s assessed value and its disposal value in respect of credits to substantially bankruptor bankrupt borrowers, which bears risk of collectability and is likely to incur loss.
• Category IVCredits to substantially bankrupt or bankrupt borrowers other than Category I, II and III, which are assessed to beuncollectable and valueless.
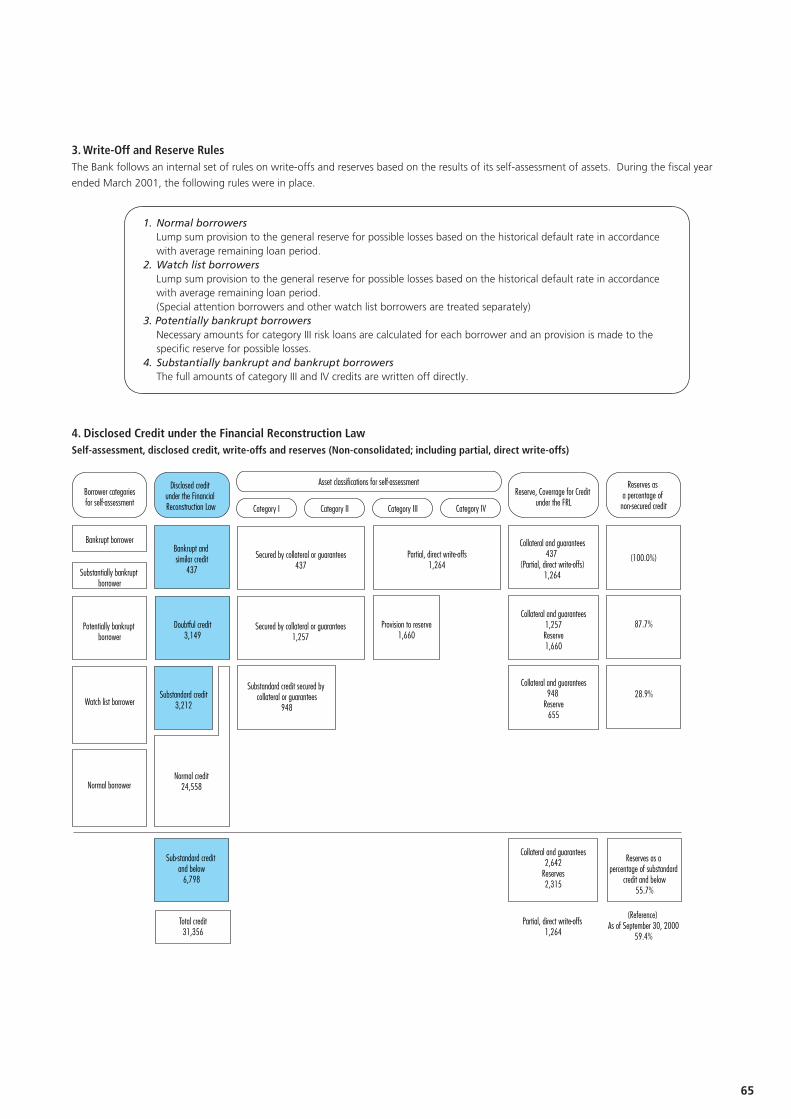
65
3. Write-Off and Reserve RulesThe Bank follows an internal set of rules on write-offs and reserves based on the results of its self-assessment of assets. During the fiscal year
ended March 2001, the following rules were in place.
1. Normal borrowersLump sum provision to the general reserve for possible losses based on the historical default rate in accordancewith average remaining loan period.
2. Watch list borrowersLump sum provision to the general reserve for possible losses based on the historical default rate in accordancewith average remaining loan period.(Special attention borrowers and other watch list borrowers are treated separately)
3. Potentially bankrupt borrowersNecessary amounts for category III risk loans are calculated for each borrower and an provision is made to thespecific reserve for possible losses.
4. Substantially bankrupt and bankrupt borrowersThe full amounts of category III and IV credits are written off directly.
4. Disclosed Credit under the Financial Reconstruction LawSelf-assessment, disclosed credit, write-offs and reserves (Non-consolidated; including partial, direct write-offs)
Bankrupt borrower
Substantially bankrupt borrower
Potentially bankrupt borrower
Watch list borrower
Normal borrower
Sub-standard credit and below
6,798
Total credit31,356
Bankrupt and similar credit
437
Doubtful credit3,149
Substandard credit3,212
Normal credit24,558
Collateral and guarantees437
(Partial, direct write-offs)1,264
Collateral and guarantees1,257Reserve1,660
Collateral and guarantees948
Reserve655
Collateral and guarantees2,642
Reserves2,315
Partial, direct write-offs 1,264
(100.0%)
87.7%
28.9%
Reserves as a percentage of substandard
credit and below55.7%
(Reference) As of September 30, 2000
59.4%
Secured by collateral or guarantees437
Secured by collateral or guarantees1,257
Substandard credit secured by collateral or guarantees
948
Provision to reserve1,660
Disclosed credit under the Financial Reconstruction Law
Reserve, Coverrage for Credit under the FRL
Reserves as a percentage of
non-secured creditCategory I Category II Category III Category IV
Asset classifications for self-assessment
Partial, direct write-offs1,264
Borrower categoriesfor self-assessment
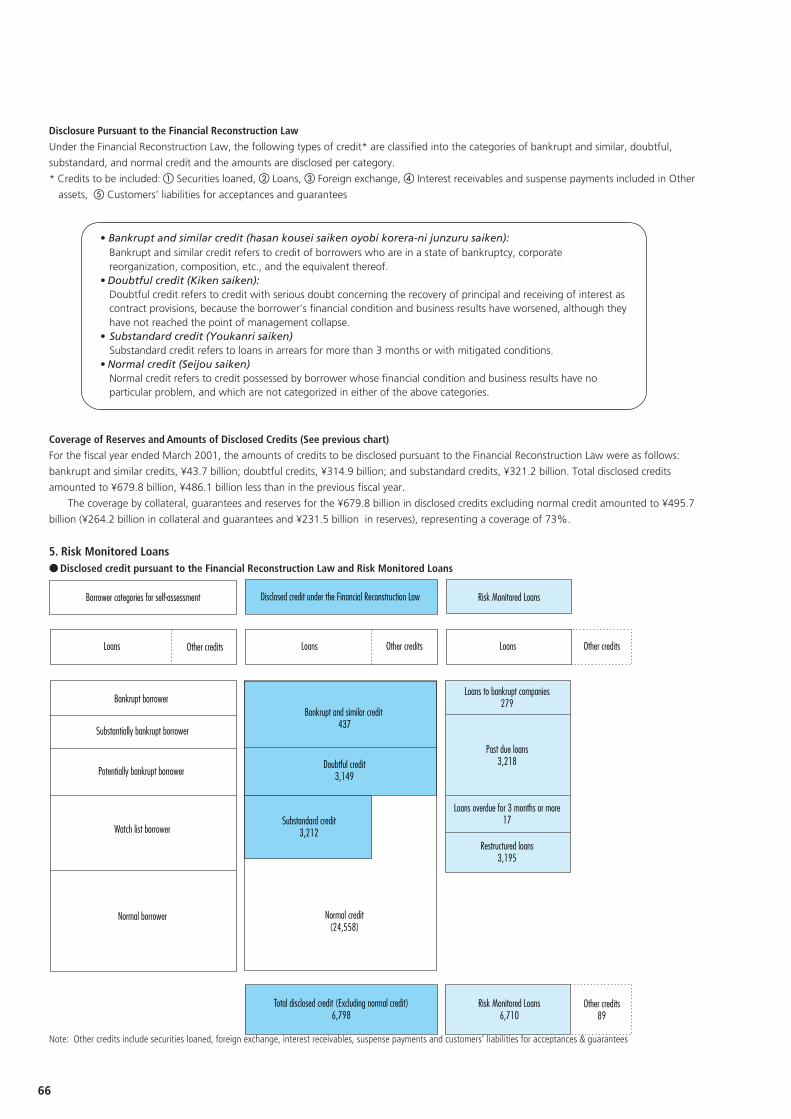
66
Disclosure Pursuant to the Financial Reconstruction Law
Under the Financial Reconstruction Law, the following types of credit* are classified into the categories of bankrupt and similar, doubtful,
substandard, and normal credit and the amounts are disclosed per category.
* Credits to be included: � Securities loaned, � Loans, � Foreign exchange, � Interest receivables and suspense payments included in Other
assets, � Customers’ liabilities for acceptances and guarantees
Coverage of Reserves and Amounts of Disclosed Credits (See previous chart)
For the fiscal year ended March 2001, the amounts of credits to be disclosed pursuant to the Financial Reconstruction Law were as follows:
bankrupt and similar credits, ¥43.7 billion; doubtful credits, ¥314.9 billion; and substandard credits, ¥321.2 billion. Total disclosed credits
amounted to ¥679.8 billion, ¥486.1 billion less than in the previous fiscal year.
The coverage by collateral, guarantees and reserves for the ¥679.8 billion in disclosed credits excluding normal credit amounted to ¥495.7
billion (¥264.2 billion in collateral and guarantees and ¥231.5 billion in reserves), representing a coverage of 73%.
5. Risk Monitored Loans● Disclosed credit pursuant to the Financial Reconstruction Law and Risk Monitored Loans
Note: Other credits include securities loaned, foreign exchange, interest receivables, suspense payments and customers’ liabilities for acceptances & guarantees
Borrower categories for self-assessment Disclosed credit under the Financial Reconstruction Law Risk Monitored Loans
Loans Loans Other credits Loans Other credits
Bankrupt borrower
Substantially bankrupt borrower
Potentially bankrupt borrower
Watch list borrower
Normal borrower
Bankrupt and similar credit 437
Doubtful credit3,149
Substandard credit3,212
Normal credit(24,558)
Loans to bankrupt companies279
Past due loans3,218
Loans overdue for 3 months or more17
Restructured loans3,195
Total disclosed credit (Excluding normal credit)6,798
Risk Monitored Loans6,710
Other credits89
Other credits
• Bankrupt and similar credit (hasan kousei saiken oyobi korera-ni junzuru saiken):Bankrupt and similar credit refers to credit of borrowers who are in a state of bankruptcy, corporatereorganization, composition, etc., and the equivalent thereof.
• Doubtful credit (Kiken saiken):Doubtful credit refers to credit with serious doubt concerning the recovery of principal and receiving of interest ascontract provisions, because the borrower’s financial condition and business results have worsened, although theyhave not reached the point of management collapse.
• Substandard credit (Youkanri saiken)Substandard credit refers to loans in arrears for more than 3 months or with mitigated conditions.
• Normal credit (Seijou saiken)Normal credit refers to credit possessed by borrower whose financial condition and business results have noparticular problem, and which are not categorized in either of the above categories.
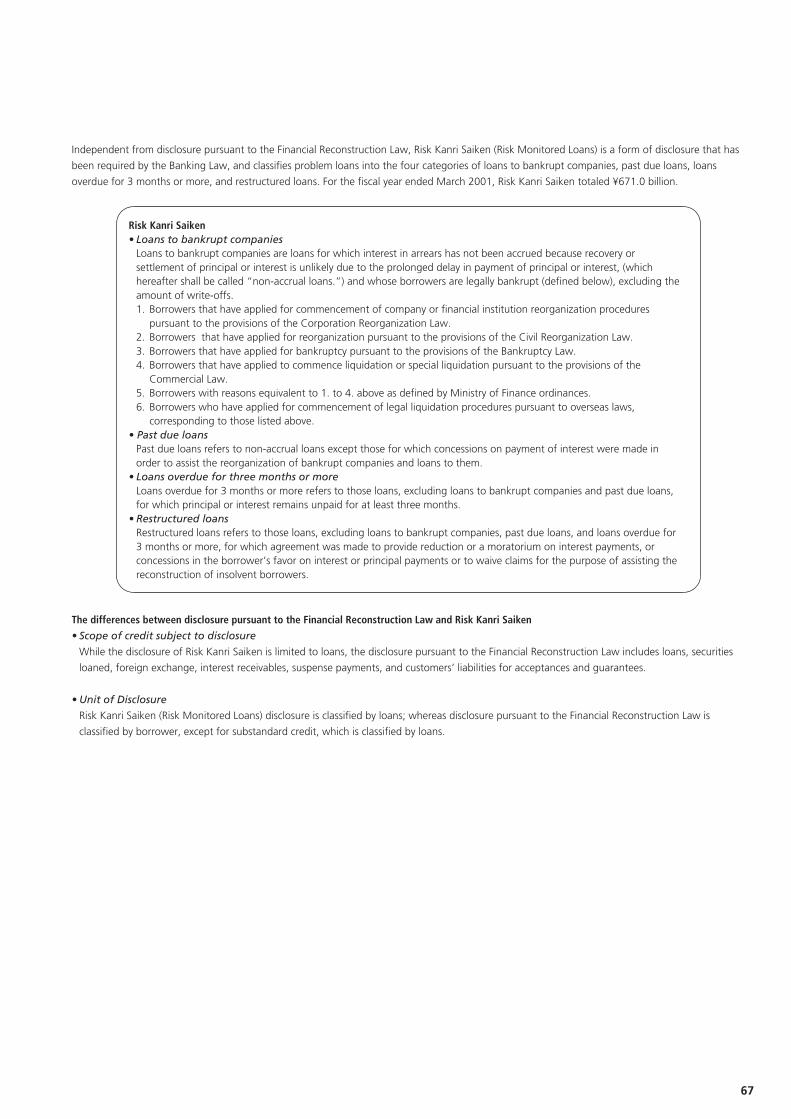
67
Independent from disclosure pursuant to the Financial Reconstruction Law, Risk Kanri Saiken (Risk Monitored Loans) is a form of disclosure that has
been required by the Banking Law, and classifies problem loans into the four categories of loans to bankrupt companies, past due loans, loans
overdue for 3 months or more, and restructured loans. For the fiscal year ended March 2001, Risk Kanri Saiken totaled ¥671.0 billion.
Risk Kanri Saiken• Loans to bankrupt companies
Loans to bankrupt companies are loans for which interest in arrears has not been accrued because recovery orsettlement of principal or interest is unlikely due to the prolonged delay in payment of principal or interest, (whichhereafter shall be called “non-accrual loans.”) and whose borrowers are legally bankrupt (defined below), excluding theamount of write-offs.1. Borrowers that have applied for commencement of company or financial institution reorganization procedures
pursuant to the provisions of the Corporation Reorganization Law.2. Borrowers that have applied for reorganization pursuant to the provisions of the Civil Reorganization Law.3. Borrowers that have applied for bankruptcy pursuant to the provisions of the Bankruptcy Law.4. Borrowers that have applied to commence liquidation or special liquidation pursuant to the provisions of the
Commercial Law.5. Borrowers with reasons equivalent to 1. to 4. above as defined by Ministry of Finance ordinances.6. Borrowers who have applied for commencement of legal liquidation procedures pursuant to overseas laws,
corresponding to those listed above.• Past due loans
Past due loans refers to non-accrual loans except those for which concessions on payment of interest were made inorder to assist the reorganization of bankrupt companies and loans to them.
• Loans overdue for three months or moreLoans overdue for 3 months or more refers to those loans, excluding loans to bankrupt companies and past due loans,for which principal or interest remains unpaid for at least three months.
• Restructured loansRestructured loans refers to those loans, excluding loans to bankrupt companies, past due loans, and loans overdue for3 months or more, for which agreement was made to provide reduction or a moratorium on interest payments, orconcessions in the borrower’s favor on interest or principal payments or to waive claims for the purpose of assisting thereconstruction of insolvent borrowers.
The differences between disclosure pursuant to the Financial Reconstruction Law and Risk Kanri Saiken
• Scope of credit subject to disclosure
While the disclosure of Risk Kanri Saiken is limited to loans, the disclosure pursuant to the Financial Reconstruction Law includes loans, securities
loaned, foreign exchange, interest receivables, suspense payments, and customers’ liabilities for acceptances and guarantees.
• Unit of Disclosure
Risk Kanri Saiken (Risk Monitored Loans) disclosure is classified by loans; whereas disclosure pursuant to the Financial Reconstruction Law is
classified by borrower, except for substandard credit, which is classified by loans.
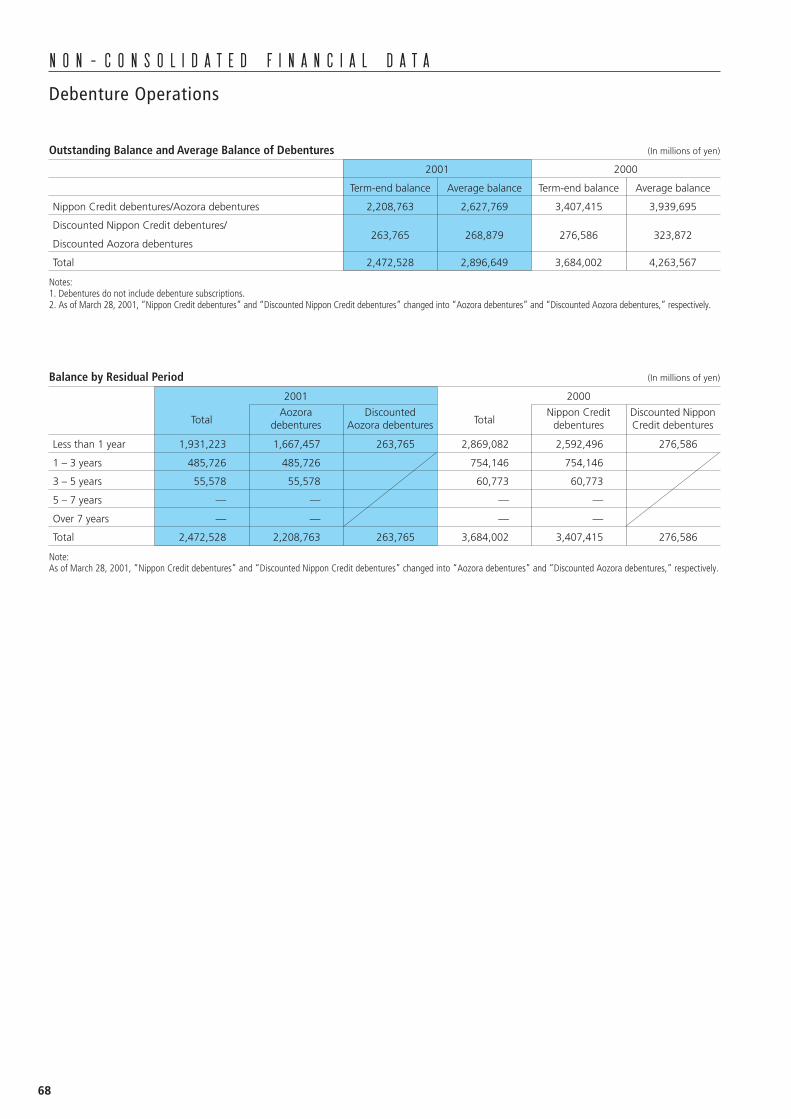
68
Debenture Operations
Outstanding Balance and Average Balance of Debentures (In millions of yen)
2001 2000
Term-end balance Average balance Term-end balance Average balance
Nippon Credit debentures/Aozora debentures 2,208,763 2,627,769 3,407,415 3,939,695
Discounted Nippon Credit debentures/
Discounted Aozora debentures263,765 268,879 276,586 323,872
Total 2,472,528 2,896,649 3,684,002 4,263,567
Notes:1. Debentures do not include debenture subscriptions.2. As of March 28, 2001, “Nippon Credit debentures” and “Discounted Nippon Credit debentures” changed into “Aozora debentures” and “Discounted Aozora debentures,” respectively.
Balance by Residual Period (In millions of yen)
2001 2000
TotalAozora Discounted
TotalNippon Credit Discounted Nippon
debentures Aozora debentures debentures Credit debentures
Less than 1 year 1,931,223 1,667,457 263,765 2,869,082 2,592,496 276,586
1 – 3 years 485,726 485,726 754,146 754,146
3 – 5 years 55,578 55,578 60,773 60,773
5 – 7 years — — — —
Over 7 years — — — —
Total 2,472,528 2,208,763 263,765 3,684,002 3,407,415 276,586
Note:As of March 28, 2001, “Nippon Credit debentures” and “Discounted Nippon Credit debentures” changed into “Aozora debentures” and “Discounted Aozora debentures,” respectively.
N O N – C O N S O L I D A T E D F I N A N C I A L D A T A
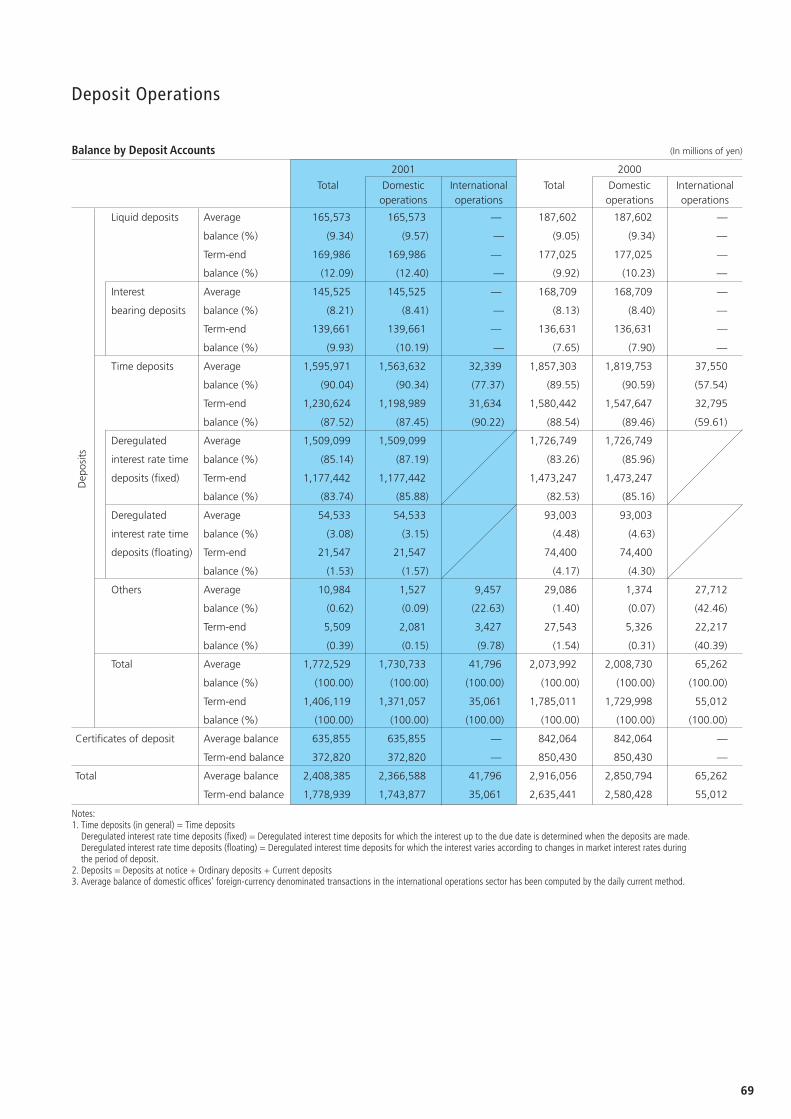
69
Deposit Operations
Balance by Deposit Accounts (In millions of yen)
2001 2000
Total Domestic International Total Domestic Internationaloperations operations operations operations
Liquid deposits Average 165,573 165,573 — 187,602 187,602 —
balance (%) (9.34) (9.57) — (9.05) (9.34) —
Term-end 169,986 169,986 — 177,025 177,025 —
balance (%) (12.09) (12.40) — (9.92) (10.23) —
Interest Average 145,525 145,525 — 168,709 168,709 —
bearing deposits balance (%) (8.21) (8.41) — (8.13) (8.40) —
Term-end 139,661 139,661 — 136,631 136,631 —
balance (%) (9.93) (10.19) — (7.65) (7.90) —
Time deposits Average 1,595,971 1,563,632 32,339 1,857,303 1,819,753 37,550
balance (%) (90.04) (90.34) (77.37) (89.55) (90.59) (57.54)
Term-end 1,230,624 1,198,989 31,634 1,580,442 1,547,647 32,795
balance (%) (87.52) (87.45) (90.22) (88.54) (89.46) (59.61)
Deregulated Average 1,509,099 1,509,099 1,726,749 1,726,749
interest rate time balance (%) (85.14) (87.19) (83.26) (85.96)
deposits (fixed) Term-end 1,177,442 1,177,442 1,473,247 1,473,247
balance (%) (83.74) (85.88) (82.53) (85.16)
Deregulated Average 54,533 54,533 93,003 93,003
interest rate time balance (%) (3.08) (3.15) (4.48) (4.63)
deposits (floating) Term-end 21,547 21,547 74,400 74,400
balance (%) (1.53) (1.57) (4.17) (4.30)
Others Average 10,984 1,527 9,457 29,086 1,374 27,712
balance (%) (0.62) (0.09) (22.63) (1.40) (0.07) (42.46)
Term-end 5,509 2,081 3,427 27,543 5,326 22,217
balance (%) (0.39) (0.15) (9.78) (1.54) (0.31) (40.39)
Total Average 1,772,529 1,730,733 41,796 2,073,992 2,008,730 65,262
balance (%) (100.00) (100.00) (100.00) (100.00) (100.00) (100.00)
Term-end 1,406,119 1,371,057 35,061 1,785,011 1,729,998 55,012
balance (%) (100.00) (100.00) (100.00) (100.00) (100.00) (100.00)
Certificates of deposit Average balance 635,855 635,855 — 842,064 842,064 —
Term-end balance 372,820 372,820 — 850,430 850,430 —
Total Average balance 2,408,385 2,366,588 41,796 2,916,056 2,850,794 65,262
Term-end balance 1,778,939 1,743,877 35,061 2,635,441 2,580,428 55,012
Dep
osits
Notes:1. Time deposits (in general) = Time deposits
Deregulated interest rate time deposits (fixed) = Deregulated interest time deposits for which the interest up to the due date is determined when the deposits are made.Deregulated interest rate time deposits (floating) = Deregulated interest time deposits for which the interest varies according to changes in market interest rates duringthe period of deposit.
2. Deposits = Deposits at notice + Ordinary deposits + Current deposits3. Average balance of domestic offices’ foreign-currency denominated transactions in the international operations sector has been computed by the daily current method.
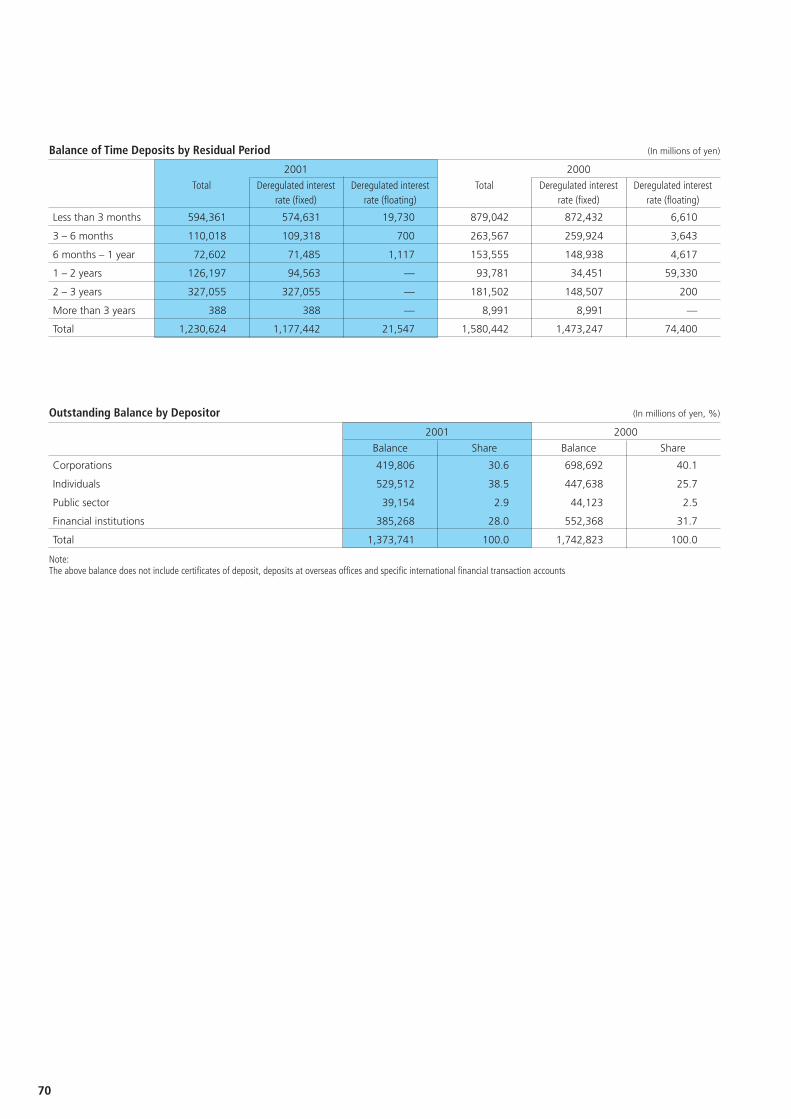
70
Balance of Time Deposits by Residual Period (In millions of yen)
2001 2000
Total Deregulated interest Deregulated interest Total Deregulated interest Deregulated interestrate (fixed) rate (floating) rate (fixed) rate (floating)
Less than 3 months 594,361 574,631 19,730 879,042 872,432 6,610
3 – 6 months 110,018 109,318 700 263,567 259,924 3,643
6 months – 1 year 72,602 71,485 1,117 153,555 148,938 4,617
1 – 2 years 126,197 94,563 — 93,781 34,451 59,330
2 – 3 years 327,055 327,055 — 181,502 148,507 200
More than 3 years 388 388 — 8,991 8,991 —
Total 1,230,624 1,177,442 21,547 1,580,442 1,473,247 74,400
Outstanding Balance by Depositor (In millions of yen, %)
2001 2000
Balance Share Balance Share
Corporations 419,806 30.6 698,692 40.1
Individuals 529,512 38.5 447,638 25.7
Public sector 39,154 2.9 44,123 2.5
Financial institutions 385,268 28.0 552,368 31.7
Total 1,373,741 100.0 1,742,823 100.0
Note:The above balance does not include certificates of deposit, deposits at overseas offices and specific international financial transaction accounts
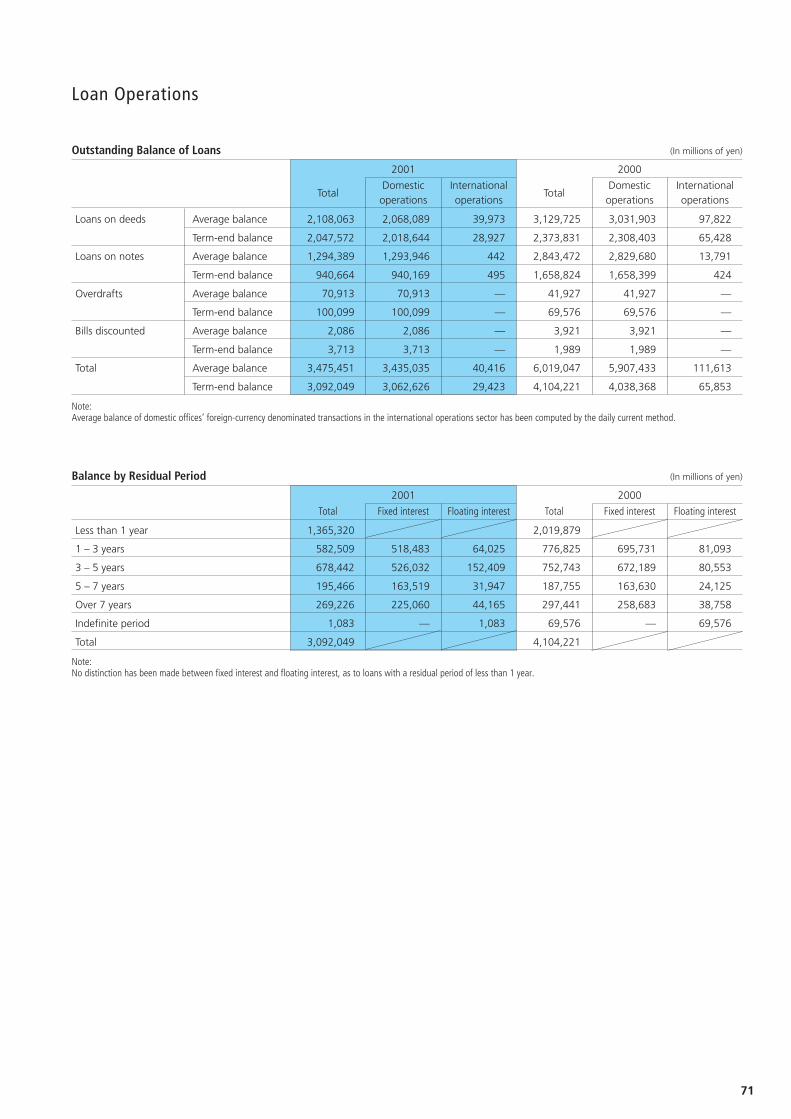
71
Loan Operations
Outstanding Balance of Loans (In millions of yen)
2001 2000
TotalDomestic International
TotalDomestic International
operations operations operations operations
Loans on deeds Average balance 2,108,063 2,068,089 39,973 3,129,725 3,031,903 97,822
Term-end balance 2,047,572 2,018,644 28,927 2,373,831 2,308,403 65,428
Loans on notes Average balance 1,294,389 1,293,946 442 2,843,472 2,829,680 13,791
Term-end balance 940,664 940,169 495 1,658,824 1,658,399 424
Overdrafts Average balance 70,913 70,913 — 41,927 41,927 —
Term-end balance 100,099 100,099 — 69,576 69,576 —
Bills discounted Average balance 2,086 2,086 — 3,921 3,921 —
Term-end balance 3,713 3,713 — 1,989 1,989 —
Total Average balance 3,475,451 3,435,035 40,416 6,019,047 5,907,433 111,613
Term-end balance 3,092,049 3,062,626 29,423 4,104,221 4,038,368 65,853
Note:Average balance of domestic offices’ foreign-currency denominated transactions in the international operations sector has been computed by the daily current method.
Balance by Residual Period (In millions of yen)
2001 2000
Total Fixed interest Floating interest Total Fixed interest Floating interest
Less than 1 year 1,365,320 2,019,879
1 – 3 years 582,509 518,483 64,025 776,825 695,731 81,093
3 – 5 years 678,442 526,032 152,409 752,743 672,189 80,553
5 – 7 years 195,466 163,519 31,947 187,755 163,630 24,125
Over 7 years 269,226 225,060 44,165 297,441 258,683 38,758
Indefinite period 1,083 — 1,083 69,576 — 69,576
Total 3,092,049 4,104,221
Note:No distinction has been made between fixed interest and floating interest, as to loans with a residual period of less than 1 year.
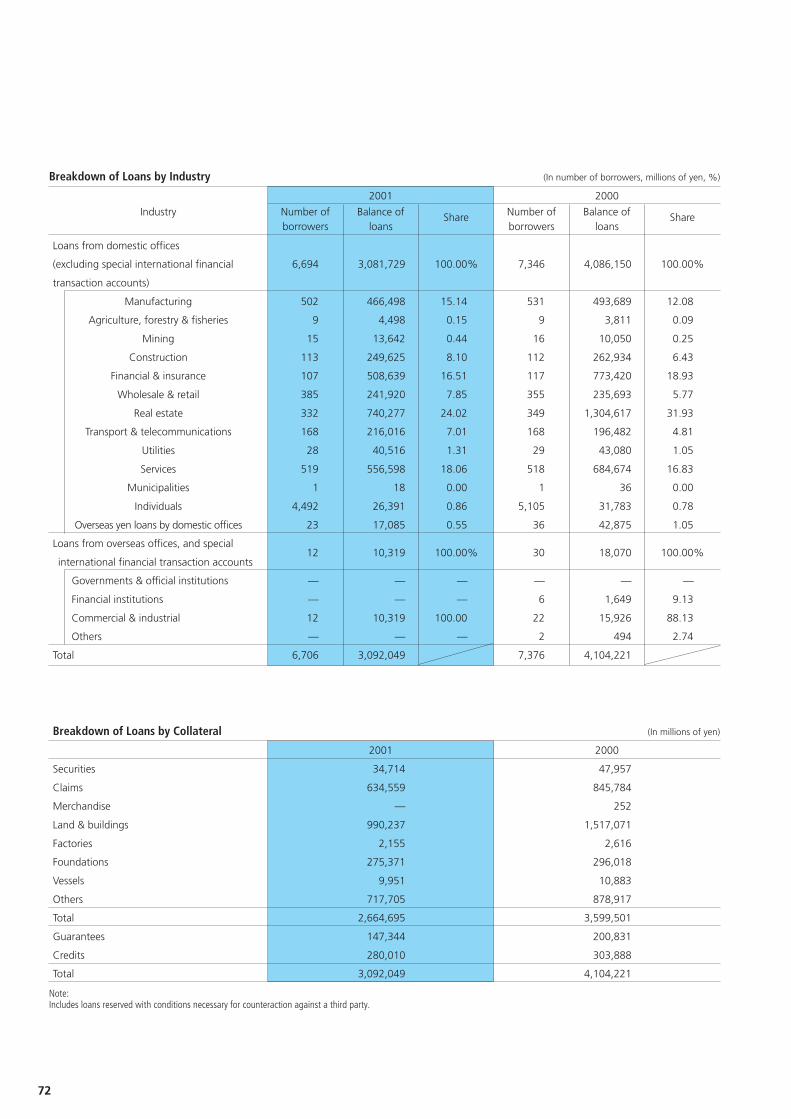
72
Breakdown of Loans by Industry (In number of borrowers, millions of yen, %)
2001 2000
Industry Number of Balance of Share Number of Balance of Shareborrowers loans borrowers loans
Loans from domestic offices
(excluding special international financial 6,694 3,081,729 100.00% 7,346 4,086,150 100.00%
transaction accounts)
Manufacturing 502 466,498 15.14 531 493,689 12.08
Agriculture, forestry & fisheries 9 4,498 0.15 9 3,811 0.09
Mining 15 13,642 0.44 16 10,050 0.25
Construction 113 249,625 8.10 112 262,934 6.43
Financial & insurance 107 508,639 16.51 117 773,420 18.93
Wholesale & retail 385 241,920 7.85 355 235,693 5.77
Real estate 332 740,277 24.02 349 1,304,617 31.93
Transport & telecommunications 168 216,016 7.01 168 196,482 4.81
Utilities 28 40,516 1.31 29 43,080 1.05
Services 519 556,598 18.06 518 684,674 16.83
Municipalities 1 18 0.00 1 36 0.00
Individuals 4,492 26,391 0.86 5,105 31,783 0.78
Overseas yen loans by domestic offices 23 17,085 0.55 36 42,875 1.05
Loans from overseas offices, and special
international financial transaction accounts12 10,319 100.00% 30 18,070 100.00%
Governments & official institutions — — — — — —
Financial institutions — — — 6 1,649 9.13
Commercial & industrial 12 10,319 100.00 22 15,926 88.13
Others — — — 2 494 2.74
Total 6,706 3,092,049 7,376 4,104,221
Breakdown of Loans by Collateral (In millions of yen)
2001 2000
Securities 34,714 47,957
Claims 634,559 845,784
Merchandise — 252
Land & buildings 990,237 1,517,071
Factories 2,155 2,616
Foundations 275,371 296,018
Vessels 9,951 10,883
Others 717,705 878,917
Total 2,664,695 3,599,501
Guarantees 147,344 200,831
Credits 280,010 303,888
Total 3,092,049 4,104,221
Note:Includes loans reserved with conditions necessary for counteraction against a third party.
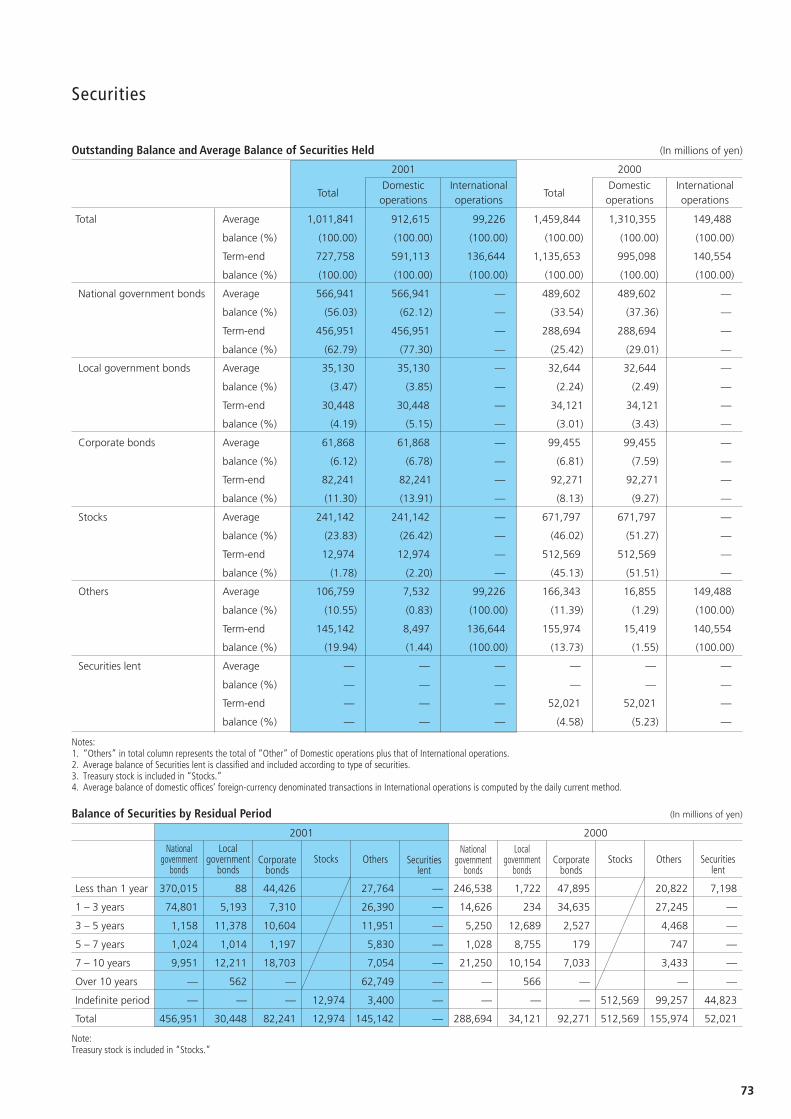
73
Securities
Outstanding Balance and Average Balance of Securities Held (In millions of yen)
2001 2000
TotalDomestic International
TotalDomestic International
operations operations operations operations
Total Average 1,011,841 912,615 99,226 1,459,844 1,310,355 149,488
balance (%) (100.00) (100.00) (100.00) (100.00) (100.00) (100.00)
Term-end 727,758 591,113 136,644 1,135,653 995,098 140,554
balance (%) (100.00) (100.00) (100.00) (100.00) (100.00) (100.00)
National government bonds Average 566,941 566,941 — 489,602 489,602 —
balance (%) (56.03) (62.12) — (33.54) (37.36) —
Term-end 456,951 456,951 — 288,694 288,694 —
balance (%) (62.79) (77.30) — (25.42) (29.01) —
Local government bonds Average 35,130 35,130 — 32,644 32,644 —
balance (%) (3.47) (3.85) — (2.24) (2.49) —
Term-end 30,448 30,448 — 34,121 34,121 —
balance (%) (4.19) (5.15) — (3.01) (3.43) —
Corporate bonds Average 61,868 61,868 — 99,455 99,455 —
balance (%) (6.12) (6.78) — (6.81) (7.59) —
Term-end 82,241 82,241 — 92,271 92,271 —
balance (%) (11.30) (13.91) — (8.13) (9.27) —
Stocks Average 241,142 241,142 — 671,797 671,797 —
balance (%) (23.83) (26.42) — (46.02) (51.27) —
Term-end 12,974 12,974 — 512,569 512,569 —
balance (%) (1.78) (2.20) — (45.13) (51.51) —
Others Average 106,759 7,532 99,226 166,343 16,855 149,488
balance (%) (10.55) (0.83) (100.00) (11.39) (1.29) (100.00)
Term-end 145,142 8,497 136,644 155,974 15,419 140,554
balance (%) (19.94) (1.44) (100.00) (13.73) (1.55) (100.00)
Securities lent Average — — — — — —
balance (%) — — — — — —
Term-end — — — 52,021 52,021 —
balance (%) — — — (4.58) (5.23) —
Notes:1. “Others” in total column represents the total of “Other” of Domestic operations plus that of International operations.2. Average balance of Securities lent is classified and included according to type of securities.3. Treasury stock is included in “Stocks.”4. Average balance of domestic offices’ foreign-currency denominated transactions in International operations is computed by the daily current method.
Less than 1 year 370,015 88 44,426 27,764 — 246,538 1,722 47,895 20,822 7,198
1 – 3 years 74,801 5,193 7,310 26,390 — 14,626 234 34,635 27,245 —
3 – 5 years 1,158 11,378 10,604 11,951 — 5,250 12,689 2,527 4,468 —
5 – 7 years 1,024 1,014 1,197 5,830 — 1,028 8,755 179 747 —
7 – 10 years 9,951 12,211 18,703 7,054 — 21,250 10,154 7,033 3,433 —
Over 10 years — 562 — 62,749 — — 566 — — —
Indefinite period — — — 12,974 3,400 — — — — 512,569 99,257 44,823
Total 456,951 30,448 82,241 12,974 145,142 — 288,694 34,121 92,271 512,569 155,974 52,021
Note:Treasury stock is included in “Stocks.”
Nationalgovernment
bonds
Localgovernment
bondsCorporate
bondsStocks Others Securities
lent
Nationalgovernment
bonds
Localgovernment
bondsCorporate
bondsStocks Others Securities
lent
Balance of Securities by Residual Period (In millions of yen)
2001 2000
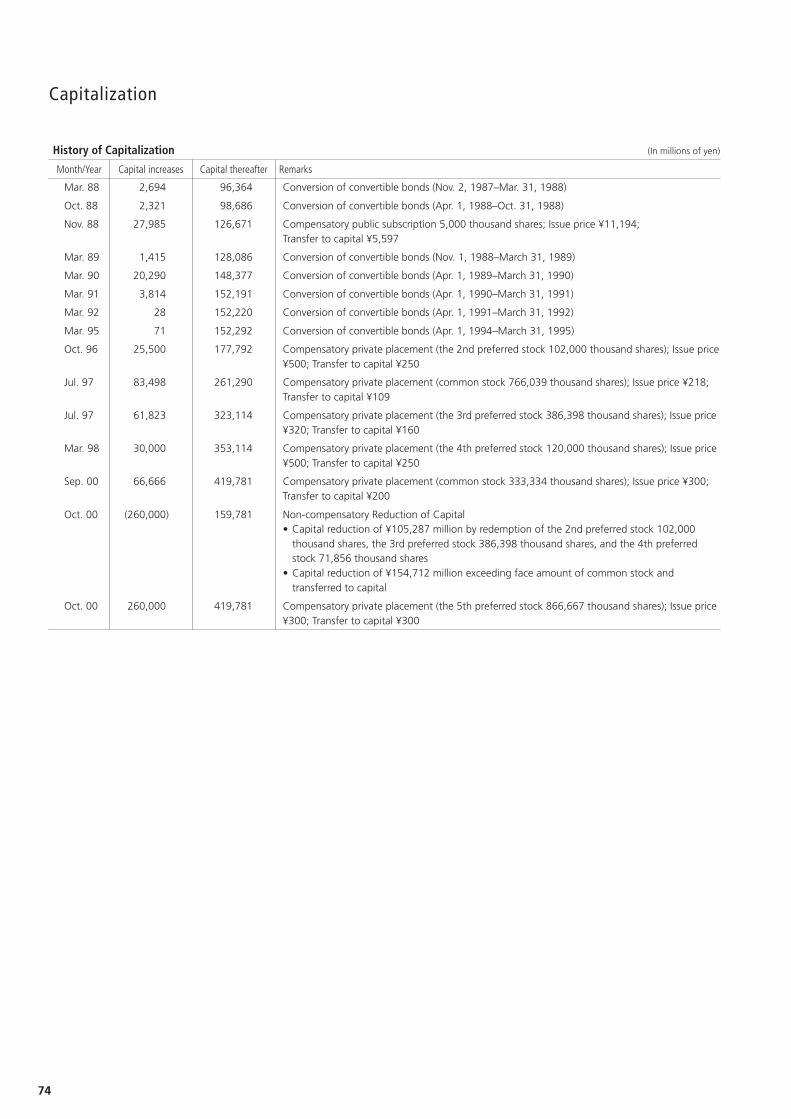
74
Capitalization
History of Capitalization (In millions of yen)
Month/Year Capital increases Capital thereafter Remarks
Mar. 88 2,694 96,364 Conversion of convertible bonds (Nov. 2, 1987–Mar. 31, 1988)
Oct. 88 2,321 98,686 Conversion of convertible bonds (Apr. 1, 1988–Oct. 31, 1988)
Nov. 88 27,985 126,671 Compensatory public subscription 5,000 thousand shares; Issue price ¥11,194;Transfer to capital ¥5,597
Mar. 89 1,415 128,086 Conversion of convertible bonds (Nov. 1, 1988–March 31, 1989)
Mar. 90 20,290 148,377 Conversion of convertible bonds (Apr. 1, 1989–March 31, 1990)
Mar. 91 3,814 152,191 Conversion of convertible bonds (Apr. 1, 1990–March 31, 1991)
Mar. 92 28 152,220 Conversion of convertible bonds (Apr. 1, 1991–March 31, 1992)
Mar. 95 71 152,292 Conversion of convertible bonds (Apr. 1, 1994–March 31, 1995)
Oct. 96 25,500 177,792 Compensatory private placement (the 2nd preferred stock 102,000 thousand shares); Issue price¥500; Transfer to capital ¥250
Jul. 97 83,498 261,290 Compensatory private placement (common stock 766,039 thousand shares); Issue price ¥218;Transfer to capital ¥109
Jul. 97 61,823 323,114 Compensatory private placement (the 3rd preferred stock 386,398 thousand shares); Issue price¥320; Transfer to capital ¥160
Mar. 98 30,000 353,114 Compensatory private placement (the 4th preferred stock 120,000 thousand shares); Issue price¥500; Transfer to capital ¥250
Sep. 00 66,666 419,781 Compensatory private placement (common stock 333,334 thousand shares); Issue price ¥300;Transfer to capital ¥200
Oct. 00 (260,000) 159,781 Non-compensatory Reduction of Capital• Capital reduction of ¥105,287 million by redemption of the 2nd preferred stock 102,000
thousand shares, the 3rd preferred stock 386,398 thousand shares, and the 4th preferredstock 71,856 thousand shares
• Capital reduction of ¥154,712 million exceeding face amount of common stock andtransferred to capital
Oct. 00 260,000 419,781 Compensatory private placement (the 5th preferred stock 866,667 thousand shares); Issue price¥300; Transfer to capital ¥300
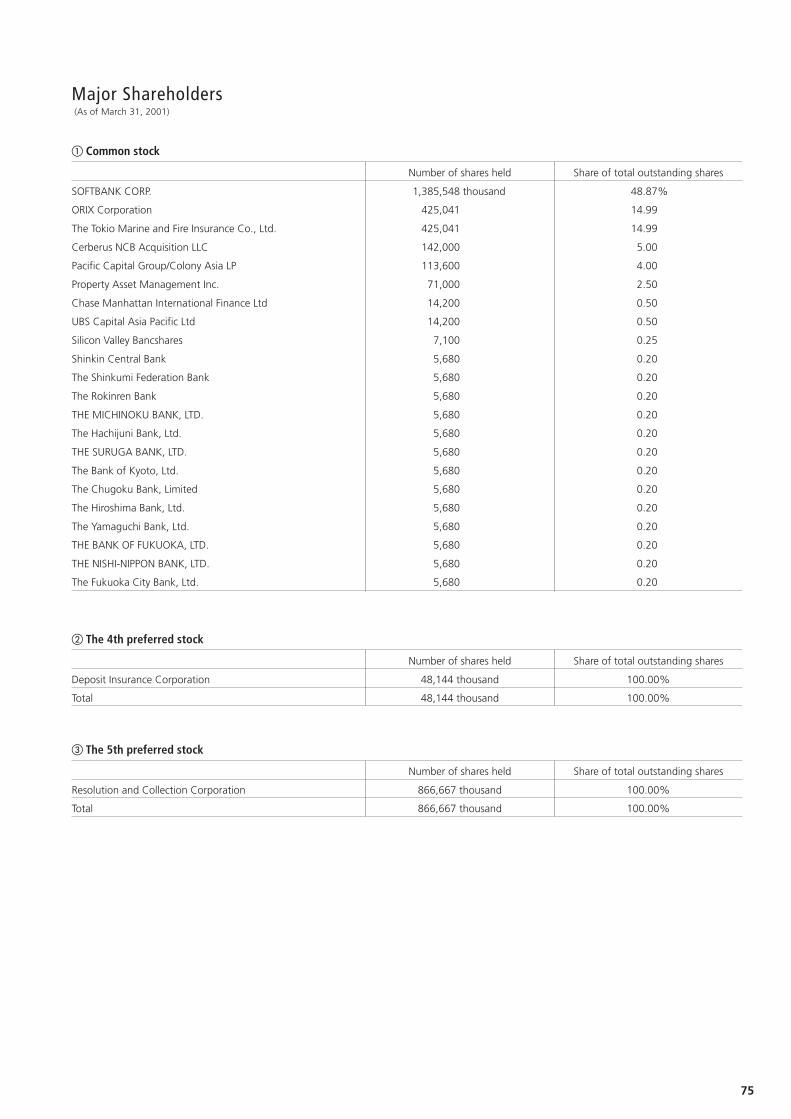
75
Major Shareholders (As of March 31, 2001)
� The 4th preferred stock
Number of shares held Share of total outstanding shares
Deposit Insurance Corporation 48,144 thousand 100.00%
Total 48,144 thousand 100.00%
� The 5th preferred stock
Number of shares held Share of total outstanding shares
Resolution and Collection Corporation 866,667 thousand 100.00%
Total 866,667 thousand 100.00%
� Common stock
Number of shares held Share of total outstanding shares
SOFTBANK CORP. 1,385,548 thousand 48.87%
ORIX Corporation 425,041 14.99
The Tokio Marine and Fire Insurance Co., Ltd. 425,041 14.99
Cerberus NCB Acquisition LLC 142,000 5.00
Pacific Capital Group/Colony Asia LP 113,600 4.00
Property Asset Management Inc. 71,000 2.50
Chase Manhattan International Finance Ltd 14,200 0.50
UBS Capital Asia Pacific Ltd 14,200 0.50
Silicon Valley Bancshares 7,100 0.25
Shinkin Central Bank 5,680 0.20
The Shinkumi Federation Bank 5,680 0.20
The Rokinren Bank 5,680 0.20
THE MICHINOKU BANK, LTD. 5,680 0.20
The Hachijuni Bank, Ltd. 5,680 0.20
THE SURUGA BANK, LTD. 5,680 0.20
The Bank of Kyoto, Ltd. 5,680 0.20
The Chugoku Bank, Limited 5,680 0.20
The Hiroshima Bank, Ltd. 5,680 0.20
The Yamaguchi Bank, Ltd. 5,680 0.20
THE BANK OF FUKUOKA, LTD. 5,680 0.20
THE NISHI-NIPPON BANK, LTD. 5,680 0.20
The Fukuoka City Bank, Ltd. 5,680 0.20
76
● DebenturesIssuance of debentures and discount debentures
● DepositsDeposits
Checking accounts, savings accounts, deposits at notice, timedeposits, deposits at notice, tax savings deposits, non-residentsdeposits in yen currency, and deposit in foreign currencies
Certificates of depositLimited to national and local public entities,bond management firmsand other specified customers
● Lending and guaranty of liabilitiesLoans, discount on promissory notes, guaranty of liabilities forequipment funds and long-term operating fund services. Also, loansfor long-term funds (term exceeding six months ) other thanequipment funds and long-term operation fundsLoans for short-term funds are (term of less than six months) limitedto the total amount of deposits or corresponding funds.Discounts on promissory notes, guaranty of liabilities, and acceptanceof promissory notes
● Securities
Security investment businessUnderwriting of public bondsOver-the-counter sales of public bonds including national governmentbonds, and securities investment trustsSales/purchase of security productsReceipt of payment for stocks or corporate bonds, or paymentof dividendsRegistration of public bonds as a registered institution under theCorporate Bonds Registration LawConsignment business for soliciting or managing public bondsTrust business for secured corporate bonds
Corporate History
Business Activities
April 1957 Established as The Nippon Fudosan Bank, Limited(capital ¥1 billion) in accordance with the Long-Term Trust Bank Law.
October Opened Osaka BranchNovember Started issuance of debentures
September 1958 Started issuance of discount debenturesOctober Opened Nagoya Branch Office
July 1964 Started foreign exchange business as anauthorized foreign exchange bank
September Listed stock in the Tokyo Stock Exchange
February 1970 Listed stock in the Osaka Securities Exchange
October 1977 Changed name to The Nippon Credit Bank, Ltd.
November 1989 Started issuance of two-year debentures
August 1994 Split ¥500 par value stock into ¥50 par value
June 1996 Started issuance of one and three-year debentures
December 1998 Started special public management in accordancewith application of the Financial Reconstruction LawTerminated listing stocks on Tokyo Stock Exchange,Osaka Securities Exchange
June 2000 Share Purchase Agreement regarding the transfer ofthe Bank’s shares is signed between DIC andSOFTBANK CORP., ORIX Corporation, The TokioMarine and Fire Insurance Co., Ltd., and otherfinancial institutions
September Ended special public management
January 2001 Changed name to Aozora Bank, Ltd.
● Brokerage business for securities futures
Brokerage business for securities futures, option transactions, andforward rate agreement transactions
● Domestic exchangesServices such as money order between head/branch offices, and head/branch offices of other banksChecking account payment, collection of bills
● Foreign exchangesRemittance to foreign countries and other foreign currency relatedbusinesses
● Other servicesRevenue agency for Bank of Japan and agency business for nationalbondsReceipt of public funds of local public entities including TokyoAgency business for Japan Small Business Corp., EmployeesRetirement Allowance Corp., Environmental Service Corp.,Government Pension Investment Fund Employment Promotion Corp.,Oil Corp., and Social Welfare Medical Corp.
Safe-keeping depositsRental safe-deposit boxesPurchase of securitiesCommercial paper
C O R P O R A T E D A T A
77
Office Directory(As of June 30, 2001)
● HEAD OFFICE13-10, Kudan-kita 1-chomeChiyoda-ku, Tokyo102-8660, JapanTel: 03-3263-1111Telex: J26921, J28788(General)NCBTOKSWIFT: NCBTJPJT
● BRANCH OFFICESOsaka
2-4, Nishi-Shinsaibashi 1-chomeChuo-ku, Osaka 542-0086Tel: 06-6245-2121
Nagoya
5-28, Meieki 4-chomeNakamura-ku, Nagoya 450-0002Tel: 052-566-1900
Fukuoka
14-18, Tenjin 1-chomeChuo-ku, Fukuoka 810-0001Tel: 092-751-4261
Sendai
6-1, Ichibancho 4-chomeAoba-ku, Sendai 980-0811Tel: 022-225-1171
Hiroshima
7-37, NakamachiNaka-ku, Hiroshima 730-0037Tel: 082-247-4301
Sapporo
5-2, Ohdori Nishi 6-chomeChuo-ku, Sapporo 060-0042Tel: 011-241-8171
Takamatsu
6-1, Bancho 1-chomeTakamatsu 760-0017Tel: 087-821-5521
Kanazawa
37, Takaokacho 2-chomeKanazawa 920-0864Tel: 076-231-4151
Shinjuku
37-11, Shinjuku 3-chomeShinjuku-ku, Tokyo 160-0022Tel: 03-3354-1600
Umeda
47, Kakutacho 8-chomeKita-ku, Osaka 530-0017Tel: 06-6315-1111
Yokohama
48, Honcho 5-chomeNaka-ku, Yokohama 231-0005Tel: 045-212-3481
Kyoto
394 Shimomaruya-choOike-sagaruKawaramachi-DoriNakagyo-ku, Kyoto 604-8006Tel: 075-211-3341
Shibuya
24-12, Shibuya 1-chomeShibuya-ku, Tokyo 150-0002Tel: 03-3409-6411
Ueno
16-5, Higashi-Ueno 1-chomeTaito-ku, Tokyo 110-0015Tel: 03-3835-7511
Ikebukuro
28-13, Minami-Ikebukuro2-chome, Toshima-kuTokyo 171-0022Tel: 03-3988-0911
Chiba
3-1, Fujimi 2-chomeChuo-ku, Chiba 260-0015Tel: 043-227-3111
Domestic Network
HOME PAGE ADDRESS http://www.aozorabank.co.jp
Overseas Network
● BranchGrand Cayman Branch
General ManagerMasaaki Kishinami
Deputy General ManagerKazuo Hoshino
AddressP.O. Box 1040West Wind BuildingGeorge Town, Grand Caymanc/o The Nippon CreditBank, Ltd.Head OfficeTelex: J26921 NCBTOKJ28788 NCBTOK
● Representative OfficesNew York Representative Office
Chief RepresentativeAkihiro Yamasaki
Address101 East 52nd Street,29th Floor, New YorkNY 10022, U.S.A.Tel: 212-751-7330Fax: 212-751-0987
Singapore Representative Office
Head of South East AsiaShinya Takahashi
Address6 Temasek Boulevard, #23-02Suntec Tower 4,Singapore 038986,SingaporeTel: 333-6781Fax: 333-6807
Beijing Representative Office
Senior RepresentativeKazuo Iwashima
Address7th FloorChangfugong Office BuildingA26 Jianguo-Menwai Street,BeijingPeople’s Republic of ChinaTel: 010-6513-0683Fax: 010-6513-9033
Beijing Representative Office is scheduled toclose at the end of August 2001.
Seoul Representative Office
Senior RepresentativeMasayuki Ohga
Address8th FloorShinhan Bank Building 120,2-ka, Taepyung-ro,Chung-ku, Seoul 100-102,Republic of KoreaTel: 02-774-812102-774-8122Fax: 02-774-812302-771-7526
Jakarta Representative Office
Chief RepresentativeHiroshi Matsumoto
Address17th Floor, Jakarta StockExchange Building Tower IIJl. Jend. Sudirman Kav.52-53, Jakarta 12190,IndonesiaTel: 021-515-5155Fax: 021-515-5156
● SubsidiariesThe Nippon Credit Bank(Curaçao) Finance, N.V.
AddressPietermaai 15, WillemstadCuraçao, Netherlands Antilles
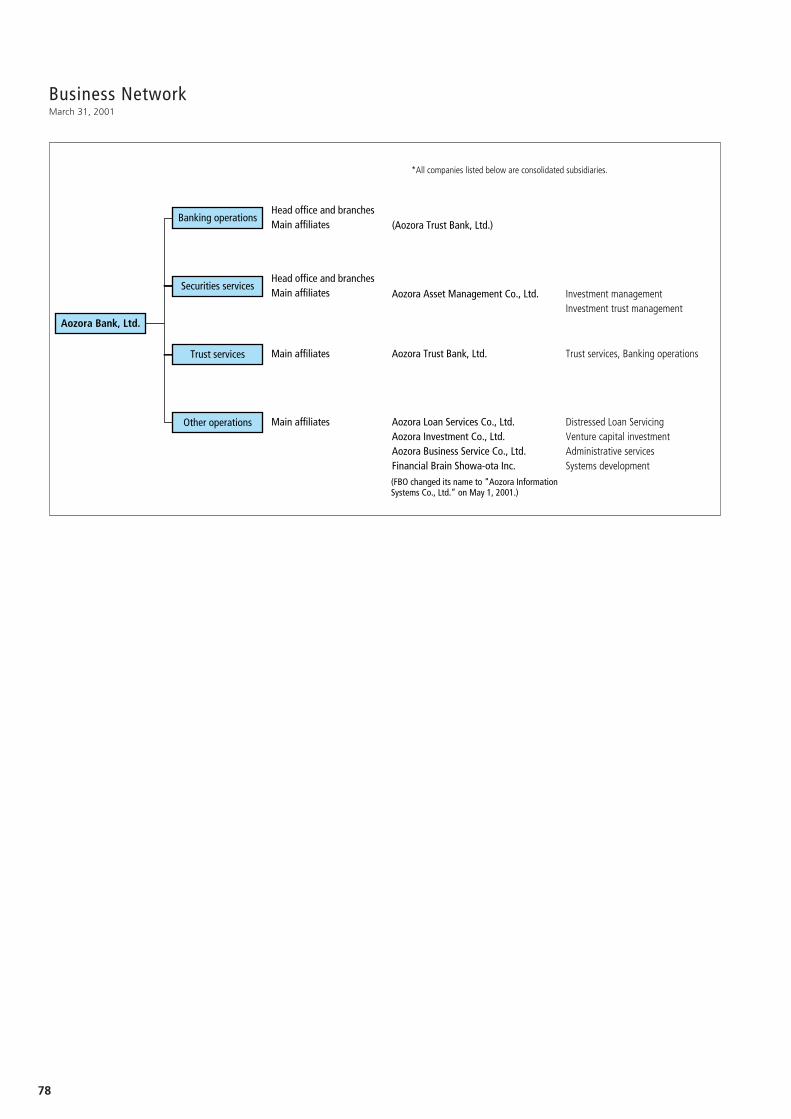
78
Head office and branches Main affiliates
Banking operations
Head office and branches Main affiliates
Securities services
Main affiliatesTrust services
Main affiliates Aozora Loan Services Co., Ltd.Aozora Investment Co., Ltd.Aozora Business Service Co., Ltd.Financial Brain Showa-ota Inc.
Aozora Trust Bank, Ltd.
(Aozora Trust Bank, Ltd.)
Distressed Loan Servicing Venture capital investmentAdministrative services Systems development
Trust services, Banking operations
Investment management Investment trust management
Aozora Asset Management Co., Ltd.
*All companies listed below are consolidated subsidiaries.
Other operations
Aozora Bank, Ltd.
(FBO changed its name to “Aozora Information Systems Co., Ltd.” on May 1, 2001.)
Business NetworkMarch 31, 2001

Directors & Auditors(As of June 30, 2001)
DIRECTORS
Chairman
Kazuhiko KasaiDirector
SOFTBANK CORP.
President & CEOHiroshi Maruyama
Senior Managing Director
Tomochika Iwashita
Senior Managing Director
Kenji Kajiwara
Director
Masayoshi SonPresident & CEO
SOFTBANK CORP.
DirectorYoshihiko MiyauchiChairman and CEO
ORIX Corporation
DirectorKoukei HiguchiChairman
The Tokio Marine and Fire Insurance
Co., Ltd.
Director
James Danforth QuayleFormer Vice President of The United
States of America
DirectorThomas J. Barrack, Jr.Managing Partner
Pacific Capital Group
Chairman and CEO
Colony Capital, LLC.
DirectorMichael J. O’HanlonManaging Director
Lehman Brothers Japan Inc.
DirectorFumikatsu TokiwaSenior Advisor
Kao Corporation
Director
Kazuhito IkeoProfessor
Keio University
DirectorMakoto NarukePresident
Inspire Corporation
AUDITORS
Standing Auditor
Ken Shigihara
AuditorYoshio Nakanishi
AuditorHideaki Kubori
AuditorKoichi Hori
EXECUTIVE OFFICERS
Chief Executive OfficerHiroshi Maruyama
Senior Executive OfficerTomochika Iwashita
Senior Executive Officer
Kenji Kajiwara
Managing Executive OfficerNaofumi Tokai
Managing Executive OfficerYuji Inagaki
Managing Executive Officer
Tomoaki Ishii
Managing Executive OfficerShiro Nagaki
Managing Executive OfficerIzumi Ogura
Executive Officer
Yoshiyuki Kurihara
Executive OfficerRyoichi Kawai
Executive OfficerHiroyuki Kimura
Executive Officer
Norimichi Kurakake
Executive OfficerTadaaki Satoyoshi
Executive OfficerTetsuo Ninomiya
Executive OfficerTadashi Tomozawa
Executive OfficerYukimichi Nakatani
Executive OfficerHirokazu Takino
79
あおぞらBK AR E Cover 01.8.22, 4:01 PMPage 5 Adobe PageMaker 6.5J/PPC
AO
ZO
RA
BA
NK
, LTD. A
nnual Report 2001
Printed in Japan
AOZORA BANK, LTD.13-10, Kudan-kita 1-chome, Chiyoda-ku, Tokyo 102-8660, JapanPhone 03-3263-1111URL: http://www.aozorabank.co.jp/
あおぞらBK AR E Cover 01.8.22, 4:01 PMPage 2 Adobe PageMaker 6.5J/PPC