Embed Size (px)
Citation preview

COORDINATING RESEARCH COUNCIL, INC.
5755 NORTH POINT PARKWAY, SUITE 265 ALPHARETTA, GA 30022
TEL: 678/795-0506 FAX: 678/795-0509 www.crcao.org
April 4, 2016 In reply, refer to: CRC Project No. AV-22-15 Dear Prospective Bidder: The Coordinating Research Council, Inc. (CRC) in cooperation with the Energy Institute (EI) invites you to submit a written proposal on “Measurement of Maximum Charge Density (streaming current) Caused by New Generation Aviation Fuel Filters,” as described in the attached Statement of Work, Exhibit A (including Attachment A, Appendix A, and Appendix B). Please note that the project consists of two Phases to be conducted sequentially and that a single bid needs to be received covering both Phases. Also please note the specific “Items to be Clarified” by bidders listed in Section 13 of Attachment A.
Please indicate via email by April 13, 2016 whether or not you or your organization intends to submit a written proposal for the project. CRC will answer technical questions regarding the Request for Proposal if they are submitted in writing. CRC will then return written answers to all of the bidders, along with a copy of the original questions.
The CRC technical group composed of equipment, petroleum, and government representatives will evaluate your proposal. CRC reserves the right to accept or reject any or all proposals.
The reporting requirement will be text, data and charts to CRC in accordance with Exhibit A - Statement of Work. A Final Report documenting the results of the study will be published by CRC. The reporting requirement is described in more detail in the attachment entitled, “Reports” (Exhibit B).
The “Intellectual Property Rights Clause” (Exhibit C) and “Liability Clause” (Exhibit D) will be a part of the agreement, which may be executed as a result of this Request for Proposal solicitation.
The proposal must be submitted as two separate documents. The technical approach to the problem will be described in Part One and a cost breakdown that is priced by task will be described in Part Two. The cost proposal document should include all costs associated with conducting the proposed program.
CRC expects to negotiate either a cost reimbursable or a fixed price contract. Important selection factors to be taken into account are listed in Exhibit E. CRC evaluation procedures require the technical group to complete a thorough technical evaluation before considering costs. After developing a recommendation based on technical considerations, the costs are revealed and the recommendation is modified as needed.
Electronic copies of the separate technical and cost proposals should be submitted to:
Mrs. Jan Tucker Phone: 678-795-0506, Ext. 100 Coordinating Research Council, Inc. Fax: 678-795-0509 5755 North Point Parkway, Ste. 265 E-mail: [email protected] Alpharetta, GA 30022
The deadline for receipt of your proposal is April 29, 2016.
Sincerely, Jan Tucker
Committee Coordinator

м
EXHIBIT A
STATEMENT OF WORK CRC Aviation Committee Research Group: Fuel System Safety
Project Title: Measurement of maximum charge density (streaming current) caused by new generation aviation fuel filters Relevant Strategic Objectives & Category:
Near term: To establish the maximum charge density (streaming current) that may be caused by new generation aviation fuel filters, which design engineers will need to take into account in fuel handling systems. Mid/Long term: Ensuring that the industry continues to have a robust evidence base for the design of both ground and aircraft fuel handling systems to mitigate the risk of electrostatic discharge. Background: The EI has been requested by an airframe manufacturer to define the maximum charge density (streaming current) that could be delivered to a commercial jet aircraft during refuelling. Electrostatic charging occurs as fuel passes through the final stage of filtration. The most recently available measurements are from the CRC study that was undertaken in the early 1990s and it is recognised that the designs of all aviation fuel filter types have evolved considerably since that time. Currently there are no maximum values for charge density included in EI filter specifications. In 2014 the EI contracted Harold Walmsley Electrostatics Ltd to assess methods of establishing, by measurement, maximum charge density. Given that a wide range of conditions (filter media types, manufacturers, fuel sources, moisture, SDA, other additives, ambient conditions etc) need to be covered in order establish robust values, it was concluded that a relatively small-scale laboratory test rig should be used (the data from which can be scaled-up). The required design of the test rig and the testing programme has been established. Project Objectives: To update the previous CRC study into this topic undertaken in the early 1990s (CRC Report #590, 1994 The Effect of Aviation Fuels Containing Low Amounts of
Static Dissipater Additive on Electrostatic Charge Generation) by measuring charging caused by the latest generation into-plane filtration technology (EI 1583 6th edition filter monitors). Project Approach: An existing test facility capable of performing EI 1583 filter monitor evaluations will be identified for a five day intensive project. The five days include:
Initial set-up time Completion of the full test programme.
The test programme has been established to match worst case operational conditions as closely as possible, specifically by using unmodified commercial filter elements at their maximum rated flows with realistic residence times downstream of filters and adding a pro-static agent to the test fuels, which include a synthetic paraffinic diesel fuel.

н
The specialist services of an electrostatics expert (Harold Walmsley Electrostatics Ltd, under sub-contract to the Energy Institute) have been engaged to work with the test house to confirm that the test rig set-up is as intended, take the required measurements (utilising specialised equipment owned by that company), and to prepare the Technical Report to document and analyse the findings. (The test house will be required to provide only test rig/set-up information for inclusion in the ‘methodology section’ and testing parameter data for the ‘results’ section of the final report by Dr Walmsley.) For further details of the project approach see Attachment A. Project Deliverables: This project will deliver a Technical Report covering charge generation/streaming current resultant from filtration for into-plane refueling for publication by CRC/EI. Utilization of Deliverables: To provide data for design engineers responsible for ground handling systems and aircraft fuel systems, filter manufacturers and those responsible for maintaining filter qualification specifications. Project Timescale: Completion of the test programme would be expected by end 3Q 2016, with a draft of the Technical Report made available before end October 2016. Publication following CRC/EI review should be achieved by year end 2016.

о
Attachment A – Detail of the required test facilities and test
programme developed by the CRC/EI AV-22-15 Project Panel
(Note: Sections 2 and 3 of this attachment are provided for information)
1 Introduction
The original test rig design and test programme (May 2015) has been revised in response to perceived difficulties in obtaining large numbers of jet fuel test samples. The main changes to the test specifications are:
The use of IBC (tote) scale vessels instead of drums to provide increased fuel volumes to enable extended test times to ensure stability of the system prior to the taking of measurements.
Clarification that the testing of a 6" nominal diameter x 28/29” element at its rated flow (115 USGPM) will form phase 2 of the present programme, building on the test results from phase 1 that will be undertaken with 2” nominal diameter elements. The invited proposals are for a program consisting of both phases, which are to be run sequentially with the test conditions for phase 2 being those that gave the worst-case in phase 1.
Instead of surveying a wide range of jet fuel samples it is considered to be more practical to find an approximate ‘worst case’ fuel by testing a limited range of fuels with a relatively wide range of properties and augmenting the charging with the addition of a pro-static agent.
Defining a simple method of water injection into the test fuel to water-wet filter monitor elements that minimizes water hold up in the test rig (this has the benefit of not requiring the modification of existing filter testing rigs and enabling test houses without sophisticated water injection facilities/filter test rigs to be able to bid for the work).
This note updates the recommended test outline to accommodate these changes. It covers the factors relating to the electrostatic performance of the tests. Liquid handling details are also provided.
2 Discussion of Variables
2.1 Filter types and sizes
2.1.1 Filter monitors and/or filter separators?
It is expected (although not proved) that the highest charging would occur with filter-monitor systems rather than filter/water separators due to the nature of the elements (coalescer elements are relatively coarse) and the frequently larger downstream residence volumes in filter/water separator vessels. Furthermore, most of the field experience of charge retention inside filter vessels has occurred with filter monitors. This program will therefore focus on filter monitors.

п
2.1.2 Filter element differences between manufacturers
Although they are interchangeable, the filter monitor elements made by different manufacturers differ significantly and previous measurements have revealed differences in the levels of charging produced. Models of element from the three manufacturers known to have qualified their products to EI 1583 6th edition (Faudi Aviation, Parker-Velcon and PECOFacet) therefore need to be tested (3 models of 2” element, 5 models of 6” element).
2.1.3 Element sizes
6" nominal diameter elements are constructed differently to 2" elements and are available in inside-to-outside and outside-to-inside flow formats. They generally contain pleated layers. Previously-investigated issues of electrostatic damage inside filter housings were confined to 2" elements so it might be assumed that the construction differences result in higher charge generation with 2” elements. However the differences could arise from better internal charge dissipation from 6" elements rather than lower charge generation so it would be prudent to include some tests on 6" elements. In the first phase of work it is proposed to test 2" nominal diameter elements of standard 30" length. Testing of 6” diameter elements (with required fuel flow rate of up to 115 USGPM compared to 30 USGPM for the 2” monitor testing) will form a second phase, conducted sequentially after phase 1.
Note: It is the intention for both phases to be contracted to the same test house and to be performed sequentially in the same 5-day test period.
Different element lengths of a given diameter from the same manufacturer use the same filter media layers and would therefore be expected to generate similar charge densities at full rated flow. However this has not been verified. The industry has adopted the use of 30” long, 2" diameter elements, so it is not necessary to test shorter ones. Testing 28/29” long1 6” diameter elements in phase 2 sufficiently replicates the 33” versions which are in widespread use, without the need to change the test vessel/housing.
2.2 Fuel electrical conductivity
Generally, the electrical conductivity provided by hydrocarbons is very low but in real fuel mixtures the hydrocarbon conductivity is increased by naturally occurring polar impurities and, possibly, by performance additives. It may also be deliberately raised with static dissipater additive (SDA).
EI/CRC is not aware of studies covering filter charging variations with "naturally occurring" conductivity differences in large populations of aviation fuel however there have been pipe charging studies covering hundreds of batches of gasoline and thousands of batches of diesel2. These studies are summarised in Appendix A. The results show that the influence of conductivity is highly variable and it appears that raising the conductivity with SDA (Stadis 450) does not necessarily replicate the charging behaviour produced at high conductivity by other additives or naturally occurring impurities. Investigating the influence of conductivity
1 Whether the elements are 28” or 29” depends on mounting arrangement (screw-based vs open ended). Either will be tested at 115 USGPM.
2 Although the number of truly independent batches in the diesel study was probably less.

р
would therefore seem to require looking separately at the influence of naturally occurring impurities, SDAs and other additives. To cover the influence of natural impurities requires the testing of many different product batches so will not be an objective of the revised program. The influence of SDAs and a small representative range of other additives could be included.
2.3 Fuel moisture content and contamination
Water can be absorbed by the filter monitors from the fuel and the charging characteristics have previously been found to depend strongly on element wetness. Therefore they will also depend indirectly on the wetness of the fuel. It may be debated whether this needs to be measured separately from element wetness (see below)? Particulate contamination of the elements and fuel may also have an influence. In the present program attempts will be made to ensure water content of the test fuel remains as stable and consistent as possible (and it should be monitored by Karl Fischer and chemical water detector for free water).
2.4 Flow rate
The charge density generated by the passage of fuel through a filter medium will depend on the specific flow rate (the flow per unit element area). The highest charging is expected at a specific flow rate at, or close to, the maximum design value (rated flow) although there is some evidence that the charge density may sometimes go through a maximum. Regarding pipe vs. filter behaviour it was initially considered that streaming currents increased approximately as the square of flow rate in a long pipe and more or less in proportion to the flow rate in a short pipe (residence time shorter than the relaxation time) or in a filter. In the latter cases there would be more or less a constant charge density as the flow rate changed. As filter media residence times are relatively short it was assumed filters behaved as short lengths of high-charging pipe and so we expected a saturating charge density as the flow rate increased and the residence time became short rather than one that went through a maximum. More recent discussions have challenged that view so it is now recommended to do tests at a range of flow rates up to the maximum rated flow for the element under test (noting that it is accepted good practice to operate filter monitors as close as possible to their rated flow). The most robust approach would involve obtaining charging measurements at 50, 60, 70, 80 and 90% of rated flow.
The charge density at the exit from a filter housing is lower than that generated by the elements due to internal relaxation but provided the residence time in the test housing is close to the shortest that could occur in full-scale systems, the ratio of generated charge density to the measured exit charge density should match the in-service ratio. If it is impractical to match residence times, the differences can be allowed for approximately by assuming exponential charge decay. Thus we should be able to infer a reasonable approximation to large scale behaviour from the reduced-scale test data.
Although the charge densities generated at rated flow are expected to be the same in both large- and small-scale systems, the streaming currents are given by charge density multiplied by flow rate (or, equivalently, the media area at maximum rated flow) and are therefore much greater in full scale operations. If the charge density is matched, the full-scale streaming current is easily calculated by simply scaling with flow rate. The reduced- scale tests should thus provide a useful indication of full-scale behaviour.

с
2.5 Temperature
Temperature affects conductivity and could also influence charging but the latter effects have been little explored and are impractical to consider within the current test program. It would be desirable for the test fuel temperatures for all test runs to be within ± 5 °C to minimise variability of water content. The liquid temperature should be recorded for each test run. Prospective test houses will be asked to provide details of the location of their test facilities, in particular any environmental exposure of the fuel storage tanks/IBCs (and whether any attempts will be made to minimize natural convection within the receiving tank caused by external heating).
2.6 Element wetness/contamination
Previous EI work has shown that filter monitor elements that have absorbed free water charge more than dry ones. Therefore element wetness is a factor that needs to be considered. Wetting is most easily controlled in a relatively small system. It would generally be absent in a full scale field trial done with a limited number of tests and element wetness could be hard to vary or verify in a field environment. The test house will be required to condition the filter monitor elements by subjecting them to a predetermined amount of free water via a simple manual injection system as shown and described in section 4.
2.7 Residence time between filter and aircraft
The role of dissipation within the filter housing has already been discussed. The charge density (or streaming current) delivered to an aircraft also depends on dissipation in the pipes and hoses between the filter housing and the aircraft. This depends on the fuel conductivity, the fuel residence time and, especially at higher conductivities where relaxation of the filter charge is almost complete, on the level of charge generation due to pipe flow (because the charge density only decays down to the equilibrium pipe value). For any selected scale of test it is therefore best to choose the pipe diameter and length to match both the test residence time and equilibrium pipe flow charge density to representative values for a full-scale system (although there is uncertainty about the scaling laws for charge density an approximate match is possible). To the extent that this matching is achieved, the relaxation behaviour will be the same in the small-scale tests as in full-scale systems.
3 Selected measurement option
The type of test selected as a result of discussions between the EI and Boeing (October 2015) is laboratory-scale using a rig with two tanks, each with a capacity of around 300 USG (i.e. an IBC of ~1 m3, for both supplying and receiving vessels). The rig needs to accommodate a filter vessel for a single 2” nominal diameter filter monitor element of 30” long (for phase 1 testing) and a filter vessel for a 6" element (flowing outside-to-inside only) and provide fuel flow rates of up to 30 USGPM for phase 1 testing and up to 115 USGPM for phase 2 testing. Also needed is an appropriate length and diameter of pipe/hose between the filter housing and the receiving tank.
The main measurement quantities would be the filter vessel exit streaming current, the dissipation current from the connecting pipe/hose, the streaming current delivered to the receiving tank and the potential or electric field at a specified location in the vapor space of

т
the receiving vessel. The potential or field measurements would continue after the flow has stopped to provide in-tank dissipation measurements.
This approach deals with what is expected to be the highest charging equipment and gives flexible results that can be adapted to predict real-world behaviour even if some circumstances (pipe-lengths and relaxation times) change in future or later turn out to give a different worst-case than was initially anticipated.
4 Medium-scale filter monitor tests
4.1 Rig layout
The desired test rig design is outlined in Figure 13. The sections shown as isolated with insulating flanges should also be mounted on or supported by insulating materials to ensure that they are electrically isolated from ground and from each other. Nylon sheets/blocks are good enough insulation for this purpose. PTFE has better insulating properties but is not needed in this application.
3 A simpler alternative involving circulating liquid continuously through a single source/supply tank was considered inadvisable because of concerns about incomplete charge relaxation in the vessel with a simple vessel design in which liquid might flow relatively directly from inlet to outlet. A two-tank design was thought to be easier to implement than the construction of a one-off tank with internal baffles to prevent direct inlet-to-outlet flow.

у
FIG 1: Medium-scale test rig for streaming current/charge density measurement
updated to include two-way flow from IBC to IBC through the charging filter vessel
The suggested design approach allows:
Measurement of the filter exit current, the dissipation current in the linking pipe and the current delivered to the receiving tank /IBC. A bypass is shown around the filter housing. It is optional but, if provided, it also allows the background pipe charging currents to be verified at all conductivities without opening up the filter to remove the element. This comprehensive set of data should facilitate extrapolation of the results to different full-scale cases.
IBC A
Always fuel source vessel for
charging measurement runs
Flow
meter
Pump
Clay filter
Filter housing
(for 3x2” or 1x6” elements, max 30” long)
with optional DP measurement
Conductivity
sample line
Insulating flange
Filter
electrometer
Relaxation pipe
electrometer
Relaxation
region
Receiving
Vessel
electrometer
Return pump
(optional)
IBC B
Always fuel receiving vessel for
charging measurement runs
Return Line
A single return line
with the option of
terminating in either IBC
Free water
addition
to IBC outlet
with syringe
and tubing
Valve
Three-way valve
Optional water
injection point
Optional second
electrometer in
relaxation pipe

ф
Note: the preferred option is included of the installation of a second electrometer in the relaxation pipe. If provided the relaxation pipe will have to be subdivided into two sections with insulating flanges and a fourth electrometer used. This has the benefit of measuring the relaxation profile in that section.
At low conductivity, charging upstream of the filter will be small compared to the filter and receiving tank currents so an approximate charge balance (Ifilt+Irelax+Irec=Δ where Δ<< all measured currents) should be obtained, which provides a useful consistency check. The imbalance reflects the level of incoming charge plus measurement errors. The charge balance check will fail at high conductivity (when relaxation of the filter charge is complete before the liquid reaches the receiving vessel) as then Ifilt+Irelax=0 and the receiving vessel current will then be comparable to the unmeasured current delivered to the filter vessel from the upstream pipework4.
The fuel in the source tank is always uncharged so there are no concerns about inadequate dissipation in the tank.
Progressive manual injection into the IBC supply outlet of 450 ml of free water (over a period of 1 minute) using a syringe and flexible pipe/tubing (for phase 1) or 1500 ml of free water for phase 2, thereby minimizing water hold up on the sides of the IBC and pipework. This approach is considered to provide the most effective means of water-wetting the filter monitor element (it has been calculated to create a differential pressure across the filter vessel, due to element restriction of fuel flow, of approximately 10-12 psi (elements are required to be replaced when the filter monitor system reaches 22 psi in service)). The progressive addition of water should ensure the filter media reacts uniformly along the length of the elements. Note: A more sophisticated option for water injection immediately before the pump is also highlighted, as is the option for measuring differential pressure across the test filter vessel.
Disadvantages are:
It is not possible to circulate continuously for clay filtration without modifying/realigning the pipework to bypass the receiving vessel (which cannot be pressurised). Extra fixed piping could be provided for this but would increase the number of (potentially troublesome) insulating flanges required.
A separate circulation through the receiving vessel and associated pipes would be needed to clean it by clay filtration (but this IBC and pipes will not affect the measured currents unless the liquid is to be taken back for a repeat test).
Only a single IBC volume can be passed in any one test (not an important limitation with IBC-sized tanks).
4.2 Filter vessel and flow rate choices for small-scale tests
A Velcon Vel Max VX-2 housing would be suitable for both phase 1 and phase 2 tests, given that phase 2 will only expose 6” elements to outside-to-inside flow. Other filter vessel designs from the other major filter manufacturers are similar. It can accommodate either up
4 This condition is easily recognisable because filter and relaxation pipe currents would then be equal and opposite.

мл
to 5x 2" filter elements of 30” long, or 1x 6"filter element of 28/29” long flowing outside-to-inside.
The dimensions suggest that the capacity of a VX-2 is about 65 litre. Fuel hold-up in a rig based on a VX-2 and 15 m of 2” pipe (without worrying about take up into a clay filter vessel as this would be only occasional and could be accommodated) is about 95 litre (30 litre in the pipes as well as the 65 litre in the vessel). Allowing a contingency of 25 litre for pumps, startup etc it is estimated that filling the system would require about 120 litre (32 USG). Assuming a fuel delivery of 250 USG (~945 litre) this would leave about 220 USG for testing. So at 90 USGPM (maximum flow if three 2" elements are fitted per test and two dummy elements used for the other two element positions) the maximum test duration would be about 150 s and at 115 USGPM (max flow with a 6" element) it would be 115 s. These flow times should be adequate to attain steady conditions in a test provided stable water loadings have been previously attained on the elements (where appropriate).
4.3 Flow design criteria
The following design features are suggested to maximise the benefit of the tests:
The pump should be capable of maintaining at least 90 USGPM through the system with Jet fuel for phase 1 testing with 2” elements and 115 USGPM for phase 2 testing with 6” elements. It should also be possible to reduce the flow controllably to lower rates.
The residence volume between the filter elements and the insulating flange downstream of the filter vessel should be known and it would be useful for the associated residence time to be as close as possible to the minimum that would occur in the downstream part of an in-service filter housing. To achieve this, the downstream chamber of the filter monitor housing should have a residence time (volume/rated flow) comparable to or less than the smallest expected in service, then, if the test residence time is shorter than the in-service minimum, it can be made up to the shortest in-service value by including a suitable length of pipe before the downstream insulating flange. Ideally a different length of pipe would be used with each flow rate but a dissipation correction can be made for unmatched lengths if this is impractical.
The residence time in the relaxation pipe should match the shortest expected in a real fueling situation. Again a correction can be applied if this matching is only possible at one flow rate.
At high conductivity the relaxation process in the downstream pipe/hose is virtually complete at the downstream end of a typical pipe/hose length. To match the dissipation behaviour of a full scale system the equilibrium charge density generated in the pipe/hose at rated flow should therefore match that in a real system. An approximate match can be obtained by the careful selection of the diameter of the pipes or hoses in the relaxation region. In principle there is a different optimal pipe diameter for each rated filter flow but it will probably be best to explore relaxation effects only with one standard filter size and accept unmatched pipe charging with other sizes. It is suggested to match filter and relaxation pipe residence times and relaxation pipe charge generation to real systems all at the same (reference) flow rate.
1м
5 Fill time of test vessel
As described in 4.2, if the source tank/IBC has a capacity of about 265 USG (1 m3) an amount of liquid available for test of at least 200 USG (0.76 m3) would allow for some contingency uptake within the test rig. With a test flow rate of 90 USGPM (0.0057 m3/s) this would give a test time of about 130 s for phase 1 testing. This should provide ample flow time to produce steady currents. For phase 2 testing involving a 6” element, the test flow rate of 115 USGPM (0.0073 m3/s) would give a reasonable test time of 104 s. This is slightly shorter than the target 2 min but substantially longer than the test time of 60 s that occasionally was found in previous work not to produce steady currents. It is thought to be a reasonable compromise.
6 Pipe sizing between filter and receiving vessel
In this section the pipe sizing needed to satisfy the residence time and pipe charging requirements outlined in the previous section for the relaxation pipe/hose is calculated.
The matching of pipe charging requirements is considered first. This can be achieved as well as practicable by equalising the values of v/d between the test system and the real system. Consideration of this scaling shows that it fixes the most suitable test pipe diameter as dt = dr(Ft/Fr)1/3 where dr is the in service pipe diameter, Ft is the test flow rate and Fr is the in-service flow rate. This optimum diameter then needs to be rounded to the nearest convenient diameter from the available pipe schedules.
As an example, the highest flow rate through a 4" line in the CRC tests was 560 USGPM and it is proposed to test at about 115 USGPM (for a 6” element). With dr = 4", Ft = 115 USGPM and Fr = 560 USGPM we get dt = 2.4", which leads to dt = 2.5" as the best, standard, schedule 40 test pipe diameter. This has an ID of 62.72 mm. The flow speed is vt = 4Ft/πdt2 and hence the test flow rate of 115 USGPM can be shown to give a flow speed of 2.35 m/s in a 2.5" schedule 40 pipe (c.f. 4.3 m/s in the in-service case).
To make the test system residence time between filter and receiving tank roughly the same as the shortest anticipated in-service filter to plane residence time we estimated a short in-service pipe length would be 20 ft (6.1 m) which, at 4.3 m/s, corresponds to a residence time of 1.4 s. To achieve this residence time in the test system at 115 USGPM (flow speed 2.35 m/s) the pipe length needs to be 3.3 m (~11 ft). A round-number length of 3.0 m (10 ft) would be a reasonable match. This length is quite short. If the receiving tank needs to be more than 3 m from the filter, an insulating flange may be placed 3 m downstream of the downstream filter flange and a further length of pipe or hose used to connect to the receiving tank. This extra length must be insulated from ground but connected electrically to the receiving tank so that the electrometer connected to the receiving tank records the required current, which is the current delivered after the 3 m of relaxation pipe/hose5.
5 If this is done there will be further dissipation before the liquid reaches the measuring tank and the surface potentials estimated from the measurements should not be expected to match those calculated from the measured charge density exiting the dissipation pipe.

1н
7 Other tank requirements
It will be necessary to drain and sometimes clean up the source and receiving tanks between runs. This requires a means of extracting/draining the liquid down to a small residual amount.
The process for measuring maximum surface voltage in the receiving tank relies on the central region of the interior of the tank being unobstructed by pipework. Ideally the calibration calculations require the tank to be rectangular or a vertical axis cylinder and these shapes make it easiest to model the results. In practice, however, the calibration is not very sensitive to shape and all tanks roughly as wide as they are long with an unobstructed central region will have almost the same calibration factor as a cylindrical tank of the same cross sectional area. To avoid inlet and outlet pipes affecting the calibration they are best located in a corner (for a rectangular tank). Both openings should be near the bottom, ideally the fill and drain pipe entries through the tank walls would also be near the bottom but this is not critical if the pipes are close to the wall.
The preferred source and receipt tanks for this programme would be stainless steel IBCs.
8 Measuring equipment
8.1 Electrometers
The Keithley 6514 is a suitable instrument with both analogue and digital outputs. Three or preferably four are needed. It is easier to work with coax cables and BNC connectors rather than triax cables (the current levels to be measured do not need triax). Therefore each electrometer needs to be equipped with a triax to BNC adapter to enable coax connections.
Harold Walmsley Electrostatics Ltd can supply two Keithley 6514 electrometers as part of the Energy Institute sub-contract each with a triax to BNC adapter. These will need to be calibrated by Keithley at a cost. A 3rd electrometer (Keithley type 617) that is not well calibrated and is too old for Keithley to recalibrate is also available from Harold Walmsley Electrostatics Ltd. It is, however, useful as a current source for insulation checking. A third measurement electrometer, along with a third triax to BNC adapter would need to be obtained (if in calibration it could be used to verify the calibration of the other instruments).
8.2 Flow meter
The flow meter range needs to be matched to the test flow rate. A range comfortably covering 120 USGPM is thus suitable if the recommended maximum rate is used in phase 2 testing of a 6” element. It should provide a loggable output and have a response time that is reasonably rapid compared to the test duration. Anything faster than a 5 s response time would be adequate, faster than 1 s would be ideal (data is probably best logged at 0.1 s intervals). The flowmeter signal is used in tandem with the charging current measurements to determine the charge densities so a well-calibrated output is needed.
8.3 Liquid temperature
It is required for the liquid temperature of the fuel in the system to be recorded as this may impact charging and relaxation and there could be anomalies if the temperature changed
мо
between fuels or wandered excessively during a test. It would be desirable for the test fuel temperatures for all test runs to be within ± 5 °C.
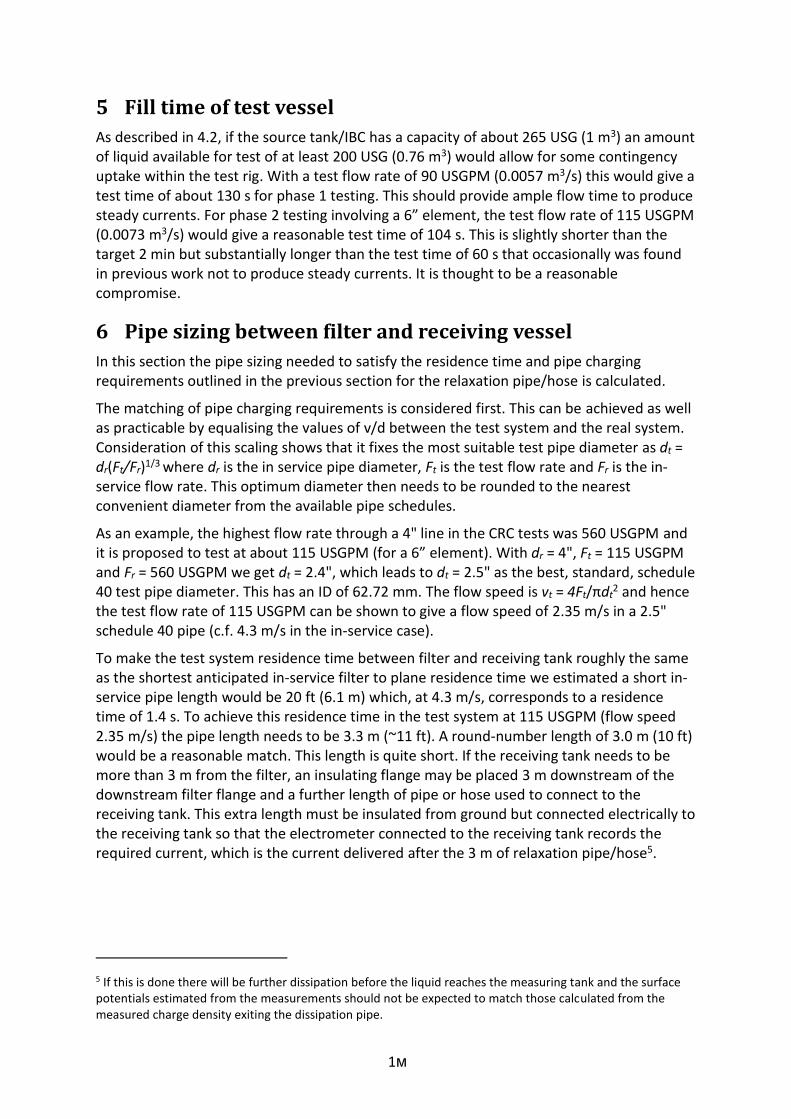
8.4 Ambient temperature and RH
These are regularly logged in static testing. They would be nice to have but for this programme liquid conditions are more important.
8.5 Differential pressure gauge
The test house is asked to advise whether differential pressure readings could be obtained across the filter test vessel, and if so how the reading will be obtained.
8.6 Data logger
This can be chosen based on experience and preferences. It could be time-consuming in post-processing to synchronise all signals if they are recorded independently so unless there is an easy means of synchronising it is recommended to record all the outputs on a single multi-channel data logger.
8.7 Individually measured data
The following are required to be measured via one-at-a-time tests on samples drawn off the system.
8.7.1 Liquid electrical conductivity
Simple dipcells (e.g. EMCEE) would be adequate for tests with additised product but as the base fuels are to be characterised carefully, conductivities down to 1 pS/m may be encountered and at these levels the EMCEE dipcells do not work very repeatably. It is therefore preferred to use a concentric electrode cell (e.g. EMCEE Model 1154).
Conductivity measurements shall be taken in accordance with ASTM D2624/IP274 by personnel experienced in the art as it is easy to get high readings by contamination. A good procedure is to clean up a reference sample of liquid to have a low conductivity and then verify that a low reading can be reproduced with this liquid before making a measurement (but low conductivity references may have very limited shelf life). Verifying absence of contamination is particularly important for making low conductivity measurements after high conductivity ones.
8.7.2 Water content of fuel
If possible it would be good to have available a Karl Fischer apparatus to test the water content of fuel samples. As with the liquid temperature measurements it would be useful to have this data to show if the water content changes as this has been implicated in increased charging. This data would be good to have if the equipment is available, it is probably not essential but could provide useful background if anomalies arise.
8.7.3 Fuel retention samples
One litre test fuel samples are required to be taken before and after each test run and retained in the event that they are needed for further examination.

1п
8.8 Provision of specialist electrostatic measurement support/ expertise by the Energy Institute
The EI has contracted Harold Walmsley Electrostatics Ltd to provide specialist support for the duration of this programme, including to the test house. This includes:
1) Working with the EI and other industry stakeholders, as necessary to finalise the program of testing that will be necessary to establish the streaming current of jet fuel during into-plane fuelling.
2) Ensuring that the test rig set-up meets the requirements for the programme (including initial advice to the test house on test rig design/installation, materials to use and on-site pre-test assessment/checks), including by the provision of required electrometers (calibrated as necessary).
3) Participating in the program of testing, including the taking of required measurements with electrometers. (It is anticipated that the test program can be completed over a five-day period.)
4) Preparing a draft Technical Report that documents and analyses the findings, to establish the maximum streaming current of jet fuel that may occur during into-plane fuelling (Note: The test set-up section and test parameter data for the Technical Report should be provided by the test house).
5) Reviewing/resolving any technical feedback that is provided in response to stakeholder review of the draft Technical Report and providing a final version that is suitable for publication jointly between CRC/EI.
9 Some practical background information
Insulating flanges or flange packs are available but it can be troublesome to get them working well. They are generally designed to isolate cathodic protection systems and not all will reliably give the degree of isolation required. Select good ones if possible (e.g. with good, consistent control of dimensions of PTFE washers, gaskets and sleeves). It may be best to use designs with integrated insulating washers/sleeves and double-length sleeves.
10 Test fuels and additives
10.1 Baseline fuels
The phase 1 test program recognizes that it is unknown what constitutes a ‘worst-case’ fuel in terms of charging. It would be desirable to test a statistically significant number of fuel batches (e.g. >30) from all processing types and feedstocks to be able to establish which is most prone to charging. This is impractical within the constraints of resource availability. Technical discussion between EI and CRC representatives has agreed that the first phase of testing utilizes two base fuels, one of which (with the addition of a pro-static agent) potentially represents a ‘worst-case’ fuel.
Test fuel Description/comments
Jet A (as received) or Jet A1 without SDA (as received
A locally available petroleum based Jet A, meeting the requirements of ASTM D1655, or Jet A1 meeting the requirements of DEF STAN 91-91, with the following restrictions:

1р
a) Measured Flashpoint > 40°C b) Measured Electrical Conductivity < 5 pS/m c) FSII Concentration < 0.02 %V/V (ideally 0)
Clay treated Jet A/Jet A1
Treated to remove all polar impurities to bring conductivity to 0 pS/m. Several passes though the clay cartridges might be required to achieve desired purity. Clay treated fuel will then be tested as soon as practically possible.
Clay treated Jet A/Jet A1 with pro-static agent
Clay treated Jet A will be treated with a pro-static agent (see comments below referring to Green Diesel) to increase charging ability while keeping conductivity at low levels.
Clay treated Jet A/Jet A1 with four concentrations of STADIS 450
Clay treated Jet A dosed with Static Dissipater Additive (SDA) STADIS 450 to achieve the following conductivities will be used:
Measured Electrical Conductivity < 5 pS/m
Measured Electrical Conductivity > 15 pS/m and <25 pS/m
Measured Electrical Conductivity > 190 pS/m and <210 pS/m
Measured Electrical Conductivity > 575 and < 600 pS/m
Synthetic Green Diesel Green Diesel (meeting CEN Technical Specification TS 15940:2012 for paraffinic diesel fuels or a suitable specification adopted in the US) is a synthetic fuel similar to already approved HEFA (hydro-processed esters and fatty acids) fuel. Green Diesel is currently being approved as an aviation drop in fuel and presents an excellent choice for electrostatic testing as it has virtually no heteroatom containing impurities, has 0 pS/m conductivity (when unadditized), has higher than typical Jet A flash point and viscosity, and is commercially available on a large scale.
Note: The purchased neat fuel might contain antioxidant additive, but must be free of other additives. It shall have a Freeze Point of -29 °C maximum. Fuel purchased to CEN TS 15940 shall not contain FAME.
Synthetic Green Diesel with pro-static agent
The purpose of treating Green Diesel with a pro-static agent is to increase charge carrier concentration and charging ability without increasing the fuel’s rest conductivity. Green Diesel additized with the pro-static agent is expected to charge very efficiently, relax slowly, and potentially represent “worst-case” fuel.
Synthetic Green Diesel with STADIS 450
The fuel measured electrical conductivity should be > 600 pS/m. The purpose of treating Green Diesel with SDA to reach a conductivity >600pS/m is two-fold:
1) to simulate accidental “over-additization” and
2) to represent the lower boundary of our test case (fast charge relaxation). Relaxation time is expected to be extremely fast, but the significant increase in charging ability will be of interest.
The test house is expected to obtain the two test fuels directly. Five drums of each fuel type are recommended (four for testing purposes, one for flushing/contingency). All additives/pro-static agents are to be procured by the test house.
Phase 2 testing will be conducted using the test fuel and element condition (wet or dry) that generated the worst-case condition in phase 1 testing.

мс
10.2 Pro-static agent selection
Previous studies have demonstrated that small concentrations of sodium petroleum sulfonates (petrolatum sulfonates) can significantly increase charging ability of fuels passing through a filtration media. For the purpose of this activity petrolatum sulfonates were chosen as a pro-static agent. Boeing has identified three candidate sources, including pure single compounds, see Appendix B.
Prior to commencement of phase 1 testing, assessment of the impact on charging in jet fuel of the three candidate pro-static agents is required (the low conductivity of the recommended additive in Appendix B could be due to low ionic mobility or just to low numbers of free ions as opposed to bonded ion-pairs. The latter might be electrostatically inactive). The one that creates the greatest charge measured downstream of the filter vessel with then be chosen for use in the phase 1 program.
For assessment purposes the test rig is to be configured with the return line terminating in IBC A, the clay treater being by-passed and the filter vessel containing three 2”x30” elements. Jet fuel dosed with one of the candidate pro-static agents is to be passed through the filter at rated flow (90 USGPM) and filter current measurements taken. On completion of the run, circulation through the clay treater will be required to remove the pro-static agent. This procedure is to be followed until filter charging data have been generated for the three pro-static agents. Final pro-static agent selection will be made on site by Harold Walmsley.
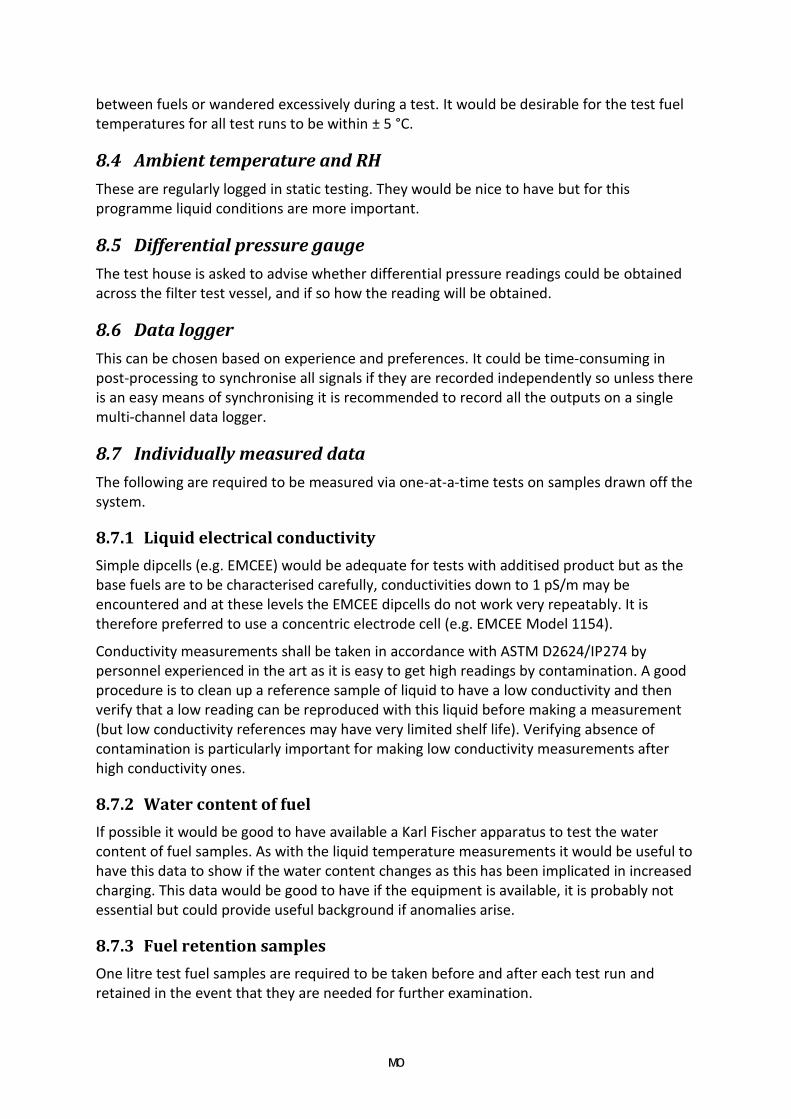
11 Test Matrix
11.1 Phase 1 program
There are 10 test fuel conditions and three 2” filter element types, each of which are required to be tested in dry and water-wetted states, resulting in the test matrix for phase 1 shown in Figure 2. In addition the test condition that generates the worst case is also required to be repeated at 50, 60, 70, 80 and 90% of rated flow, resulting in a total of 25 test runs for 2” elements (20 of those runs each involving testing of three element types, producing a total of 65 test conditions). A total of 195 2” elements will therefore be required. Donations (75 elements each) will be sought from FAUDI Aviation, ParkerVelcon and PECOFacet, but the test house would be required to purchase these quantities if this is unsuccessful.
мт
M1 M2 M3 M1 M2 M3 M1 M2 M3
Fuel
Run 1 Jet A/Jet A1
Run 2 Elements from Run 1
(after water wetting) Jet A/Jet A1
Run 3 New elements
Jet A/Jet A1 clay treated
+STADIS 450
Conductivity < 5 pS/m
Run 4 Elements from Run 3
(after water wetting)
Jet A/Jet A1 clay treated
+STADIS 450
Conductivity < 5 pS/m
Run 5 New elements
Jet A/Jet A1 clay treated
+STADIS 450
Conductivity > 15 pS/m and
<25 pS/m
Run 6 Elements from Run 5
(after water wetting)
Jet A/Jet A1 clay treated
+STADIS 450
Conductivity > 15 pS/m and
<25 pS/m
Run 7 New elements
Jet A/Jet A1 clay treated
+STADIS 450
Conductivity >190 pS/m
and <210 pS/m
Run 8 Elements from Run 7
(after water wetting)
Jet A/Jet A1 clay treated
+STADIS 450
Conductivity >190 pS/m
and <210 pS/m
Run 9 New elements
Jet A/Jet A1 clay treated
+STADIS 450
Conductivity >575 pS/m
and <600 pS/m
Run 10 Elements from Run 9
(after water wetting)
Jet A/Jet A1 clay treated
+STADIS 450
Conductivity >575 pS/m
and <600 pS/m
Run 11 New elements Synthetic green diesel
Run 12 Elements from Run
11 (after water wetting) Synthetic green diesel
Run 13 New elements
Synthetic green diesel +
STADIS 450
Run 14 Elements from Run
13 (after water wetting)
Synthetic green diesel +
STADIS 450
Run 15 New elements
Synthetic green diesel +
PRO-STATIC AGENT
Run 16 Elements from Run
15 (after water wetting)
Synthetic green diesel +
PRO-STATIC AGENT
RUN 17 New elements Jet A/Jet A1 - Clay treated
RUN 18 Elements from Run
17 (after water wetting) Jet A/Jet A1 - Clay treated
Run 19 New elements
Jet A/Jet A1 - Clay treated
+ PRO-STATIC AGENT
Run 20 Elements from RUN
19 (after water wetting)
Jet A/Jet A1 - Clay treated
+ PRO-STATIC AGENT
Facet Wet Faudi Wet Velcon Wet
Facet Wet Faudi Wet Velcon Wet
Facet Dry Faudi Dry Velcon Dry
Facet Dry Faudi Dry Velcon Dry
Facet Dry Faudi Dry Velcon Dry
Facet Wet Faudi Wet Velcon Wet
Facet Dry Faudi Dry Velcon Dry
Facet Wet Faudi Wet Velcon Wet
Facet Dry Faudi Dry Velcon Dry
Facet Wet Faudi Wet Velcon Wet
Facet Dry Faudi Dry Velcon Dry
Facet Wet Faudi Wet Velcon Wet
Facet Dry Faudi Dry Velcon Dry
Facet Wet Faudi Wet Velcon Wet
Facet Dry Faudi Dry Velcon Dry
Facet Wet Faudi Wet Velcon Wet
Facet Dry Faudi Dry Velcon Dry
Facet Wet Faudi Wet Velcon Wet
Facet Dry Faudi Dry Velcon Dry
Facet Wet Faudi Wet Velcon Wet

му
11.2 Phase 2 program
Phase 2 testing with 6” diameter elements involves only one test condition: the worst case test fuel and element condition (wet or dry) from phase 1 testing. There are three outside-to-inside models to be tested, at six flow rates.
To maximize the data that will be obtained from the phase 2 program the two available 6” models with inside-to-outside flow formats (from ParkerVelcon and PECOFacet) will also be tested. So that the test rig and test vessel do not have to be modified, these elements will be deliberately exposed to fuel flowing from outside-to-inside – the same flow configuration for all other tests in phase 1 and 2. Although this condition would not occur in service, it will provide a useful indication of the charging generated by those two models of element.
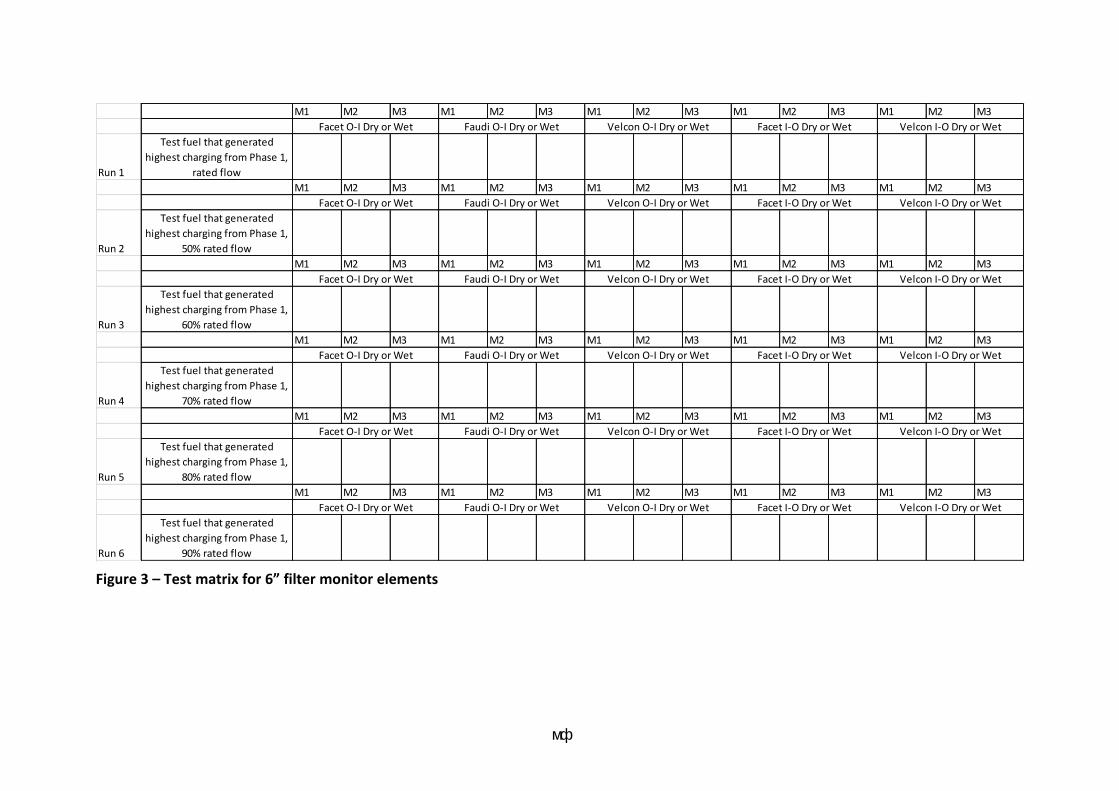
мф
Figure 3 – Test matrix for 6” filter monitor elements
M1 M2 M3 M1 M2 M3 M1 M2 M3 M1 M2 M3 M1 M2 M3
Run 1
Test fuel that generated
highest charging from Phase 1,
rated flow
M1 M2 M3 M1 M2 M3 M1 M2 M3 M1 M2 M3 M1 M2 M3
Run 2
Test fuel that generated
highest charging from Phase 1,
50% rated flow
M1 M2 M3 M1 M2 M3 M1 M2 M3 M1 M2 M3 M1 M2 M3
Run 3
Test fuel that generated
highest charging from Phase 1,
60% rated flow
M1 M2 M3 M1 M2 M3 M1 M2 M3 M1 M2 M3 M1 M2 M3
Run 4
Test fuel that generated
highest charging from Phase 1,
70% rated flow
M1 M2 M3 M1 M2 M3 M1 M2 M3 M1 M2 M3 M1 M2 M3
Run 5
Test fuel that generated
highest charging from Phase 1,
80% rated flow
M1 M2 M3 M1 M2 M3 M1 M2 M3 M1 M2 M3 M1 M2 M3
Run 6
Test fuel that generated
highest charging from Phase 1,
90% rated flow
Facet I-O Dry or Wet Velcon I-O Dry or Wet
Facet O-I Dry or Wet Faudi O-I Dry or Wet Velcon O-I Dry or Wet
Faudi O-I Dry or Wet Velcon O-I Dry or Wet
Facet O-I Dry or Wet Faudi O-I Dry or Wet Velcon O-I Dry or Wet
Facet O-I Dry or Wet Faudi O-I Dry or Wet Velcon O-I Dry or Wet
Facet O-I Dry or Wet
Facet I-O Dry or Wet Velcon I-O Dry or Wet
Facet I-O Dry or Wet Velcon I-O Dry or Wet
Facet I-O Dry or Wet Velcon I-O Dry or Wet
Facet O-I Dry or Wet Faudi O-I Dry or Wet Velcon O-I Dry or Wet Facet I-O Dry or Wet Velcon I-O Dry or Wet
Facet O-I Dry or Wet Faudi O-I Dry or Wet Velcon O-I Dry or Wet Facet I-O Dry or Wet Velcon I-O Dry or Wet

нл
12 Test procedure
1. For first time use or following testing with a different test fuel, the rig may be contaminated. In this case change or remove the filter elements and clean the system to obtain a low and stable conductivity by circulating a cleaning batch of fuel through the clay filter, the charging filter housing and alternately through each IBC. Realignment of the piping/hoses will be required to circulate alternately through source and receiving vessels. Take samples and record the conductivity to assess the progress of the cleaning. Clay filtration changes the fuel behaviour by removing impurities and additives so the cleaning fuel should not be used for testing unless it is the intention to test with a clay treated version of the fuel.
2. Unless clay-filtered fuel is to be tested, remove the cleaning fuel and fill the source vessel with the selected test liquid.
3. Put the selected test element into the filter housing (if changing element involves changing housings change the housing before cleaning the rig).
4. Fill IBC A with 1000 litres of test fuel. 5. Configure return line to IBC B (empty). 6. Open IBC A outlet by directing 3 way outlet valve to supply mode. 7. Admit the test fuel to the filter housing and pipework. 8. Draw a sample and measure the conductivity 9. Pump the fuel through the filter monitor into the receiving tank (IBC B) at the required
flow rate (30 USGPM (rated flow) for a 2” element). Record the filter current, relaxation current (possibly in two places depending on rig set-up), IBC current and ancillary data (temperature, humidity, flow rate) during the fill. The run time may be up to 8 minutes.
10. Run rig until fuel is transferred to IBC B. 11. Until confident of the stability of the conductivity take a repeat sample after the run and
re-check the conductivity. 12. Reposition the return line to return test fuel to IBC A. 13. Adjust 3 way valve to supply position from IBC B. 14. Pump the fuel through the filter monitor into IBC A at the required flow rate (30 USGPM
(rated flow) for a 2” element) 15. After 1 minute insert flexible pipe into lower most point in IBC (supply/outlet pipework).
Attach syringe and progressively inject the required volume of free water (450 ml for phase 1 tests, 1500 ml for phase 2 tests) over a 3 minute period.
16. Run rig until fuel is transferred to IBC A. 17. Configure return line to IBC B (empty). 18. Open IBC A outlet by directing 3 way outlet valve to supply mode. 19. Repeat Step 9, taking required measurements with the water-wetted filter element.
Notes:
It may be necessary to repeat runs until stable, repeatable current readings are obtained.
For test fuels requiring additive addition, additives may be added incrementally to the fuel in the source IBC and mixed by circulation (by-passing the clay filtration).

нм
13 Items to be clarified in proposals from prospective test houses:
1) Whether the test facility would be capable of undertaking the proposed second phase of testing involving the use of 6” nominal diameter filter monitors (flow rate requirement of 115 USGPM compared to 30 USGPM for 2” monitor testing in Phase 1). A single test fuel/filter condition (wet or dry) will be used, but with five models of 6” element (three with outside-to-inside flow format and two with inside-to-outside flow format, of at least 2 lengths for one model).
2) Details of the location of the test facilities, in particular any environmental exposure of the fuel storage tanks/IBCs (and whether any attempts will be made to minimize natural convection within the receiving tank caused by external heating).
3) Details of the source and receiving tanks (volume, geometry, location of tank openings etc).
4) Whether or not a bypass line is included around the filter housing (to allow background pipe charging currents to be verified at all conductivities without opening the filter to remove the element).
5) Provision of a working drawing of the filter test vessel/housing and its associated pipework.
6) Whether differential pressure readings could be obtained across the filter test vessel, and if so how the reading will be obtained.
7) The residence volume between the filter element and the insulating flange downstream of the filter vessel (for both phase 1 and phase 2 set-ups).
8) The residence time in the relaxation pipe. 9) Whether the relaxation pipe is subdivided into two sections with insulating flanges
and a second electrometer installed to provide a second streaming current measurement in the relaxation pipe.
10) Flow meter range and details of its last calibration. 11) Details of the means of data acquisition, e.g. whether or not all the outputs will be
recorded on a single multi-channel data logger. 12) Whether an EMCEE Model 1154 conductivity meter will be used. 13) Whether Karl Fischer apparatus is available to test the water content of fuel samples. 14) Whether there are any perceived difficulties in obtaining the required test fuels,
additives/pro-static agents or filter elements.

нн
Appendix A: Previous field studies of charging vs conductivity with gasoline and diesel
The gasoline studies were field trials that covered one grade of gasoline in one regional distribution system so the performance additive mix was always the same. The conductivities varied from 50 pS/m to about 200 pS/m due to impurity differences. The variation in pipe charging was very scattered with high charging occurring over most of this conductivity range. However, after averaging the data within specified incremental conductivity bands, a clear linear increase in average charging rate as a function of conductivity emerged (i.e. high charging was more frequent at higher conductivity). In follow up tests, the conductivity was raised above 200 pS/m by the injection of Stadis 450 at an upstream depot. A marked fall in charging was observed with these batches. This is not surprising given that Stadis 450 was designed for a strong conductivity response with limited charging and it is not known what the un-additised conductivity of any of these batches would have been. Thus the behaviour observed at an additised conductivity of, say, 300 pS/m might have been that of a 50 pS/m base product (low average charging) plus the effects of an additive that raised conductivity without much further increase in charging. On average this combination would be expected to generate less charge than an un-additised product that had a conductivity of 200 pS/m due to impurities.
In the measurements on diesel, the conductivities depended only on impurity levels and ranged from less than 1 pS/m to about 20 pS/m (most samples below 10 pS/m). The average charging rose with conductivity below about 5 pS/m but was independent of conductivity above this. The difference between gasoline (rising up to 200 pS/m) and diesel (levelling off at 5 pS/m) may be linked to viscosity differences.
но
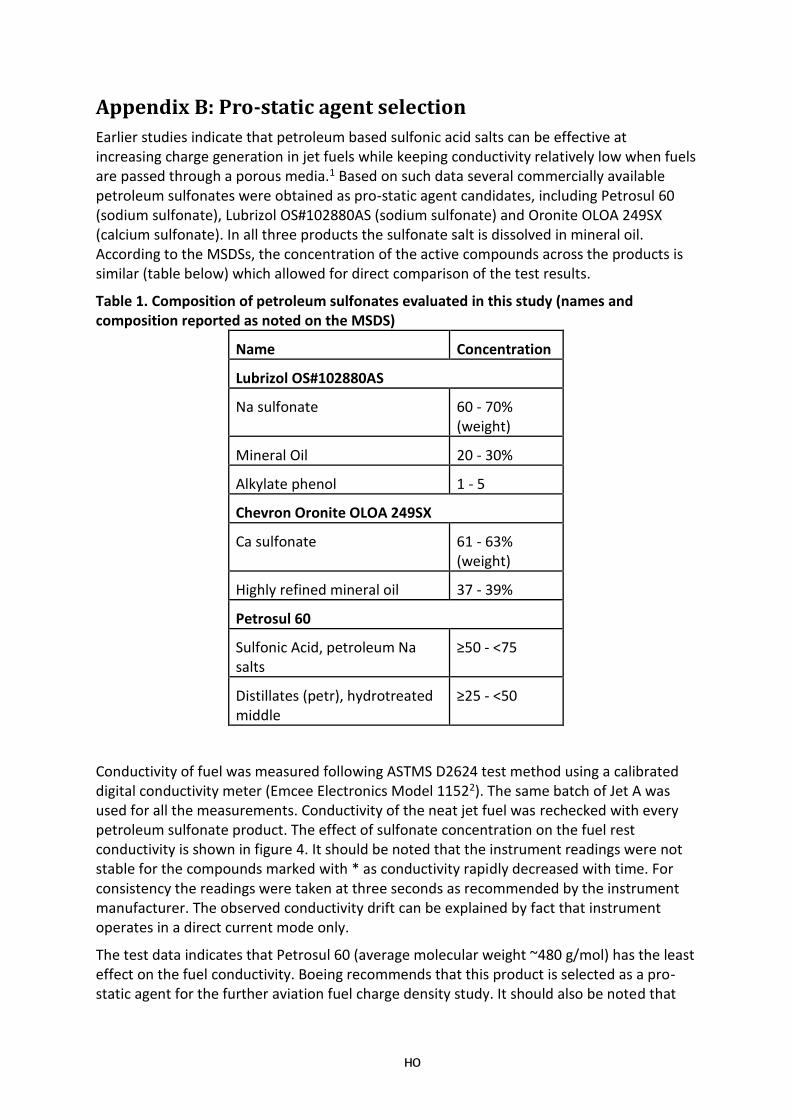
Appendix B: Pro-static agent selection
Earlier studies indicate that petroleum based sulfonic acid salts can be effective at increasing charge generation in jet fuels while keeping conductivity relatively low when fuels are passed through a porous media.1 Based on such data several commercially available petroleum sulfonates were obtained as pro-static agent candidates, including Petrosul 60 (sodium sulfonate), Lubrizol OS#102880AS (sodium sulfonate) and Oronite OLOA 249SX (calcium sulfonate). In all three products the sulfonate salt is dissolved in mineral oil. According to the MSDSs, the concentration of the active compounds across the products is similar (table below) which allowed for direct comparison of the test results.
Table 1. Composition of petroleum sulfonates evaluated in this study (names and composition reported as noted on the MSDS)
Name Concentration
Lubrizol OS#102880AS
Na sulfonate 60 - 70% (weight)
Mineral Oil 20 - 30%
Alkylate phenol 1 - 5
Chevron Oronite OLOA 249SX
Ca sulfonate 61 - 63% (weight)
Highly refined mineral oil 37 - 39%
Petrosul 60
Sulfonic Acid, petroleum Na salts
≥50 - <75
Distillates (petr), hydrotreated middle
≥25 - <50
Conductivity of fuel was measured following ASTMS D2624 test method using a calibrated digital conductivity meter (Emcee Electronics Model 11522). The same batch of Jet A was used for all the measurements. Conductivity of the neat jet fuel was rechecked with every petroleum sulfonate product. The effect of sulfonate concentration on the fuel rest conductivity is shown in figure 4. It should be noted that the instrument readings were not stable for the compounds marked with * as conductivity rapidly decreased with time. For consistency the readings were taken at three seconds as recommended by the instrument manufacturer. The observed conductivity drift can be explained by fact that instrument operates in a direct current mode only.
The test data indicates that Petrosul 60 (average molecular weight ~480 g/mol) has the least effect on the fuel conductivity. Boeing recommends that this product is selected as a pro-static agent for the further aviation fuel charge density study. It should also be noted that
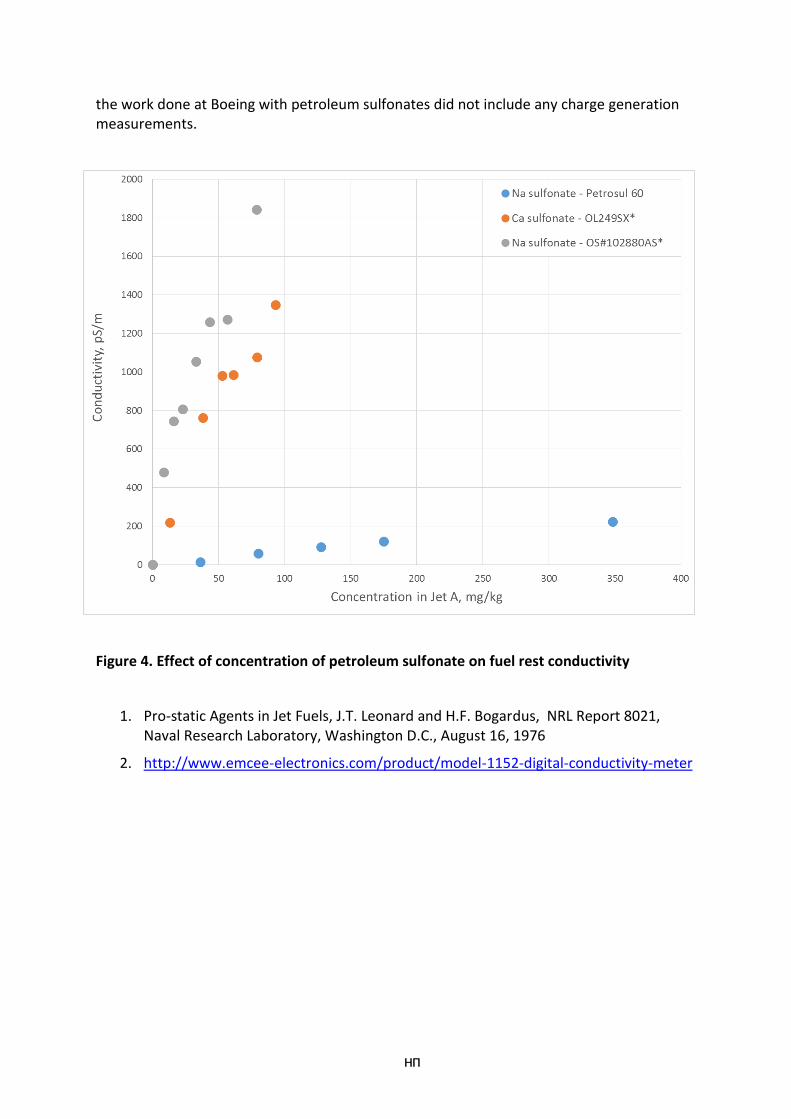
нп
the work done at Boeing with petroleum sulfonates did not include any charge generation measurements.
Figure 4. Effect of concentration of petroleum sulfonate on fuel rest conductivity
1. Pro-static Agents in Jet Fuels, J.T. Leonard and H.F. Bogardus, NRL Report 8021, Naval Research Laboratory, Washington D.C., August 16, 1976
2. http://www.emcee-electronics.com/product/model-1152-digital-conductivity-meter

25
EXHIBIT B
REPORTS
MONTHLY TECHNICAL PROGRESS REPORTS
The contractor shall submit a monthly technical progress report covering work accomplished during each calendar month of the contract performance. An electronic Microsoft Word compatible file of the monthly technical progress report shall be submitted to CRC by the contractor within ten (10) calendar days after the end of each reporting period. The report shall contain a description of overall progress, plus a separate description for each task or other logical segment of work on which effort was expended during the reporting period in accordance with Exhibit A - Statement of Work.
DRAFT AND FINAL REPORT The contractor shall submit to Harold Walmsley and to CRC a complete description of the test set-up and methodology as well as all test data and results in a form ready to be incorporated into a draft final report. A draft report will be prepared by Harold Walmsley under separate contract after completion of the technical effort for each phase specified in the Statement of Work. The draft final report shall document, in detail, the test program and all of the work performed under the contract. The report shall include tables, graphs, diagrams, curves, sketches, photographs and drawings in sufficient detail to comprehensively explain the test program and results achieved under the contract. The report shall be complete in itself and contain no reference, directly or indirectly, to the progress report(s). The draft report will have appropriate editorial review corrections made by Harold Walmsley prior to submission to CRC to avoid obvious formatting, grammar, and spelling errors. The report should be written in a formal technical style employing a format that best communicates the work conducted, results observed, and conclusions derived. Standard practice typically calls for a CRC Title Page, Disclaimer Statement, Foreword/Preface, Table of Contents, List of Figures, List of Tables, List of Acronyms and Abbreviations, Executive Summary, Background, Approach (including a full description of all experimental materials and methods), Results, Conclusions, List of References, and Appendices as appropriate for the scope of the study. Reports submitted to CRC shall be written with a degree of skill and care customarily required by professionals engaged in the same trade and /or profession. The contractor supplying procedures and test data to Harold Walmsley will be asked to review the draft final report in parallel with the CRC Technical and Steering Committee Members. The CRC Technical Committee and Steering Committee shall furnish comments regarding the draft report to the contractor within one (1) month after receipt the draft copy. Within thirty (30) days after receipt of the approved draft copy of the phase reports, Harold Walmsley will make the requested changes and deliver to CRC up to thirty (30) hardcopies including a reproducible master copy of the final report. The final report shall also be submitted as an electronic copy in a Microsoft Word and a pdf or pdf-convertible file format. The electronic copy will be made available for distribution by CRC.
26
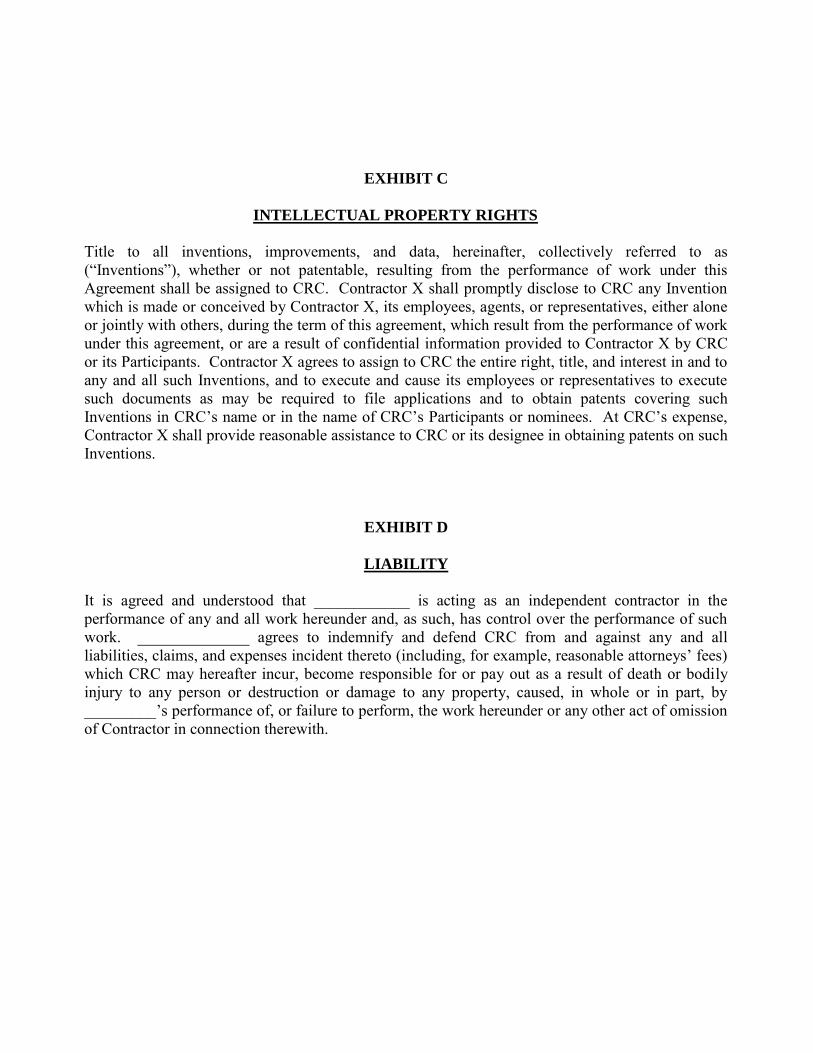
EXHIBIT C
INTELLECTUAL PROPERTY RIGHTS
Title to all inventions, improvements, and data, hereinafter, collectively referred to as (“Inventions”), whether or not patentable, resulting from the performance of work under this Agreement shall be assigned to CRC. Contractor X shall promptly disclose to CRC any Invention which is made or conceived by Contractor X, its employees, agents, or representatives, either alone or jointly with others, during the term of this agreement, which result from the performance of work under this agreement, or are a result of confidential information provided to Contractor X by CRC or its Participants. Contractor X agrees to assign to CRC the entire right, title, and interest in and to any and all such Inventions, and to execute and cause its employees or representatives to execute such documents as may be required to file applications and to obtain patents covering such Inventions in CRC’s name or in the name of CRC’s Participants or nominees. At CRC’s expense, Contractor X shall provide reasonable assistance to CRC or its designee in obtaining patents on such Inventions.
EXHIBIT D
LIABILITY
It is agreed and understood that ____________ is acting as an independent contractor in the performance of any and all work hereunder and, as such, has control over the performance of such work. ______________ agrees to indemnify and defend CRC from and against any and all liabilities, claims, and expenses incident thereto (including, for example, reasonable attorneys’ fees) which CRC may hereafter incur, become responsible for or pay out as a result of death or bodily injury to any person or destruction or damage to any property, caused, in whole or in part, by _________’s performance of, or failure to perform, the work hereunder or any other act of omission of Contractor in connection therewith.
27
EXHIBIT E
PROPOSAL EVALUATION CRITERIA
1) Merits of proposed technical approach including specific focus on “Items to
be Clarified” listed in Exhibit A, Attachment A, Section 13.
2) Previous performance on related research studies.
3) Personnel available for proposed study – related experience.
4) Timeliness of study completion.
5) Cost.


![arXiv:1912.09068v1 [stat.ML] 19 Dec 2019mosb/public/pdf/5115/Granziol et al_2019_A … · spectral density approximation, based on the method of Maximum Entropy, which fully respects](https://img.pdfslide.tips/doc/110x75/5f2f3fe3e7a5c007373215a2/arxiv191209068v1-statml-19-dec-mosbpublicpdf5115granziol-et-al2019a-.jpg)


![Hino et al. [b] · 2019. 9. 3. · Uroglena Americana was most dominant species and its maximum cell density was 12900 cells/ml in 2002, and 2300 2003 although its density varied](https://img.pdfslide.tips/doc/110x75/60b318cd1339703a4d272d4e/hino-et-al-b-2019-9-3-uroglena-americana-was-most-dominant-species-and-its.jpg)