Embed Size (px)
Citation preview
Athene Holding Ltd(“AHL”)
September 9, 2015

Athene Delivers Strong Year‐End 2014 GAAP Results and Business Momentum continues in 2015
2
Continued robust earnings with GAAP operating performance resulting in operating profit of $811 million and operating ROE excluding AOCI of 24.6% for the year ended December 31, 2014, in excess of Athene’s long‐term targets
Capital growth from strong earnings delivering Q2 2015 aggregated regulatory capital of $7.4 billion(1) and aggregated capital‐to‐reserve ratio of 13.9%, well above our more highly rated peers
“A‐” rating achieved from our three rating agencies in 2015
Retail annuity sales of $1.6 billion through July 31, 2015 with continued focus on disciplined underwriting and profitability
Brand Awareness campaign second flight of TV and online advertising began September 8
Athene’s acquisition of Delta Lloyd Deutschland AG and its subsidiaries (DLD) is expected to close by the fourth quarter of 2015 with assets of approximately $6 billion, subject to regulatory approvals
Release of YTD Q2 2015 GAAP financial results are expected in early October
(1) See appendix on page 24 for the definition of aggregated regulatory capital.
Athene has Executed on Key Initiatives Across the Organization
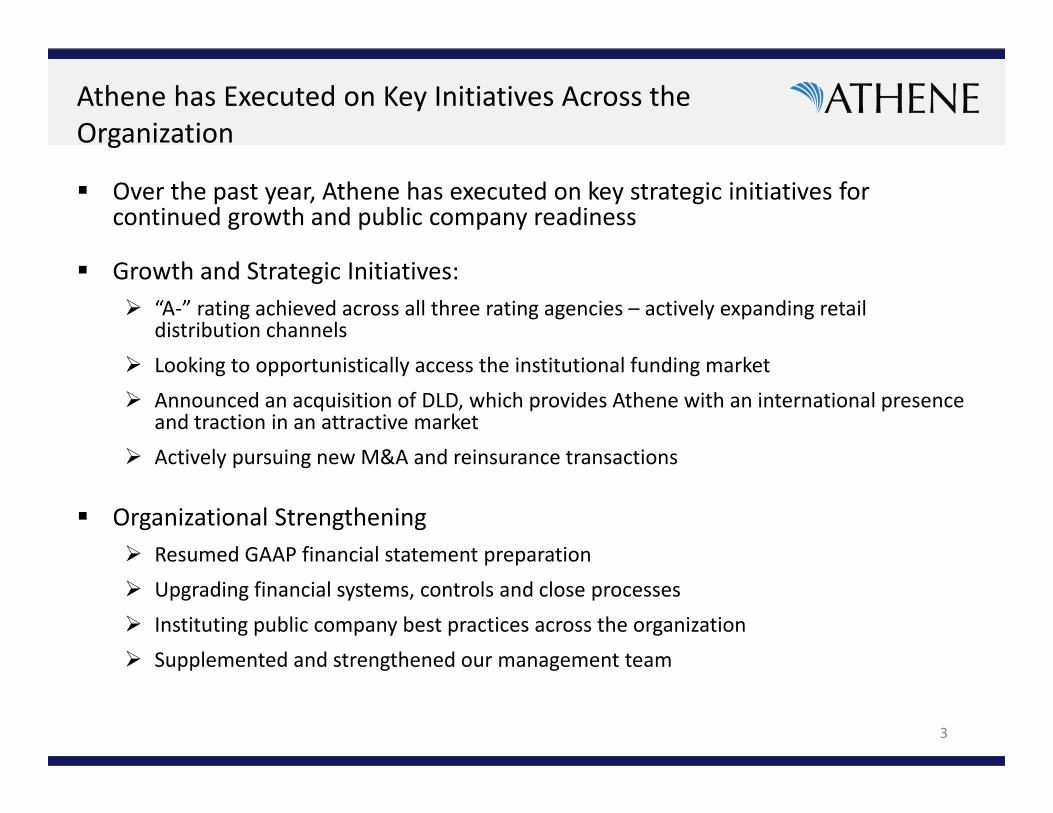
Over the past year, Athene has executed on key strategic initiatives for continued growth and public company readiness
Growth and Strategic Initiatives: “A‐” rating achieved across all three rating agencies – actively expanding retail
distribution channels Looking to opportunistically access the institutional funding market Announced an acquisition of DLD, which provides Athene with an international presence
and traction in an attractive market Actively pursuing new M&A and reinsurance transactions
Organizational Strengthening Resumed GAAP financial statement preparation Upgrading financial systems, controls and close processes Instituting public company best practices across the organization Supplemented and strengthened our management team
3
Executive Team Additions
Over the past year, Athene has recruited talent across the organization to supplement its strong management team. Key recent hires include:
Tom Daula, Chief Risk Officer, AHL – Tom brings 39 years of financial services risk management experience to Athene, having most recently served as CRO for both UBS Investment Bank and Morgan Stanley
Mike Downing, Chief Actuary, AUSA – Mike brings 21 years of actuarial experience to Athene, having most recently served as Senior Vice President of Inforce & Risk Management at Allstate
Randy Epright, Chief Information Officer, AHL – Randy brings over 25 years of IT and operating experience to Athene, having most recently served as Global Business Information Officer for AIG’s consumer businesses
Last week, Athene announced the hiring of Bill Wheeler as President of Athene Holding Ltd., effective September 28, 2015
Bill brings 28 years of insurance and financial services experience to Athene
Most recently, Bill served as President of MetLife’s Americas division, responsible for overseeing over $700 billion of assets and over $5.5 billion of operating earnings for MetLife’s Insurance and Retirement businesses in the U.S. and Latin America
Bill previously served as CFO and Treasurer of MetLife, responsible for all financial management matters, including Financial Reporting, Treasury, Corporate, Actuarial, Risk, Tax, IR and M&A
4

Business Update
Athene’s Core Business Continues to Perform Well
6
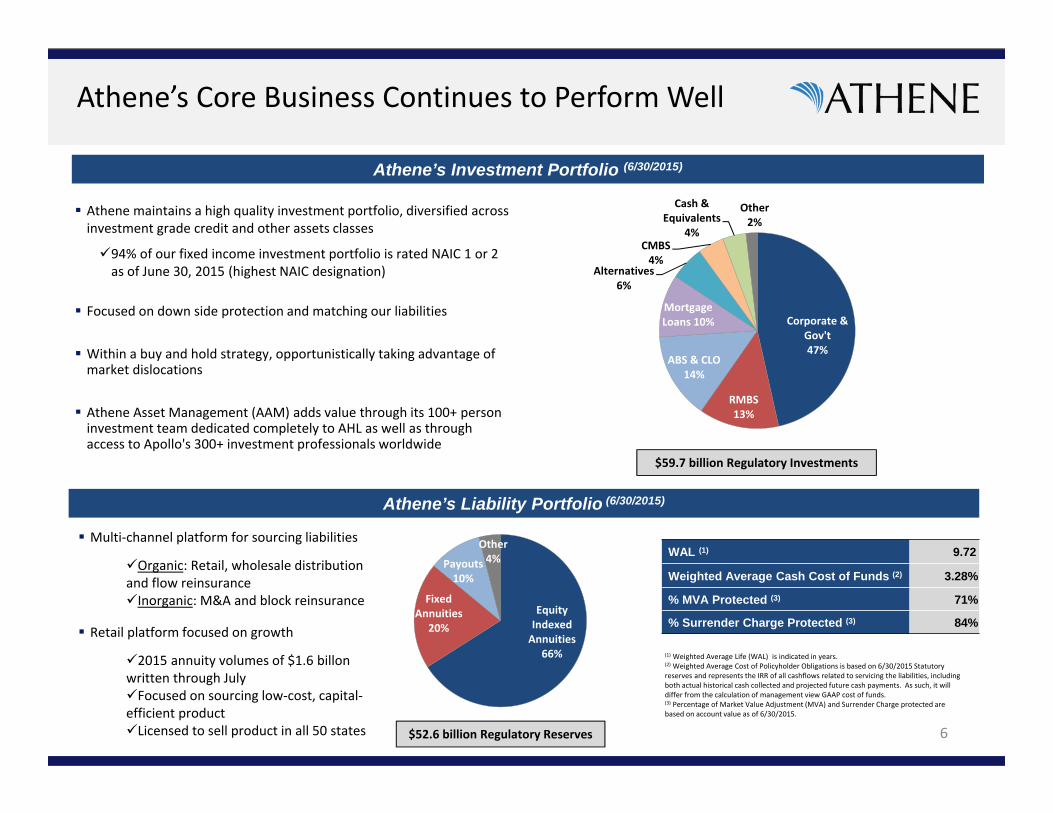
Athene maintains a high quality investment portfolio, diversified across investment grade credit and other assets classes
94% of our fixed income investment portfolio is rated NAIC 1 or 2 as of June 30, 2015 (highest NAIC designation)
Focused on down side protection and matching our liabilities
Within a buy and hold strategy, opportunistically taking advantage of market dislocations
Athene Asset Management (AAM) adds value through its 100+ person investment team dedicated completely to AHL as well as through access to Apollo's 300+ investment professionals worldwide
Athene’s Investment Portfolio (6/30/2015)
Athene’s Liability Portfolio (6/30/2015)
(1) Weighted Average Life (WAL) is indicated in years. (2) Weighted Average Cost of Policyholder Obligations is based on 6/30/2015 Statutory reserves and represents the IRR of all cashflows related to servicing the liabilities, including both actual historical cash collected and projected future cash payments. As such, it will differ from the calculation of management view GAAP cost of funds.(3) Percentage of Market Value Adjustment (MVA) and Surrender Charge protected are based on account value as of 6/30/2015.
WAL (1) 9.72
Weighted Average Cash Cost of Funds (2) 3.28%
% MVA Protected (3) 71%
% Surrender Charge Protected (3) 84%
$59.7 billion Regulatory Investments
$52.6 billion Regulatory Reserves
Equity Indexed Annuities
66%
Fixed Annuities
20%
Payouts10%
Other4%
Corporate & Gov't47%
RMBS13%
ABS & CLO14%
Mortgage Loans 10%
Alternatives6%
CMBS4%
Cash & Equivalents
4%
Other2%
Multi‐channel platform for sourcing liabilities
Organic: Retail, wholesale distribution and flow reinsuranceInorganic: M&A and block reinsurance
Retail platform focused on growth
2015 annuity volumes of $1.6 billon written through JulyFocused on sourcing low‐cost, capital‐efficient productLicensed to sell product in all 50 states

Financial Statement Update
GAAP December 31, 2014 Results
8
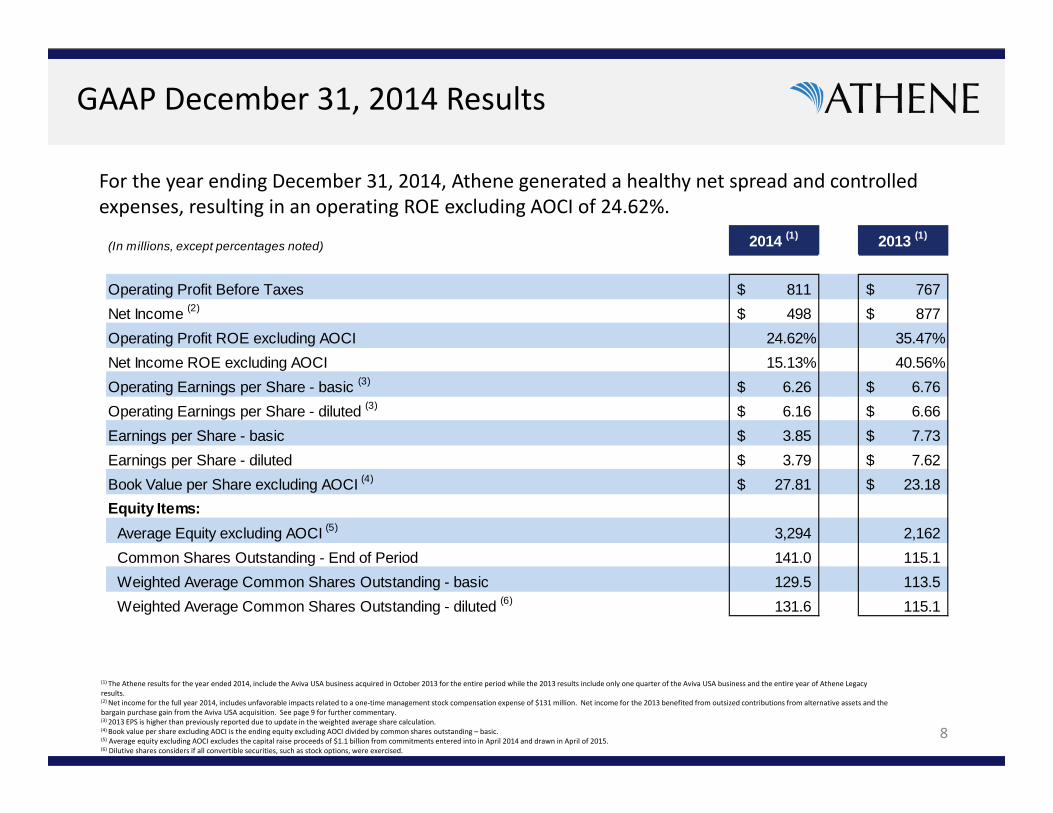
For the year ending December 31, 2014, Athene generated a healthy net spread and controlled expenses, resulting in an operating ROE excluding AOCI of 24.62%.
(1) The Athene results for the year ended 2014, include the Aviva USA business acquired in October 2013 for the entire period while the 2013 results include only one quarter of the Aviva USA business and the entire year of Athene Legacy results.(2) Net income for the full year 2014, includes unfavorable impacts related to a one‐time management stock compensation expense of $131 million. Net income for the 2013 benefited from outsized contributions from alternative assets and the bargain purchase gain from the Aviva USA acquisition. See page 9 for further commentary.(3) 2013 EPS is higher than previously reported due to update in the weighted average share calculation.(4) Book value per share excluding AOCI is the ending equity excluding AOCI divided by common shares outstanding – basic.(5) Average equity excluding AOCI excludes the capital raise proceeds of $1.1 billion from commitments entered into in April 2014 and drawn in April of 2015.(6) Dilutive shares considers if all convertible securities, such as stock options, were exercised.
(In millions, except percentages noted) 2014 (1) 2013 (1)
Operating Profit Before Taxes 811$ 767$ Net Income (2) 498$ 877$ Operating Profit ROE excluding AOCI 24.62% 35.47%Net Income ROE excluding AOCI 15.13% 40.56%Operating Earnings per Share - basic (3) 6.26$ 6.76$ Operating Earnings per Share - diluted (3) 6.16$ 6.66$ Earnings per Share - basic 3.85$ 7.73$ Earnings per Share - diluted 3.79$ 7.62$ Book Value per Share excluding AOCI (4) 27.81$ 23.18$ Equity Items:
Average Equity excluding AOCI (5) 3,294 2,162 Common Shares Outstanding - End of Period 141.0 115.1 Weighted Average Common Shares Outstanding - basic 129.5 113.5 Weighted Average Common Shares Outstanding - diluted (6) 131.6 115.1
Athene GAAP Financial Update – Full Year 2014
9
Athene’s overall spread business framework forms the foundation for its continued strong performance. Favorable investment performance along with persistent, long‐term liabilities results in sustained margin strength and results.
For the year ended December 31, 2014 management view operating income is $811 million, resulting in operating ROE (ex‐AOCI) of 24.62%. Net income is $498 million, a ROE (ex‐AOCI) of 15.13%.
Net investment earned rate of 4.30%, reflecting strong performance in Athene’s fixed income portfolio as well as alternative assets.
Excluding alternative performance, the net investment earned rate for 2014 is 3.97%, while 2013 was 4.16%. Fixed income performance as well as redeployment of Aviva USA acquired assets continue to increase rates throughout 2014. However the marking of the Aviva USA acquired assets to market as part of purchase accounting, lowered the book yield compared to 2013.
Cost of Funds of (2.56%), is consistent with expectations and favorable to 2013, benefiting from the lower cost of funds within the Aviva USA acquired business.
Other operating expenses of (0.36%), is favorable to 2013 as operating efficiencies from acquisitions continue to take hold.
Non‐operating items of (0.52%) includes integration and restructuring expenses, one‐time expenses, and tax and economic impacts which fluctuate period‐to‐period.
Non‐operating items in 2014 primarily relate to one‐time expenses, including $131 million of management stock compensation expense recognized in connection with the 2014 capital raise and the unwind of Apollo monitoring fee (TASA) of approximately $226 million, which terminated in 2014. Non‐operating items also include investment gains as a result of the asset redeployment strategy, the mark to market of our fixed‐indexed annuity embedded derivatives (net of hedging)(1) and tax expense.
The 2013 non‐operating adjustments benefited from the bargain purchase gain from the Aviva USA acquisition as well as the mark to market of our fixed‐indexed annuity embedded derivatives (net of hedging)(1) driven by favorable market movements.
(1) Athene primarily hedges with options that align with index terms for its FIA products (typically 1‐2 years). From an economic basis this is suitable because policyholder accounts are credited with index performance at the end of each index term. However, because the VED (“value of embedded derivative”) in an FIA contract is longer‐dated, there is a duration mismatch which may lead to an accounting mismatch even though Athene is economically hedged.
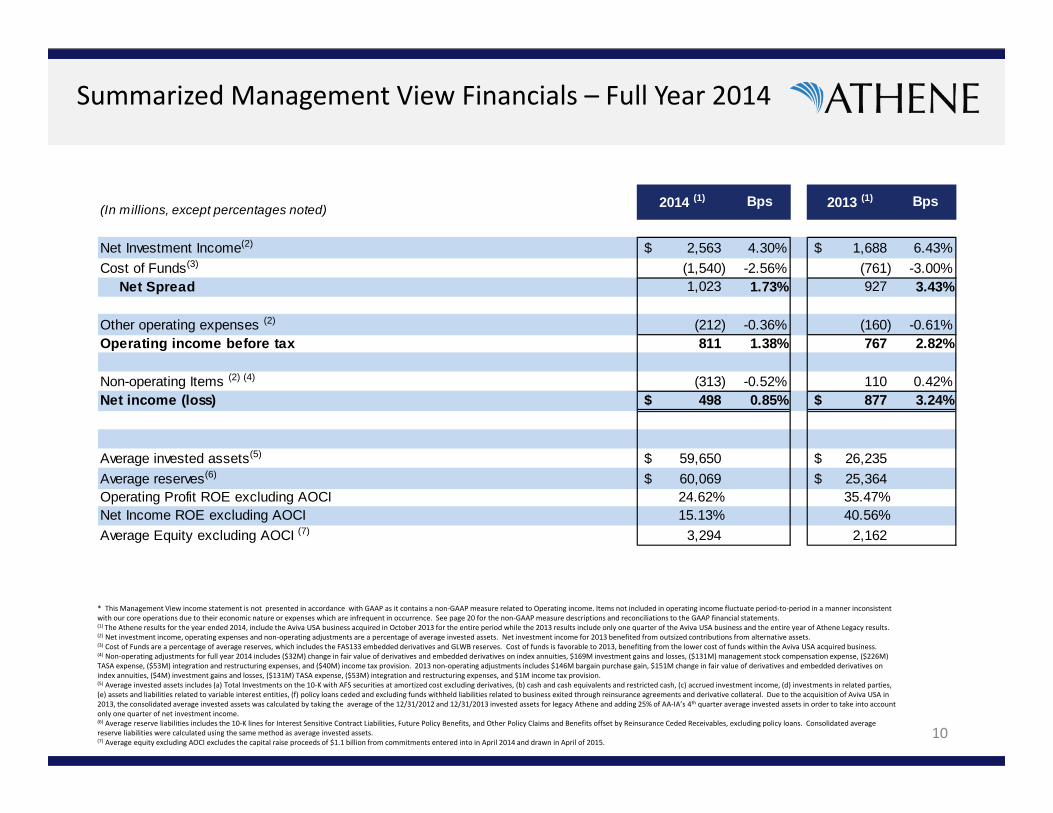
Summarized Management View Financials – Full Year 2014
10
(In millions, except percentages noted) 2014 (1) Bps 2013 (1) Bps
Net Investment Income(2) 2,563$ 4.30% 1,688$ 6.43%Cost of Funds(3) (1,540) -2.56% (761) -3.00%
Net Spread 1,023 1.73% 927 3.43%
Other operating expenses (2) (212) -0.36% (160) -0.61%Operating income before tax 811 1.38% 767 2.82%
Non-operating Items (2) (4) (313) -0.52% 110 0.42%Net income (loss) 498$ 0.85% 877$ 3.24%
Average invested assets(5) 59,650$ 26,235$ Average reserves(6) 60,069$ 25,364$ Operating Profit ROE excluding AOCI 24.62% 35.47%Net Income ROE excluding AOCI 15.13% 40.56%Average Equity excluding AOCI (7) 3,294 2,162
* This Management View income statement is not presented in accordance with GAAP as it contains a non‐GAAP measure related to Operating income. Items not included in operating income fluctuate period‐to‐period in a manner inconsistent with our core operations due to their economic nature or expenses which are infrequent in occurrence. See page 20 for the non‐GAAP measure descriptions and reconciliations to the GAAP financial statements.(1) The Athene results for the year ended 2014, include the Aviva USA business acquired in October 2013 for the entire period while the 2013 results include only one quarter of the Aviva USA business and the entire year of Athene Legacy results.(2) Net investment income, operating expenses and non‐operating adjustments are a percentage of average invested assets. Net investment income for 2013 benefited from outsized contributions from alternative assets.(3) Cost of Funds are a percentage of average reserves, which includes the FAS133 embedded derivatives and GLWB reserves. Cost of funds is favorable to 2013, benefiting from the lower cost of funds within the Aviva USA acquired business.(4) Non‐operating adjustments for full year 2014 includes ($32M) change in fair value of derivatives and embedded derivatives on index annuities, $169M investment gains and losses, ($131M) management stock compensation expense, ($226M) TASA expense, ($53M) integration and restructuring expenses, and ($40M) income tax provision. 2013 non‐operating adjustments includes $146M bargain purchase gain, $151M change in fair value of derivatives and embedded derivatives on index annuities, ($4M) investment gains and losses, ($131M) TASA expense, ($53M) integration and restructuring expenses, and $1M income tax provision.(5) Average invested assets includes (a) Total Investments on the 10‐K with AFS securities at amortized cost excluding derivatives, (b) cash and cash equivalents and restricted cash, (c) accrued investment income, (d) investments in related parties, (e) assets and liabilities related to variable interest entities, (f) policy loans ceded and excluding funds withheld liabilities related to business exited through reinsurance agreements and derivative collateral. Due to the acquisition of Aviva USA in 2013, the consolidated average invested assets was calculated by taking the average of the 12/31/2012 and 12/31/2013 invested assets for legacy Athene and adding 25% of AA‐IA’s 4th quarter average invested assets in order to take into account only one quarter of net investment income.(6) Average reserve liabilities includes the 10‐K lines for Interest Sensitive Contract Liabilities, Future Policy Benefits, and Other Policy Claims and Benefits offset by Reinsurance Ceded Receivables, excluding policy loans. Consolidated average reserve liabilities were calculated using the same method as average invested assets.(7) Average equity excluding AOCI excludes the capital raise proceeds of $1.1 billion from commitments entered into in April 2014 and drawn in April of 2015.
11
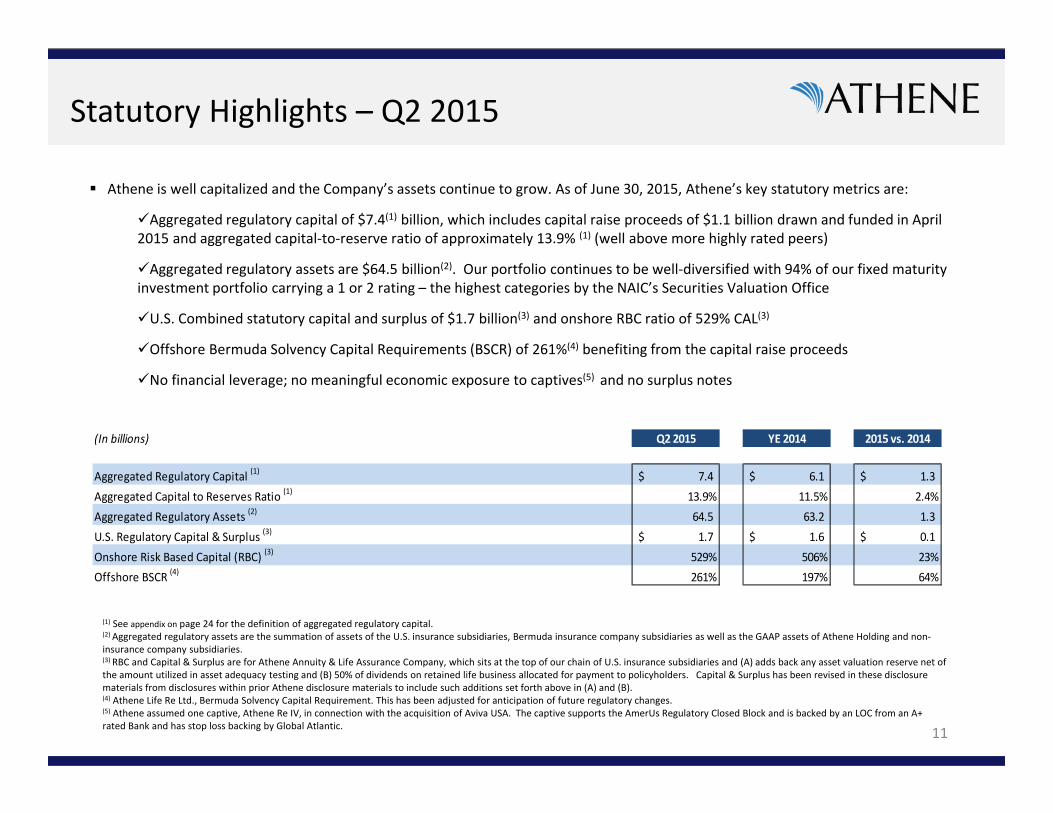
Athene is well capitalized and the Company’s assets continue to grow. As of June 30, 2015, Athene’s key statutory metrics are:
Aggregated regulatory capital of $7.4(1) billion, which includes capital raise proceeds of $1.1 billion drawn and funded in April 2015 and aggregated capital‐to‐reserve ratio of approximately 13.9% (1) (well above more highly rated peers)
Aggregated regulatory assets are $64.5 billion(2). Our portfolio continues to be well‐diversified with 94% of our fixed maturity investment portfolio carrying a 1 or 2 rating – the highest categories by the NAIC’s Securities Valuation Office
U.S. Combined statutory capital and surplus of $1.7 billion(3) and onshore RBC ratio of 529% CAL(3)
Offshore Bermuda Solvency Capital Requirements (BSCR) of 261%(4) benefiting from the capital raise proceeds
No financial leverage; no meaningful economic exposure to captives(5) and no surplus notes
Statutory Highlights – Q2 2015
(1) See appendix on page 24 for the definition of aggregated regulatory capital. (2) Aggregated regulatory assets are the summation of assets of the U.S. insurance subsidiaries, Bermuda insurance company subsidiaries as well as the GAAP assets of Athene Holding and non‐insurance company subsidiaries.(3) RBC and Capital & Surplus are for Athene Annuity & Life Assurance Company, which sits at the top of our chain of U.S. insurance subsidiaries and (A) adds back any asset valuation reserve net of the amount utilized in asset adequacy testing and (B) 50% of dividends on retained life business allocated for payment to policyholders. Capital & Surplus has been revised in these disclosure materials from disclosures within prior Athene disclosure materials to include such additions set forth above in (A) and (B).(4) Athene Life Re Ltd., Bermuda Solvency Capital Requirement. This has been adjusted for anticipation of future regulatory changes.(5) Athene assumed one captive, Athene Re IV, in connection with the acquisition of Aviva USA. The captive supports the AmerUs Regulatory Closed Block and is backed by an LOC from an A+ rated Bank and has stop loss backing by Global Atlantic.
(In billions) Q2 2015 YE 2014 2015 vs. 2014
Aggregated Regulatory Capital (1) 7.4$ 6.1$ 1.3$ Aggregated Capital to Reserves Ratio (1) 13.9% 11.5% 2.4%Aggregated Regulatory Assets (2) 64.5 63.2 1.3 U.S. Regulatory Capital & Surplus (3) 1.7$ 1.6$ 0.1$ Onshore Risk Based Capital (RBC) (3) 529% 506% 23%Offshore BSCR (4) 261% 197% 64%

Germany Acquisition Update
Pending Acquisition Update: Delta Lloyd Germany
• Athene announced the acquisition of Delta Lloyd Deutschland AG and its subsidiaries (“DLD”) on January 15, 2015
– DLD, located in Wiesbaden, is the German subsidiary of Delta Lloyd NV, an Amsterdam‐based financial services provider
– DLD had assets of approximately $6.0 billion as of December 31, 2014– DLD’s business (retirement savings products) is currently in run‐off
• German regulator has indicated that Athene’s applications are complete and entered into its official assessment period
• Athene expects to complete the acquisition in the fourth quarter 2015, subject to German regulatory approval
• Integration plans are being executed:– Solvency II, which will become effective for the German company on January 1, 2016– Preparation of GAAP financial statements starting with 4Q 2015– Asset strategy optimization – balancing long‐term obligations to policyholders with current
low interest rate environment– Rebranding
• Athene continues to examine opportunities that may result from many players retrenching to core products and home markets
13
Appendix

Summarized Management View Financials – Quarterly
15
Net investment earned rates continue to increase as Aviva USA acquired assets continue to be redeployed into high earning, high‐quality strategies. Alternative performance in Q3 lowered earned rates while Q4 resulted in strong alternative performance, increasing earned rates.
Full year 2014 cost of funds of 2.56%, in line with Q1 and Q4 2014 cost of funds. Q2 and Q3 were impacted by DAC / VOBA / DSI / SOP model unlocking impacts from changes on investment returns, mortality and other policyholder behavior ($24 million favorable in Q2 and $20 million unfavorable in Q3). The unlocking process was completed across two quarters in 2014, with unfavorable unlocking in the third quarter primarily offsetting the favorable second quarter impacts.
Non‐operating adjustments were impacted in Q2 2014 by a one‐time management stock compensation expense of $131 million. The volatility in the mark to market of our fixed‐indexed annuity embedded derivatives (net of hedging)(6) as well as the tax expense impacts also drive the quarterly net income results.
(In millions, except percentages noted)
Q1 2014 Bps Q2 2014 Bps Q3 2014 Bps Q4 2014 Bps YTD Actual Bps
Net Investment Income(1) 621$ 4.13% 630$ 4.23% 604$ 4.08% 708$ 4.78% 2,563$ 4.30%Cost of Funds(2) (387) -2.56% (365) -2.43% (401) -2.67% (387) -2.58% (1,540) -2.56%
Net Spread 234 1.57% 265 1.80% 203 1.41% 321 2.20% 1,023 1.73%
Other operating expenses (1) (48) -0.32% (62) -0.42% (59) -0.40% (43) -0.29% (212) -0.36%Operating income before tax 186 1.25% 203 1.39% 144 1.01% 278 1.91% 811 1.38%
Non-operating Items (1) (85) -0.56% (169) -1.13% (6) -0.04% (53) -0.36% (313) -0.52%Net income (loss) 101$ 0.69% 34$ 0.25% 138$ 0.97% 225$ 1.55% 498$ 0.85%
Average invested assets(3) 60,203$ 59,608$ 59,313$ 59,217$ 59,650$ Average reserves(4) 60,316$ 60,180$ 60,100$ 59,959$ 60,069$ Operating Profit ROE excluding AOCI 27.37% 26.32% 16.46% 29.38% 24.62%Net Income ROE excluding AOCI 14.87% 4.39% 15.77% 23.82% 15.13%Average Equity excluding AOCI (5) 2,724 3,082 3,508 3,777 3,294
Three Months Ended Year-to-Date
* This Management View income statement is not presented in accordance with GAAP as it contains a non‐GAAP measure related to Operating income. Items not included in operating income fluctuate period‐to‐period in a manner inconsistent with our core operations due to their economic nature or expenses which are infrequent in occurrence. See page 20 for the non‐GAAP measure descriptions and reconciliations to the GAAP financial statements.(1) Net investment income, operating expenses and non‐operating adjustments are a percentage of average invested assets. (2) Cost of Funds are a percentage of average reserves, which includes the FAS133 embedded derivatives and GLWB reserves.(3) Average invested assets includes (a) Total Investments on the 10‐K with AFS securities at amortized cost excluding derivatives, (b) cash and cash equivalents and restricted cash, (c) accrued investment income, (d) investments in related parties, (e) assets and liabilities related to variable interest entities, (f) policy loans ceded and excluding funds withheld liabilities related to business exited through reinsurance agreements and derivative collateral.(4) Average reserve liabilities includes the 10‐K lines for Interest Sensitive Contract Liabilities, Future Policy Benefits, and Other Policy Claims and Benefits offset by Reinsurance Ceded Receivables, excluding policy loans. Consolidated average reserve liabilities were calculated using the same method as average invested assets.(5) Average equity excluding AOCI excludes the capital raise proceeds of $1.1 billion from commitments entered into in April 2014 and drawn in April of 2015.(6) Athene primarily hedges with options that align with index terms for its FIA products (typically 1‐2 years). From an economic basis this is suitable because policyholder accounts are credited with index performance at the end of each index term. However, because the VED (“value of embedded derivative”) in an FIA contract is longer‐dated, there is a duration mismatch which may lead to an accounting mismatch even though Athene is economically hedged.

Management View Income Statement
16* This Management View income statement is not presented in accordance with GAAP as it contains a non‐GAAP measure related to Operating income. Items not included in operating income fluctuate period‐to‐period in a manner inconsistent with our core operations due to their economic nature or expenses which are infrequent in occurrence. See page 20 for the non‐GAAP measure descriptions and reconciliations to the GAAP financial statements.(1) The Athene results for the year ended 2014, include the Aviva USA business acquired in October 2013 for the entire period while the 2013 results include only one quarter of the Aviva USA business and the entire year of Athene Legacy results.(2) Integration and restructuring expense includes integration and restructuring expenses related to mergers and acquisitions as well as one‐time expenses related to management stock compensation expense and TASA expenses. See page 9 for further commentary.
(In millions)
Q1 2014 Q2 2014 Q3 2014 Q4 2014 YTD 2014 (1) YTD 2013 (1)
Operating Revenue:Premiums 27$ 28$ 21$ 24$ 100$ (1,137)$ Product Charges 53 58 60 60 231 80
Investment related income - Alternatives 100 92 35 132 359 691 Investment related income - Fixed and other 590 604 638 642 2,474 1,122 Investment related expenses (69) (66) (69) (66) (270) (125)
Net Investment Income 621 630 604 708 2,563 1,688 Other Revenues 6 6 6 2 20 9
Total operating revenues 707 722 691 794 2,914 640
Operating Benefits and Expenses:Interest Sensitive Contract Benefits 247 254 247 238 986 512 Amortization of DSI 2 (10) 7 6 5 13 Future Policy and Other Policy Benefits 139 149 144 122 554 (1,009) Amortization of DAC & VOBA 30 8 39 46 123 97 Interest Expense 1 - - - 1 2 Dividends to policyholders 12 11 11 10 44 11 Policy expenses, net of deferrals 42 45 40 51 178 87 Other operating expense 48 62 59 43 212 160
Total operating benefits and expenses 521 519 547 516 2,103 (127)
Operating income, before tax 186 203 144 278 811 767
Non-operating items:Bargain Purchase Gain - - - - - 146 Change in fair values of derivatives and embedded derivatives - index annuities, net of offsets (52) 6 19 (5) (32) 151 Investment gains (losses), net of offsets 45 45 39 40 169 (4) Integration and restructuring expense (2) (72) (194) (79) (65) (410) (184) Provision for income taxes - non-operating (6) (26) 15 (23) (40) 1
Total Non-operating Items (85) (169) (6) (53) (313) 110 Net income (loss) 101$ 34$ 138$ 225$ 498$ 877$
Cost of Funds ReconciliationTotal operating benefits and expenses (from above) 521$ 519$ 547$ 516$ 2,103$ (127)$ Add:
Insurance Premiums (27) (28) (21) (24) (100) 1,137 Product Charges (53) (58) (60) (60) (231) (80) Other Revenues (6) (6) (6) (2) (20) (9)
Less:Other operating expenses - operating 48 62 59 43 212 160
Total Cost of funds 387$ 365$ 401$ 387$ 1,540$ 761$
Three Months Ended Twelve Months Ended

GAAP Income Statement
17* Certain prior period amounts in the 10‐K financial statements have been reclassified in preparation for SEC readiness. (1) The Athene results for the year ended 2014, include the Aviva USA business acquired in October 2013 for the entire period while the 2013 results include only one quarter of the Aviva USA business and the entire year of Athene Legacy results.
(In millions)
Q1 2014 Q2 2014 Q3 2014 Q4 2014 YTD 2014 (1) YTD 2013 (1)
Revenue:Premiums 27$ 28$ 21$ 24$ 100$ (1,137)$ Product Charges 51 55 57 55 218 72 Net Investment Income 583 574 588 687 2,432 1,557 Investment related gains (losses) 206 517 168 392 1,283 938 OTTI investment losses: OTTI Losses - (4) - (3) (7) (1) OTTI Losses recognized in OCI - - - 1 1 - Net OTTI losses - (4) - (2) (6) (1) Other Revenues 6 6 6 2 20 9 Bargain Purchase Gain (adjustments) - - - - - 146 Revenues related to consolidated variable interest entities:
Net Investment Income 20 23 3 7 53 73 Investment related gains (losses) 7 1 (2) (2) 4 (39)
Total revenues 900 1,200 841 1,163 4,104 1,618
Benefits and Expenses:Interest Sensitive Contract Benefits 395 614 318 535 1,862 1,052 Amortization of DSI 1 (7) 8 2 4 16 Future Policy and Other Policy Benefits 189 201 149 151 690 (961) Amortization of DAC & VOBA 19 7 45 49 120 152 Interest Expense 8 6 6 6 26 10 Dividends to policyholders 12 11 11 10 44 11 Policy and other operating expenses 162 301 179 158 800 431 Operating expenses of consolidated variable interest entities:
Interest Expense 6 4 4 3 17 27 Other operating expenses 1 2 (1) 1 3 4
Total benefits and expenses 793 1,139 719 915 3,566 742
Income for operations before income taxes 107 61 122 248 538 876 Provision for income taxes 6 26 (15) 23 40 (1) Net income (loss) 101 35 137 225 498 877 Less: Net Income attributable to non-controlling interests - 1 (1) - - - Net income (loss) available to Athene common shareholders 101$ 34$ 138$ 225$ 498$ 877$
Three Months Ended Twelve Months Ended
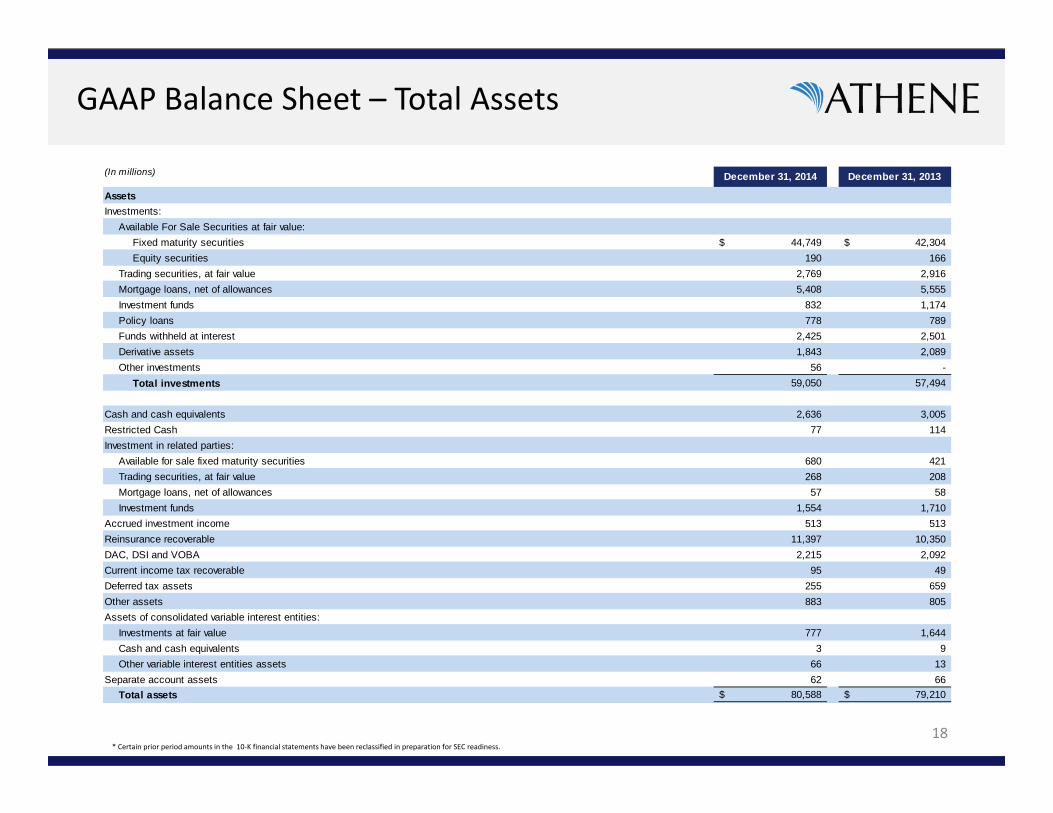
GAAP Balance Sheet – Total Assets
18* Certain prior period amounts in the 10‐K financial statements have been reclassified in preparation for SEC readiness.
(In millions) December 31, 2014 December 31, 2013
AssetsInvestments:
Available For Sale Securities at fair value:Fixed maturity securities 44,749$ 42,304$ Equity securities 190 166
Trading securities, at fair value 2,769 2,916 Mortgage loans, net of allowances 5,408 5,555 Investment funds 832 1,174 Policy loans 778 789 Funds withheld at interest 2,425 2,501 Derivative assets 1,843 2,089 Other investments 56 -
Total investments 59,050 57,494
Cash and cash equivalents 2,636 3,005 Restricted Cash 77 114 Investment in related parties:
Available for sale fixed maturity securities 680 421 Trading securities, at fair value 268 208 Mortgage loans, net of allowances 57 58 Investment funds 1,554 1,710
Accrued investment income 513 513 Reinsurance recoverable 11,397 10,350 DAC, DSI and VOBA 2,215 2,092 Current income tax recoverable 95 49 Deferred tax assets 255 659 Other assets 883 805 Assets of consolidated variable interest entities:
Investments at fair value 777 1,644 Cash and cash equivalents 3 9 Other variable interest entities assets 66 13
Separate account assets 62 66 Total assets 80,588$ 79,210$
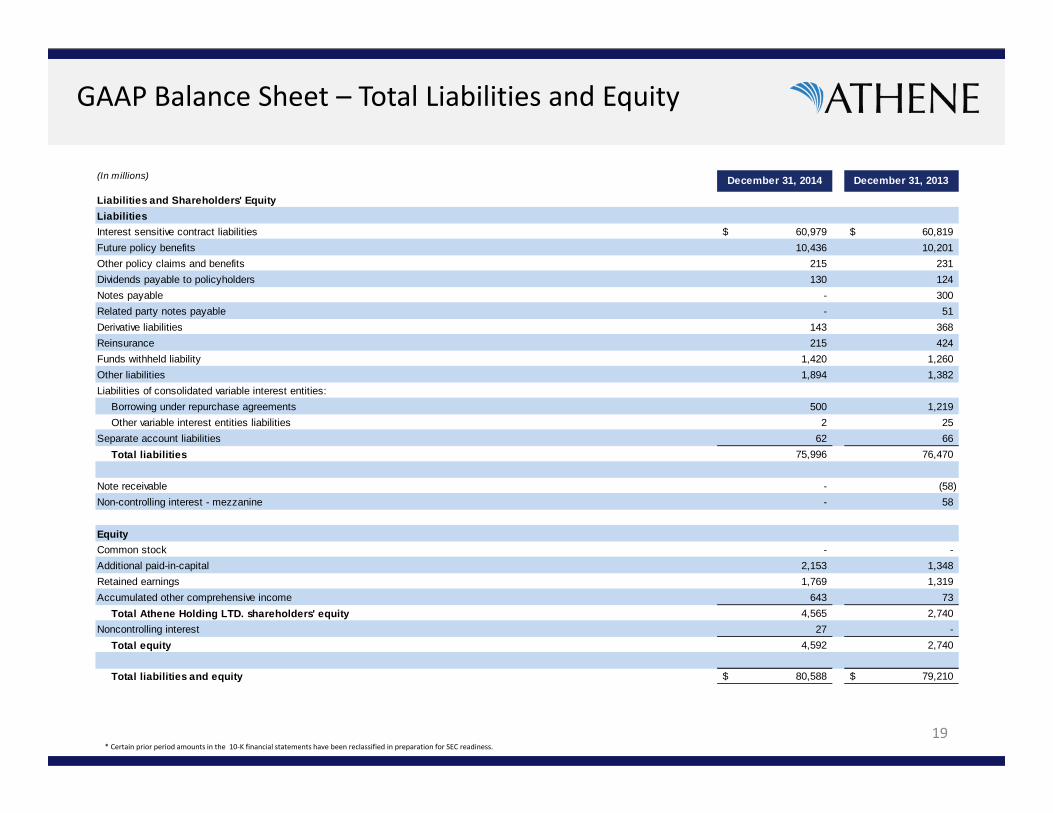
GAAP Balance Sheet – Total Liabilities and Equity
19
(In millions) December 31, 2014 December 31, 2013
Liabilities and Shareholders' EquityLiabilitiesInterest sensitive contract liabilities 60,979$ 60,819$ Future policy benefits 10,436 10,201 Other policy claims and benefits 215 231 Dividends payable to policyholders 130 124 Notes payable - 300 Related party notes payable - 51 Derivative liabilities 143 368 Reinsurance 215 424 Funds withheld liability 1,420 1,260 Other liabilities 1,894 1,382 Liabilities of consolidated variable interest entities:
Borrowing under repurchase agreements 500 1,219 Other variable interest entities liabilities 2 25
Separate account liabilities 62 66 Total liabilities 75,996 76,470
Note receivable - (58) Non-controlling interest - mezzanine - 58
EquityCommon stock - - Additional paid-in-capital 2,153 1,348 Retained earnings 1,769 1,319 Accumulated other comprehensive income 643 73
Total Athene Holding LTD. shareholders' equity 4,565 2,740 Noncontrolling interest 27 -
Total equity 4,592 2,740
Total liabilities and equity 80,588$ 79,210$
* Certain prior period amounts in the 10‐K financial statements have been reclassified in preparation for SEC readiness.
20
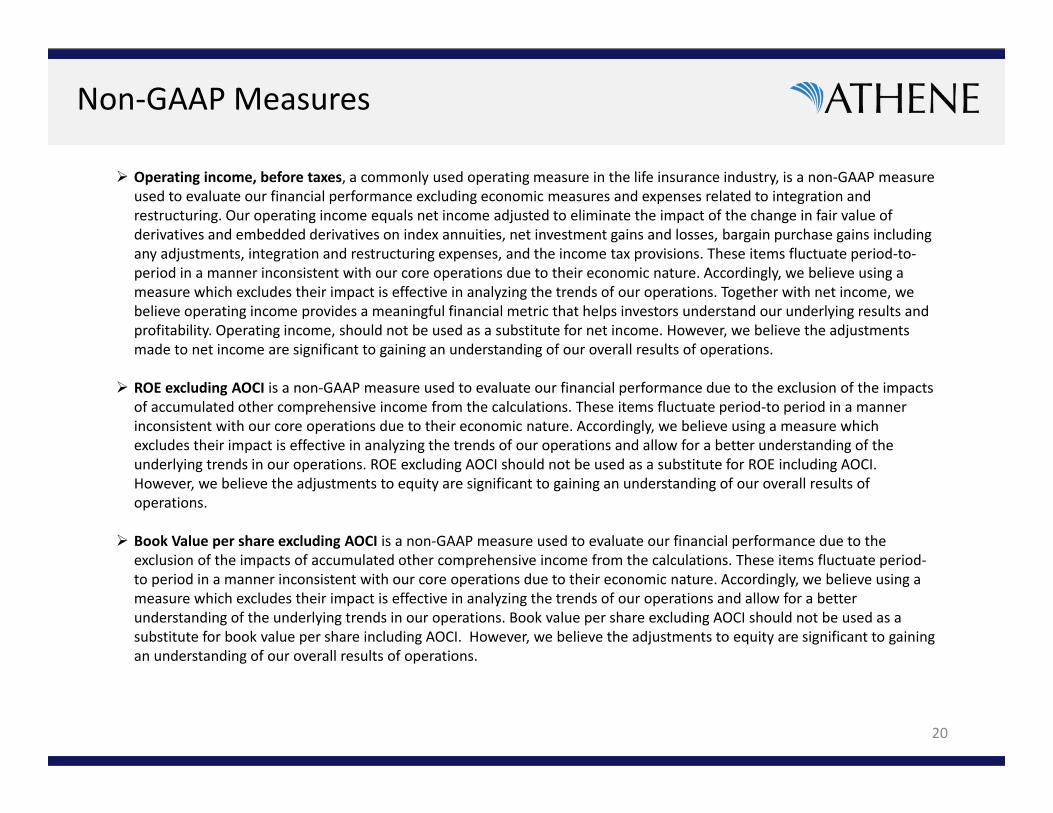
Non‐GAAP Measures
Operating income, before taxes, a commonly used operating measure in the life insurance industry, is a non‐GAAP measure used to evaluate our financial performance excluding economic measures and expenses related to integration and restructuring. Our operating income equals net income adjusted to eliminate the impact of the change in fair value of derivatives and embedded derivatives on index annuities, net investment gains and losses, bargain purchase gains including any adjustments, integration and restructuring expenses, and the income tax provisions. These items fluctuate period‐to‐period in a manner inconsistent with our core operations due to their economic nature. Accordingly, we believe using a measure which excludes their impact is effective in analyzing the trends of our operations. Together with net income, we believe operating income provides a meaningful financial metric that helps investors understand our underlying results and profitability. Operating income, should not be used as a substitute for net income. However, we believe the adjustments made to net income are significant to gaining an understanding of our overall results of operations.
ROE excluding AOCI is a non‐GAAP measure used to evaluate our financial performance due to the exclusion of the impacts of accumulated other comprehensive income from the calculations. These items fluctuate period‐to period in a manner inconsistent with our core operations due to their economic nature. Accordingly, we believe using a measure which excludes their impact is effective in analyzing the trends of our operations and allow for a better understanding of the underlying trends in our operations. ROE excluding AOCI should not be used as a substitute for ROE including AOCI. However, we believe the adjustments to equity are significant to gaining an understanding of our overall results of operations.
Book Value per share excluding AOCI is a non‐GAAP measure used to evaluate our financial performance due to the exclusion of the impacts of accumulated other comprehensive income from the calculations. These items fluctuate period‐to period in a manner inconsistent with our core operations due to their economic nature. Accordingly, we believe using a measure which excludes their impact is effective in analyzing the trends of our operations and allow for a better understanding of the underlying trends in our operations. Book value per share excluding AOCI should not be used as a substitute for book value per share including AOCI. However, we believe the adjustments to equity are significant to gainingan understanding of our overall results of operations.
21
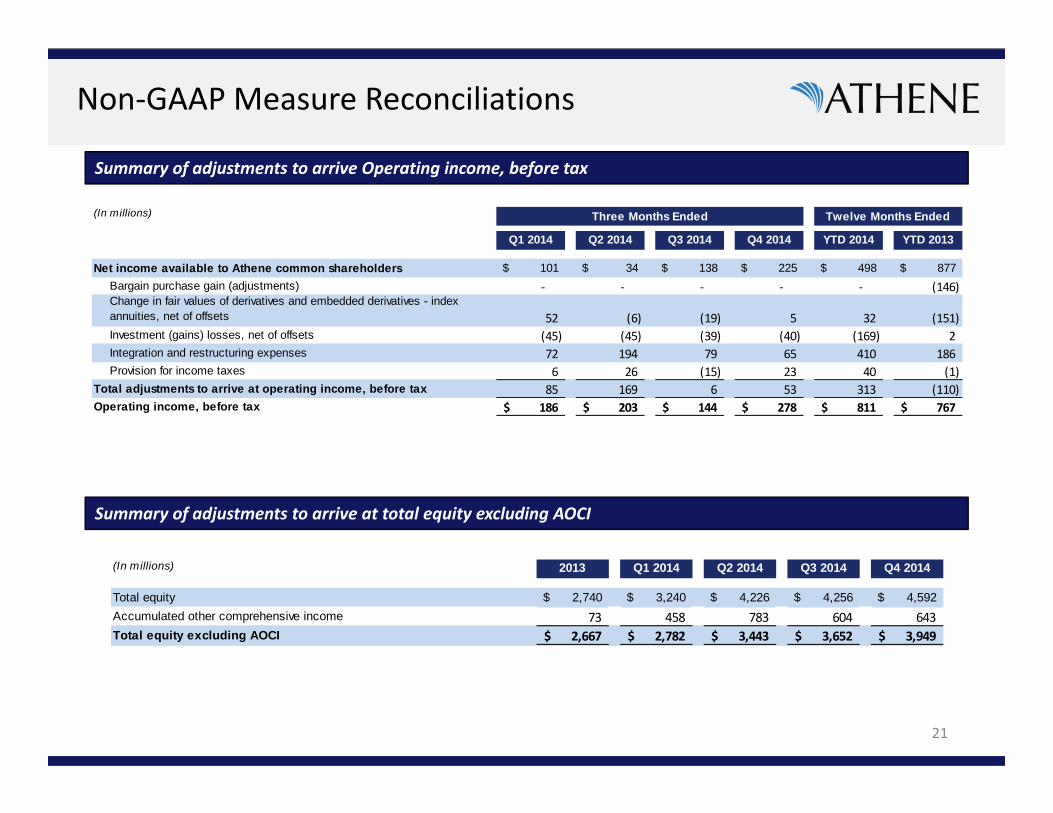
Non‐GAAP Measure Reconciliations
Summary of adjustments to arrive Operating income, before tax
Summary of adjustments to arrive at total equity excluding AOCI
(In millions)
Q1 2014 Q2 2014 Q3 2014 Q4 2014 YTD 2014 YTD 2013
Net income available to Athene common shareholders 101$ 34$ 138$ 225$ 498$ 877$ Bargain purchase gain (adjustments) ‐ ‐ ‐ ‐ ‐ (146) Change in fair values of derivatives and embedded derivatives - index annuities, net of offsets 52 (6) (19) 5 32 (151) Investment (gains) losses, net of offsets (45) (45) (39) (40) (169) 2 Integration and restructuring expenses 72 194 79 65 410 186 Provision for income taxes 6 26 (15) 23 40 (1)
Total adjustments to arrive at operating income, before tax 85 169 6 53 313 (110) Operating income, before tax 186$ 203$ 144$ 278$ 811$ 767$
Three Months Ended Twelve Months Ended
(In millions) 2013 Q1 2014 Q2 2014 Q3 2014 Q4 2014
Total equity 2,740$ 3,240$ 4,226$ 4,256$ 4,592$ Accumulated other comprehensive income 73 458 783 604 643 Total equity excluding AOCI 2,667$ 2,782$ 3,443$ 3,652$ 3,949$
22
Non‐GAAP Measure Reconciliations
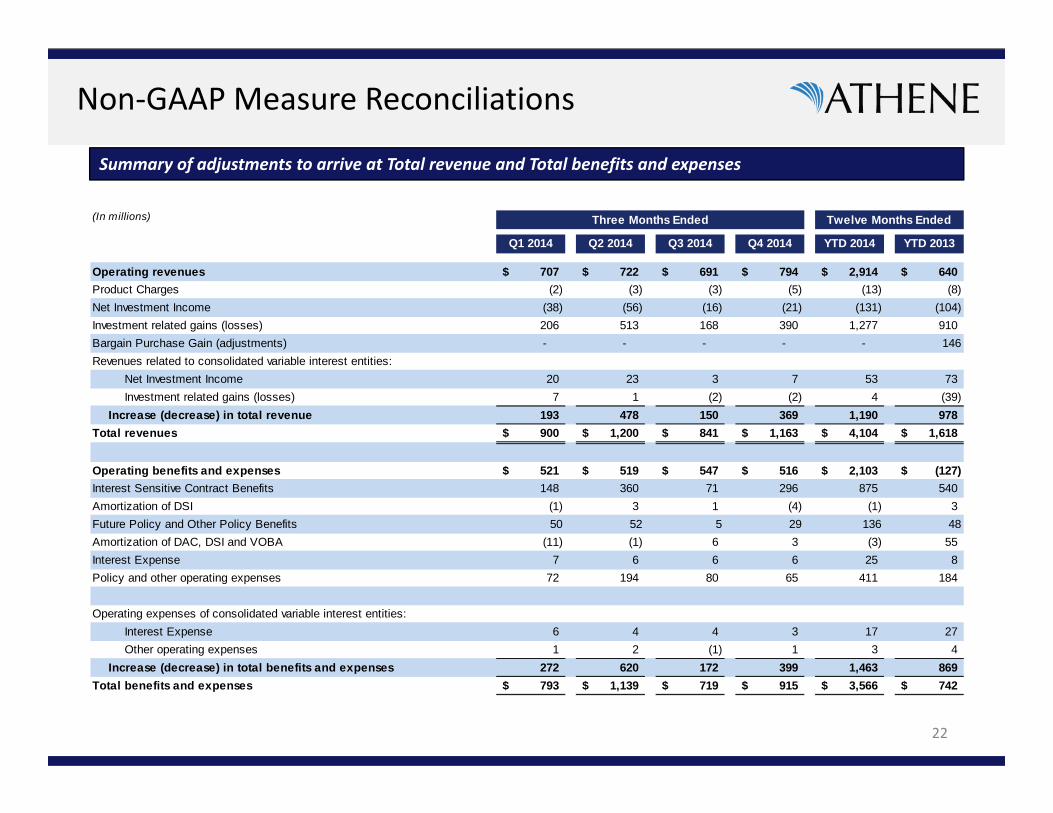
Summary of adjustments to arrive at Total revenue and Total benefits and expenses
(In millions)
Q1 2014 Q2 2014 Q3 2014 Q4 2014 YTD 2014 YTD 2013
Operating revenues 707$ 722$ 691$ 794$ 2,914$ 640$ Product Charges (2) (3) (3) (5) (13) (8) Net Investment Income (38) (56) (16) (21) (131) (104) Investment related gains (losses) 206 513 168 390 1,277 910 Bargain Purchase Gain (adjustments) - - - - - 146Revenues related to consolidated variable interest entities:
Net Investment Income 20 23 3 7 53 73 Investment related gains (losses) 7 1 (2) (2) 4 (39)
Increase (decrease) in total revenue 193 478 150 369 1,190 978 Total revenues 900$ 1,200$ 841$ 1,163$ 4,104$ 1,618$
Operating benefits and expenses 521$ 519$ 547$ 516$ 2,103$ (127)$ Interest Sensitive Contract Benefits 148 360 71 296 875 540 Amortization of DSI (1) 3 1 (4) (1) 3 Future Policy and Other Policy Benefits 50 52 5 29 136 48Amortization of DAC, DSI and VOBA (11) (1) 6 3 (3) 55 Interest Expense 7 6 6 6 25 8 Policy and other operating expenses 72 194 80 65 411 184
Operating expenses of consolidated variable interest entities:Interest Expense 6 4 4 3 17 27 Other operating expenses 1 2 (1) 1 3 4
Increase (decrease) in total benefits and expenses 272 620 172 399 1,463 869 Total benefits and expenses 793$ 1,139$ 719$ 915$ 3,566$ 742$
Three Months Ended Twelve Months Ended

Additional Information
Definitions
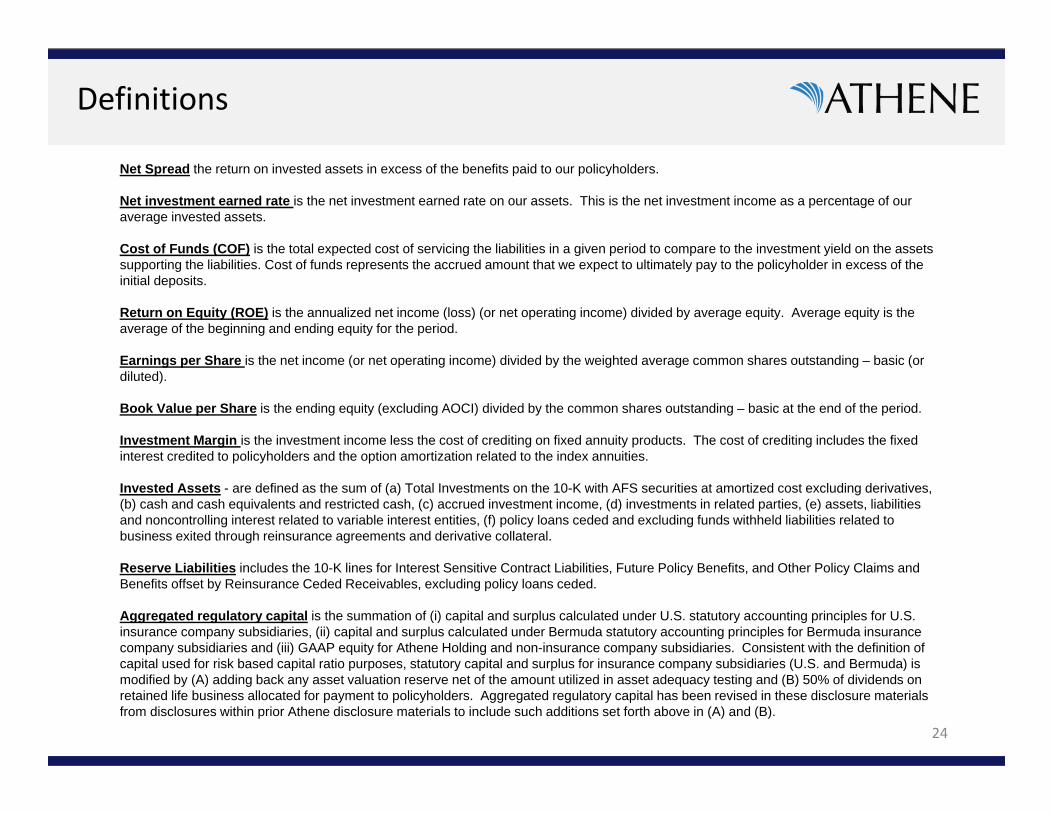
Net Spread the return on invested assets in excess of the benefits paid to our policyholders.
Net investment earned rate is the net investment earned rate on our assets. This is the net investment income as a percentage of our average invested assets.
Cost of Funds (COF) is the total expected cost of servicing the liabilities in a given period to compare to the investment yield on the assets supporting the liabilities. Cost of funds represents the accrued amount that we expect to ultimately pay to the policyholder in excess of the initial deposits.
Return on Equity (ROE) is the annualized net income (loss) (or net operating income) divided by average equity. Average equity is the average of the beginning and ending equity for the period.
Earnings per Share is the net income (or net operating income) divided by the weighted average common shares outstanding – basic (or diluted).
Book Value per Share is the ending equity (excluding AOCI) divided by the common shares outstanding – basic at the end of the period.
Investment Margin is the investment income less the cost of crediting on fixed annuity products. The cost of crediting includes the fixed interest credited to policyholders and the option amortization related to the index annuities.
Invested Assets - are defined as the sum of (a) Total Investments on the 10-K with AFS securities at amortized cost excluding derivatives, (b) cash and cash equivalents and restricted cash, (c) accrued investment income, (d) investments in related parties, (e) assets, liabilities and noncontrolling interest related to variable interest entities, (f) policy loans ceded and excluding funds withheld liabilities related to business exited through reinsurance agreements and derivative collateral.
Reserve Liabilities includes the 10-K lines for Interest Sensitive Contract Liabilities, Future Policy Benefits, and Other Policy Claims and Benefits offset by Reinsurance Ceded Receivables, excluding policy loans ceded.
Aggregated regulatory capital is the summation of (i) capital and surplus calculated under U.S. statutory accounting principles for U.S. insurance company subsidiaries, (ii) capital and surplus calculated under Bermuda statutory accounting principles for Bermuda insurance company subsidiaries and (iii) GAAP equity for Athene Holding and non-insurance company subsidiaries. Consistent with the definition of capital used for risk based capital ratio purposes, statutory capital and surplus for insurance company subsidiaries (U.S. and Bermuda) is modified by (A) adding back any asset valuation reserve net of the amount utilized in asset adequacy testing and (B) 50% of dividends on retained life business allocated for payment to policyholders. Aggregated regulatory capital has been revised in these disclosure materials from disclosures within prior Athene disclosure materials to include such additions set forth above in (A) and (B).
24
25
Disclaimer
This presentation does not constitute an offer to sell, or the solicitation of an offer to buy, any security of Athene Holding Ltd. (“Athene”).
Certain information contained herein maybe “forward – looking” in nature. These statements include, but are not limited to, discussions related to Athene’s expectations regarding the performance of its business, its liquidity and capital resources and the other non‐historical statements. These forward‐looking statements are based on management’s beliefs, as well as assumptions made by, and information currently available to, management. When used in this presentation, the words “believe,” “anticipate,” “estimate,” “expect,” “intend” and similar expressions are intended to identify forward‐looking statements. Although management believes that the expectations reflected in these forward‐looking statements are reasonable, it can give no assurance that these expectations will prove to have been correct. These statements are subject to certain risks, uncertainties and assumptions. Due to these various risks, uncertainties and assumptions, actual events or results or the actual performance of Athene may differ materially from those reflected or contemplated in such forward‐looking statements. We undertake no obligation to publicly update or review any forward‐looking statements, whether as a result of new information, future developments or otherwise.
Information contained herein may include information respecting prior performance of Athene. Information respecting prior performance, while a useful tool, is not necessarily indicative of actual results to be achieved in the future, which is dependent upon many factors, many of which are beyond the control of Athene. The information contained herein is not a guarantee of future performance by Athene, and actual outcomes and results may differ materially from any historic, pro forma or projected financial results indicated herein. Certain of the financial information contained herein is unaudited or based on the application of non‐GAAP financial measures. These non‐GAAP financial measures should be considered in addition to and not as a substitute for, or superior to, financial measures presented in accordance with GAAP. Furthermore, certain financial information is based on estimates of management. These estimates, which are based on the reasonable expectations of management, are subject to change and there can be no assurance that they will prove to be correct. The information contained herein does not purport to be all‐inclusive or contain all information that an evaluator may require in order to properly evaluate the business, prospects or value of Athene. AAA or Athene does not have any obligation to update this presentation and the information may change at any time without notice.
Certain of the information used in preparing this presentation was obtained from third parties or public sources. No representation or warranty, express or implied, is made or given by or on behalf of Athene or any other person as to the accuracy, completeness or fairness of such information, and no responsibility or liability is accepted for any such information.
This document is not intended to be, nor should it be construed or used as, financial, legal, tax, insurance or investment advice. There can be no assurance that Athene will achieve its objectives. Past performance is not indicative of future success.
All information is as of the dates indicated herein.