Embed Size (px)
Citation preview
1
Atomic Structural Evolution during the Reduction of α-Fe2O3 Nanowires
Wenhui Zhu1, Jonathan Winterstein
2, Itai Maimon
3, Qiyue Yin
1, Lu Yuan
1, Aleksey N. Kolmogorov
3,
Renu Sharma2*
, Guangwen Zhou1*
1 Department of Mechanical Engineering & Materials Science and Engineering Program, State University
of New York, Binghamton, NY 13902, USA
2 Center for Nanoscale Science and Technology, National Institute of Standards and Technology,
Gaithersburg, MD 20899, USA
3 Department of Physics, State University of New York, Binghamton, NY 13902, USA
Abstract
The atomic-scale reduction mechanism of α-Fe2O3 nanowires by H2 was followed using transmission
electron microscopy to reveal the evolution of atomic structures and the associated transformation
pathways for different iron oxides. The reduction commences with the generation of oxygen vacancies
that order onto every 10th )0330( plane. This vacancy ordering is followed by an allotropic transformation
of α-Fe2O3 γ-Fe2O3 along with the formation of Fe3O4 nanoparticles on the surface of the γ-Fe2O3
nanowire by a topotactic transformation process, which shows 3D correspondence between the structures
of the product and its host. These observations demonstrate that the partial reduction of α-Fe2O3
nanowires results in the formation of a unique hierarchical structure of hybrid oxides consisting of the
parent oxide phase, γ-Fe2O3, as the one-dimensional wire and the Fe3O4 in the form of nanoparticles
decorated on the parent oxide skeleton. We show that the proposed mechanism is consistent with
previously published and our density functional theory results on the thermodynamics of surface
termination and oxygen vacancy formation in -Fe2O3. Compared to previous reports of α-Fe2O3 directly
transformed to Fe3O4, our work provides a more in-depth understanding with substeps of reduction, i.e.,
the whole reduction process follows: α-Fe2O3 α-Fe2O3 superlattice γ-Fe2O3 + Fe3O4 Fe3O4.
* To whom correspondence should be addressed:
R. Sharma: email: [email protected]; phone: 301-975-2418
G. Zhou: email: [email protected]; phone: 607-777-5084
2
1. Introduction
Reduction treatment of metal oxides has been widely used to yield active materials for a large
variety of applications ranging from catalysis to electronic devices.1-5
For instance, metal oxides are used
in heterogeneous catalysis as active catalysts, catalyst supports, and promoters. Reduced oxides are also
used in electronic devices, magnetic memory, and as active / passive solar energy conversion materials.6-8
The chemical and physical properties of metal oxides are crucially affected by their stoichiometry, phase,
microstructure, atomic termination, and defects, all of which can be modified by a choice of reduction
treatment. A fundamental understanding of the microscopic mechanism of the reduction of metal oxides
is indispensable for obtaining controllable functionalities of the oxide.
Iron oxide, in particular, has many different phases, with Fe in variable oxidation states,
depending upon the reduction process. The iron oxides include hematite (-Fe2O3), magnetite (Fe3O4),
and wustite (FeO). Fe2O3 exhibits various polymorphs including α-Fe2O3 (rhombohedral), -Fe2O3 (cubic),
-Fe2O3 (cubic), and -Fe2O3 (orthorhombic), among which α-Fe2O3 is the most thermodynamically stable
phase (Fig. 1(a)). Both γ-Fe2O3 (space group: P4132, a = b = c = 0.8347 nm) and Fe3O4 (space group:
Fd-3m, a = b = c = 0.8394 nm) share the cubic structure with close-packed oxygen atoms along the <111>
direction but vary in the oxidation state for Fe (Fig. 1(b, c)).9-10
Magnetite contains both Fe2+
and Fe3+
ions
in the crystal lattice and is sometimes formulated as FeO·Fe2O3. In the crystal structure of Fe3O4, half of
the Fe3+
ions are located in the tetrahedral interstitial sites, and the other half of the Fe3+
ions and all the
Fe2+
ions occupy the octahedral sites (Fig. 1(c)).11
In γ-Fe2O3, due to the absence of Fe2+
, some of the Fe
positions are left unoccupied as random vacancies (Fig. 1(b)). FeO adopts the cubic, rock-salt structure,
where Fe2+
ions are octahedrally coordinated by O2-
ions (Fig. 1(d)). The applications for iron oxides
intimately depend on their ability to redox (reduction and oxidation) cycle between the +2 and +3
oxidation states. However, the variable oxidation states of iron lead to a fairly complicated phase diagram
of iron oxides with several easily interchangeable phases. Understanding the process of Fe2O3 reduction
has therefore been a longstanding challenge.
3
The reduction mechanism of iron oxides by hydrogen has been studied by macroscopically
averaging approaches such as temperature-programmed reduction (TPR)12
and X-ray diffraction.13
Based
on the TPR studies, two mechanisms have been proposed: a three-step mechanism, Fe2O3 → Fe3O4 →
FeO → Fe; and a two-step mechanism, Fe2O3 → Fe3O4 → Fe. While the reduction of a metal oxide
usually commences via the nucleation and growth of a lower oxide as lattice oxygen escapes the parent
phase, the microscopic process leading to the onset of the oxide reduction and the associated atomic
structure evolution cannot be addressed using ensemble-averaging macroscopic approaches. Therefore the
aforementioned reduction pathways of Fe2O3 do not describe any polymorphic transition which might
occur. In addition, the materials undergo crystallographic structural transformations and a full description
of the process requires both the chemical composition and crystallographic information. Moreover, there
is a lack of direct observation and careful study of the kinetic pathways of the oxide reduction at the
atomic scale.
Nanostructured iron oxides, such as nanoparticles, nanowires, nanoblades, and nanorods, have
drawn extensive research focus due to their great potential for broad applications, ranging from catalysis
to drug delivery.14-15
Previous reports about the reduction mechanism have primarily relied on
observations of bulk materials. At the nanoscale, due to the size effect, different reduction behavior
compared with the bulk might be anticipated. The nanowire is thus an ideal candidate, comprising a
highly orientated skeleton, for studying how oxide reduction-induced phase transformations take place in
one-dimensional systems.
Herein, we report the reaction pathway of H2 induced reduction of α-Fe2O3 nanowires, using
transmission electron microscopy (TEM) to reveal the atomic structure evolution in the oxide. We choose
α-Fe2O3 because it has the most stable phase with highest oxidation state of Fe and can be employed as a
model system to study the reaction pathway of oxide reduction. We identify the atomic process leading to
crystal structure changes as the oxide is reduced from a higher oxidation state into lower ones.
Particularly, we use α-Fe2O3 nanowires because the one-dimensional morphology is a highly anisotropic
4
structure, making it simple to understand how reduction-induced physical transformations take place. We
find the proposed mechanism to be consistent with previously published and our density functional theory
(DFT) results on the thermodynamics of surface termination and oxygen vacancy formation in -Fe2O3.
2. Experimental and Computational
The -Fe2O3 samples used for the reduction experiments were prepared using the thermal
oxidation of polycrystalline Fe foils (99.99 % purity). The high-purity Fe foils are first thoroughly rinsed
in deionized water followed by ultrasonication in acetone for 5 min. The cleaned iron foils are then placed
on a substrate heater in a vacuum chamber and the sample temperature is monitored by a K-type
thermocouple in contact with the substrate heater. The chamber is pumped to vacuum (≈ 3×10⁻⁴
Pa) and
then filled with oxygen gas at a pressure of ≈ 270 Pa (99.999 % purity). The chamber is then sealed and
the Fe sample is heated to the desired temperature (600 ℃) at ≈ 20 ℃ min-1
in oxygen for 60 min. This
yields well-aligned, crystalline -Fe2O3 nanowires perpendicular to the Fe substrate.16-19
After the
oxidation, the oxygen is pumped out and the chamber is evacuated to ≈ 3×10⁻⁴
Pa again. Subsequently,
pure hydrogen gas (99.999 % purity) at a pressure of ≈ 270 Pa is admitted to the vacuum chamber.
Meanwhile the temperature is reduced to 500 ℃. After a reduction of 60 min at 500 ℃ in H2, the Fe
sample is cooled down in the same hydrogen atmosphere to room temperature at a rate of ≈ 10 ℃ min-1
.
The morphologies of the -Fe2O3 nanowires both before and after the H2 reduction are examined
using a field-emission scanning electron microscope (FEG-SEM). The atomic structures of the reduced
nanowires are further analyzed using TEM operated at 200 kV. Electron energy-loss spectra (EELS),
obtained with a monochromated electron source in the scanning transmission electron microscope
(STEM), collected from reduced -Fe2O3 nanowires were compared with those collected from four
standard iron oxide samples (α-Fe2O3, γ-Fe2O3, Fe3O4 and FeO) under identical instrumental conditions,
to measure the oxidation state of Fe at different reduction stages.
5
DFT calculations were performed with VASP 20-21
using the projector-augmented wave method 22
and the gradient-corrected Perdew, Burke and Ernzerhof (PBE) 23
exchange-correlation functional. Strong
correlation effects were treated within the DFT+U approach 23-24
with a U = 4 eV value found to be
suitable for Fe2O3 in previous studies.25-26
For direct comparison, we adopted the default settings from the
work by Souvi et al 26
for the energy cutoff (600 eV), k-point meshes (7×7×3 in bulk and 7×7×1 in slab
structures), and the size of the slab cell (a 3-nm c-axis). Atomic forces in local conjugate-gradient
optimizations were reduced below 0.3 eV / nm, while the lattice constants were kept fixed at the
experimental values of a = 0.5035 nm (for bulk and slab structures) and c = 1.3747 nm (for bulk). We
have reproduced and used the most stable antiferromagnetic arrangement on Fe3+
ions in bulk and slab
calculations. Standard molecular dynamics (MD) runs were performed for slabs with 1 fs steps, a 400 eV
energy cutoff, and a 5×5×1 k-mesh.
3. Results and Discussion
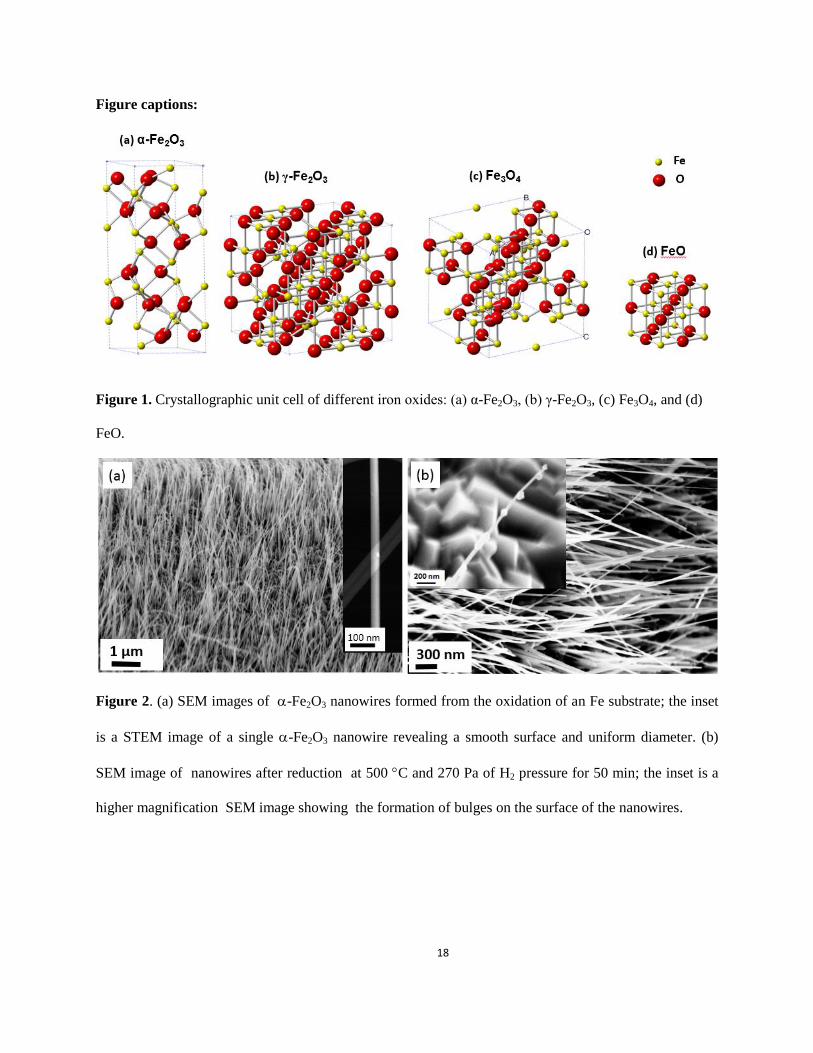
Fig. 2 shows the morphologies of α-Fe2O3 nanowires before and after the reduction. Fig. 2(a) is a
representative FEG-SEM image of the α-Fe2O3 nanowires as-prepared by the oxidation of a Fe foil. The
densely distributed α-Fe2O3 nanowires are approximately perpendicular to the iron substrate and have
lengths up to 5 µm with a relatively uniform diameter of about 50 nm. The inset in Fig. 2(a) is a STEM
image of a single α-Fe2O3 nanowire, showing that the nanowires have smooth surfaces. Although there is
no significant change in the density and length of the nanowires after exposure to H2 at 500 ℃ for 60 min,
some nanowires developed a saw-tooth surface morphology after the reduction reaction (Fig. 2(b)). As
revealed by the higher magnification FEG-SEM image (inset in Fig. 2(b)), the surface of these saw-
toothed nanowires is decorated with nanoparticles that are apparently formed during the H2 reduction
process. It should be also noted that a large fraction of the nanowires (≈ 60 %, based on SEM image
analysis of the reduced nanowires) still retain a smooth surface morphology, i.e., without the formation of
nanoparticles on the parent nanowires. Among these nanowires with smooth surface morphology, some of
them are still unreduced α-Fe2O3, indicating that the reduction is not uniform. This may relate to the
6
stochastic population of defects in some nanowires, making them more reactive and easier to reduce
compared with those without or with less defects.
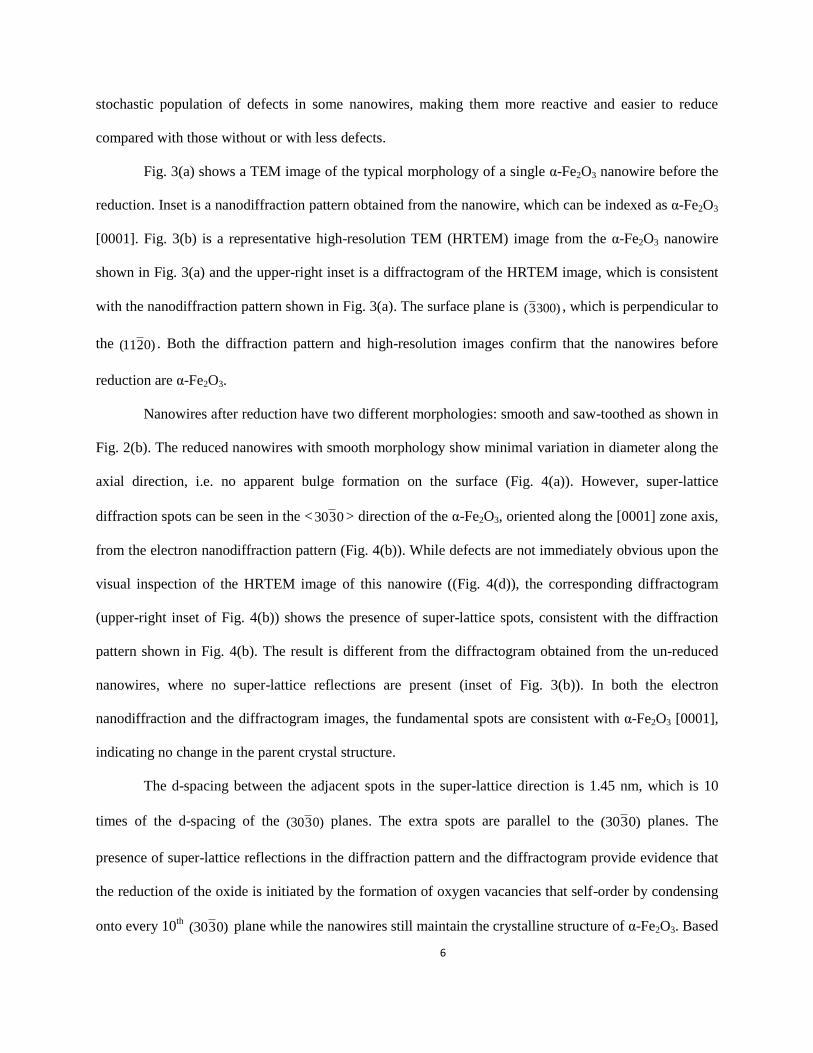
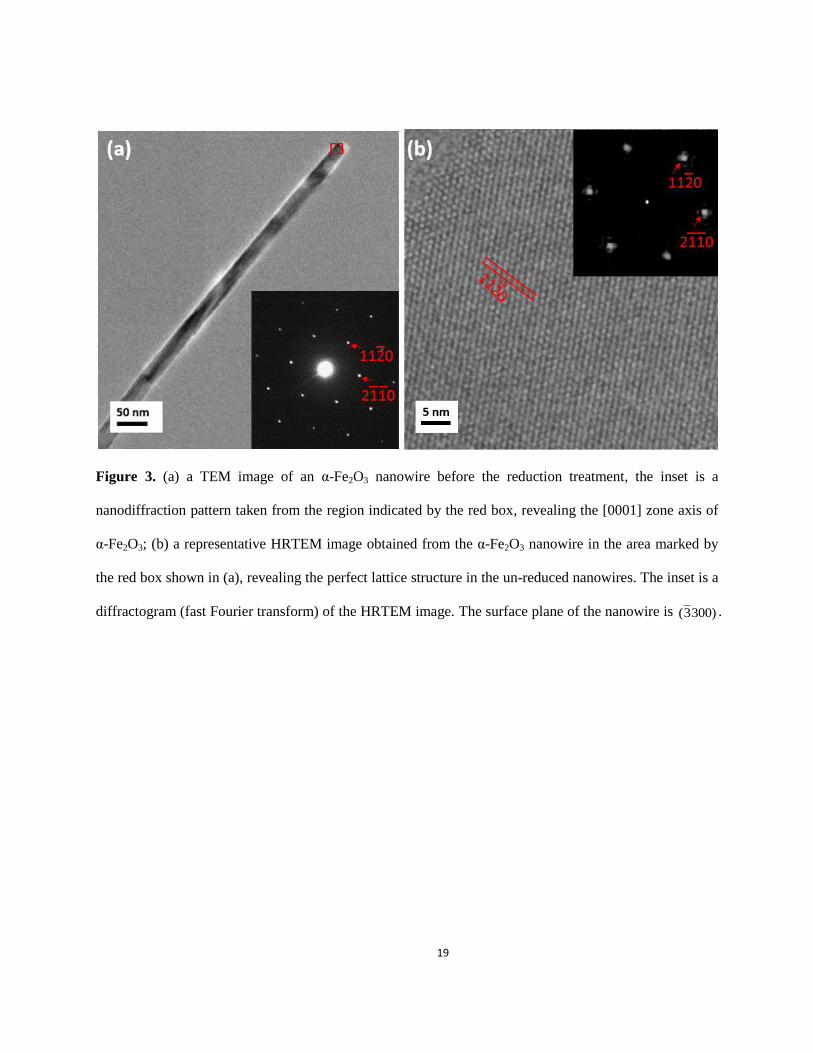
Fig. 3(a) shows a TEM image of the typical morphology of a single α-Fe2O3 nanowire before the
reduction. Inset is a nanodiffraction pattern obtained from the nanowire, which can be indexed as α-Fe2O3
[0001]. Fig. 3(b) is a representative high-resolution TEM (HRTEM) image from the α-Fe2O3 nanowire
shown in Fig. 3(a) and the upper-right inset is a diffractogram of the HRTEM image, which is consistent
with the nanodiffraction pattern shown in Fig. 3(a). The surface plane is )3003( , which is perpendicular to
the )0211( . Both the diffraction pattern and high-resolution images confirm that the nanowires before
reduction are α-Fe2O3.
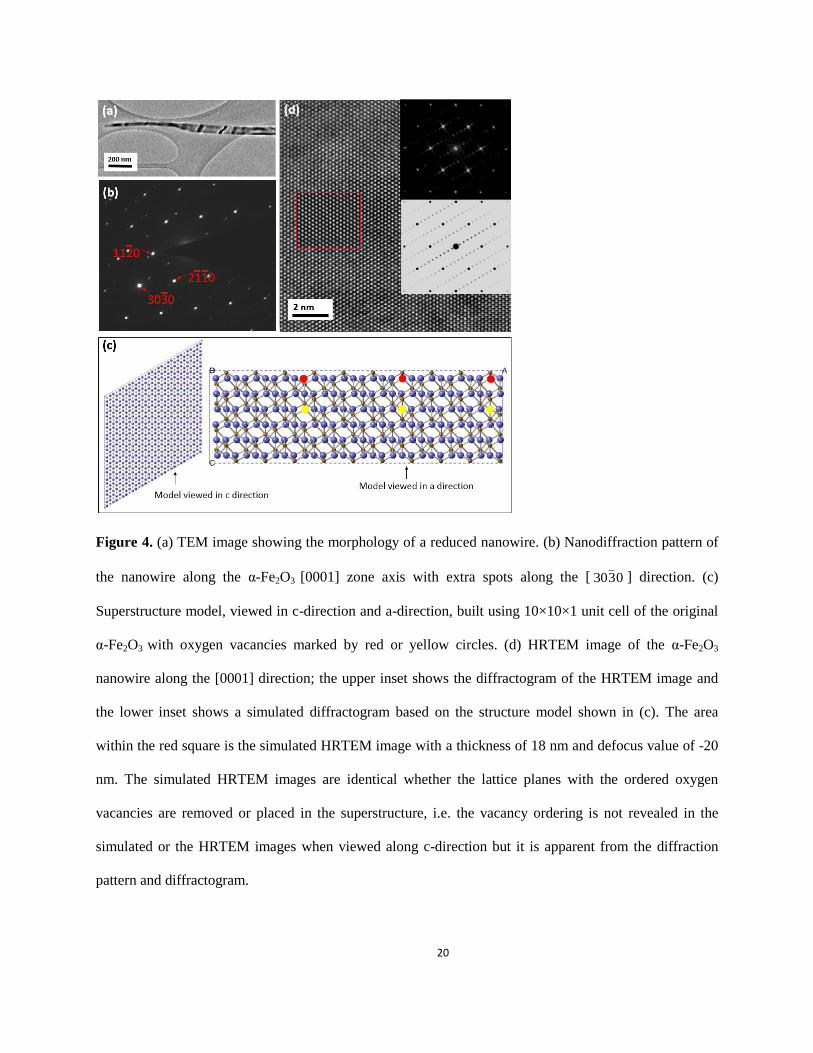
Nanowires after reduction have two different morphologies: smooth and saw-toothed as shown in
Fig. 2(b). The reduced nanowires with smooth morphology show minimal variation in diameter along the
axial direction, i.e. no apparent bulge formation on the surface (Fig. 4(a)). However, super-lattice
diffraction spots can be seen in the < 0330 > direction of the α-Fe2O3, oriented along the [0001] zone axis,
from the electron nanodiffraction pattern (Fig. 4(b)). While defects are not immediately obvious upon the
visual inspection of the HRTEM image of this nanowire ((Fig. 4(d)), the corresponding diffractogram
(upper-right inset of Fig. 4(b)) shows the presence of super-lattice spots, consistent with the diffraction
pattern shown in Fig. 4(b). The result is different from the diffractogram obtained from the un-reduced
nanowires, where no super-lattice reflections are present (inset of Fig. 3(b)). In both the electron
nanodiffraction and the diffractogram images, the fundamental spots are consistent with α-Fe2O3 [0001],
indicating no change in the parent crystal structure.
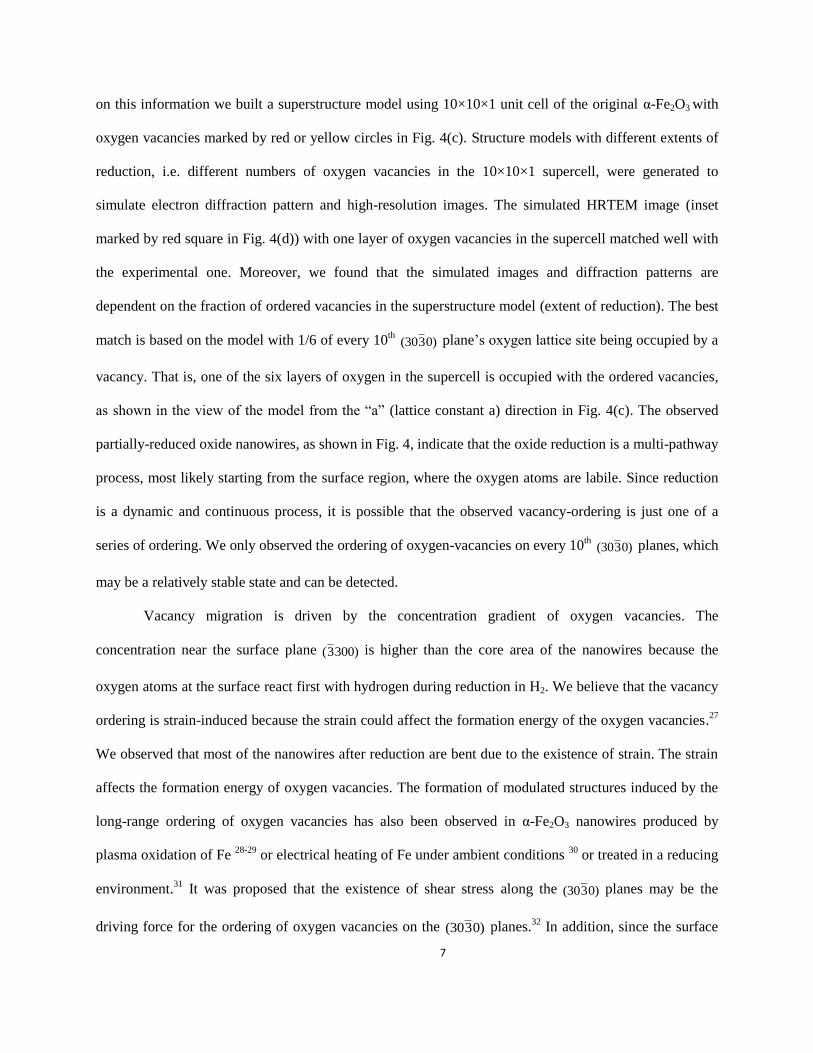
The d-spacing between the adjacent spots in the super-lattice direction is 1.45 nm, which is 10
times of the d-spacing of the )0330( planes. The extra spots are parallel to the )0330( planes. The
presence of super-lattice reflections in the diffraction pattern and the diffractogram provide evidence that
the reduction of the oxide is initiated by the formation of oxygen vacancies that self-order by condensing
onto every 10th )0330( plane while the nanowires still maintain the crystalline structure of α-Fe2O3. Based
7
on this information we built a superstructure model using 10×10×1 unit cell of the original α-Fe2O3 with
oxygen vacancies marked by red or yellow circles in Fig. 4(c). Structure models with different extents of
reduction, i.e. different numbers of oxygen vacancies in the 10×10×1 supercell, were generated to
simulate electron diffraction pattern and high-resolution images. The simulated HRTEM image (inset
marked by red square in Fig. 4(d)) with one layer of oxygen vacancies in the supercell matched well with
the experimental one. Moreover, we found that the simulated images and diffraction patterns are
dependent on the fraction of ordered vacancies in the superstructure model (extent of reduction). The best
match is based on the model with 1/6 of every 10th )0330( plane’s oxygen lattice site being occupied by a
vacancy. That is, one of the six layers of oxygen in the supercell is occupied with the ordered vacancies,
as shown in the view of the model from the “a” (lattice constant a) direction in Fig. 4(c). The observed
partially-reduced oxide nanowires, as shown in Fig. 4, indicate that the oxide reduction is a multi-pathway
process, most likely starting from the surface region, where the oxygen atoms are labile. Since reduction
is a dynamic and continuous process, it is possible that the observed vacancy-ordering is just one of a
series of ordering. We only observed the ordering of oxygen-vacancies on every 10th )0330( planes, which
may be a relatively stable state and can be detected.
Vacancy migration is driven by the concentration gradient of oxygen vacancies. The
concentration near the surface plane )3003( is higher than the core area of the nanowires because the
oxygen atoms at the surface react first with hydrogen during reduction in H2. We believe that the vacancy
ordering is strain-induced because the strain could affect the formation energy of the oxygen vacancies.27
We observed that most of the nanowires after reduction are bent due to the existence of strain. The strain
affects the formation energy of oxygen vacancies. The formation of modulated structures induced by the
long-range ordering of oxygen vacancies has also been observed in α-Fe2O3 nanowires produced by
plasma oxidation of Fe 28-29
or electrical heating of Fe under ambient conditions 30
or treated in a reducing
environment.31
It was proposed that the existence of shear stress along the )0330( planes may be the
driving force for the ordering of oxygen vacancies on the )0330( planes.32
In addition, since the surface
8
plane is )3003( , which is equivalent to )0330( . They are in accordance because the vacancies initiated on
)3003( . As shown later, the superlattice structure induced by the long-range ordering of oxygen vacancies
in the α-Fe2O3 nanowires is a metastable phase, which will be further reduced as the H2 reduction
continues.
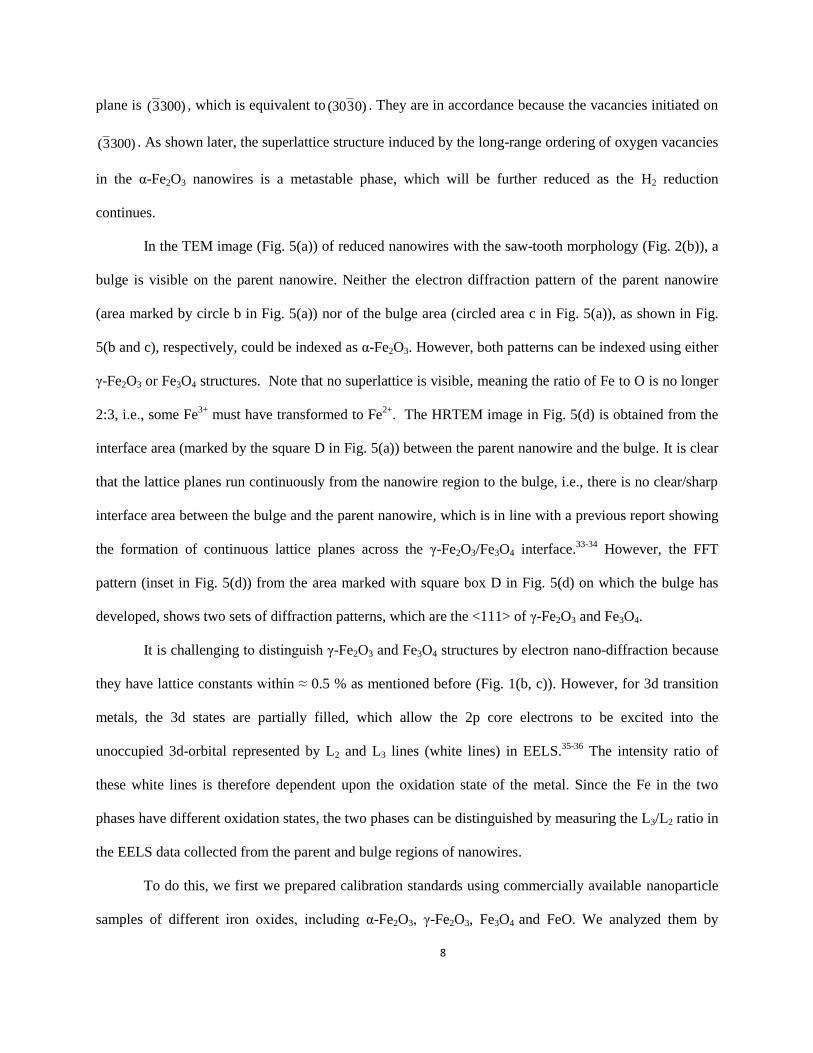
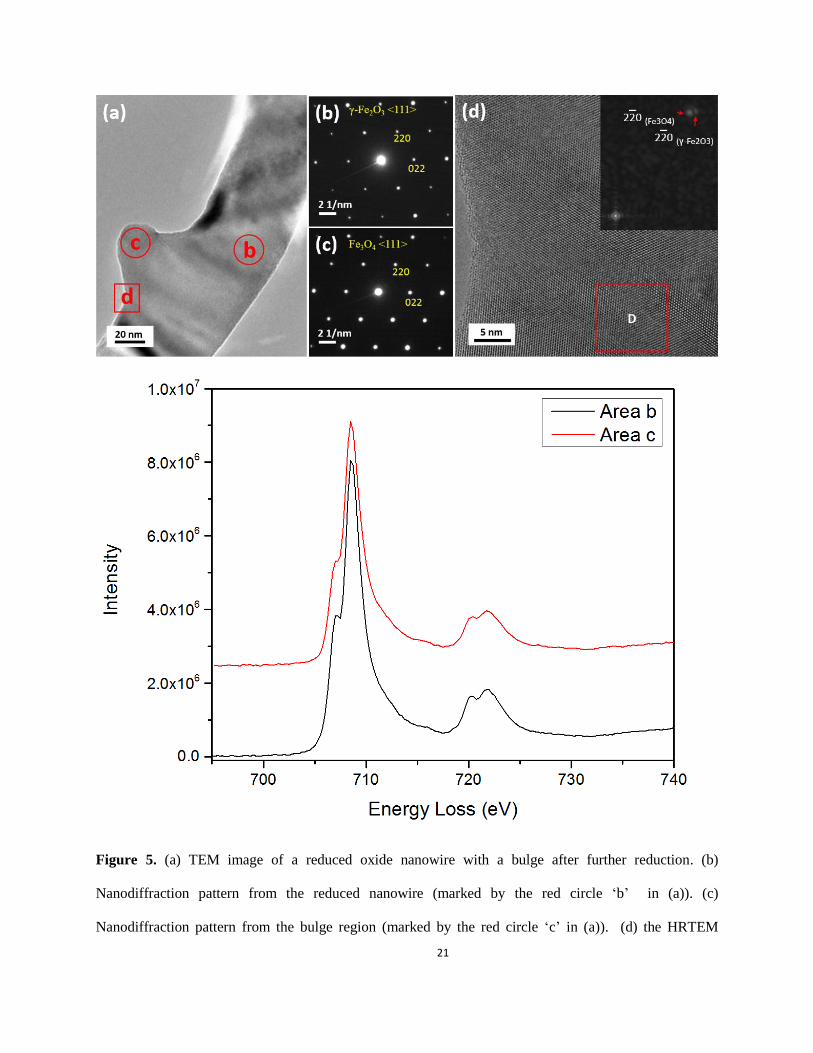
In the TEM image (Fig. 5(a)) of reduced nanowires with the saw-tooth morphology (Fig. 2(b)), a
bulge is visible on the parent nanowire. Neither the electron diffraction pattern of the parent nanowire
(area marked by circle b in Fig. 5(a)) nor of the bulge area (circled area c in Fig. 5(a)), as shown in Fig.
5(b and c), respectively, could be indexed as α-Fe2O3. However, both patterns can be indexed using either
γ-Fe2O3 or Fe3O4 structures. Note that no superlattice is visible, meaning the ratio of Fe to O is no longer
2:3, i.e., some Fe3+
must have transformed to Fe2+
. The HRTEM image in Fig. 5(d) is obtained from the
interface area (marked by the square D in Fig. 5(a)) between the parent nanowire and the bulge. It is clear
that the lattice planes run continuously from the nanowire region to the bulge, i.e., there is no clear/sharp
interface area between the bulge and the parent nanowire, which is in line with a previous report showing
the formation of continuous lattice planes across the γ-Fe2O3/Fe3O4 interface.33-34
However, the FFT
pattern (inset in Fig. 5(d)) from the area marked with square box D in Fig. 5(d) on which the bulge has
developed, shows two sets of diffraction patterns, which are the <111> of γ-Fe2O3 and Fe3O4.
It is challenging to distinguish γ-Fe2O3 and Fe3O4 structures by electron nano-diffraction because
they have lattice constants within ≈ 0.5 % as mentioned before (Fig. 1(b, c)). However, for 3d transition
metals, the 3d states are partially filled, which allow the 2p core electrons to be excited into the
unoccupied 3d-orbital represented by L2 and L3 lines (white lines) in EELS.35-36
The intensity ratio of
these white lines is therefore dependent upon the oxidation state of the metal. Since the Fe in the two
phases have different oxidation states, the two phases can be distinguished by measuring the L3/L2 ratio in
the EELS data collected from the parent and bulge regions of nanowires.
To do this, we first we prepared calibration standards using commercially available nanoparticle
samples of different iron oxides, including α-Fe2O3, γ-Fe2O3, Fe3O4 and FeO. We analyzed them by
9
STEM-EELS under the same conditions to compare the L3/L2 ratio. EELS spectra (Fig. 5(e)) were
acquired under identical conditions from the parent nanowire (marked with b in Fig. 5(a)) and the bulge
area (marked with c in Fig. 5(a)). All the spectra were background-subtracted using power-law curve
fitting, and were deconvoluted to minimize the size or thickness effects.37-38
The L3/L2 ratios were
calculated by using two arctangent functions to remove the post-edge backgrounds and to produce the
isolated Fe L3 and L2 edges 39
: the results are listed in Table 1. The uncertainty is given by the standard
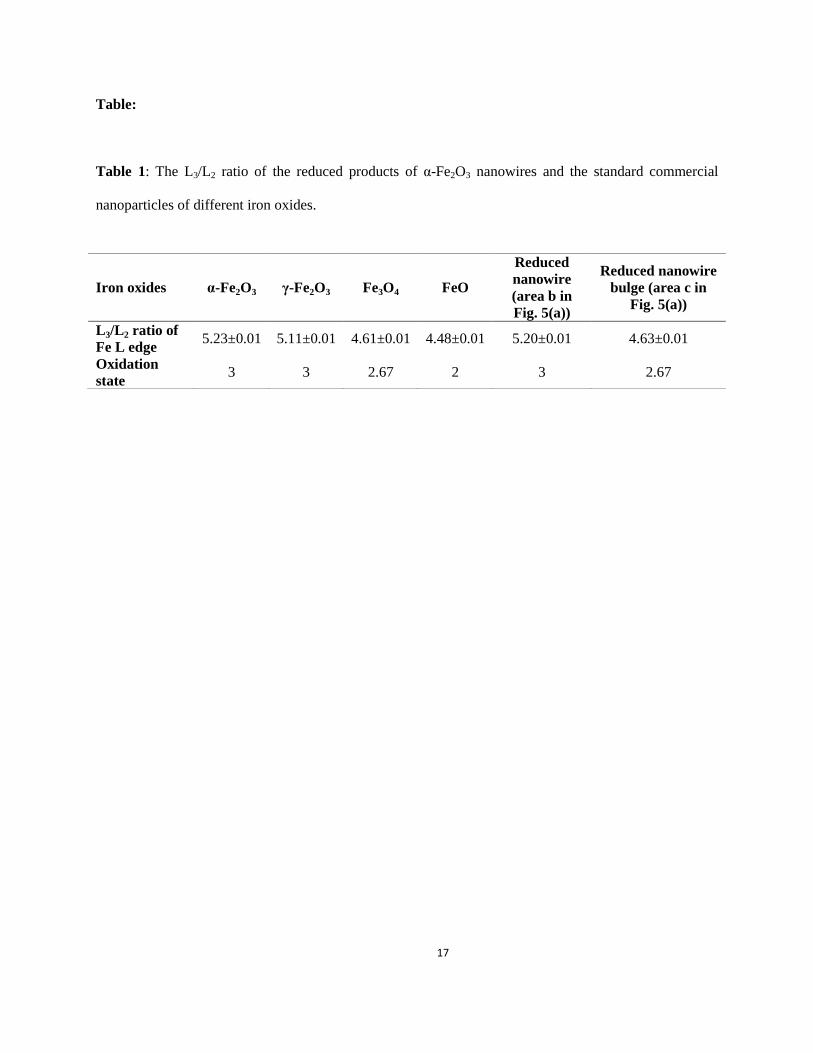
deviation of multiple measurements. By comparing with the L3/L2 ratios of the standard samples of the
iron oxides, we find that the values for the L3/L2 ratios from the reduced parent nanowire and the bulged
region are close to those for Fe2O3 and Fe3O4, respectively.33
Therefore we conclude that the phase in Fig.
5(b) is γ-Fe2O3 <111> and in Fig. 5(c) is Fe3O4 <111>. Both γ-Fe2O3 and Fe3O4 are thermodynamically
metastable phases. The occurrence of γ-Fe2O3 as a transition phase to Fe3O4 is in accordance with kinetic
considerations, i.e. the lower kinetic barrier for the transformation from α-Fe2O3 to γ-Fe2O3 than from α-
Fe2O3 to Fe3O4 allows this phase transition to take place. This has also been observed during the oxidation
of Fe particles.40-41
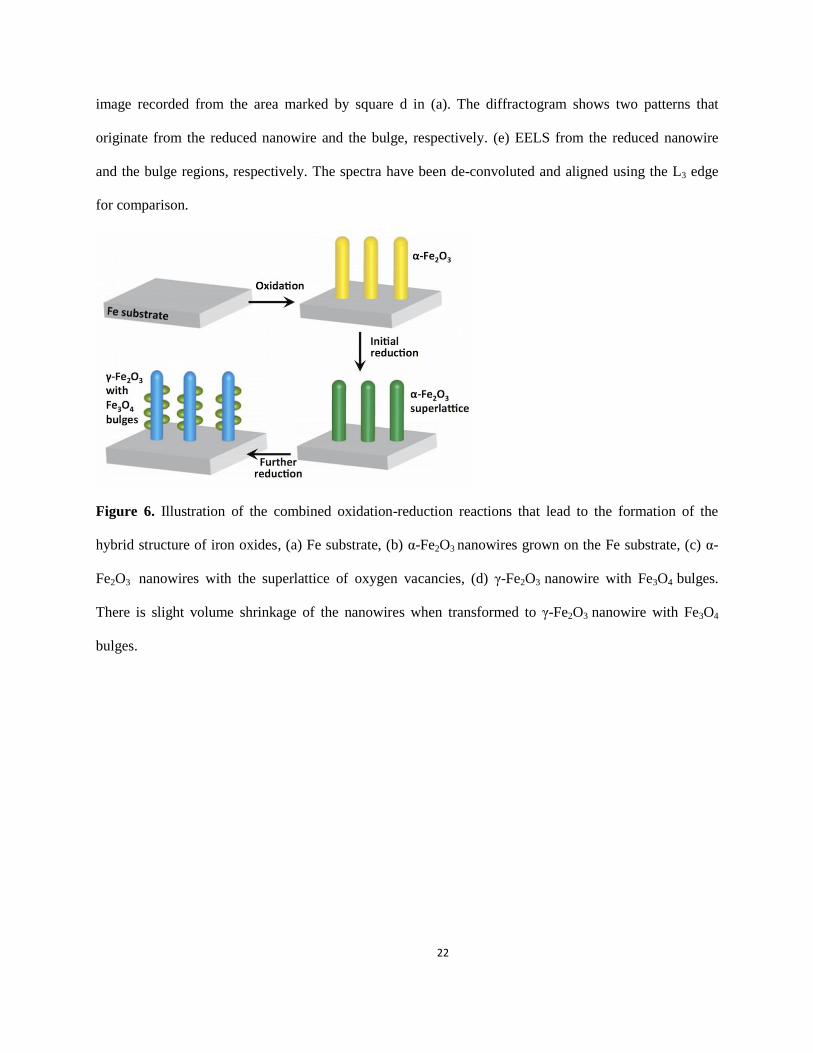
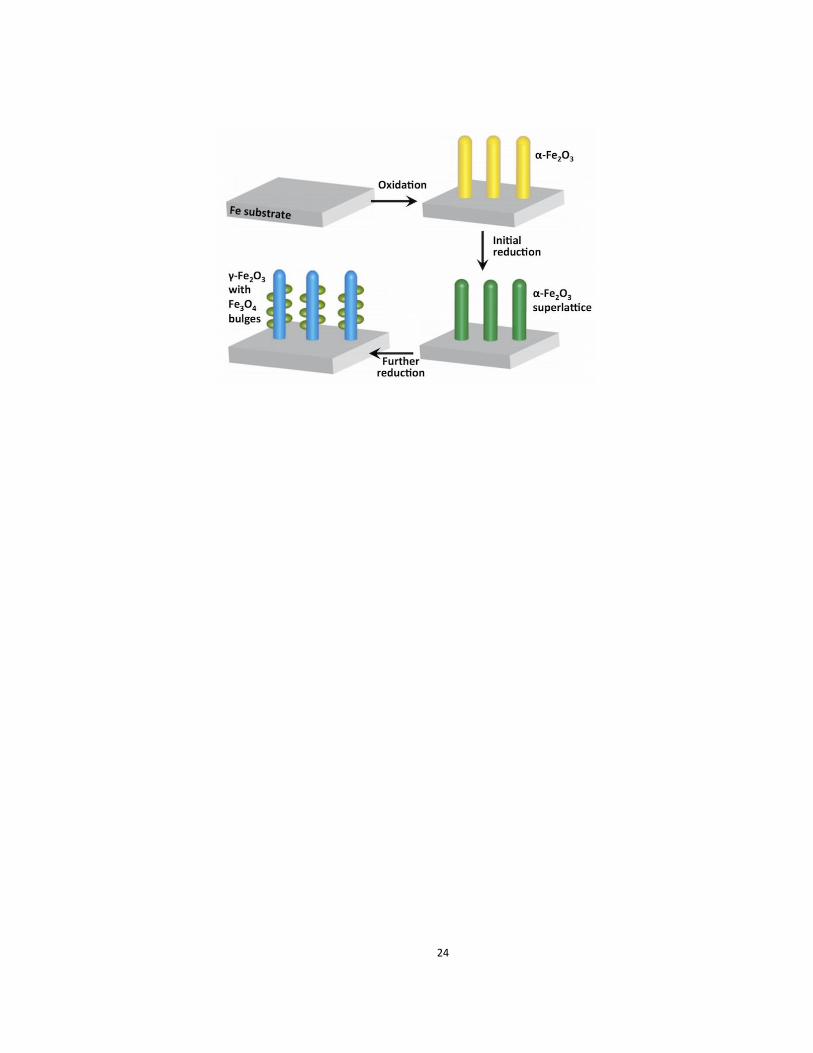
Fig. 6 illustrates schematically the pathway of the crystallographic transformation
based on our experimental observations of the reduction of α-Fe2O3 nanowires. The reduction of the α-
Fe2O3 nanowires, formed by oxidation of the Fe foil, as reported extensively in our previous work,19, 32, 42-
43 starts by the formation of random oxygen vacancies due to the removal of lattice oxygen by H2. During
continued reduction, oxygen vacancies order via vacancy coalescence on every 10th )0330( plane that
results in a partially reduced α-Fe2O3 nanowire with no morphological change. As the reduction continues,
and more oxygen vacancies form; the α-Fe2O3 structure becomes unstable and transforms to the γ-Fe2O3
/Fe3O4 hybrid structure. The loss of oxygen-vacancy ordering, which is evident by the disappearance of
the extra spots in the diffraction pattern, is accompanied with the partial change of oxidation state of Fe,
forming Fe3O4 as a bulge having a topotactic orientation relationship with the γ-Fe2O3 nanowire. The
theoretical densities for α-Fe2O3 and γ-Fe2O3 are 5.27 g•cm-3
and 5.47 g•cm-3
, respectively. For the
transformation of the parent nanowires from α-Fe2O3 to γ-Fe2O3, there is a volume shrinkage by ≈ 3 %.
10
As shown from our TEM observations, the shape of the nanowire remains relatively unchanged,
suggesting there is little diffusion involved or needed for the phase transition. Moreover, there is only a
small change in composition, still very close to an allotropic transformation. The long-range ordering of
oxygen vacancies disappears after enabling the allotropic transformation in the nanowires.
Although the γ-Fe2O3 and the Fe3O4, structures are very similar, their densities are different. The
unit cell volume of γ-Fe2O3 is 0.5816 (nm)3 and there are 12 formula units in the unit cell, i.e. the
theoretical density is 5.47 g•cm-3
; while for Fe3O4, the unit cell volume is 0.5915 (nm)3 with 8 formula
units in it, which gives a theoretical density of 5.10 g•cm-3
.44
Therefore, the transformation from γ-Fe2O3
to Fe3O4 is accompanied by a volume expansion of ≈ 7 % 9 and results in the formation of bulges on the
parent nanowires.
It has been shown that hydroxyls (OH) can form on the hematite surface upon exposure to
hydrogen at room temperature, which recombine to H2O and then desorb upon heating to ~ 275 K.45
Because of the significantly higher temperature (~ 800 K) employed in our reduction experiments, it is
reasonable to expect that hydroxyls exist only as an intermediate and quickly desorb from the surface as
H2O molecules, which results in the reduction of α-Fe2O3. While full ab initio modeling of the reduction
process is challenging, select steps can be checked qualitatively against previously published and present
DFT results. A number of DFT studies have been dedicated to examination of hematite's bulk and surface
properties.20, 25-26, 46-48
Souvi et al. reported a detailed analysis of the α-Fe2O3 adsorption thermodynamics
in the presence of O2, H2O, and H2 gases.26
Based on these findings, our samples exposed to O2 under all
considered (P, T) conditions most likely had purely Fe-terminated surfaces (Fe-O3-Fe in Fig. 7(a)).
According to the calculated phase stability diagrams for hydrogenated surfaces 26
, one should expect
different partial H coverages in the relevant (P, T) ranges. At 270 Pa and 900 K, the most stable
configuration was found to be Fe-O3-H-Fe, in which one out of the three topmost O atoms forms an OH
group. At lower temperatures, a more H-rich Fe-O3-2H-Fe configuration with a slightly reconstructed
11
surface was determined to be thermodynamically stable, in which the formation of the second OH group
pushed the O atom above the topmost Fe atom (see Fig. 7(b)).
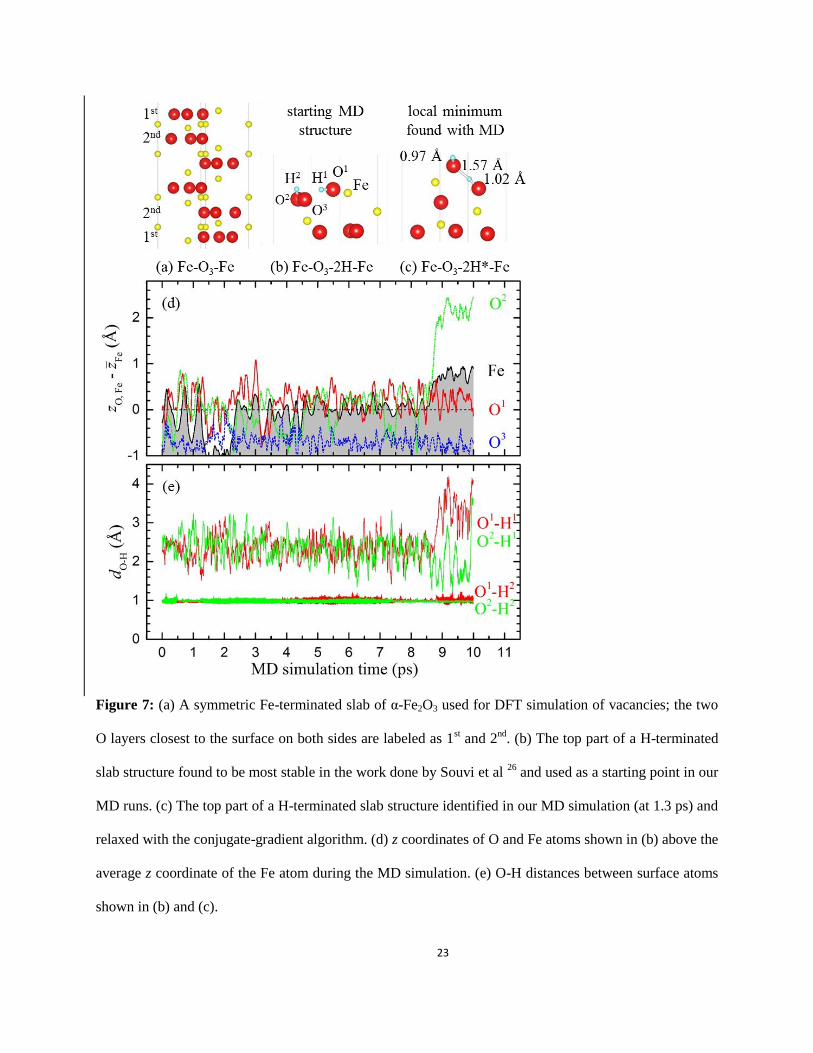
We performed several MD runs to obtain additional information on the behavior of the system in
the H2-rich environment at elevated temperatures. In order to accelerate the exploration of relevant nearby
configurations in our longest simulation we set the temperature to the highest 800-K value used in the
experiment. Starting with the previously reported stable Fe-O3-2H-Fe structure 26
, we evolved the system
for 10 ps (10,000 steps) and monitored relative positions of the atoms at one of the surfaces. Fig. 7(d)
demonstrates that among the three surface O atoms the two that are capped with H tend to stay above the
average Fe position. This behavior can be attributed to a weaker bonding of the two H-capped O atoms
with the subsurface Fe ions and to the configurational entropy factor that forces the system at high
temperatures to stay predominantly in regions with abundance of nearly degenerate states. Fig. 7(e) tracks
the O-H distances and reveals several instances of the O atoms acquiring a second H neighbor. The
relaxed structure extracted at 1.3 ps was found to have the second nearest O-H distance of 0.157 nm and
to be a local minimum only 0.13 eV above the initial state (Fig. 7(c)). Several structures appearing after
6.3 ps featured even shorter second O-H bond lengths as low as 0.120 nm. Despite not being local minima,
configurations observed after 8.5 ps had one OH group consistently above the top Fe atom.
Although DFT-level MD simulations for systems of such size can rarely be used for determining
or quantifying all relevant transformations, our results indicate that adsorbed H atoms show no propensity
for migrating into the oxide but rather form H-OH complexes on the oxide's surface. These frequently
appearing motifs at typical H reduction temperatures are still strongly bonded to the surface Fe and/or O
atoms but could be viewed as water molecule precursors. Identification of all intermediate steps and
transition paths determining the removal of water molecules from the surface and, consequently, creation
of a surface O vacancy (VO) will require a separately dedicated study. It will be interesting to compare the
desorption paths and barriers to those obtained previously for select Fe- and O-terminated surfaces.20
12
Our last set of DFT calculations provides information on the energetics of creating VO in different
bulk and surface α-Fe2O3 structures. For quantifying the VO-VO and VO-surface proximity effects we
calculated and compared VO formation energies in 2 bulk and 4 slab configurations. As in our previous
study of vacancies in CuO 49
, analysis of VO formation energy differences at the same (P, T) conditions
does not require (P, T)-dependent adjustment of the chemical potential for O2 calculated at 0 K, as the
correction cancels out. In the largest considered 2×2×1 bulk supercell, with vacancies separated by ~ 1
nm laterally and ~ 1.4 nm vertically, the 0-K defect formation energy was found to be 4.24 eV/VO. A
reduction by 0.25 eV/VO was observed for the conventional 1×1×1unit cell (Fig. 1(a)), in which a single
vacancy site is surrounded by 6 nearest images ~ 0.5 nm away in the x-y plane. The slab unit cell has the
same lateral dimensions and we can isolate the influence of the surface by using the 3.99 eV/VO value
from the 1×1×1 bulk calculation as a reference. Removal of a single O atom in different (sub)surface O
layers shown in Fig. 7(a) resulted in lowering the VO formation energy by 0.07 eV/ VO for the 2nd
layer
and by 0.44 eV/ VO for the 1st one. It is worth noting that creation of vacancy pairs symmetrically in ether
two 1st layers or two 2
nd layers on the opposite slab surfaces resulted in virtually identical defect energies
per VO, which is not surprising considering that the two 2nd
layers on the opposite sides are already 0.72
nm apart. The findings suggest that even for relatively small separations of about 0.5 nm the direct VO-VO
interaction does not exceed 0.1 eV/VO. Presence of the surface has a noticeable effect on the VO formation
energy only in the 1st O layer. In dynamic equilibrium at 800 K, the ~ 0.4 eV/VO difference would cause
about a 100-fold difference in the vacancy concentration in the surface and bulk layers. In the considered
process, the relative vacancy concentrations also depend on the kinetics factors defining the O removal
rate from the surface and the O diffusion rate from bulk to surface.
4. Conclusion
In summary, we have shown that the reduction of metal oxide nanowires can be employed to
generate hybrid oxides that combine the metal in different oxidation states. The reduction starts with the
formation of an ordered lattice of oxygen vacancies, forming the partially-reduced α-Fe2O3 superstructure.
13
As reduction continues, the α-Fe2O3 nanowires transformed into a γ-Fe2O3 / Fe3O4 hybrid structure. The
resulting oxide composites consist of the transformed oxide phase (-Fe2O3) that remains as the skeleton
and the lower oxides (Fe3O4) that have the form of nanoscale bulges decorating the transformed oxide
skeleton. The mechanism underlying the formation of these unique hybrid oxides is identified as an
allotropic transformation of α-Fe2O3 γ-Fe2O3 via the annihilation of oxygen vacancies in the parent α-
Fe2O3, which is followed by a topotactic transformation of the γ-Fe2O3 Fe3O4 via the nucleation of
Fe3O4 nanoparticles on the surface of the transformed γ-Fe2O3 nanowires. Our DFT results are consistent
with the experimental ones. Compared to previous report of α-Fe2O3 directly reduced to Fe3O4, our work
provides a more in-depth understanding with substeps of reduction, i.e, the superlattice formation by
oxygen vacancy ordering and the allotropic transformation happened during α-Fe2O3 Fe3O4. The whole
reduction process follows: α-Fe2O3 α-Fe2O3 superlattice γ-Fe2O3 + Fe3O4 Fe3O4.
Acknowledgement: This work was supported by the National Science Foundation under NSF CAREER
Award Grant CMMI-1056611. I.M. and A.N.K. gratefully acknowledge the NSF support (Award No.
1410514).
14
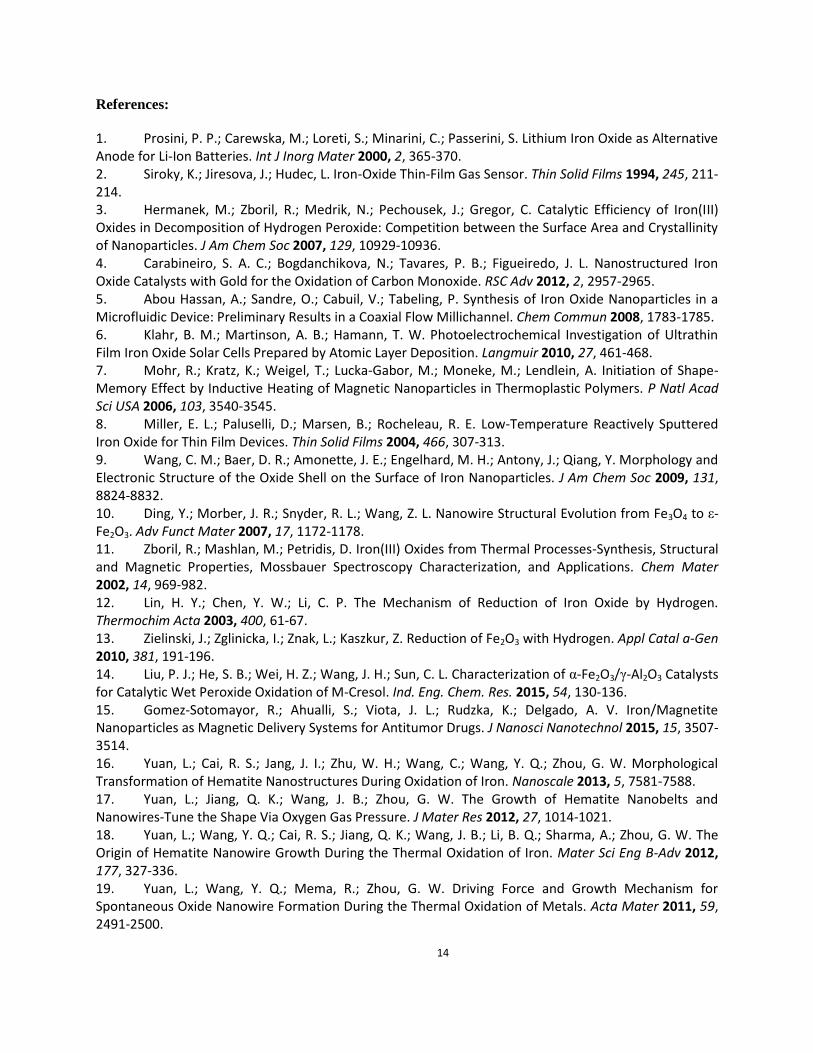
References:
1. Prosini, P. P.; Carewska, M.; Loreti, S.; Minarini, C.; Passerini, S. Lithium Iron Oxide as Alternative Anode for Li-Ion Batteries. Int J Inorg Mater 2000, 2, 365-370. 2. Siroky, K.; Jiresova, J.; Hudec, L. Iron-Oxide Thin-Film Gas Sensor. Thin Solid Films 1994, 245, 211-214. 3. Hermanek, M.; Zboril, R.; Medrik, N.; Pechousek, J.; Gregor, C. Catalytic Efficiency of Iron(III) Oxides in Decomposition of Hydrogen Peroxide: Competition between the Surface Area and Crystallinity of Nanoparticles. J Am Chem Soc 2007, 129, 10929-10936. 4. Carabineiro, S. A. C.; Bogdanchikova, N.; Tavares, P. B.; Figueiredo, J. L. Nanostructured Iron Oxide Catalysts with Gold for the Oxidation of Carbon Monoxide. RSC Adv 2012, 2, 2957-2965. 5. Abou Hassan, A.; Sandre, O.; Cabuil, V.; Tabeling, P. Synthesis of Iron Oxide Nanoparticles in a Microfluidic Device: Preliminary Results in a Coaxial Flow Millichannel. Chem Commun 2008, 1783-1785. 6. Klahr, B. M.; Martinson, A. B.; Hamann, T. W. Photoelectrochemical Investigation of Ultrathin Film Iron Oxide Solar Cells Prepared by Atomic Layer Deposition. Langmuir 2010, 27, 461-468. 7. Mohr, R.; Kratz, K.; Weigel, T.; Lucka-Gabor, M.; Moneke, M.; Lendlein, A. Initiation of Shape-Memory Effect by Inductive Heating of Magnetic Nanoparticles in Thermoplastic Polymers. P Natl Acad Sci USA 2006, 103, 3540-3545. 8. Miller, E. L.; Paluselli, D.; Marsen, B.; Rocheleau, R. E. Low-Temperature Reactively Sputtered Iron Oxide for Thin Film Devices. Thin Solid Films 2004, 466, 307-313. 9. Wang, C. M.; Baer, D. R.; Amonette, J. E.; Engelhard, M. H.; Antony, J.; Qiang, Y. Morphology and Electronic Structure of the Oxide Shell on the Surface of Iron Nanoparticles. J Am Chem Soc 2009, 131, 8824-8832. 10. Ding, Y.; Morber, J. R.; Snyder, R. L.; Wang, Z. L. Nanowire Structural Evolution from Fe3O4 to ε-Fe2O3. Adv Funct Mater 2007, 17, 1172-1178. 11. Zboril, R.; Mashlan, M.; Petridis, D. Iron(III) Oxides from Thermal Processes-Synthesis, Structural and Magnetic Properties, Mossbauer Spectroscopy Characterization, and Applications. Chem Mater 2002, 14, 969-982. 12. Lin, H. Y.; Chen, Y. W.; Li, C. P. The Mechanism of Reduction of Iron Oxide by Hydrogen. Thermochim Acta 2003, 400, 61-67. 13. Zielinski, J.; Zglinicka, I.; Znak, L.; Kaszkur, Z. Reduction of Fe2O3 with Hydrogen. Appl Catal a-Gen 2010, 381, 191-196. 14. Liu, P. J.; He, S. B.; Wei, H. Z.; Wang, J. H.; Sun, C. L. Characterization of α-Fe2O3/γ-Al2O3 Catalysts for Catalytic Wet Peroxide Oxidation of M-Cresol. Ind. Eng. Chem. Res. 2015, 54, 130-136. 15. Gomez-Sotomayor, R.; Ahualli, S.; Viota, J. L.; Rudzka, K.; Delgado, A. V. Iron/Magnetite Nanoparticles as Magnetic Delivery Systems for Antitumor Drugs. J Nanosci Nanotechnol 2015, 15, 3507-3514. 16. Yuan, L.; Cai, R. S.; Jang, J. I.; Zhu, W. H.; Wang, C.; Wang, Y. Q.; Zhou, G. W. Morphological Transformation of Hematite Nanostructures During Oxidation of Iron. Nanoscale 2013, 5, 7581-7588. 17. Yuan, L.; Jiang, Q. K.; Wang, J. B.; Zhou, G. W. The Growth of Hematite Nanobelts and Nanowires-Tune the Shape Via Oxygen Gas Pressure. J Mater Res 2012, 27, 1014-1021. 18. Yuan, L.; Wang, Y. Q.; Cai, R. S.; Jiang, Q. K.; Wang, J. B.; Li, B. Q.; Sharma, A.; Zhou, G. W. The Origin of Hematite Nanowire Growth During the Thermal Oxidation of Iron. Mater Sci Eng B-Adv 2012, 177, 327-336. 19. Yuan, L.; Wang, Y. Q.; Mema, R.; Zhou, G. W. Driving Force and Growth Mechanism for Spontaneous Oxide Nanowire Formation During the Thermal Oxidation of Metals. Acta Mater 2011, 59, 2491-2500.
15
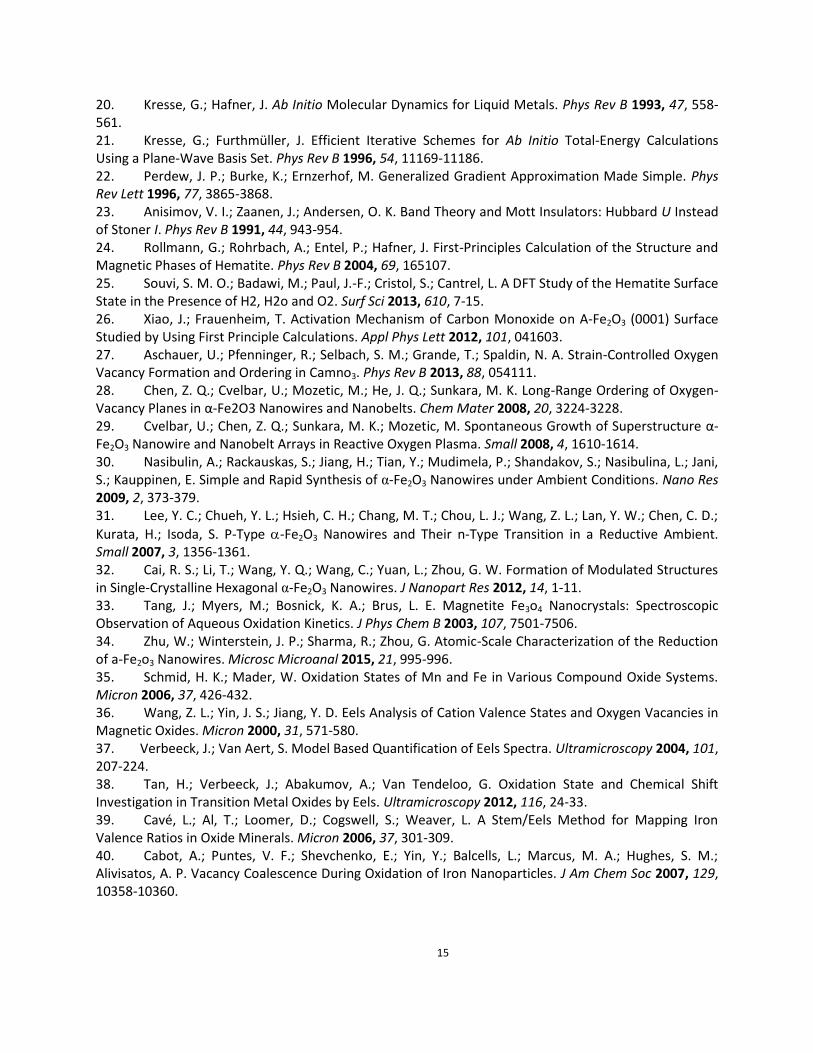
20. Kresse, G.; Hafner, J. Ab Initio Molecular Dynamics for Liquid Metals. Phys Rev B 1993, 47, 558-561. 21. Kresse, G.; Furthmüller, J. Efficient Iterative Schemes for Ab Initio Total-Energy Calculations Using a Plane-Wave Basis Set. Phys Rev B 1996, 54, 11169-11186. 22. Perdew, J. P.; Burke, K.; Ernzerhof, M. Generalized Gradient Approximation Made Simple. Phys Rev Lett 1996, 77, 3865-3868. 23. Anisimov, V. I.; Zaanen, J.; Andersen, O. K. Band Theory and Mott Insulators: Hubbard U Instead of Stoner I. Phys Rev B 1991, 44, 943-954. 24. Rollmann, G.; Rohrbach, A.; Entel, P.; Hafner, J. First-Principles Calculation of the Structure and Magnetic Phases of Hematite. Phys Rev B 2004, 69, 165107. 25. Souvi, S. M. O.; Badawi, M.; Paul, J.-F.; Cristol, S.; Cantrel, L. A DFT Study of the Hematite Surface State in the Presence of H2, H2o and O2. Surf Sci 2013, 610, 7-15. 26. Xiao, J.; Frauenheim, T. Activation Mechanism of Carbon Monoxide on Α-Fe2O3 (0001) Surface Studied by Using First Principle Calculations. Appl Phys Lett 2012, 101, 041603. 27. Aschauer, U.; Pfenninger, R.; Selbach, S. M.; Grande, T.; Spaldin, N. A. Strain-Controlled Oxygen Vacancy Formation and Ordering in Camno3. Phys Rev B 2013, 88, 054111. 28. Chen, Z. Q.; Cvelbar, U.; Mozetic, M.; He, J. Q.; Sunkara, M. K. Long-Range Ordering of Oxygen-Vacancy Planes in α-Fe2O3 Nanowires and Nanobelts. Chem Mater 2008, 20, 3224-3228. 29. Cvelbar, U.; Chen, Z. Q.; Sunkara, M. K.; Mozetic, M. Spontaneous Growth of Superstructure α-Fe2O3 Nanowire and Nanobelt Arrays in Reactive Oxygen Plasma. Small 2008, 4, 1610-1614. 30. Nasibulin, A.; Rackauskas, S.; Jiang, H.; Tian, Y.; Mudimela, P.; Shandakov, S.; Nasibulina, L.; Jani, S.; Kauppinen, E. Simple and Rapid Synthesis of α-Fe2O3 Nanowires under Ambient Conditions. Nano Res 2009, 2, 373-379. 31. Lee, Y. C.; Chueh, Y. L.; Hsieh, C. H.; Chang, M. T.; Chou, L. J.; Wang, Z. L.; Lan, Y. W.; Chen, C. D.;
Kurata, H.; Isoda, S. P-Type -Fe2O3 Nanowires and Their n-Type Transition in a Reductive Ambient. Small 2007, 3, 1356-1361. 32. Cai, R. S.; Li, T.; Wang, Y. Q.; Wang, C.; Yuan, L.; Zhou, G. W. Formation of Modulated Structures in Single-Crystalline Hexagonal α-Fe2O3 Nanowires. J Nanopart Res 2012, 14, 1-11. 33. Tang, J.; Myers, M.; Bosnick, K. A.; Brus, L. E. Magnetite Fe3o4 Nanocrystals: Spectroscopic Observation of Aqueous Oxidation Kinetics. J Phys Chem B 2003, 107, 7501-7506. 34. Zhu, W.; Winterstein, J. P.; Sharma, R.; Zhou, G. Atomic-Scale Characterization of the Reduction of a-Fe2o3 Nanowires. Microsc Microanal 2015, 21, 995-996. 35. Schmid, H. K.; Mader, W. Oxidation States of Mn and Fe in Various Compound Oxide Systems. Micron 2006, 37, 426-432. 36. Wang, Z. L.; Yin, J. S.; Jiang, Y. D. Eels Analysis of Cation Valence States and Oxygen Vacancies in Magnetic Oxides. Micron 2000, 31, 571-580. 37. Verbeeck, J.; Van Aert, S. Model Based Quantification of Eels Spectra. Ultramicroscopy 2004, 101, 207-224. 38. Tan, H.; Verbeeck, J.; Abakumov, A.; Van Tendeloo, G. Oxidation State and Chemical Shift Investigation in Transition Metal Oxides by Eels. Ultramicroscopy 2012, 116, 24-33. 39. Cavé, L.; Al, T.; Loomer, D.; Cogswell, S.; Weaver, L. A Stem/Eels Method for Mapping Iron Valence Ratios in Oxide Minerals. Micron 2006, 37, 301-309. 40. Cabot, A.; Puntes, V. F.; Shevchenko, E.; Yin, Y.; Balcells, L.; Marcus, M. A.; Hughes, S. M.; Alivisatos, A. P. Vacancy Coalescence During Oxidation of Iron Nanoparticles. J Am Chem Soc 2007, 129, 10358-10360.

16
41. Signorini, L.; Pasquini, L.; Savini, L.; Carboni, R.; Boscherini, F.; Bonetti, E.; Giglia, A.; Pedio, M.; Mahne, N.; Nannarone, S. Size-Dependent Oxidation in Iron/Iron Oxide Core-Shell Nanoparticles. Physical Review B 2003, 68, 195423. 42. Yuan, L.; Wang, Y.; Cai, R.; Jiang, Q.; Wang, J.; Li, B.; Sharma, A.; Zhou, G. The Origin of Hematite Nanowire Growth During the Thermal Oxidation of Iron. Mater Sci Eng, B 2012, 177, 327-336. 43. Yuan, L.; Jiang, Q.; Wang, J.; Zhou, G. The Growth of Hematite Nanobelts and Nanowires—Tune the Shape Via Oxygen Gas Pressure. J Mater Res 2012, 27, 1014-1021. 44. Levy, D.; Giustetto, R.; Hoser, A. Structure of Magnetite (Fe3O4) above the Curie Temperature: A Cation Ordering Study. Phys Chem Miner 2012, 39, 169-176. 45. Huang, W.; Ranke, W.; Schlögl, R. Reduction of an Α-Fe2o3 (0001) Film Using Atomic Hydrogen. J Phys Chem C 2007, 111, 2198-2204. 46. Nguyen, M.-T.; Seriani, N.; Gebauer, R. Water Adsorption and Dissociation on α-Fe2o3(0001): PBE + U Calculations. J Chem Phys 2013, 138, 194709. 47. Wang, X. G.; Weiss, W.; Shaikhutdinov, S. K.; Ritter, M.; Petersen, M.; Wagner, F.; Schlögl, R.;
Scheffler, M. The Hematite -Fe2O3(0001) Surface: Evidence for Domains of Distinct Chemistry. Phys Rev Lett 1998, 81, 1038-1041. 48. Bergermayer, W.; Schweiger, H.; Wimmer, E. Ab Initio Thermodynamics of Oxide Surfaces: O2 on Fe2O3(0001). Phys Rev B 2004, 69, 195409. 49. Yuan, L.; Van Der Geest, A. G.; Zhu, W.; Yin, Q.; Li, L.; Kolmogorov, A. N.; Zhou, G. Reduction of Cuo Nanowires Confined by a Nano Test Tube. RSC Adv. 2014, 4, 30259-30266.
17
Table:
Table 1: The L3/L2 ratio of the reduced products of α-Fe2O3 nanowires and the standard commercial
nanoparticles of different iron oxides.
Iron oxides α-Fe2O3 γ-Fe2O3 Fe3O4 FeO
Reduced
nanowire
(area b in
Fig. 5(a))
Reduced nanowire
bulge (area c in
Fig. 5(a))
L3/L2 ratio of
Fe L edge 5.23±0.01 5.11±0.01 4.61±0.01 4.48±0.01 5.20±0.01 4.63±0.01
Oxidation
state 3 3 2.67 2 3 2.67
18
Figure captions:
Figure 1. Crystallographic unit cell of different iron oxides: (a) α-Fe2O3, (b) γ-Fe2O3, (c) Fe3O4, and (d)
FeO.
Figure 2. (a) SEM images of -Fe2O3 nanowires formed from the oxidation of an Fe substrate; the inset
is a STEM image of a single -Fe2O3 nanowire revealing a smooth surface and uniform diameter. (b)
SEM image of nanowires after reduction at 500 C and 270 Pa of H2 pressure for 50 min; the inset is a
higher magnification SEM image showing the formation of bulges on the surface of the nanowires.
19
Figure 3. (a) a TEM image of an α-Fe2O3 nanowire before the reduction treatment, the inset is a
nanodiffraction pattern taken from the region indicated by the red box, revealing the [0001] zone axis of
α-Fe2O3; (b) a representative HRTEM image obtained from the α-Fe2O3 nanowire in the area marked by
the red box shown in (a), revealing the perfect lattice structure in the un-reduced nanowires. The inset is a
diffractogram (fast Fourier transform) of the HRTEM image. The surface plane of the nanowire is )3003( .
20
Figure 4. (a) TEM image showing the morphology of a reduced nanowire. (b) Nanodiffraction pattern of
the nanowire along the α-Fe2O3 [0001] zone axis with extra spots along the [ 0330 ] direction. (c)
Superstructure model, viewed in c-direction and a-direction, built using 10×10×1 unit cell of the original
α-Fe2O3 with oxygen vacancies marked by red or yellow circles. (d) HRTEM image of the α-Fe2O3
nanowire along the [0001] direction; the upper inset shows the diffractogram of the HRTEM image and
the lower inset shows a simulated diffractogram based on the structure model shown in (c). The area
within the red square is the simulated HRTEM image with a thickness of 18 nm and defocus value of -20
nm. The simulated HRTEM images are identical whether the lattice planes with the ordered oxygen
vacancies are removed or placed in the superstructure, i.e. the vacancy ordering is not revealed in the
simulated or the HRTEM images when viewed along c-direction but it is apparent from the diffraction
pattern and diffractogram.
21
Figure 5. (a) TEM image of a reduced oxide nanowire with a bulge after further reduction. (b)
Nanodiffraction pattern from the reduced nanowire (marked by the red circle ‘b’ in (a)). (c)
Nanodiffraction pattern from the bulge region (marked by the red circle ‘c’ in (a)). (d) the HRTEM
22
image recorded from the area marked by square d in (a). The diffractogram shows two patterns that
originate from the reduced nanowire and the bulge, respectively. (e) EELS from the reduced nanowire
and the bulge regions, respectively. The spectra have been de-convoluted and aligned using the L3 edge
for comparison.
Figure 6. Illustration of the combined oxidation-reduction reactions that lead to the formation of the
hybrid structure of iron oxides, (a) Fe substrate, (b) α-Fe2O3 nanowires grown on the Fe substrate, (c) α-
Fe2O3 nanowires with the superlattice of oxygen vacancies, (d) γ-Fe2O3 nanowire with Fe3O4 bulges.
There is slight volume shrinkage of the nanowires when transformed to γ-Fe2O3 nanowire with Fe3O4
bulges.
23
Figure 7: (a) A symmetric Fe-terminated slab of α-Fe2O3 used for DFT simulation of vacancies; the two
O layers closest to the surface on both sides are labeled as 1st and 2
nd. (b) The top part of a H-terminated
slab structure found to be most stable in the work done by Souvi et al 26
and used as a starting point in our
MD runs. (c) The top part of a H-terminated slab structure identified in our MD simulation (at 1.3 ps) and
relaxed with the conjugate-gradient algorithm. (d) z coordinates of O and Fe atoms shown in (b) above the
average z coordinate of the Fe atom during the MD simulation. (e) O-H distances between surface atoms
shown in (b) and (c).
24