Embed Size (px)
Citation preview
This PDF is a selection from an out-of-print volume from the National Bureauof Economic Research
Volume Title: Behavioral and Distributional Effects of Environmental Policy
Volume Author/Editor: Carlo Carraro and Gilbert E. Metcalf, editors
Volume Publisher: University of Chicago Press
Volume ISBN: 0-226-09481-2
Volume URL: http://www.nber.org/books/carr01-1
Conference Date: June 11–12, 1999
Publication Date: January 2001
Chapter Title: Environmental Information and Company Behavior
Chapter Author: Domenico Siniscalco, Stefania Borghini, Marcella Fantini,Federica Ranghieri
Chapter URL: http://www.nber.org/chapters/c10611
Chapter pages in book: (p. 251 - 280)
�8Environmental Informationand Company Behavior
Domenico Siniscalco, Stefania Borghini,Marcella Fantini, and Federica Ranghieri
8.1 Introduction
Environmental policy is traditionally based on two sets of tools:(1) command and control regulations; and (2) economic or market instru-ments, such as environmental taxes, emissions charges, and tradable per-mits. The two sets of instruments have been adopted in subsequent waves,partly in response to economic analysis that shows command and controlenvironmental policies are not cost-effective or are incapable of achievingthe desired objectives in many circumstances.
In the last few years, some policymakers, the business community, andthe media have increasingly emphasized the role of information-basedenvironmental instruments. Such instruments, which are typically volun-tary, range from company environmental reports to environmental auditand management schemes, such as International Standards Organization(ISO) 14000, Eco Management Audit Scheme (EMAS), and related awardand compensation systems.
Information-based environmental policies are the subject of a lively de-bate. Their supporters claim that environmental reports and environmen-tal management schemes are fundamental instruments for achieving the
Domenico Siniscalco is professor of economics at the University of Torino and director ofFondazione Eni Enrico Mattei. Stefania Borghini is a researcher at Fondazione Eni EnricoMattei. Marcella Fantini is a researcher at Fondazione Eni Enrico Mattei and a lecturer atthe University of Bergamo. Federica Ranghieri is a researcher at Fondazione Eni EnricoMattei.
The authors are grateful to Kevin A. Hassett and other conference participants for theirhelpful comments. Special thanks go to Carlo Carraro and Gilbert Metcalf for encouragingthe publication of a work which is still in a seminal form. The usual disclaimers, more thanever, apply.
251
desired environmental quality. Their critics claim they are only “green-washing,” basically ineffective and devoid of any real effect.
This paper tries to shed some light on companies’ behavioral responsesto information-based environmental policies, dwelling on two buildingblocks: an original database at the company level collected by FondazioneEni Enrico Mattei (FEEM) since 1995, and some recent literature on in-formation and incentive schemes in companies.
This paper is divided into seven sections. Sections 8.2 and 8.3 briefly de-scribe the main information-based environmental management tools andrecall the theoretical rationale for their adoption; section 8.4 describes thedatabase and identifies a subset of homogeneous companies in three pol-luting industries: (1) oil and gas, (2) petrochemicals, and (3) power genera-tion. Sections 8.5 and 8.6 present some empirical results on the relationbetween information-based environmental strategies, economic perfor-mance, and environmental performance at the company level. Section 8.7contains some concluding remarks.
The paper presents preliminary work that needs refinement. Informa-tion-based environmental policies are still in their infancy and their historyis too recent to allow for a sound econometric analysis. The existing dataand the relevant theory, however, seem to support the hypothesis that in-formation-based environmental policies are indeed an instrument forchanging company behavior and implementing environmental policiesand regulations.
8.2 The Theoretical Background
In the textbook institutional setting, governments set environmentalstandards and companies comply. In addition to this, companies try tofollow sound environmental strategies in order to avoid litigation and theemergence of future environmental liabilities. In some industries, such astrategy may also establish a good environmental reputation, which canbe a powerful tool in their relationship with consumers, communities, andenvironmentalists. In the two latter cases, far-sighted companies may evenexceed environmental standards.
In the situation we have just described, information plays a crucial role.In a world with imperfect information, regulators, investors, consumers,and other stakeholders want to know the companies’ environmental per-formance, the achieved results, and the remaining problems and the sched-ule to solve them. Companies, symmetrically, need to communicate theirenvironmental strategy and performance, in order to deal with their share-holders, stakeholders, and regulators. Against this background, the com-munication aimed at the external stakeholders has been widely discussedin the recent literature (Musu and Siniscalco 1993; Tietenberg 1997; La-noi, Laplant, and Roy 1997; Khanna and Damon 1999; McIntosh et al.
252 D. Siniscalco, S. Borghini, M. Fantini, and F. Ranghieri
1998). The same flow of environmental information, moreover, can play akey role in reshaping company behavior, and this is the focus of our paper.
A useful starting point can be found in two papers, Brehn and Hamilton(1996) and Pfaff and Sanchirico (1999), which claim that the lack of inter-nal information (i.e., ignorance) is often responsible for the noncompliancewith environmental regulation by big companies and for their wrong as-sessment of environmental damage, hence, the need for information toolsand self-audit. The issue, however, is more complex than this.
For many years, companies (as well as regulators and the general public)have somewhat neglected environmental issues, concentrating their effortson economic and financial performance. But neglecting environmentalstandards, particularly in the traditional industries, has gradually createdhidden liabilities that can seriously harm shareholders’ value through vari-ous channels: trials and litigation about health, safety, and pollution; lossof reputation with clients and consumers; conflict with local communitiesand environmental groups; and so forth. Such new issues, which are wellknown to shareholders and companies’ chief executive officers, require achange in company behavior that can be pursued using an information-based environmental strategy that aims at changing company behaviorthrough appropriate flows of information, audit, and incentives (Sinclair-Desgagne and Gabel 1997; Pendergast 1999).
Given the nature and the objectives of information-based environmentalstrategies, governments and regulators too have a clear interest in promot-ing their standardization and wide adoption, sometimes proposing guide-lines themselves to define such schemes and make them mandatory. Insuch cases, we can refer to information-based environmental policies.
8.3 Some Information-Based Environmental Management Tools
The best-known environmental management tool adopted by firms isthe corporate environmental report (CER) published annually by compa-nies to audit and communicate the most relevant environmental issues re-lated to their operations (emissions, effluents, wastes, and expenditure andinvestment in the environmental area).
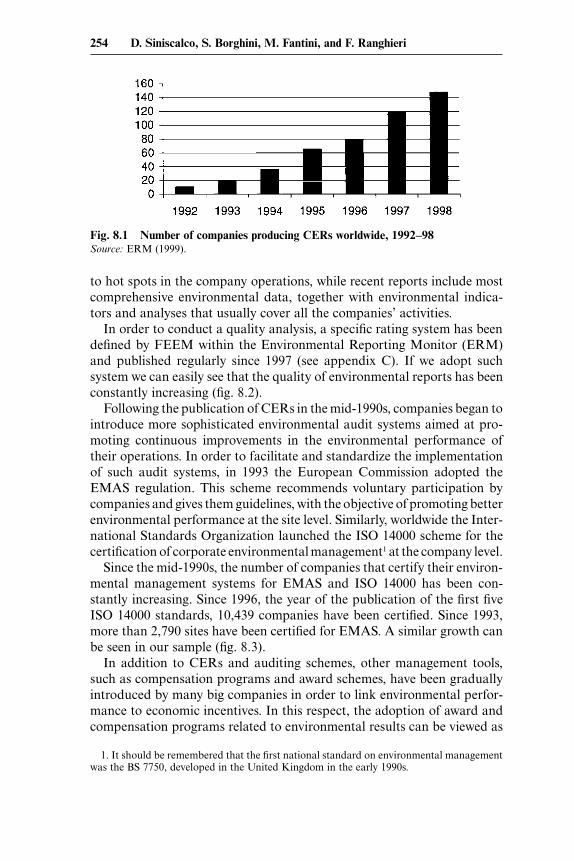
The number of companies publishing environmental reports has beenrapidly growing from 1992 to 1998 (fig. 8.1). Data show that the release ofenvironmental information, which actually began in 1990, was started byfirms in highly polluting industries, such as chemicals and oil and gas.But environmental reporting quickly spread to other industries such as theautomotive and transportation industries, telecommunications, electronicappliances, financial services, and consumer goods.
As previously mentioned, the quality of published environmental re-ports can vary substantially across companies and time. The earlier reportstypically included many statements and very few data, typically referring
Environmental Information and Company Behavior 253
to hot spots in the company operations, while recent reports include mostcomprehensive environmental data, together with environmental indica-tors and analyses that usually cover all the companies’ activities.
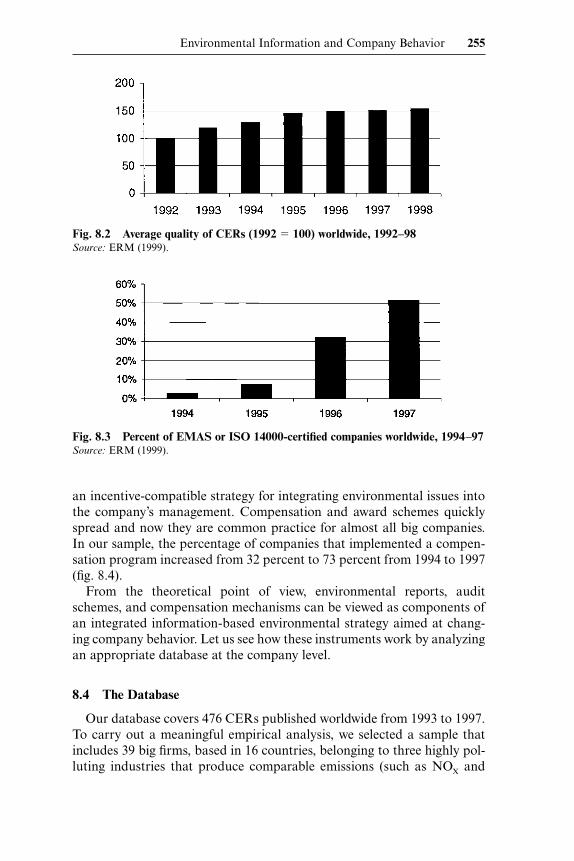
In order to conduct a quality analysis, a specific rating system has beendefined by FEEM within the Environmental Reporting Monitor (ERM)and published regularly since 1997 (see appendix C). If we adopt suchsystem we can easily see that the quality of environmental reports has beenconstantly increasing (fig. 8.2).
Following the publication of CERs in the mid-1990s, companies began tointroduce more sophisticated environmental audit systems aimed at pro-moting continuous improvements in the environmental performance oftheir operations. In order to facilitate and standardize the implementationof such audit systems, in 1993 the European Commission adopted theEMAS regulation. This scheme recommends voluntary participation bycompanies and gives them guidelines, with the objective of promoting betterenvironmental performance at the site level. Similarly, worldwide the Inter-national Standards Organization launched the ISO 14000 scheme for thecertification of corporate environmental management1 at the company level.
Since the mid-1990s, the number of companies that certify their environ-mental management systems for EMAS and ISO 14000 has been con-stantly increasing. Since 1996, the year of the publication of the first fiveISO 14000 standards, 10,439 companies have been certified. Since 1993,more than 2,790 sites have been certified for EMAS. A similar growth canbe seen in our sample (fig. 8.3).
In addition to CERs and auditing schemes, other management tools,such as compensation programs and award schemes, have been graduallyintroduced by many big companies in order to link environmental perfor-mance to economic incentives. In this respect, the adoption of award andcompensation programs related to environmental results can be viewed as
254 D. Siniscalco, S. Borghini, M. Fantini, and F. Ranghieri
Fig. 8.1 Number of companies producing CERs worldwide, 1992–98Source: ERM (1999).
1. It should be remembered that the first national standard on environmental managementwas the BS 7750, developed in the United Kingdom in the early 1990s.
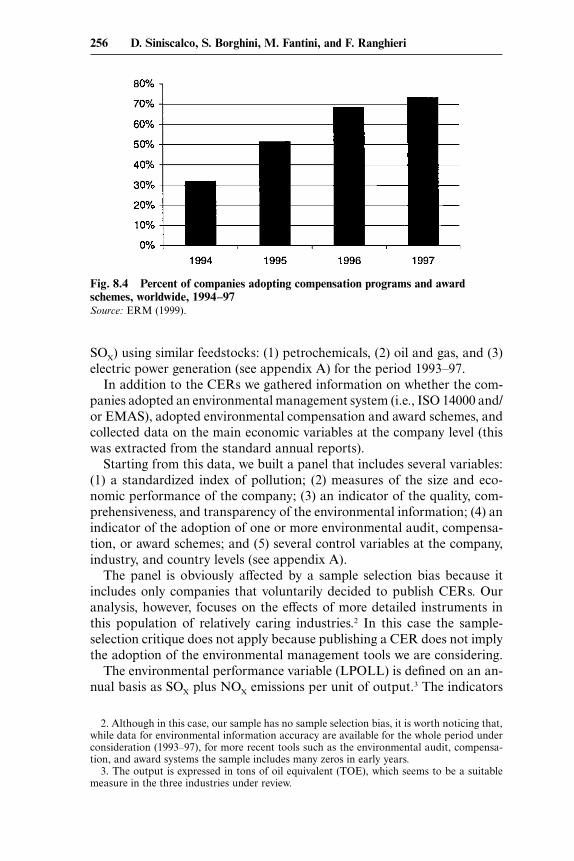
an incentive-compatible strategy for integrating environmental issues intothe company’s management. Compensation and award schemes quicklyspread and now they are common practice for almost all big companies.In our sample, the percentage of companies that implemented a compen-sation program increased from 32 percent to 73 percent from 1994 to 1997(fig. 8.4).
From the theoretical point of view, environmental reports, auditschemes, and compensation mechanisms can be viewed as components ofan integrated information-based environmental strategy aimed at chang-ing company behavior. Let us see how these instruments work by analyzingan appropriate database at the company level.
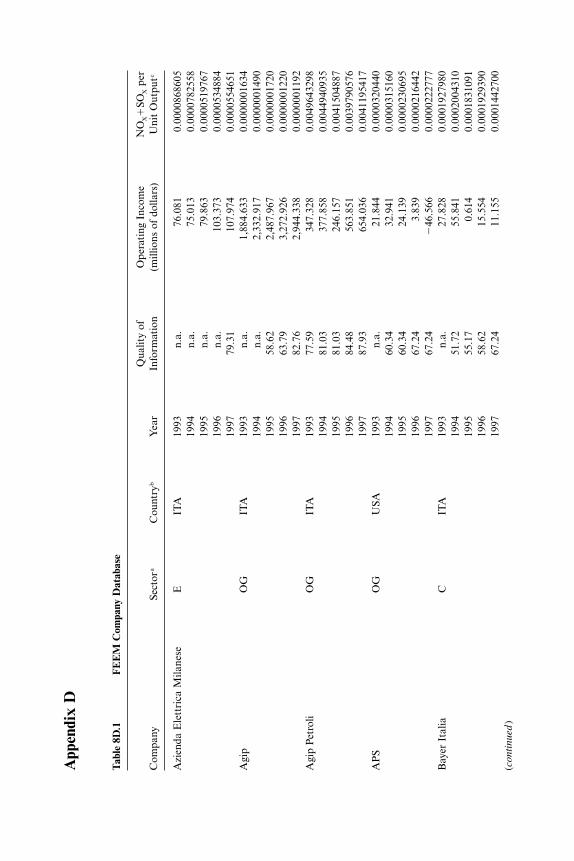
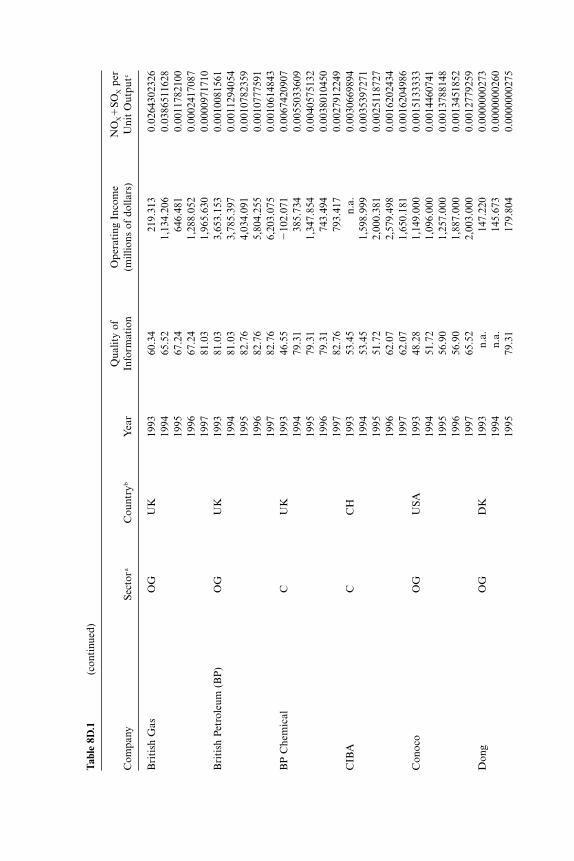
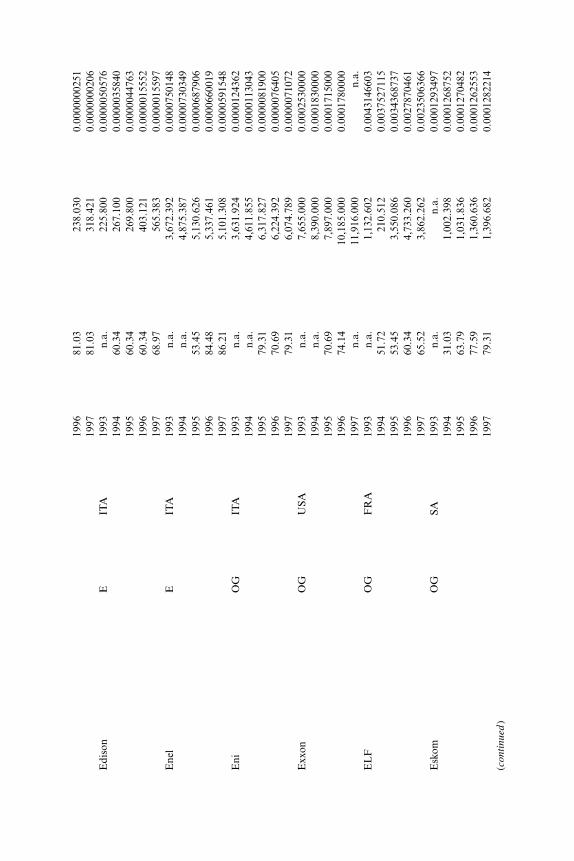
8.4 The Database
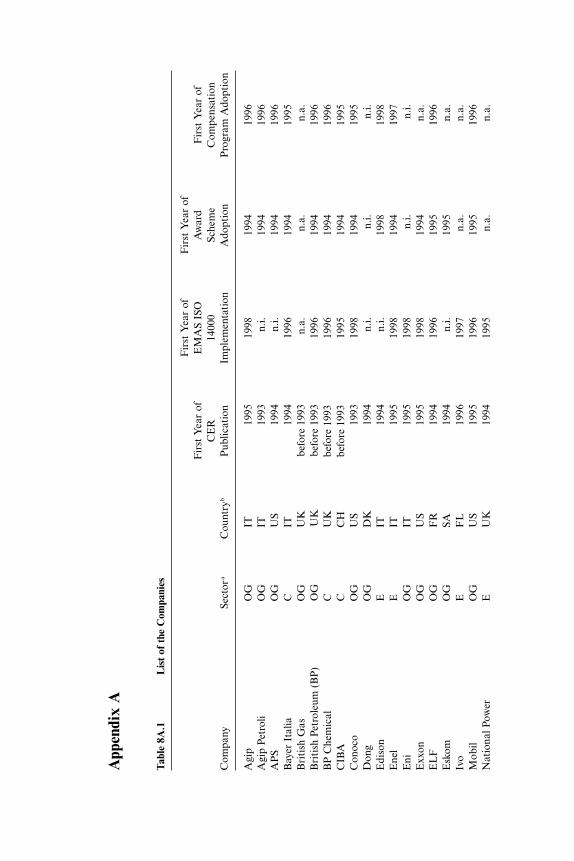
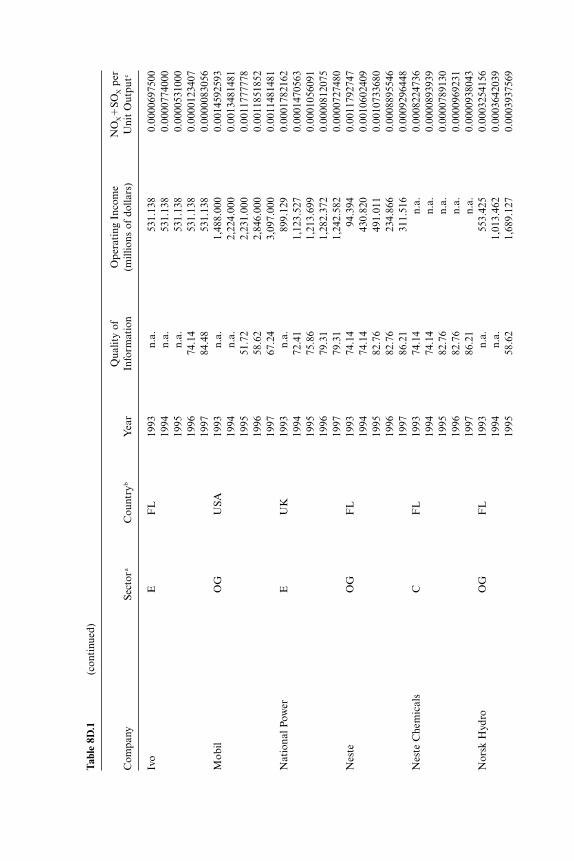
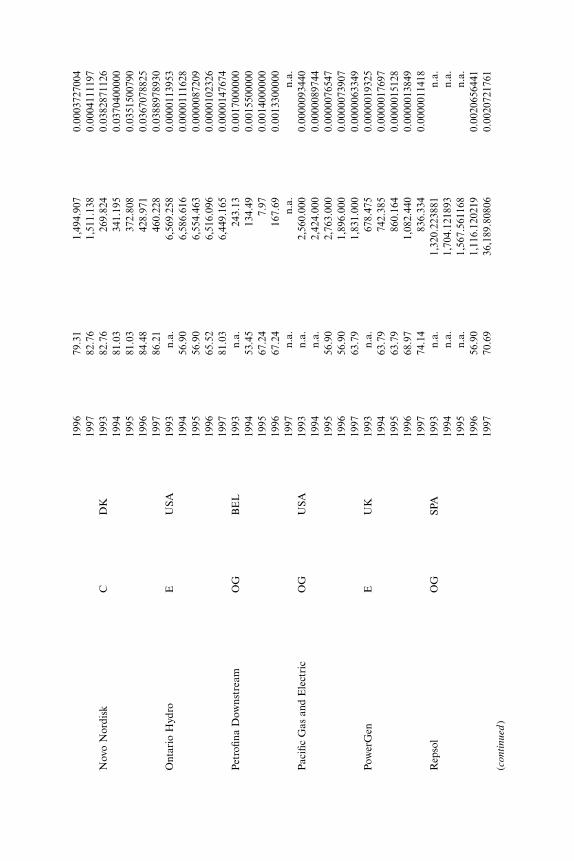
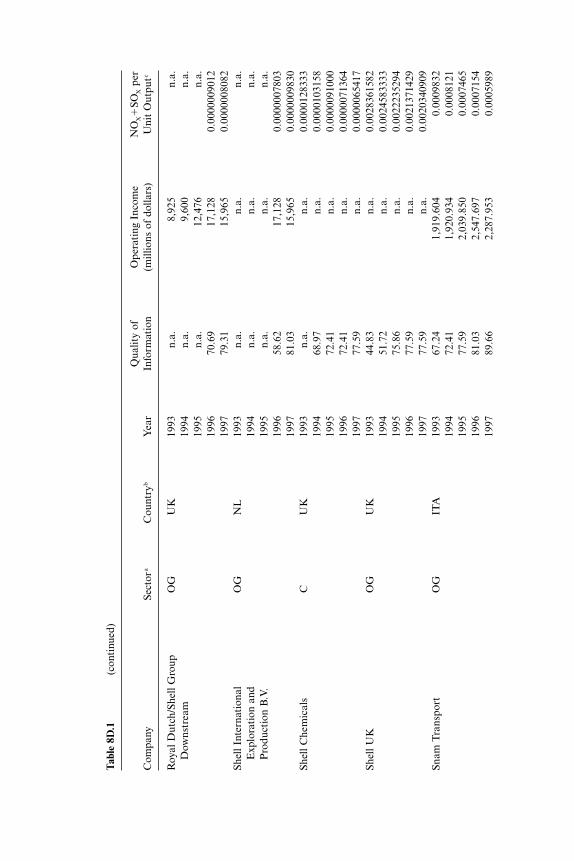
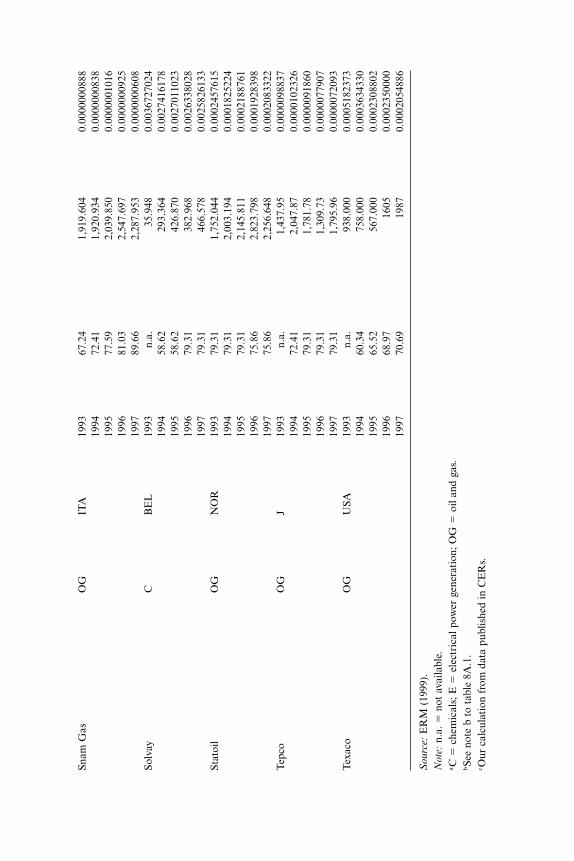
Our database covers 476 CERs published worldwide from 1993 to 1997.To carry out a meaningful empirical analysis, we selected a sample thatincludes 39 big firms, based in 16 countries, belonging to three highly pol-luting industries that produce comparable emissions (such as NOX and
Environmental Information and Company Behavior 255
Fig. 8.2 Average quality of CERs (1992 � 100) worldwide, 1992–98Source: ERM (1999).
Fig. 8.3 Percent of EMAS or ISO 14000-certified companies worldwide, 1994–97Source: ERM (1999).
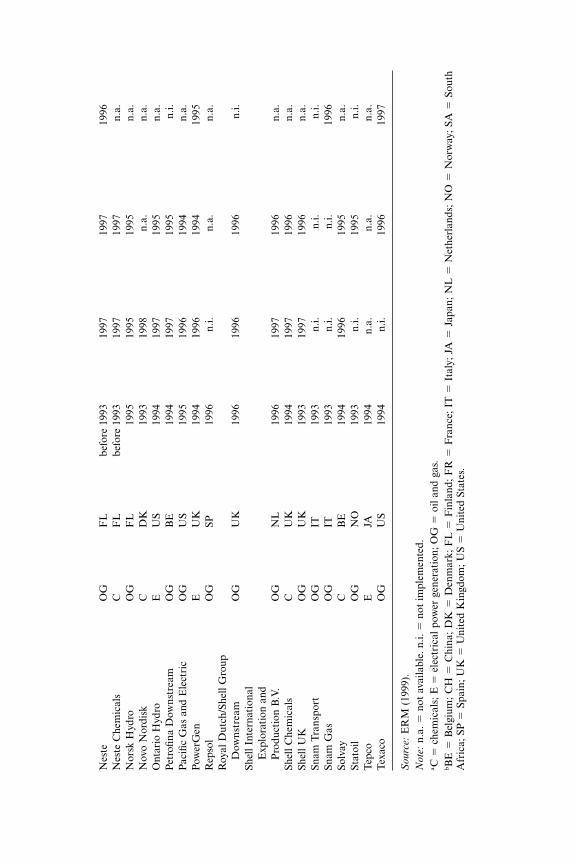
SOX) using similar feedstocks: (1) petrochemicals, (2) oil and gas, and (3)electric power generation (see appendix A) for the period 1993–97.
In addition to the CERs we gathered information on whether the com-panies adopted an environmental management system (i.e., ISO 14000 and/or EMAS), adopted environmental compensation and award schemes, andcollected data on the main economic variables at the company level (thiswas extracted from the standard annual reports).
Starting from this data, we built a panel that includes several variables:(1) a standardized index of pollution; (2) measures of the size and eco-nomic performance of the company; (3) an indicator of the quality, com-prehensiveness, and transparency of the environmental information; (4) anindicator of the adoption of one or more environmental audit, compensa-tion, or award schemes; and (5) several control variables at the company,industry, and country levels (see appendix A).
The panel is obviously affected by a sample selection bias because itincludes only companies that voluntarily decided to publish CERs. Ouranalysis, however, focuses on the effects of more detailed instruments inthis population of relatively caring industries.2 In this case the sample-selection critique does not apply because publishing a CER does not implythe adoption of the environmental management tools we are considering.
The environmental performance variable (LPOLL) is defined on an an-nual basis as SOX plus NOX emissions per unit of output.3 The indicators
2. Although in this case, our sample has no sample selection bias, it is worth noticing that,while data for environmental information accuracy are available for the whole period underconsideration (1993–97), for more recent tools such as the environmental audit, compensa-tion, and award systems the sample includes many zeros in early years.
3. The output is expressed in tons of oil equivalent (TOE), which seems to be a suitablemeasure in the three industries under review.
256 D. Siniscalco, S. Borghini, M. Fantini, and F. Ranghieri
Fig. 8.4 Percent of companies adopting compensation programs and awardschemes, worldwide, 1994–97Source: ERM (1999).
have been chosen on the basis of their impact on the environment and ondata availability. SOX is a main indicator used by the regulators as a basefor the environmental taxation system, and NOX plays a major role in landacidification. At this stage, we cannot consider data on waste and waterdischarges because classification across countries and regulations on wastehave significantly changed over the last 5 years, and the currently availabledata do not account for the damage associated with different dischargedpollutants (a firm emitting a large quantity of a relatively harmless sub-stance would be ranked as a larger polluter than another firm emitting asmall quantity of a very toxic substance).
The size of the company (WORK) is proxied by the number of employ-ees, which also indicates the complexity of the agency problems in theorganization, while the economic performance (OPERATING INCOME)is measured by the operating income in current U.S. dollars.4
The quality of the information disclosed in the environmental reports(INFO) is measured by a scoring system, developed by the ERM at FEEM(see appendix B). The system evaluates the descriptive information con-tained in the report (i.e., mission, objectives, strategy, organization, andprograms), the quality of environmental variables and indicators (e.g.,some reports contain data on emissions but omit economic data, such asdefensive and environmental expenditure, while others include indicatorsbut do not publish raw data for emissions, effluents, and wastes), and thethoroughness of the report (e.g., many reports cover a subset of sites orignore some foreign countries where the company operates).
Information-based environmental management is measured by a 0–3 in-dex (environmental audit, award, and compensation; EAC), which is thesum of three dummy variables: the first (E) records the adoption of EMASand/or ISO 14000;5 the second (A) records the existence of an environ-ment-related award system, which does not give immediate benefits butdirectly influences the future career of the managers and the employees;and the third (C) records the adoption of an environment-related compen-sation scheme.6 A more detailed description of the variables we use in ouranalysis can be found in table 8.4, later.
We are well aware that both company variables and indicators are rather
4. We used companies’ annual reports to collect data on their operating income. Unfortu-nately, most financial statements are expressed only in local currency. In order to make themcomparable we decided to convert all financial variables into current U.S. dollars by usingthe nominal exchange rate of the local currency against the dollar.
5. Data on companies’ environmental management certification were obtained from theEMAS official register and ISO 14000-competent body in each country.
6. To gain information about environmental compensation programs and award schemeswe relied on CERs and annual financial reports and, for U.S. listed companies only, also onofficial disclosure required by the U.S. Securities and Exchange Commission (reports suchas 10K for American companies quoted on the New York Stock Exchange and 20F for non-American companies quoted on the New York Stock Exchange). If this information wasnot available in corporate publications, we directly interviewed companies’ environmentalmanagers and external relation managers.
Environmental Information and Company Behavior 257
raw and must be improved, but CERs have not been published for verylong and the data we can collect are quite limited. In addition to companydata, some control and regulation data have been collected at the coun-try level.
8.5 A First Look at the Data
Do information-based environmental policies work? How do they in-fluence company behavior? Some preliminary answers to such questionscan be found by broadly comparing companies that adopted some infor-mation-based environmental strategies (henceforth EAC companies) be-tween 1993 and 1997 with companies that did not adopt such schemes.
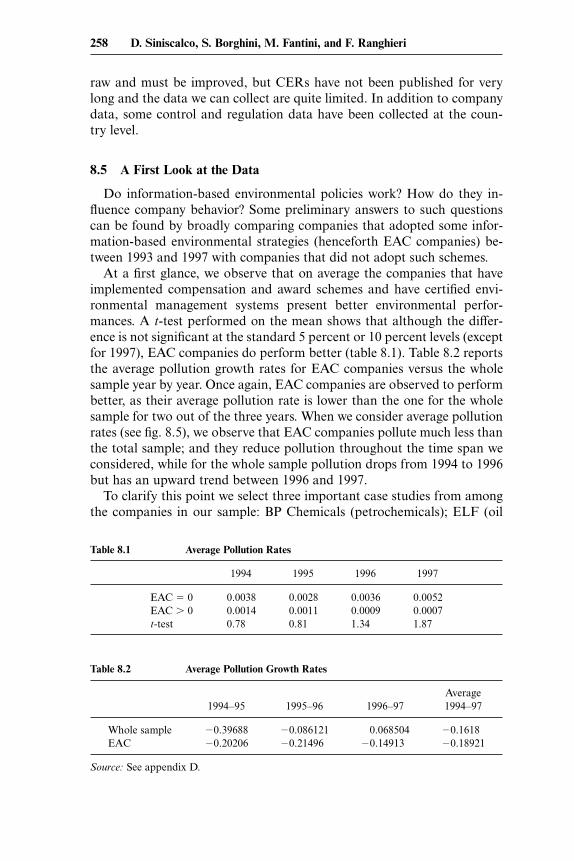
At a first glance, we observe that on average the companies that haveimplemented compensation and award schemes and have certified envi-ronmental management systems present better environmental perfor-mances. A t-test performed on the mean shows that although the differ-ence is not significant at the standard 5 percent or 10 percent levels (exceptfor 1997), EAC companies do perform better (table 8.1). Table 8.2 reportsthe average pollution growth rates for EAC companies versus the wholesample year by year. Once again, EAC companies are observed to performbetter, as their average pollution rate is lower than the one for the wholesample for two out of the three years. When we consider average pollutionrates (see fig. 8.5), we observe that EAC companies pollute much less thanthe total sample; and they reduce pollution throughout the time span weconsidered, while for the whole sample pollution drops from 1994 to 1996but has an upward trend between 1996 and 1997.
To clarify this point we select three important case studies from amongthe companies in our sample: BP Chemicals (petrochemicals); ELF (oil
Table 8.1 Average Pollution Rates
1994 1995 1996 1997
EAC � 0 0.0038 0.0028 0.0036 0.0052EAC � 0 0.0014 0.0011 0.0009 0.0007t-test 0.78 0.81 1.34 1.87
Table 8.2 Average Pollution Growth Rates
Average1994–95 1995–96 1996–97 1994–97
Whole sample �0.39688 �0.086121 0.068504 �0.1618EAC �0.20206 �0.21496 �0.14913 �0.18921
Source: See appendix D.
258 D. Siniscalco, S. Borghini, M. Fantini, and F. Ranghieri
and gas); and PowerGen (electric power generation). According to ourdatabase and the scoring system, such companies were among the first toadopt EAC in their industries and to produce the highest quality CERs.We look at their environmental performances considering their emissionsreduction rates before and after the EAC adoption. We also relate theiremissions to the quality of the environmental information produced to seewhether information quality and quantity are related to emissions re-duction.
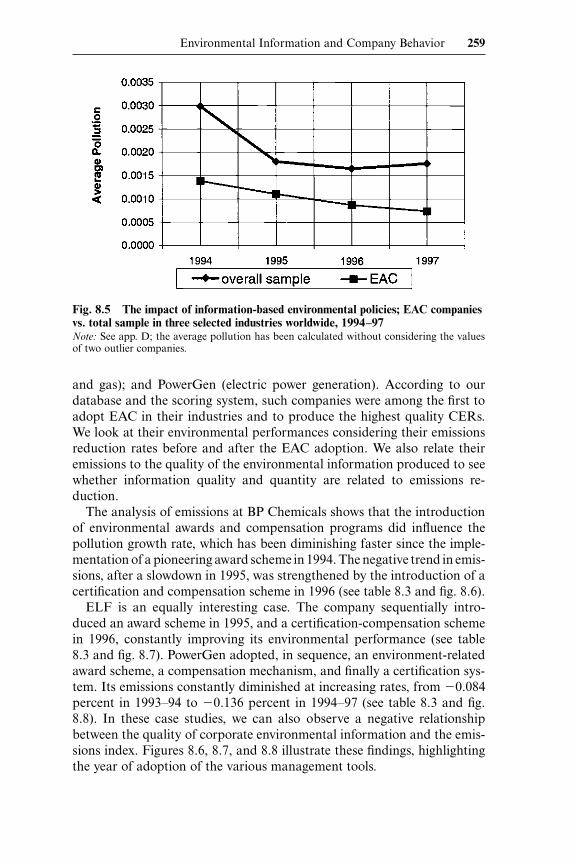
The analysis of emissions at BP Chemicals shows that the introductionof environmental awards and compensation programs did influence thepollution growth rate, which has been diminishing faster since the imple-mentation of a pioneering award scheme in 1994. The negative trend in emis-sions, after a slowdown in 1995, was strengthened by the introduction of acertification and compensation scheme in 1996 (see table 8.3 and fig. 8.6).
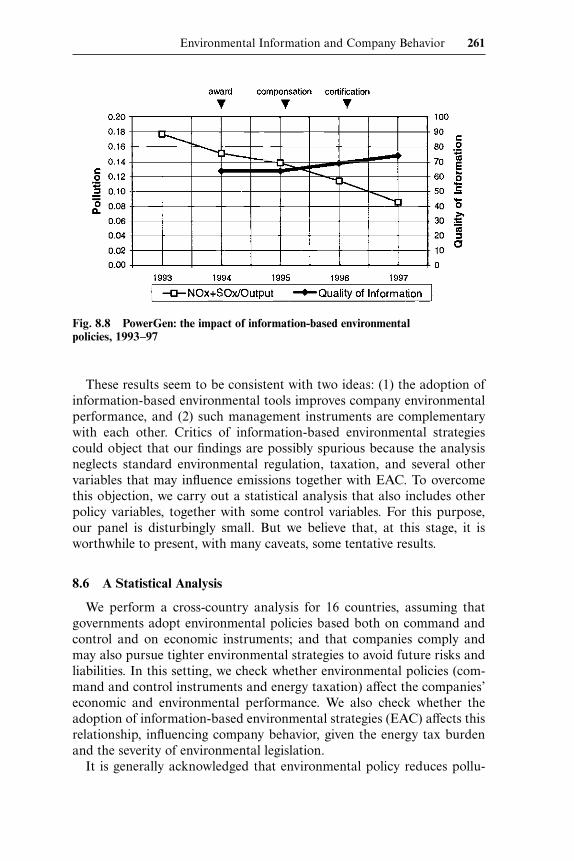
ELF is an equally interesting case. The company sequentially intro-duced an award scheme in 1995, and a certification-compensation schemein 1996, constantly improving its environmental performance (see table8.3 and fig. 8.7). PowerGen adopted, in sequence, an environment-relatedaward scheme, a compensation mechanism, and finally a certification sys-tem. Its emissions constantly diminished at increasing rates, from �0.084percent in 1993–94 to �0.136 percent in 1994–97 (see table 8.3 and fig.8.8). In these case studies, we can also observe a negative relationshipbetween the quality of corporate environmental information and the emis-sions index. Figures 8.6, 8.7, and 8.8 illustrate these findings, highlightingthe year of adoption of the various management tools.
Environmental Information and Company Behavior 259
Fig. 8.5 The impact of information-based environmental policies; EAC companiesvs. total sample in three selected industries worldwide, 1994–97Note: See app. D; the average pollution has been calculated without considering the valuesof two outlier companies.
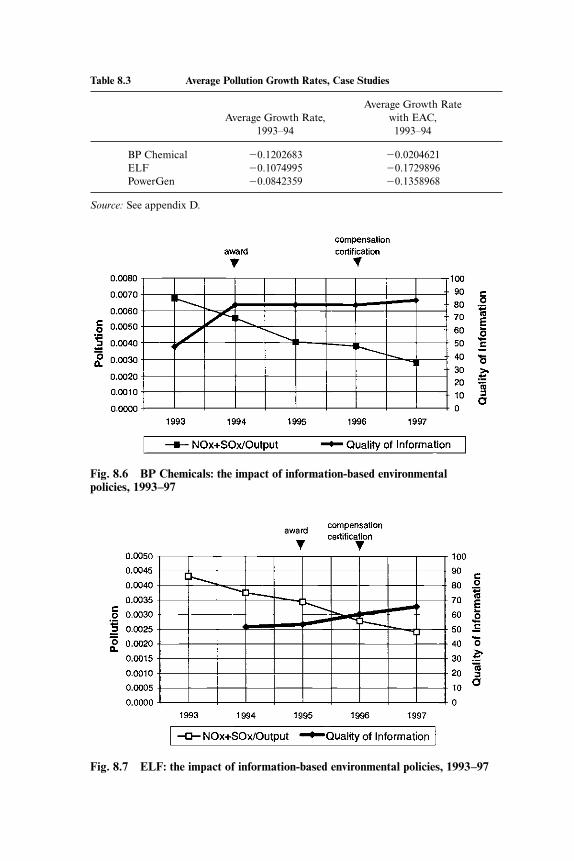
Table 8.3 Average Pollution Growth Rates, Case Studies
Average Growth RateAverage Growth Rate, with EAC,
1993–94 1993–94
BP Chemical �0.1202683 �0.0204621ELF �0.1074995 �0.1729896PowerGen �0.0842359 �0.1358968
Source: See appendix D.
Fig. 8.6 BP Chemicals: the impact of information-based environmentalpolicies, 1993–97
Fig. 8.7 ELF: the impact of information-based environmental policies, 1993–97
These results seem to be consistent with two ideas: (1) the adoption ofinformation-based environmental tools improves company environmentalperformance, and (2) such management instruments are complementarywith each other. Critics of information-based environmental strategiescould object that our findings are possibly spurious because the analysisneglects standard environmental regulation, taxation, and several othervariables that may influence emissions together with EAC. To overcomethis objection, we carry out a statistical analysis that also includes otherpolicy variables, together with some control variables. For this purpose,our panel is disturbingly small. But we believe that, at this stage, it isworthwhile to present, with many caveats, some tentative results.
8.6 A Statistical Analysis
We perform a cross-country analysis for 16 countries, assuming thatgovernments adopt environmental policies based both on command andcontrol and on economic instruments; and that companies comply andmay also pursue tighter environmental strategies to avoid future risks andliabilities. In this setting, we check whether environmental policies (com-mand and control instruments and energy taxation) affect the companies’economic and environmental performance. We also check whether theadoption of information-based environmental strategies (EAC) affects thisrelationship, influencing company behavior, given the energy tax burdenand the severity of environmental legislation.
It is generally acknowledged that environmental policy reduces pollu-
Environmental Information and Company Behavior 261
Fig. 8.8 PowerGen: the impact of information-based environmentalpolicies, 1993–97
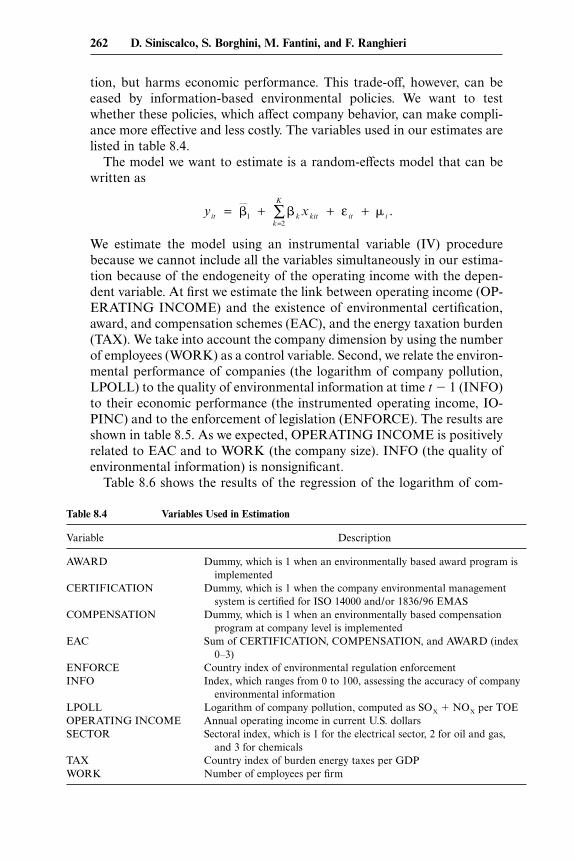
tion, but harms economic performance. This trade-off, however, can beeased by information-based environmental policies. We want to testwhether these policies, which affect company behavior, can make compli-ance more effective and less costly. The variables used in our estimates arelisted in table 8.4.
The model we want to estimate is a random-effects model that can bewritten as
y xitk
K
k kit it i= + + +=∑� � �1
2
ε .
We estimate the model using an instrumental variable (IV) procedurebecause we cannot include all the variables simultaneously in our estima-tion because of the endogeneity of the operating income with the depen-dent variable. At first we estimate the link between operating income (OP-ERATING INCOME) and the existence of environmental certification,award, and compensation schemes (EAC), and the energy taxation burden(TAX). We take into account the company dimension by using the numberof employees (WORK) as a control variable. Second, we relate the environ-mental performance of companies (the logarithm of company pollution,LPOLL) to the quality of environmental information at time t � 1 (INFO)to their economic performance (the instrumented operating income, IO-PINC) and to the enforcement of legislation (ENFORCE). The results areshown in table 8.5. As we expected, OPERATING INCOME is positivelyrelated to EAC and to WORK (the company size). INFO (the quality ofenvironmental information) is nonsignificant.
Table 8.6 shows the results of the regression of the logarithm of com-
Table 8.4 Variables Used in Estimation
Variable Description
AWARD Dummy, which is 1 when an environmentally based award program isimplemented
CERTIFICATION Dummy, which is 1 when the company environmental managementsystem is certified for ISO 14000 and/or 1836/96 EMAS
COMPENSATION Dummy, which is 1 when an environmentally based compensationprogram at company level is implemented
EAC Sum of CERTIFICATION, COMPENSATION, and AWARD (index0–3)
ENFORCE Country index of environmental regulation enforcementINFO Index, which ranges from 0 to 100, assessing the accuracy of company
environmental informationLPOLL Logarithm of company pollution, computed as SOX � NOX per TOEOPERATING INCOME Annual operating income in current U.S. dollarsSECTOR Sectoral index, which is 1 for the electrical sector, 2 for oil and gas,
and 3 for chemicalsTAX Country index of burden energy taxes per GDPWORK Number of employees per firm
262 D. Siniscalco, S. Borghini, M. Fantini, and F. Ranghieri
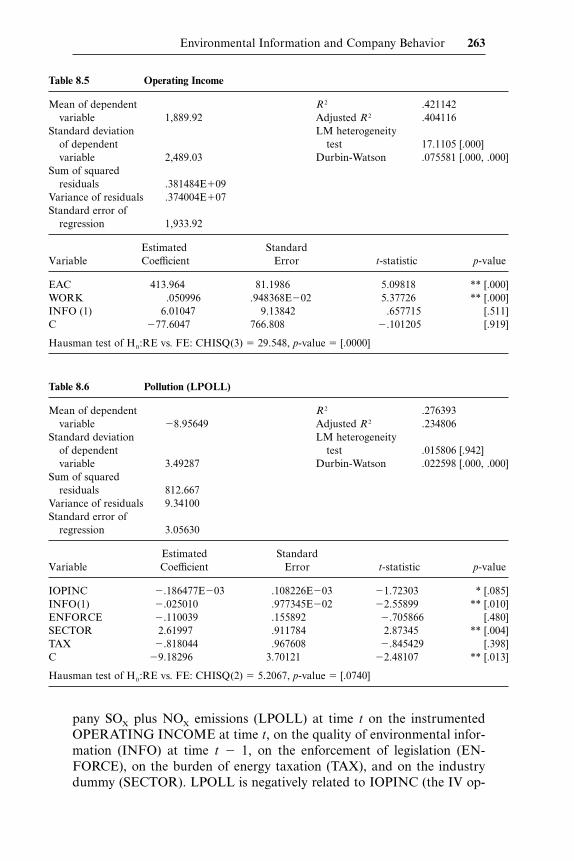
pany SOX plus NOX emissions (LPOLL) at time t on the instrumentedOPERATING INCOME at time t, on the quality of environmental infor-mation (INFO) at time t � 1, on the enforcement of legislation (EN-FORCE), on the burden of energy taxation (TAX), and on the industrydummy (SECTOR). LPOLL is negatively related to IOPINC (the IV op-
Table 8.6 Pollution (LPOLL)
Mean of dependent R2 .276393variable �8.95649 Adjusted R2 .234806
Standard deviation LM heterogeneityof dependent test .015806 [.942]variable 3.49287 Durbin-Watson .022598 [.000, .000]
Sum of squaredresiduals 812.667
Variance of residuals 9.34100Standard error of
regression 3.05630
Estimated StandardVariable Coefficient Error t-statistic p-value
IOPINC �.186477E�03 .108226E�03 �1.72303 * [.085]INFO(1) �.025010 .977345E�02 �2.55899 ** [.010]ENFORCE �.110039 .155892 �.705866 [.480]SECTOR 2.61997 .911784 2.87345 ** [.004]TAX �.818044 .967608 �.845429 [.398]C �9.18296 3.70121 �2.48107 ** [.013]
Hausman test of H0:RE vs. FE: CHISQ(2) � 5.2067, p-value � [.0740]
Table 8.5 Operating Income
Mean of dependent R2 .421142variable 1,889.92 Adjusted R2 .404116
Standard deviation LM heterogeneityof dependent test 17.1105 [.000]variable 2,489.03 Durbin-Watson .075581 [.000, .000]
Sum of squaredresiduals .381484E�09
Variance of residuals .374004E�07Standard error of
regression 1,933.92
Estimated StandardVariable Coefficient Error t-statistic p-value
EAC 413.964 81.1986 5.09818 ** [.000]WORK .050996 .948368E�02 5.37726 ** [.000]INFO (1) 6.01047 9.13842 .657715 [.511]C �77.6047 766.808 �.101205 [.919]
Hausman test of H0:RE vs. FE: CHISQ(3) � 29.548, p-value � [.0000]
Environmental Information and Company Behavior 263
erating income), which is consistent with the idea that the adoption ofEAC reduces emissions. Moreover, INFO (the quality of environmentalinformation) is negatively related with LPOLL, suggesting that manag-ers’ and employees’ efforts on environmental matters are significantly in-fluenced not only by the presence of EAC but also by the accuracy of en-vironmental information. SECTOR is positively related with LPOLL,simply reflecting the structural and technological characteristics of pro-duction in the three industries under review. Finally, the relation betweenENFORCE and LPOLL is negative, but not significant ( p � 0.480).
8.7 Concluding Remarks
Information-based environmental strategies play a significant role in oursample. Given environmental regulation, which is costly, they positivelyinfluence operating income and negatively influence pollution. Being pri-marily implementation tools, they cannot substitute for more traditionalpolicies, but can play a useful role.
Our findings are consistent with a whole class of models on environmen-tal information, incentives, and company behavior. In our panel data esti-mation, the accuracy of environmental information is negatively relatedwith pollution and the relation is significant. That is, information qualityis crucial for companies’ environmental management and there are expla-nations for corporate noncompliance that are not related to the level of thepenalties, but instead to the company’s scarcity of internal information(Brehn and Hamilton 1996).
In contrast from our results we cannot infer the role of environmentalinformation accuracy on financial performance. In our analysis, we usedoperating income as a proxy of companies’ financial health since wewanted to investigate the existing relation between environmental manage-ment tools and company results in the short period. Existing literature onenvironmental information and corporate financial performances finds asignificant relationship between these variables, but it refers to externalenvironmental information (information provided to external stakehold-ers) and to long-term performances such as shareholder value or liabilities(Tietenberg 1997; Lanoi, Laplant, and Roy, 1997; Khanna and Damon1999). These differences help in understanding the differences between ouranalysis and prior analyses.
However, generic pleas for better and wider “environmental informa-tion” or “eco-management” are too vague and may be misleading. In orderto exert a positive influence, environmental information needs to be in-tegrated with a set of incentives, as recommended by economic theoryfor any company objective. This explains the nature of many integrated en-vironmental and management schemes (such as ISO 14000 or EMAS)adopted by firms and recommended by policymakers. Our empirical
264 D. Siniscalco, S. Borghini, M. Fantini, and F. Ranghieri
model confirms the positive role of self-regulated environmental auditsand compensation programs on corporate environmental performance,and this is consistent with an emerging research field that explores thepossible patterns for integrating environmental issues with concrete man-agement systems (Sinclair-Desgagne and Gabel 1997; Pfaff and Sanchir-ico 1999).
These conclusions, of course, are just tentative, given the preliminarynature of our empirical analysis. In order to reach more robust conclu-sions, better data must be collected and better estimates must be carriedout. But the preliminary results we have obtained so far seem to be consis-tent with economic theory and with common sense.
Environmental Information and Company Behavior 265
Tabl
e8A
.1L
ist
ofth
eC
ompa
nies
Fir
stY
ear
ofF
irst
Yea
rof
Fir
stY
ear
ofE
MA
SIS
OA
war
dF
irst
Yea
rof
CE
R14
000
Sche
me
Com
pens
atio
nC
ompa
nySe
ctor
aC
ount
ryb
Pub
licat
ion
Impl
emen
tati
onA
dopt
ion
Pro
gram
Ado
ptio
n
Agi
pO
GIT
1995
1998
1994
1996
Agi
pP
etro
liO
GIT
1993
n.i.
1994
1996
AP
SO
GU
S19
94n.
i.19
9419
96B
ayer
Ital
iaC
IT19
9419
9619
9419
95B
riti
shG
asO
GU
Kbe
fore
1993
n.a.
n.a.
n.a.
Bri
tish
Pet
role
um(B
P)
OG
UK
befo
re19
9319
9619
9419
96B
PC
hem
ical
CU
Kbe
fore
1993
1996
1994
1996
CIB
AC
CH
befo
re19
9319
9519
9419
95C
onoc
oO
GU
S19
9319
9819
9419
95D
ong
OG
DK
1994
n.i.
n.i.
n.i.
Edi
son
EIT
1994
n.i.
1998
1998
Ene
lE
IT19
9519
9819
9419
97E
niO
GIT
1995
1998
n.i.
n.i.
Exx
onO
GU
S19
9519
9819
94n.
a.E
LF
OG
FR
1994
1996
1995
1996
Esk
omO
GSA
1994
n.i.
1995
n.a.
Ivo
EF
L19
9619
97n.
a.n.
a.M
obil
OG
US
1995
1996
1995
1996
Nat
iona
lPow
erE
UK
1994
1995
n.a.
n.a.
App
endi
xA
Nes
teO
GF
Lbe
fore
1993
1997
1997
1996
Nes
teC
hem
ical
sC
FL
befo
re19
9319
9719
97n.
a.N
orsk
Hyd
roO
GF
L19
9519
9519
95n.
a.N
ovo
Nor
disk
CD
K19
9319
98n.
a.n.
a.O
ntar
ioH
ydro
EU
S19
9419
9719
95n.
a.P
etro
fina
Dow
nstr
eam
OG
BE
1994
1997
1995
n.i.
Pac
ific
Gas
and
Ele
ctri
cO
GU
S19
9519
9619
94n.
a.Po
wer
Gen
EU
K19
9419
9619
9419
95R
epso
lO
GSP
1996
n.i.
n.a.
n.a.
Roy
alD
utch
/She
llG
roup
Dow
nstr
eam
OG
UK
1996
1996
1996
n.i.
Shel
lInt
erna
tion
alE
xplo
rati
onan
dP
rodu
ctio
nB
.V.
OG
NL
1996
1997
1996
n.a.
Shel
lChe
mic
als
CU
K19
9419
9719
96n.
a.Sh
ellU
KO
GU
K19
9319
9719
96n.
a.Sn
amT
rans
port
OG
IT19
93n.
i.n.
i.n.
i.Sn
amG
asO
GIT
1993
n.i.
n.i.
1996
Solv
ayC
BE
1994
1996
1995
n.a.
Stat
oil
OG
NO
1993
n.i.
1995
n.i.
Tep
coE
JA19
94n.
a.n.
a.n.
a.T
exac
oO
GU
S19
94n.
i.19
9619
97
Sou
rce:
ER
M(1
999)
.N
ote:
n.a.
�no
tav
aila
ble.
n.i.�
not
impl
emen
ted.
aC
�ch
emic
als;
E�
elec
tric
alpo
wer
gene
rati
on;O
G�
oila
ndga
s.bB
E�
Bel
gium
;C
H�
Chi
na;
DK
�D
enm
ark;
FL�
Fin
land
;FR
�F
ranc
e;IT
�It
aly;
JA�
Japa
n;N
L�
Net
herl
ands
;N
O�
Nor
way
;SA
�So
uth
Afr
ica;
SP�
Spai
n;U
K�
Uni
ted
Kin
gdom
;US�
Uni
ted
Stat
es.
Appendix B
Forum on Environmental Reporting Guidelines
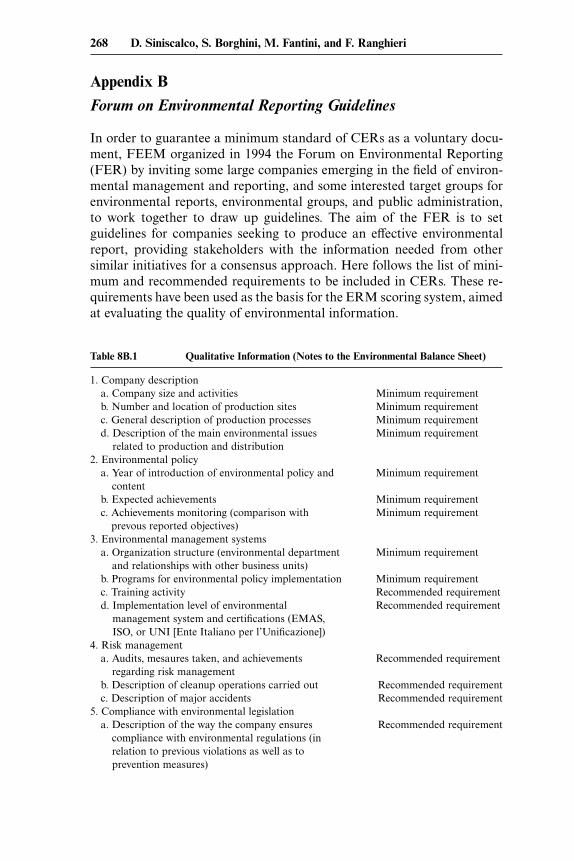
In order to guarantee a minimum standard of CERs as a voluntary docu-ment, FEEM organized in 1994 the Forum on Environmental Reporting(FER) by inviting some large companies emerging in the field of environ-mental management and reporting, and some interested target groups forenvironmental reports, environmental groups, and public administration,to work together to draw up guidelines. The aim of the FER is to setguidelines for companies seeking to produce an effective environmentalreport, providing stakeholders with the information needed from othersimilar initiatives for a consensus approach. Here follows the list of mini-mum and recommended requirements to be included in CERs. These re-quirements have been used as the basis for the ERM scoring system, aimedat evaluating the quality of environmental information.
Table 8B.1 Qualitative Information (Notes to the Environmental Balance Sheet)
1. Company descriptiona. Company size and activities Minimum requirementb. Number and location of production sites Minimum requirementc. General description of production processes Minimum requirementd. Description of the main environmental issues Minimum requirement
related to production and distribution2. Environmental policy
a. Year of introduction of environmental policy and Minimum requirementcontent
b. Expected achievements Minimum requirementc. Achievements monitoring (comparison with Minimum requirement
prevous reported objectives)3. Environmental management systems
a. Organization structure (environmental department Minimum requirementand relationships with other business units)
b. Programs for environmental policy implementation Minimum requirementc. Training activity Recommended requirementd. Implementation level of environmental Recommended requirement
management system and certifications (EMAS,ISO, or UNI [Ente Italiano per l’Unificazione])
4. Risk managementa. Audits, mesaures taken, and achievements Recommended requirement
regarding risk managementb. Description of cleanup operations carried out Recommended requirementc. Description of major accidents Recommended requirement
5. Compliance with environmental legislationa. Description of the way the company ensures Recommended requirement
compliance with environmental regulations (inrelation to previous violations as well as toprevention measures)
268 D. Siniscalco, S. Borghini, M. Fantini, and F. Ranghieri
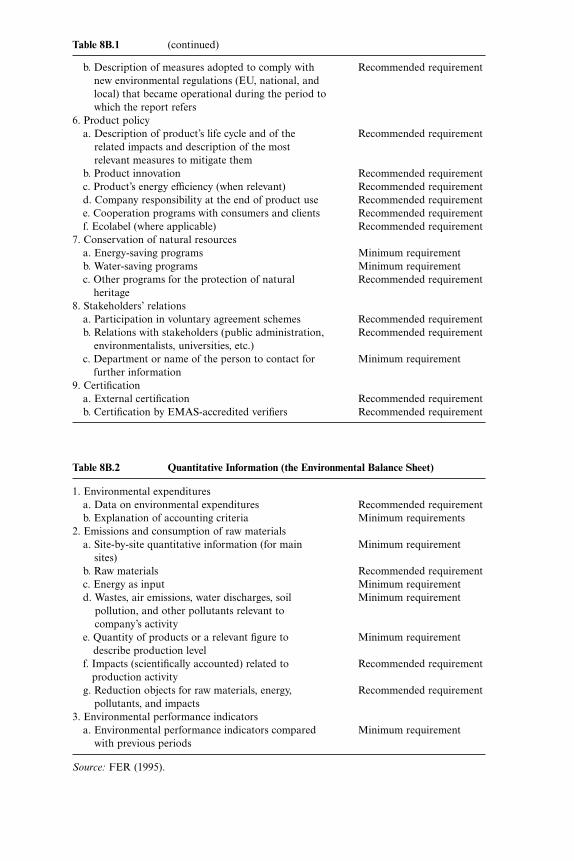
Table 8B.1 (continued)
b. Description of measures adopted to comply with Recommended requirementnew environmental regulations (EU, national, andlocal) that became operational during the period towhich the report refers
6. Product policya. Description of product’s life cycle and of the Recommended requirement
related impacts and description of the mostrelevant measures to mitigate them
b. Product innovation Recommended requirementc. Product’s energy efficiency (when relevant) Recommended requirementd. Company responsibility at the end of product use Recommended requiremente. Cooperation programs with consumers and clients Recommended requirementf. Ecolabel (where applicable) Recommended requirement
7. Conservation of natural resourcesa. Energy-saving programs Minimum requirementb. Water-saving programs Minimum requirementc. Other programs for the protection of natural Recommended requirement
heritage8. Stakeholders’ relations
a. Participation in voluntary agreement schemes Recommended requirementb. Relations with stakeholders (public administration, Recommended requirement
environmentalists, universities, etc.)c. Department or name of the person to contact for Minimum requirement
further information9. Certification
a. External certification Recommended requirementb. Certification by EMAS-accredited verifiers Recommended requirement
Table 8B.2 Quantitative Information (the Environmental Balance Sheet)
1. Environmental expendituresa. Data on environmental expenditures Recommended requirementb. Explanation of accounting criteria Minimum requirements
2. Emissions and consumption of raw materialsa. Site-by-site quantitative information (for main Minimum requirement
sites)b. Raw materials Recommended requirementc. Energy as input Minimum requirementd. Wastes, air emissions, water discharges, soil Minimum requirement
pollution, and other pollutants relevant tocompany’s activity
e. Quantity of products or a relevant figure to Minimum requirementdescribe production level
f. Impacts (scientifically accounted) related to Recommended requirementproduction activity
g. Reduction objects for raw materials, energy, Recommended requirementpollutants, and impacts
3. Environmental performance indicatorsa. Environmental performance indicators compared Minimum requirement
with previous periods
Source: FER (1995).
Appendix C
Environmental Reporting Monitor (ERM)
Starting from the Forum on Environmental Reporting (FER) guidelinesthe FEEM has set up an Environmental Reporting Monitor (ERM) defin-ing a three-section checklist as a scoring system. The first two sectionsrepresent of the two parts of the report: the first section checks for thequalitative information, the second one for the quantitative information,following the FER requirements (see FER 1995, app. 3); the third one isthe comments section, explained here. The structure of the checklist isas follows:
● Qualitative section: It verifies that four minimum requirements andeleven recommended requirements are met. The score—the reportcan receive from 0 to 2 points for every minimum requirement metand from 0 to 1 for every recommended requirement met.
● Quantitative section: It verifies that nine minimum requirements andfive recommended requirements are respected. The score—the reportcan receive from 0 to 2 points for every minimum requirement re-spected and from 0 to 1 for every recommended requirement re-spected.
● Comment: First, it checks that the CER structure complies with theFER guidelines. Then, it checks whether the report is complete. Thescore for data quantity—if it is exhaustive it receives 2 points, if me-dium 1 point, if it is not enough 0 points. The score for data quality—whether the CER refers to a sample, whether the report maker useda specific methodology for CER data collection, and whether an audithas been implemented to check the data from 0 to 2 points. Then itchecks report legibility (from 0 to 2 points), and it verifies whetherthe report gives other information and whether there is a positive evo-lution in act from the last reports to the present one (if yes, 1 point).
Each CER can receive up to 19 points in the qualitative section, 23 pointsin the quantitative section, and 16 points in the comments section. Themaximum score is 58 points. For this paper, each score has been nor-malized.
270 D. Siniscalco, S. Borghini, M. Fantini, and F. Ranghieri
Tabl
e8D
.1F
EE
MC
ompa
nyD
atab
ase
Qua
lity
ofO
pera
ting
Inco
me
NO
X�
SOX
per
Com
pany
Sect
ora
Cou
ntry
bY
ear
Info
rmat
ion
(mill
ions
ofdo
llars
)U
nit
Out
putc
Azi
enda
Ele
ttri
caM
ilane
seE
ITA
1993
n.a.
76.0
810.
0000
8686
0519
94n.
a.75
.013
0.00
0078
2558
1995
n.a.
79.8
630.
0000
5197
6719
96n.
a.10
3.37
30.
0000
5348
8419
9779
.31
107.
974
0.00
0055
4651
Agi
pO
GIT
A19
93n.
a.1,
884.
633
0.00
0000
1634
1994
n.a.
2,33
2.91
70.
0000
0014
9019
9558
.62
2,48
7.96
70.
0000
0017
2019
9663
.79
3,27
2.92
60.
0000
0012
2019
9782
.76
2,94
4.33
80.
0000
0011
92A
gip
Pet
roli
OG
ITA
1993
77.5
934
7.32
80.
0049
6432
9819
9481
.03
377.
858
0.00
4494
0935
1995
81.0
324
6.15
70.
0041
5048
8719
9684
.48
563.
851
0.00
3979
0576
1997
87.9
365
4.03
60.
0041
1954
17A
PS
OG
USA
1993
n.a.
21.8
440.
0000
3204
4019
9460
.34
32.9
410.
0000
3151
6019
9560
.34
24.1
390.
0000
2306
9519
9667
.24
3.83
90.
0000
2164
4219
9767
.24
�46
.566
0.00
0022
2777
Bay
erIt
alia
CIT
A19
93n.
a.27
.828
0.00
0192
7980
1994
51.7
255
.841
0.00
0200
4310
1995
55.1
70.
614
0.00
0183
1091
1996
58.6
215
.554
0.00
0192
9390
1997
67.2
411
.155
0.00
0144
2700
App
endi
xD
(con
tinu
ed)
Bri
tish
Gas
OG
UK
1993
60.3
421
9.31
30.
0264
3023
2619
9465
.52
1,13
4.20
60.
0386
5116
2819
9567
.24
646.
481
0.00
1178
2100
1996
67.2
41,
288.
052
0.00
0241
7087
1997
81.0
31,
965.
630
0.00
0097
1710
Bri
tish
Pet
role
um(B
P)
OG
UK
1993
81.0
33,
653.
153
0.00
1008
1561
1994
81.0
33,
785.
397
0.00
1129
4054
1995
82.7
64,
034.
091
0.00
1078
2359
1996
82.7
65,
804.
255
0.00
1077
7591
1997
82.7
66,
203.
075
0.00
1061
4843
BP
Che
mic
alC
UK
1993
46.5
5�
102.
071
0.00
6742
0907
1994
79.3
138
5.73
40.
0055
0336
0919
9579
.31
1,34
7.85
40.
0040
5751
3219
9679
.31
743.
494
0.00
3801
0450
1997
82.7
679
3.41
70.
0027
9122
49C
IBA
CC
H19
9353
.45
n.a.
0.00
3066
9894
1994
53.4
51,
598.
999
0.00
3539
7271
1995
51.7
22,
000.
381
0.00
2511
8727
1996
62.0
72,
579.
498
0.00
1620
2434
1997
62.0
71,
650.
181
0.00
1620
4986
Con
oco
OG
USA
1993
48.2
81,
149.
000
0.00
1513
3333
1994
51.7
21,
096.
000
0.00
1446
0741
1995
56.9
01,
257.
000
0.00
1378
8148
1996
56.9
01,
887.
000
0.00
1345
1852
1997
65.5
22,
003.
000
0.00
1277
9259
Don
gO
GD
K19
93n.
a.14
7.22
00.
0000
0002
7319
94n.
a.14
5.67
30.
0000
0002
6019
9579
.31
179.
804
0.00
0000
0275
Tabl
e8D
.1(c
onti
nued
)
Qua
lity
ofO
pera
ting
Inco
me
NO
X�
SOX
per
Com
pany
Sect
ora
Cou
ntry
bY
ear
Info
rmat
ion
(mill
ions
ofdo
llars
)U
nit
Out
putc
1996
81.0
323
8.03
00.
0000
0002
5119
9781
.03
318.
421
0.00
0000
0206
Edi
son
EIT
A19
93n.
a.22
5.80
00.
0000
0505
7619
9460
.34
267.
100
0.00
0003
5840
1995
60.3
426
9.80
00.
0000
0447
6319
9660
.34
403.
121
0.00
0001
5552
1997
68.9
756
5.38
30.
0000
0155
97E
nel
EIT
A19
93n.
a.3,
672.
392
0.00
0075
0148
1994
n.a.
4,87
5.38
70.
0000
7303
4919
9553
.45
5,13
0.62
60.
0000
6879
0619
9684
.48
5,33
7.46
10.
0000
6600
1919
9786
.21
5,10
1.30
80.
0000
5915
48E
niO
GIT
A19
93n.
a.3,
631.
924
0.00
0012
4362
1994
n.a.
4,61
1.85
50.
0000
1130
4319
9579
.31
6,31
7.82
70.
0000
0819
0019
9670
.69
6,22
4.39
20.
0000
0764
0519
9779
.31
6,07
4.78
90.
0000
0710
72E
xxon
OG
USA
1993
n.a.
7,65
5.00
00.
0002
5300
0019
94n.
a.8,
390.
000
0.00
0183
0000
1995
70.6
97,
897.
000
0.00
0171
5000
1996
74.1
410
,185
.000
0.00
0178
0000
1997
n.a.
11,9
16.0
00n.
a.E
LF
OG
FR
A19
93n.
a.1,
132.
602
0.00
4314
6603
1994
51.7
221
0.51
20.
0037
5271
1519
9553
.45
3,55
0.08
60.
0034
3687
3719
9660
.34
4,73
3.26
00.
0027
8704
6119
9765
.52
3,86
2.26
20.
0023
5063
66E
skom
OG
SA19
93n.
a.n.
a.0.
0001
2934
9719
9431
.03
1,00
2.39
80.
0001
2687
5219
9563
.79
1,03
1.83
60.
0001
2704
8219
9677
.59
1,36
0.63
60.
0001
2625
5319
9779
.31
1,39
6.68
20.
0001
2822
14(c
onti
nued
)
Ivo
EF
L19
93n.
a.53
1.13
80.
0000
6975
0019
94n.
a.53
1.13
80.
0000
7740
0019
95n.
a.53
1.13
80.
0000
5310
0019
9674
.14
531.
138
0.00
0012
3407
1997
84.4
853
1.13
80.
0000
0830
56M
obil
OG
USA
1993
n.a.
1,48
8.00
00.
0014
5925
9319
94n.
a.2,
224.
000
0.00
1348
1481
1995
51.7
22,
231.
000
0.00
1177
7778
1996
58.6
22,
846.
000
0.00
1185
1852
1997
67.2
43,
097.
000
0.00
1148
1481
Nat
iona
lPow
erE
UK
1993
n.a.
899.
129
0.00
0178
2162
1994
72.4
11,
123.
527
0.00
0147
0563
1995
75.8
61,
213.
699
0.00
0105
6091
1996
79.3
11,
282.
372
0.00
0081
2075
1997
79.3
11,
242.
582
0.00
0072
7480
Nes
teO
GF
L19
9374
.14
94.3
940.
0011
7927
4719
9474
.14
430.
820
0.00
1060
2409
1995
82.7
649
1.01
10.
0010
7336
8019
9682
.76
234.
866
0.00
0889
5546
1997
86.2
131
1.51
60.
0009
2964
48N
este
Che
mic
als
CF
L19
9374
.14
n.a.
0.00
0822
4736
1994
74.1
4n.
a.0.
0000
8939
3919
9582
.76
n.a.
0.00
0078
9130
1996
82.7
6n.
a.0.
0000
9692
3119
9786
.21
n.a.
0.00
0093
8043
Nor
skH
ydro
OG
FL
1993
n.a.
553.
425
0.00
0325
4156
1994
n.a.
1,01
3.46
20.
0003
6420
3919
9558
.62
1,68
9.12
70.
0003
9375
69
Tabl
e8D
.1(c
onti
nued
)
Qua
lity
ofO
pera
ting
Inco
me
NO
X�
SOX
per
Com
pany
Sect
ora
Cou
ntry
bY
ear
Info
rmat
ion
(mill
ions
ofdo
llars
)U
nit
Out
putc
1996
79.3
11,
494.
907
0.00
0372
7004
1997
82.7
61,
511.
138
0.00
0411
1197
Nov
oN
ordi
skC
DK
1993
82.7
626
9.82
40.
0382
8711
2619
9481
.03
341.
195
0.03
7040
0000
1995
81.0
337
2.80
80.
0351
5007
9019
9684
.48
428.
971
0.03
6707
8825
1997
86.2
146
0.22
80.
0388
9789
30O
ntar
ioH
ydro
EU
SA19
93n.
a.6,
569.
258
0.00
0011
3953
1994
56.9
06,
586.
616
0.00
0011
1628
1995
56.9
06,
554.
463
0.00
0008
7209
1996
65.5
26,
516.
096
0.00
0010
2326
1997
81.0
36,
449.
165
0.00
0014
7674
Pet
rofin
aD
owns
trea
mO
GB
EL
1993
n.a.
243.
130.
0017
0000
0019
9453
.45
134.
490.
0015
5000
0019
9567
.24
7.97
0.00
1400
0000
1996
67.2
416
7.69
0.00
1330
0000
1997
n.a.
n.a.
n.a.
Pac
ific
Gas
and
Ele
ctri
cO
GU
SA19
93n.
a.2,
560.
000
0.00
0009
3440
1994
n.a.
2,42
4.00
00.
0000
0897
4419
9556
.90
2,76
3.00
00.
0000
0765
4719
9656
.90
1,89
6.00
00.
0000
0739
0719
9763
.79
1,83
1.00
00.
0000
0633
49Po
wer
Gen
EU
K19
93n.
a.67
8.47
50.
0000
0193
2519
9463
.79
742.
385
0.00
0001
7697
1995
63.7
986
0.16
40.
0000
0151
2819
9668
.97
1,08
2.44
00.
0000
0138
4919
9774
.14
836.
334
0.00
0001
1418
Rep
sol
OG
SPA
1993
n.a.
1,32
0.22
3881
n.a.
1994
n.a.
1,70
4.12
1893
n.a.
1995
n.a.
1,56
7.56
1168
n.a.
1996
56.9
01,
116.
1202
190.
0020
6564
4119
9770
.69
36,1
89.8
0806
0.00
2072
1761
(con
tinu
ed)
Roy
alD
utch
/She
llG
roup
OG
UK
1993
n.a.
8,92
5n.
a.D
owns
trea
m19
94n.
a.9,
600
n.a.
1995
n.a.
12,4
76n.
a.19
9670
.69
17,1
280.
0000
0090
1219
9779
.31
15,9
650.
0000
0080
82Sh
ellI
nter
nati
onal
OG
NL
1993
n.a.
n.a.
n.a.
Exp
lora
tion
and
1994
n.a.
n.a.
n.a.
Pro
duct
ion
B.V
.19
95n.
a.n.
a.n.
a.19
9658
.62
17,1
280.
0000
0078
0319
9781
.03
15,9
650.
0000
0098
30Sh
ellC
hem
ical
sC
UK
1993
n.a.
n.a.
0.00
0012
8333
1994
68.9
7n.
a.0.
0000
1031
5819
9572
.41
n.a.
0.00
0009
1000
1996
72.4
1n.
a.0.
0000
0713
6419
9777
.59
n.a.
0.00
0006
5417
Shel
lUK
OG
UK
1993
44.8
3n.
a.0.
0028
3615
8219
9451
.72
n.a.
0.00
2458
3333
1995
75.8
6n.
a.0.
0022
2352
9419
9677
.59
n.a.
0.00
2137
1429
1997
77.5
9n.
a.0.
0020
3409
09Sn
amT
rans
port
OG
ITA
1993
67.2
41,
919.
604
0.00
0983
219
9472
.41
1,92
0.93
40.
0008
121
1995
77.5
92,
039.
850
0.00
0746
519
9681
.03
2,54
7.69
70.
0007
154
1997
89.6
62,
287.
953
0.00
0598
9
Tabl
e8D
.1(c
onti
nued
)
Qua
lity
ofO
pera
ting
Inco
me
NO
X�
SOX
per
Com
pany
Sect
ora
Cou
ntry
bY
ear
Info
rmat
ion
(mill
ions
ofdo
llars
)U
nit
Out
putc
Snam
Gas
OG
ITA
1993
67.2
41,
919.
604
0.00
0000
0888
1994
72.4
11,
920.
934
0.00
0000
0838
1995
77.5
92,
039.
850
0.00
0000
1016
1996
81.0
32,
547.
697
0.00
0000
0925
1997
89.6
62,
287.
953
0.00
0000
0608
Solv
ayC
BE
L19
93n.
a.35
.948
0.00
3672
7024
1994
58.6
229
3.36
40.
0027
4161
7819
9558
.62
426.
870
0.00
2701
1023
1996
79.3
138
2.96
80.
0026
3380
2819
9779
.31
466.
578
0.00
2582
6133
Stat
oil
OG
NO
R19
9379
.31
1,75
2.04
40.
0002
4576
1519
9479
.31
2,00
3.19
40.
0001
8252
2419
9579
.31
2,14
5.81
10.
0002
1887
6119
9675
.86
2,82
3.79
80.
0001
9283
9819
9775
.86
2,25
6.64
80.
0002
0833
22T
epco
OG
J19
93n.
a.1,
437.
950.
0000
0988
3719
9472
.41
2,04
7.87
0.00
0010
2326
1995
79.3
11,
781.
780.
0000
0918
6019
9679
.31
1,30
9.73
0.00
0007
7907
1997
79.3
11,
795.
960.
0000
0720
93T
exac
oO
GU
SA19
93n.
a.93
8.00
00.
0005
1823
7319
9460
.34
758.
000
0.00
0363
4330
1995
65.5
256
7.00
00.
0002
3088
0219
9668
.97
1605
0.00
0235
0000
1997
70.6
919
870.
0002
0548
86
Sou
rce:
ER
M(1
999)
.N
ote:
n.a.
�no
tav
aila
ble.
aC
�ch
emic
als;
E�
elec
tric
alpo
wer
gene
rati
on;O
G�
oila
ndga
s.bSe
eno
teb
tota
ble
8A.1
.c O
urca
lcul
atio
nfr
omda
tapu
blis
hed
inC
ER
s.
References
Brehn, J., and J. T. Hamilton. 1996. Non compliance in environmental reporting:Are violators ignorant or evasive of the law? American Journal of Political Sci-ence 40 (2): 444–77.
Environmental Reporting Monitor (ERM). 1999. Database and analysis from 1995.Milan: Fondazione Eni Enrico Mattei.
Forum on Environmental Reporting (FER). 1995. Corporate environmental re-porting guidelines. Milan: Fondazione Eni Enrico Mattei.
Khanna, M., and L. Damon. 1999. EPA’s voluntary 33/50 program: Impact ontoxic releases and economic performance of firms. Journal of Environmental Eco-nomics and Management 37 (1): 1–2.
Lanoi, P., B. Laplant, and M. Roy. 1997. Can capital markets create incentives forpollution control? Policy Research Working Paper no. 1753. Washington, D.C.:Environment, Infrastructure and Agriculture Division, World Bank.
McIntosh, M., D. Leipziger, K. Jones, and G. Coleman. 1998. Corporate citizen-ship. London: FT Pitman.
Musu, I., and D. Siniscalco. 1993. Ambiente e contabilita nazionale. Bologna: IlMulino.
Pendergast, C. 1999. The provision of incentives in firms. Journal of Economic Lit-erature 37:7–63.
Pfaff, A. S., and C. W. Sanchirico. 1999. Environmental self-auditing: Setting theproper incentives for discovery and correction of environmental harm. Colum-bia University School of International and Public Affairs. Working paper.
Sinclair-Desgagne, B., and L. Gabel. 1997. Environmental auditing in manage-ment systems and public policy. Journal of Environmental Economics and Man-agement 33:331–46.
Tietenberg, T. 1997. Information strategies for pollution control. Paper presentedat the eighth annual European Association of Environmental and ResourceEconomists conference, Tilburg University, The Netherlands, 26–28 June.
Comment Kevin Hassett
It is all too often the case in economics that researchers spend far moretime devising elaborate methods to tease answers from existing data setsthan they do performing the heavy lifting required to develop new datasources. This paper is a refreshing contrast. The authors have built a fasci-nating database that will be an invaluable resource to future researchers,who will likely be able to shed new light on a number of interesting ques-tions with these new data.
When I teach econometrics to graduate students, I always try to empha-size the potentially large benefits from developing new data: One can oftenlearn a great deal with a simple inspection of sample means. If I have acriticism of this paper, it is that the authors have taken this point a little
Kevin Hassett is a resident scholar at the American Enterprise Institute.
278 D. Siniscalco, S. Borghini, M. Fantini, and F. Ranghieri
bit too literally. After developing their new data, they seem to have runout of gas, providing only a cursory set of simple regressions that are verypoorly documented. Clearly, much work is left to be done, and readersmight better spend their time staring at the individual observations pre-sented in the appendixes than reading the empirical section carefully.
Now for the details. Many economists have long feared that managershave little incentive to worry too much about how much pollution theirfirm produces. Cutting back pollution is costly, and since managers’ com-pensation depends on near-term profits, there is little incentive to be tooaggressive. Costs from pollution are often long term, and the manager willbe floating on his yacht in the Mediterranean by the time the firm has topay for the damages its pollution has caused.
Regulators, and to some extent firms, have recognized this problem,and a number of complementary approaches have been adopted to over-come it. Recognizing that shining a light on pollution as it occurs mightincrease incentives to internalize long-run costs, the European Commis-sion adopted the EMAS (Eco Management Audit Scheme), which recom-mends a method for evaluating the environmental performance of a firm.In addition, many firms have begun to increase executive compensationwhen particular environmental targets are met by management. The ques-tion is, are these measures effective? Does pollution go down when thepolicies are adopted?
Ex ante, there is no reason to believe that they would be effective. Infor-mation concerning effluents that is supplied voluntarily might be very un-reliable. Managers may enjoy receiving bonuses for green behavior, but themonetary rewards of high profits are significant, and one might expectthem to dwarf the bonuses associated with environmental performance.
To address the question, the authors constructed a database from firmenvironmental reports published from 1993 to 1997. They selected asample that includes all the companies belonging to three polluting indus-tries: petrochemicals, oil and gas, and electric power generation. The finalsample consists of 39 firms based in 16 countries. The authors first showthat firms that adopt reward schemes have slightly better environmentalperformance, although the difference is not statistically significant. Pollu-tion decreases over time faster for firms that have incentive programs aswell, but again the evidence is fairly weak.
The authors then perform a statistical analysis that proceeds in twosteps. They show that operating income is higher for firms that have envi-ronmental compensation programs, and then show that pollution is lowerfor firms that have better environmental reports.
It is at the estimation stage that the work starts to have problems. It isnot clear to me what the authors are attempting to establish by running aregression with a limited number of variables to predict operating income.None of the variables is scaled or, as far as I can tell, deflated, so that
Environmental Information and Company Behavior 279
strong trends in the data (or swings in exchange rates) could be determin-ing the results. A sign that trouble is afoot is the Durbin-Watson, which isvery close to zero. With very strong trends in the data, there is almostcertainly a spurious regression problem, and the t-statistics are essentiallymeaningless. So do these programs affect environmental performance?Should governments everywhere start to require better environmental au-dits and green compensation packages? It is impossible to say given whathas been done here because the empirical work is incomplete.
A more thorough empirical analysis of the data here will be quite prom-ising. A good place to start would be to perform some simple difference-in-difference comparisons that build on the work presented in table 8.2.Clever use of this technique should overcome the biggest empirical prob-lem here: Firms that adopt programs might have a strong taste for environ-mental reform, and this unobserved heterogeneity might make it look likethe program is effective, when in fact the program is only a signal of thefirm’s underlying preferences toward pollution.
Despite these criticisms, I enjoyed the paper very much. The authorshave provided the profession an invaluable service in constructing the dataset (and carefully describing the programs), and they should be com-mended for printing the entire data set in the appendixes.
280 D. Siniscalco, S. Borghini, M. Fantini, and F. Ranghieri