Embed Size (px)
DESCRIPTION
baout biomass
Citation preview

BBIIOOmmaassss EENNEERRGGYY
SSttuuddeenntt HHaannddbbooookk aanndd AAccttiivviittyy BBooookk
TTaabbllee ooff CCoonntteennttss
11.. WWhhaatt iiss EEnneerrggyy??
22.. FFoorrmmss ooff EEnneerrggyy
33.. WWhhaatt iiss EEnneerrggyy??//FFoorrmmss ooff EEnneerrggyy ((AAccttiivviittyy 11))
44.. TThhee TTrraannssffeerr ooff EEnneerrggyy
55.. SSoouurrcceess ooff EEnneerrggyy
66.. RReenneewwaabbllee oorr NNoonnrreenneewwaabbllee?? ((AAccttiivviittyy 22))
77.. WWhhaatt iiss BBiioommaassss??
88.. UUssiinngg EEnneerrggyy FFrroomm BBiioommaassss
9. PPrroodduucciinngg EEnneerrggyy ffrroomm BBiioommaassss ((AAccttiivviittyy 33))
2
33
44
55
77
88
99
1122
1133
1155
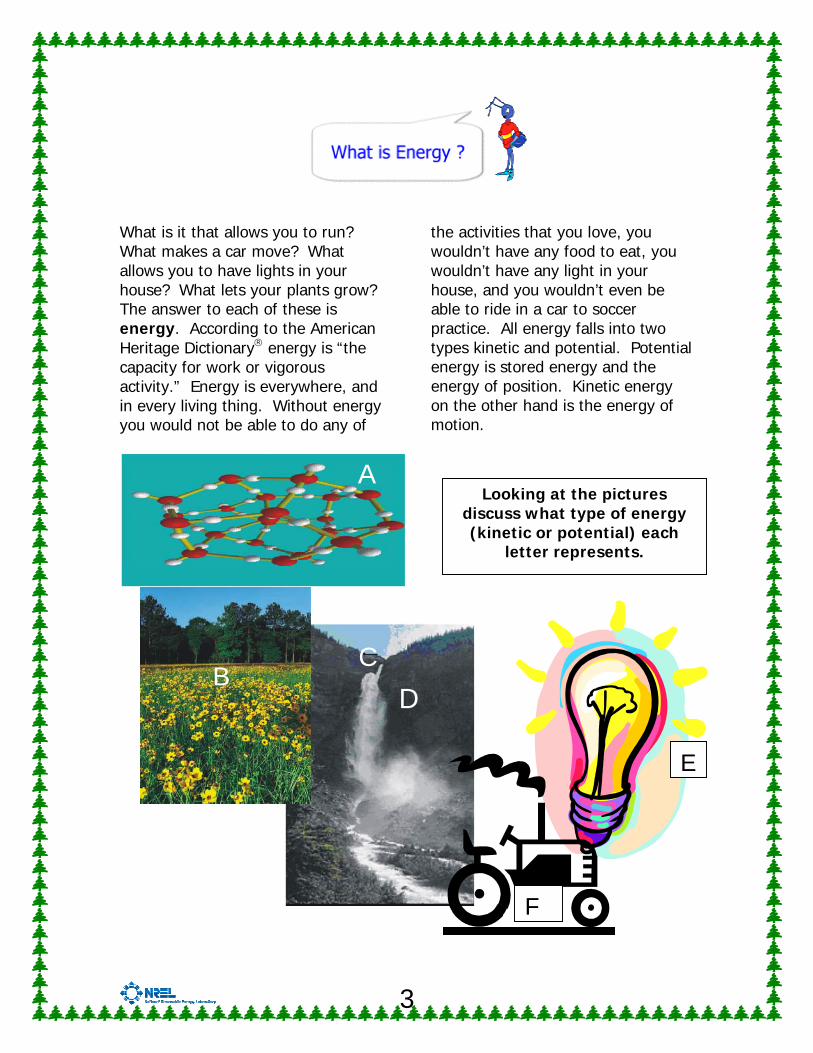
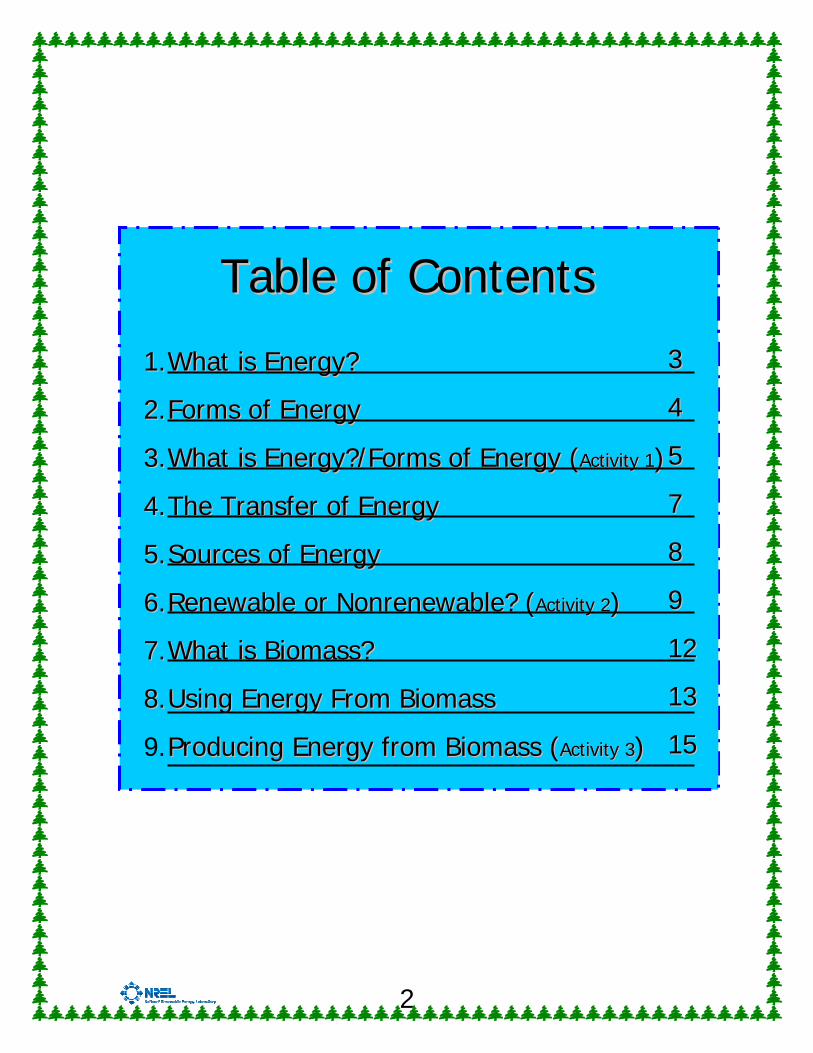
What is it that allows you to run? What makes a car move? What allows you to have lights in your house? What lets your plants grow? The answer to each of these is energy. According to the American Heritage Dictionary® energy is “the capacity for work or vigorous activity.” Energy is everywhere, and in every living thing. Without energy you would not be able to do any of
the activities that you love, you wouldn’t have any food to eat, you wouldn’t have any light in your house, and you wouldn’t even be able to ride in a car to soccer practice. All energy falls into two types kinetic and potential. Potential energy is stored energy and the energy of position. Kinetic energy on the other hand is the energy of motion.
AA
BC
D
Looking at the pictures discuss what type of energy (kinetic or potential) each
letter represents.
3
E
F
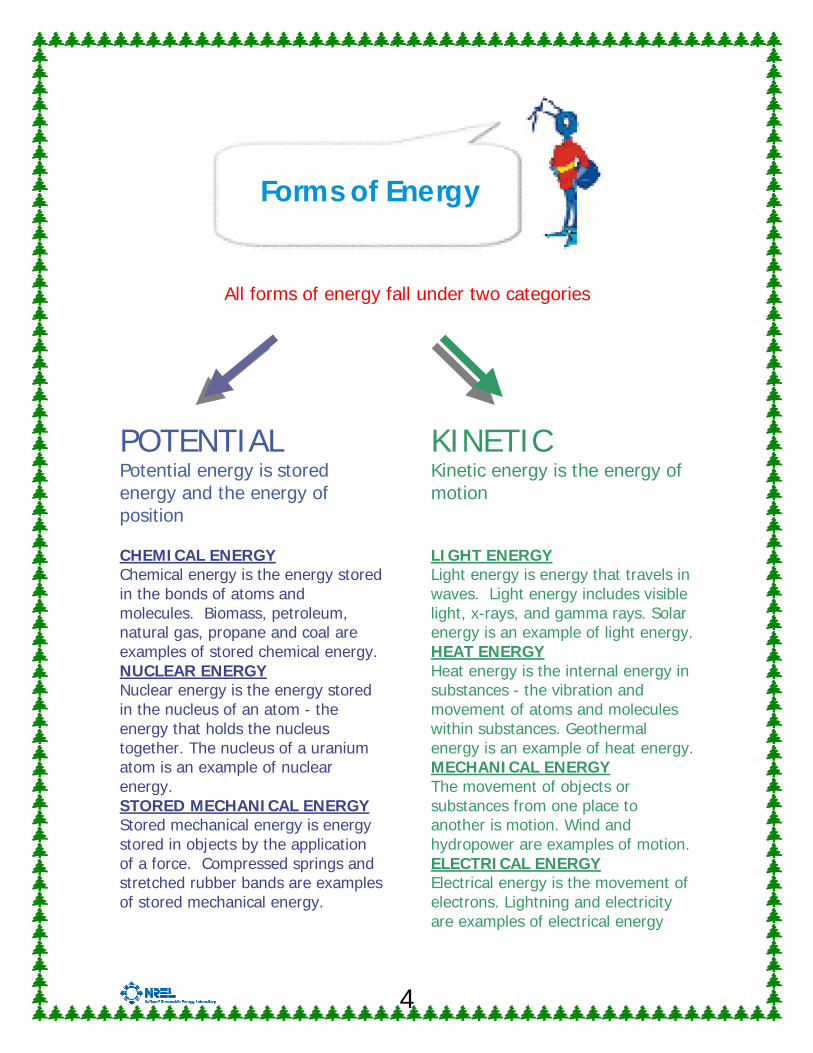
Forms of Energy
All forms of energy fall under two categories
POTENTIAL Potential energy is stored energy and the energy of position
KINETIC Kinetic energy is the energy of motion
CHEMICAL ENERGY Chemical energy is the energy stored in the bonds of atoms and molecules. Biomass, petroleum, natural gas, propane and coal are examples of stored chemical energy. NUCLEAR ENERGY Nuclear energy is the energy stored in the nucleus of an atom - the energy that holds the nucleus together. The nucleus of a uranium atom is an example of nuclear energy. STORED MECHANICAL ENERGY Stored mechanical energy is energy stored in objects by the application of a force. Compressed springs and stretched rubber bands are examples of stored mechanical energy.
LIGHT ENERGY Light energy is energy that travels in waves. Light energy includes visible light, x-rays, and gamma rays. Solar energy is an example of light energy. HEAT ENERGY Heat energy is the internal energy in substances - the vibration and movement of atoms and molecules within substances. Geothermal energy is an example of heat energy. MECHANICAL ENERGY The movement of objects or substances from one place to another is motion. Wind and hydropower are examples of motion. ELECTRICAL ENERGY Electrical energy is the movement of electrons. Lightning and electricity are examples of electrical energy
4
Purpose • To determine the difference between potential and kinetic energy. • To observe the change of potential energy into kinetic energy. • Recognize the form of energy of the object.
Materials
• Ruler with a groove or a trough made of cardboard or metal about 60cm • Marble or small ball • 2 to 3 books • Separate ruler to measure distance in cm • Piece of cardboard cut 2cm x 15 cm • 1 sheet of graph paper
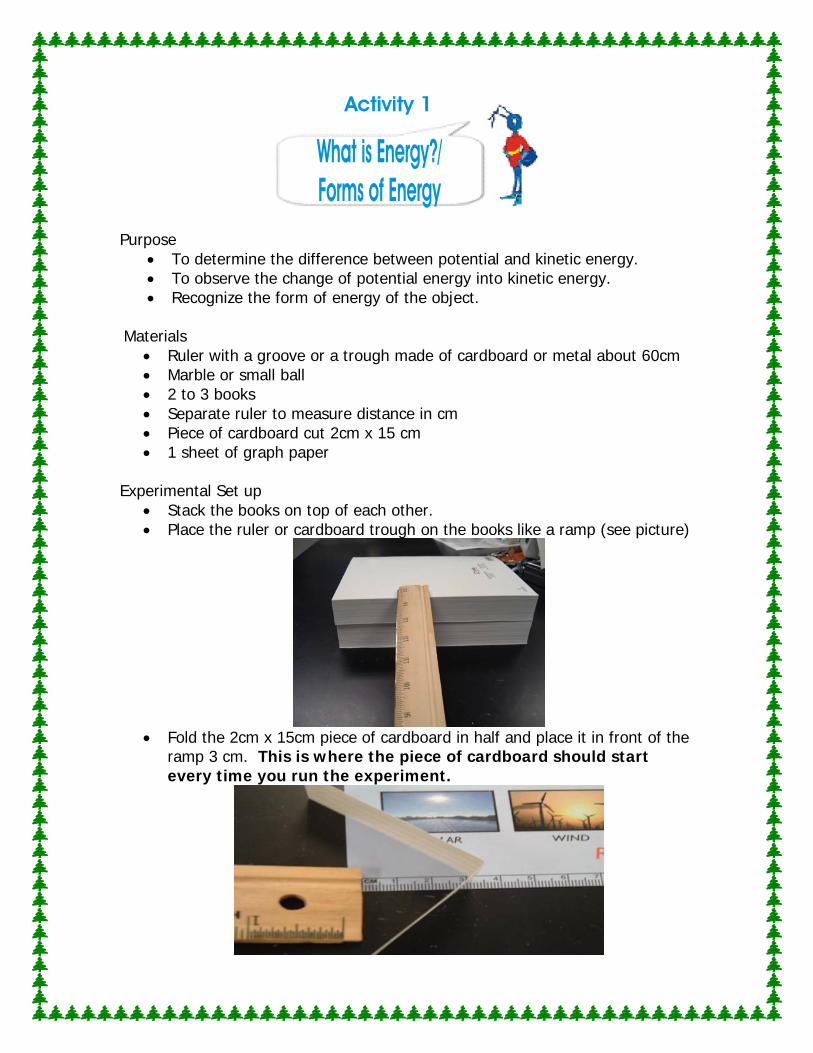
Experimental Set up
• Stack the books on top of each other. • Place the ruler or cardboard trough on the books like a ramp (see picture)
• Fold the 2cm x 15cm piece of cardboard in half and place it in front of the
ramp 3 cm. This is where the piece of cardboard should start every time you run the experiment.

• Design a data table that includes the following in space provided: 1. title 2. trial number 3. distance up ruler 4. distance cardboard moves
• Place the marble or ball on the ramp about ¼ the way up from the bottom. Measure and record this distance up the ruler (see picture)
• Let the ball go and hit the cardboard piece. • Measure how far the ball forces the cardboard to move. Record this
measurement. (see picture)
• Place the folded cardboard piece in front of the ruler ramp again at a
distance of 3 cm. • This time, start the ball ½ the way up the ramp. Measure this
distance. • Again, let the ball roll down the ramp, hit the cardboard piece and
measure the distance the cardboard moves. Record this measurement.
• Run the experiment 3 more times at ¾ of the way up, all the way up, and another random point that you choose. Record every measurement you make, the distance up the ramp where the ball begins and the distance the cardboard is pushed.
6
• Graph the data on the graph paper provided separately.
Data table Analysis
1. How does the potential energy of the marble compare at each distance? 2. Where does the marble get its kinetic energy?
3. What form of kinetic energy does the marble have?
4. How does the amount of potential energy affect the amount of kinetic energy produced?
7
8
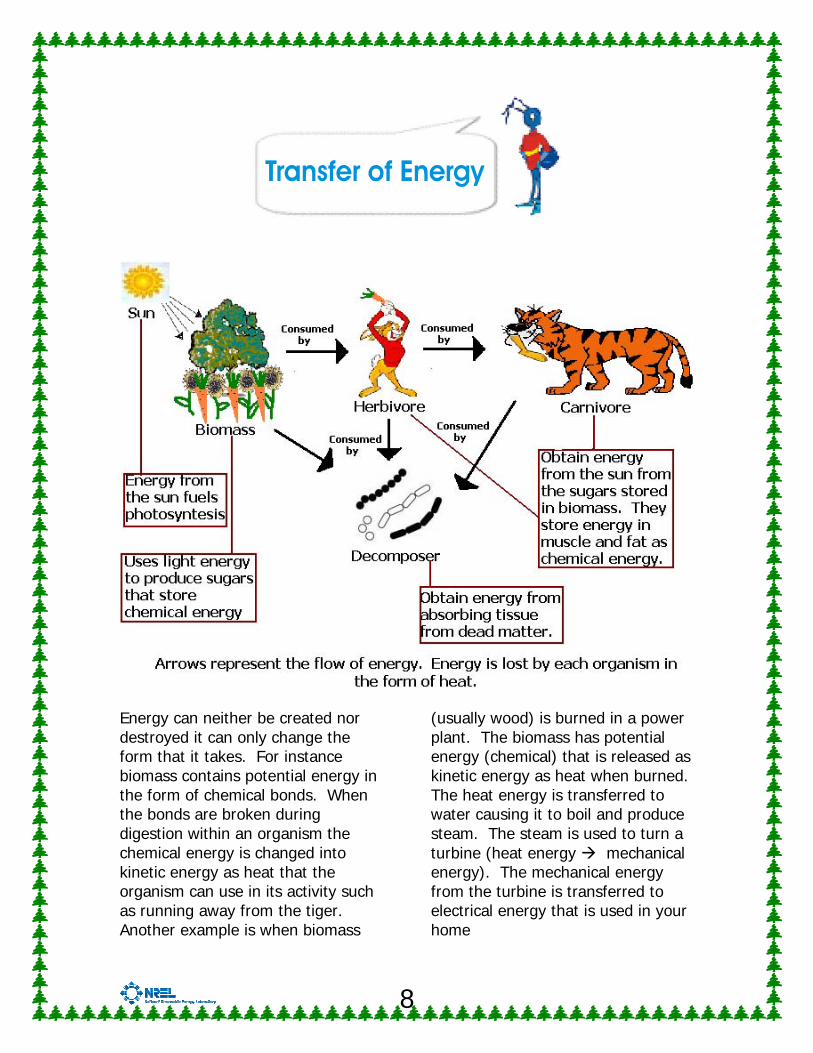
Energy can neither be created nor destroyed it can only change the form that it takes. For instance biomass contains potential energy in the form of chemical bonds. When the bonds are broken during digestion within an organism the chemical energy is changed into kinetic energy as heat that the organism can use in its activity such as running away from the tiger. Another example is when biomass
(usually wood) is burned in a power plant. The biomass has potential energy (chemical) that is released as kinetic energy as heat when burned. The heat energy is transferred to water causing it to boil and produce steam. The steam is used to turn a turbine (heat energy mechanical energy). The mechanical energy from the turbine is transferred to electrical energy that is used in your home
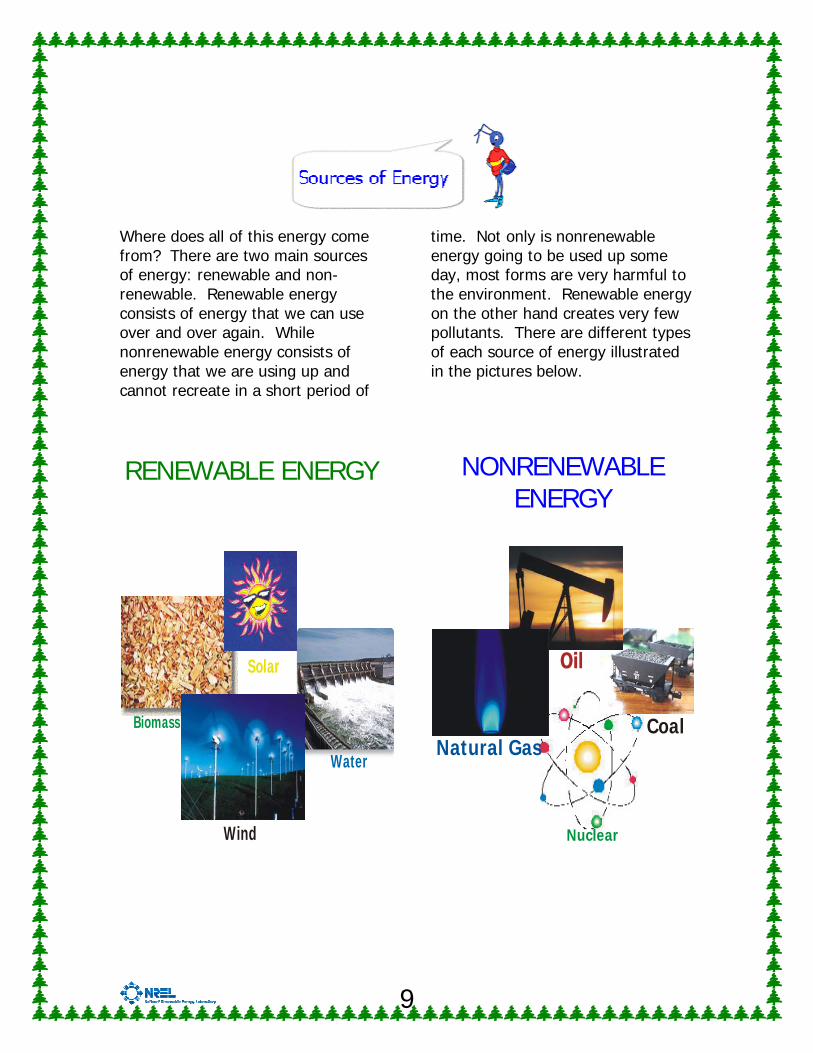
Where does all of this energy come from? There are two main sources of energy: renewable and non-renewable. Renewable energy consists of energy that we can use over and over again. While nonrenewable energy consists of energy that we are using up and cannot recreate in a short period of
time. Not only is nonrenewable energy going to be used up some day, most forms are very harmful to the environment. Renewable energy on the other hand creates very few pollutants. There are different types of each source of energy illustrated in the pictures below.
RENEWABLE ENERGY
Biomass
Solar
Wind
Water
NONRENEWABLE ENERGY
Natural GasCoal
Nuclear
9
Activity 2
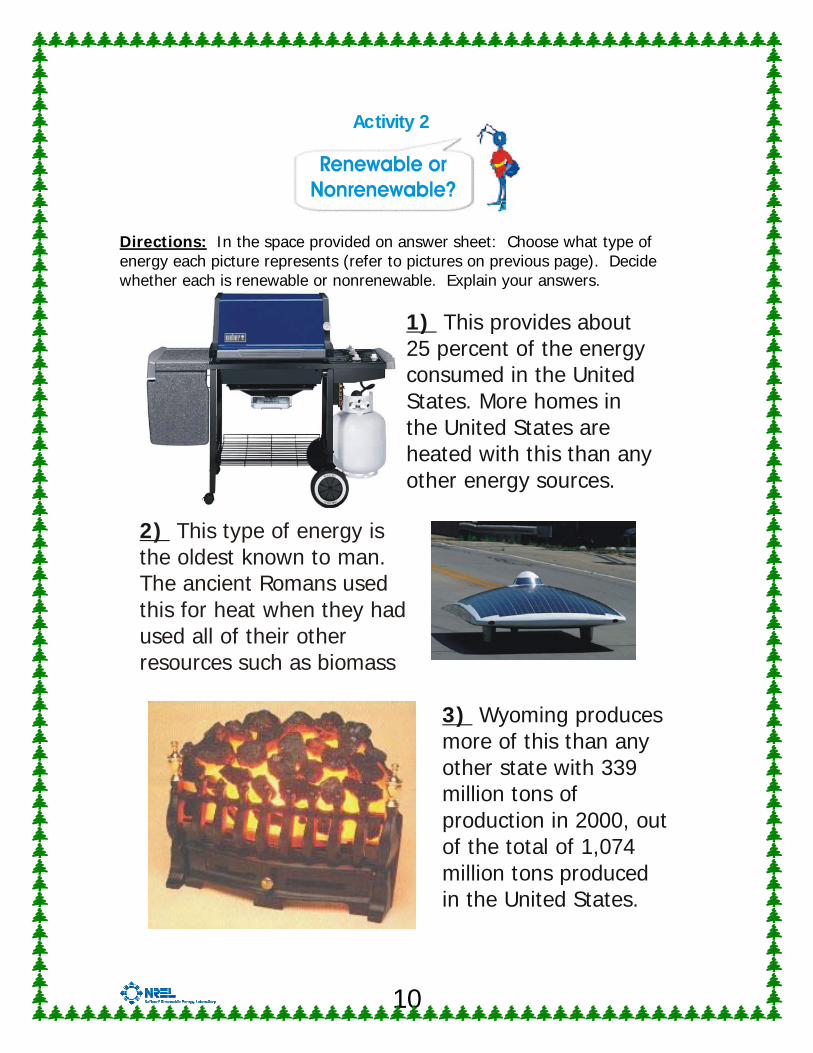
Directions: In the space provided on answer sheet: Choose what type of energy each picture represents (refer to pictures on previous page). Decide whether each is renewable or nonrenewable. Explain your answers.
10
1) This provides about 25 percent of the energy consumed in the United States. More homes in the United States are heated with this than any other energy sources.
2) This type of energy is the oldest known to man. The ancient Romans used this for heat when they had used all of their other resources such as biomass
3) Wyoming produces more of this than any other state with 339 million tons of production in 2000, out of the total of 1,074 million tons produced in the United States.

11
4) The amount of fuel consumed in family vehicles in the United States each year is enough to cover a regulation-size football field to a depth of about 40 miles.
5) This accounts for of the total
electricity generated in the United States, an amount comparable to all the electricity used in California, Texas and New York, our three most populous states
about 20 percent
6) This is the first form of energy harvested by human beings. How might they have used it?
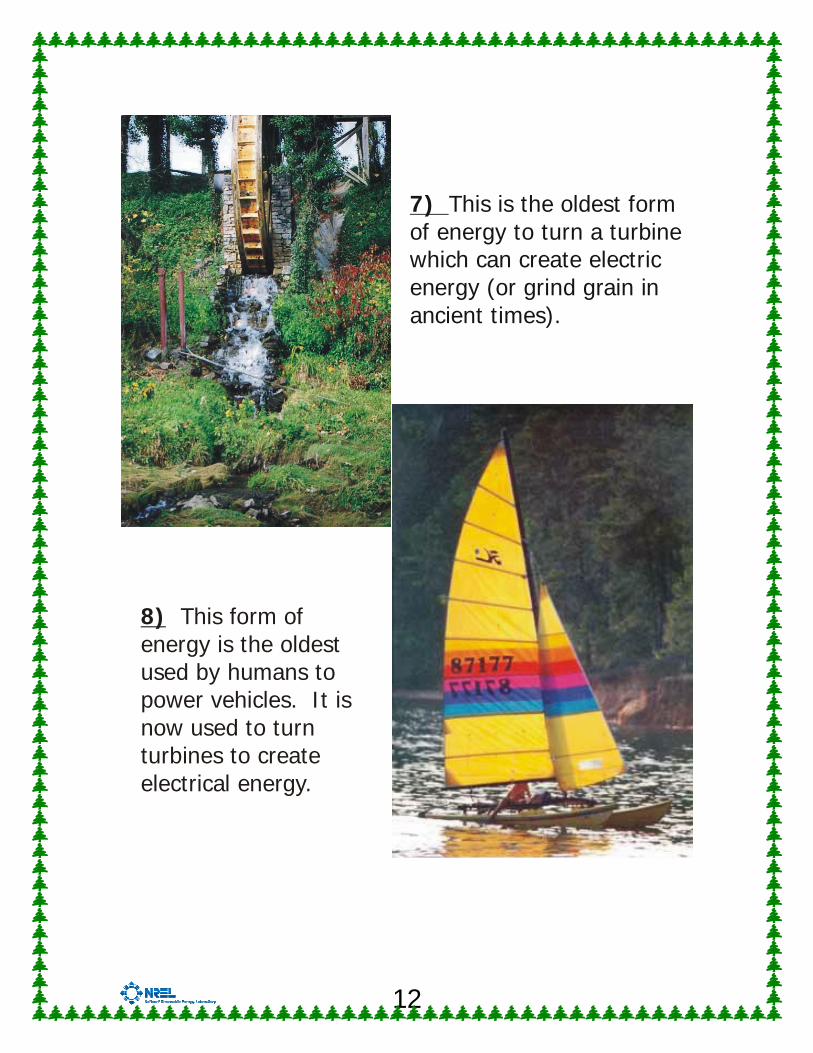
7) This is the oldest form of energy to turn a turbine which can create electric energy (or grind grain in ancient times).
8) This form of energy is the oldest used by humans to power vehicles. It is now used to turn turbines to create electrical energy.
12

Answer Sheet Activity 2
1.
2. 3. 4. 5. 6.
7.
8.
13
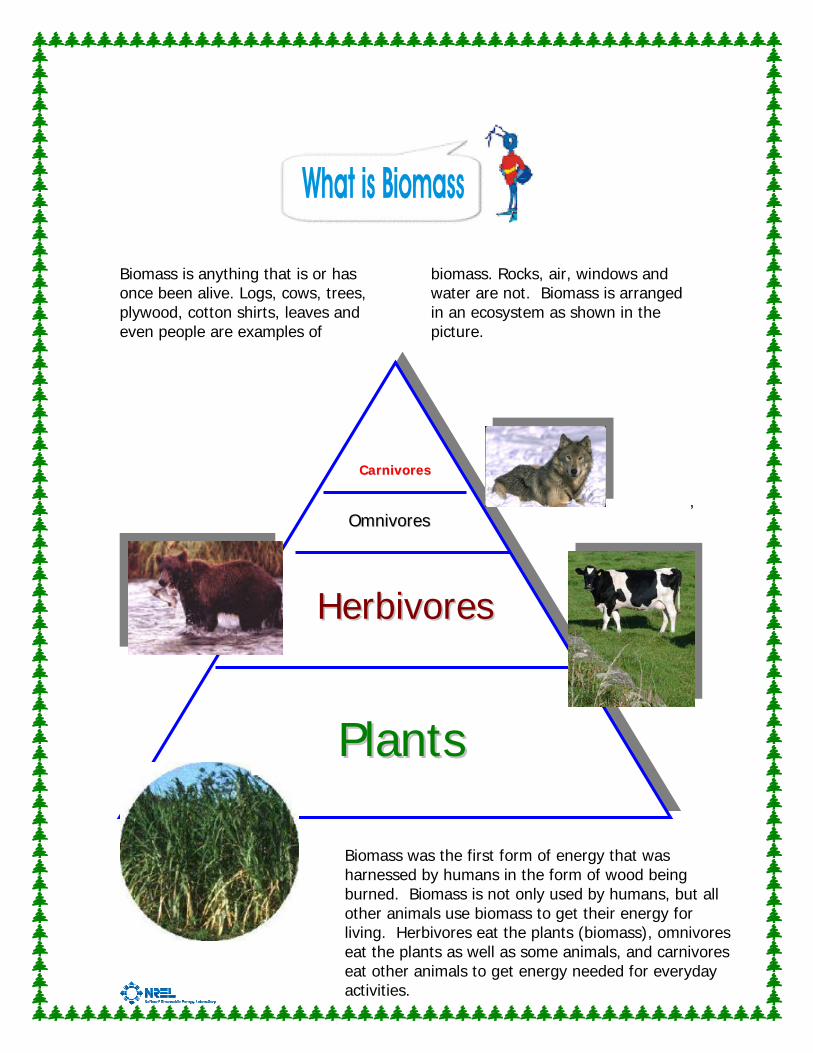
Biomass is anything that is or has once been alive. Logs, cows, trees, plywood, cotton shirts, leaves and even people are examples of
biomass. Rocks, air, windows and water are not. Biomass is arranged in an ecosystem as shown in the picture.
, OOmmnniivvoorreess
HHeerrbbiivvoorreess
PPllaannttss
Bhbolieea
CCaarrnniivvoorreess
14
iomass was the first form of energy that was arnessed by humans in the form of wood being urned. Biomass is not only used by humans, but all ther animals use biomass to get their energy for ving. Herbivores eat the plants (biomass), omnivores at the plants as well as some animals, and carnivores at other animals to get energy needed for everyday ctivities.
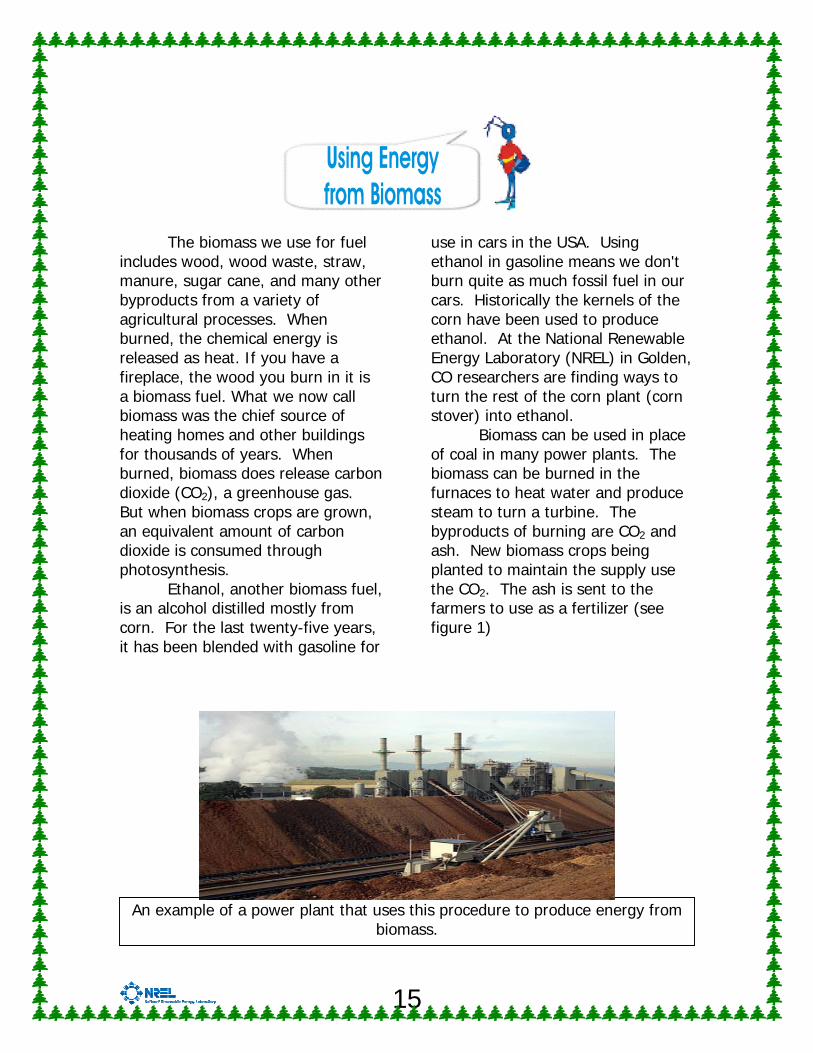
The biomass we use for fuel
includes wood, wood waste, straw, manure, sugar cane, and many other byproducts from a variety of agricultural processes. When burned, the chemical energy is released as heat. If you have a fireplace, the wood you burn in it is a biomass fuel. What we now call biomass was the chief source of heating homes and other buildings for thousands of years. When burned, biomass does release carbon dioxide (CO2), a greenhouse gas. But when biomass crops are grown, an equivalent amount of carbon dioxide is consumed through photosynthesis.
Ethanol, another biomass fuel, is an alcohol distilled mostly from corn. For the last twenty-five years, it has been blended with gasoline for
use in cars in the USA. Using ethanol in gasoline means we don't burn quite as much fossil fuel in our cars. Historically the kernels of the corn have been used to produce ethanol. At the National Renewable Energy Laboratory (NREL) in Golden, CO researchers are finding ways to turn the rest of the corn plant (corn stover) into ethanol. Biomass can be used in place of coal in many power plants. The biomass can be burned in the furnaces to heat water and produce steam to turn a turbine. The byproducts of burning are CO2 and ash. New biomass crops being planted to maintain the supply use the CO2. The ash is sent to the farmers to use as a fertilizer (see figure 1)
15
An example of a power plant that uses this procedure to produce energy from biomass.
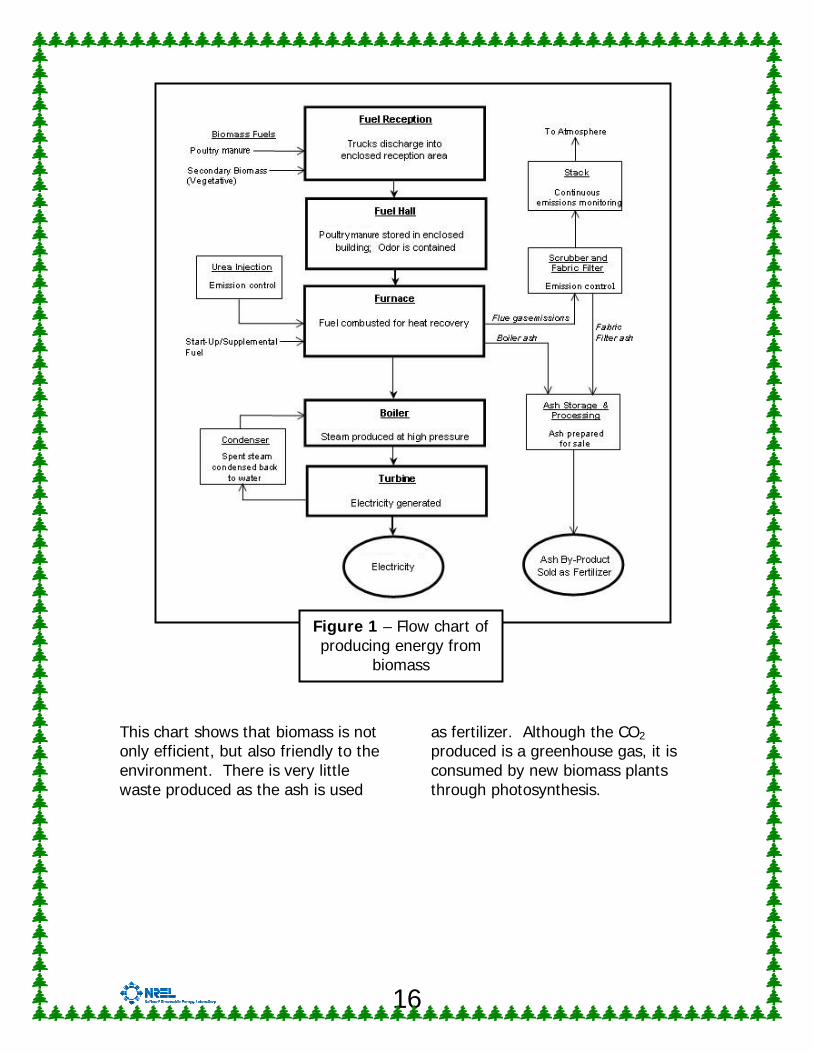
This chart shows that biomass is not only efficient, but also friendly to the environment. There is very little waste produced as the ash is used
as fertilizer. Although the CO2 produced is a greenhouse gas, it is consumed by new biomass plants through photosynthesis.
16
Figure 1 – Flow chart of producing energy from
biomass
Activity 3
Purpose
• Observe the process of Biomass combustion • Measure the amount of energy contained in different forms of biomass • Evaluate the efficiency of different forms of biomass used as energy
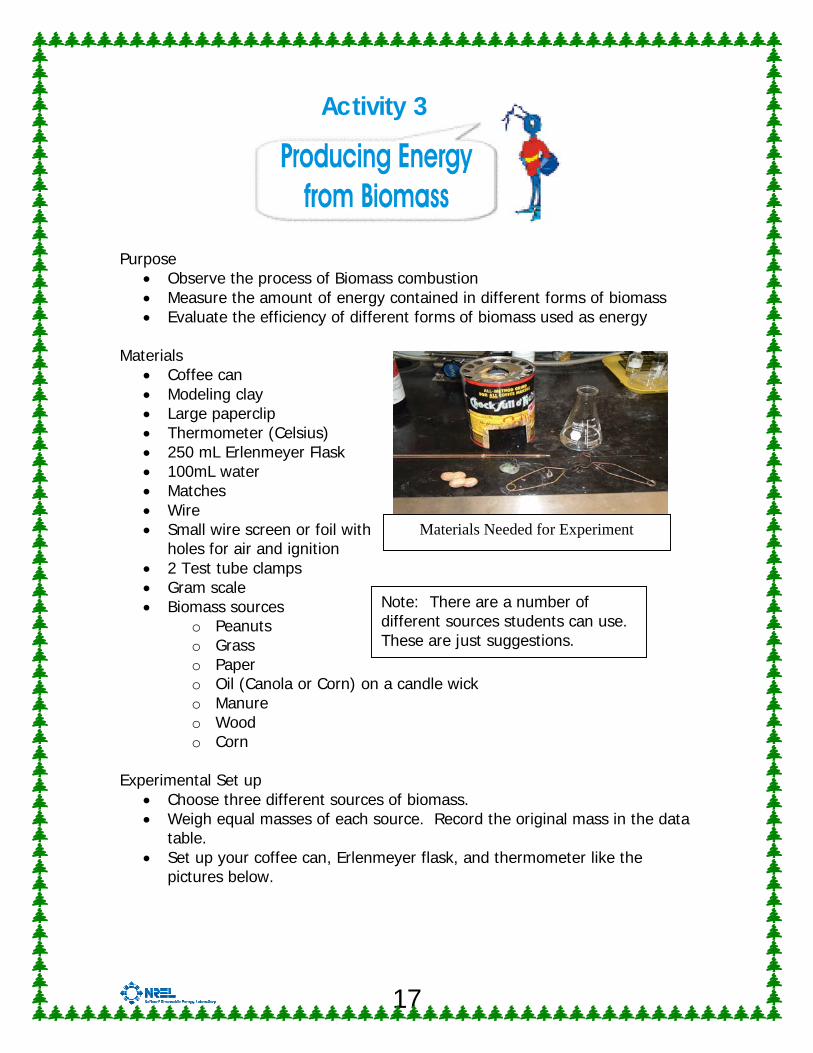
Materials
• Coffee can • Modeling clay • Large paperclip • Thermometer (Celsius) • 250 mL Erlenmeyer Flask • 100mL water • Matches • Wire • Small wire screen or foil with
holes for air and ignition • 2 Test tube clamps • Gram scale • Biomass sources
o Peanuts o Grass o Paper o Oil (Canola or Corn) ono Manure o Wood o Corn
Experimental Set up
• Choose three different source• Weigh equal masses of each
table. • Set up your coffee can, Erlenm
pictures below.
Materials Needed for Experiment
Note: There are a number of different sources students can use. These are just suggestions.
a candle wick
s of biomass. source. Record the original mass in the data
eyer flask, and thermometer like the
17

Connecting Flask to the Coffee Can
Paperclip to Hold Burning Sample (peanut or candle wick) Top View of Setup
18
Full Front View of Setup
I
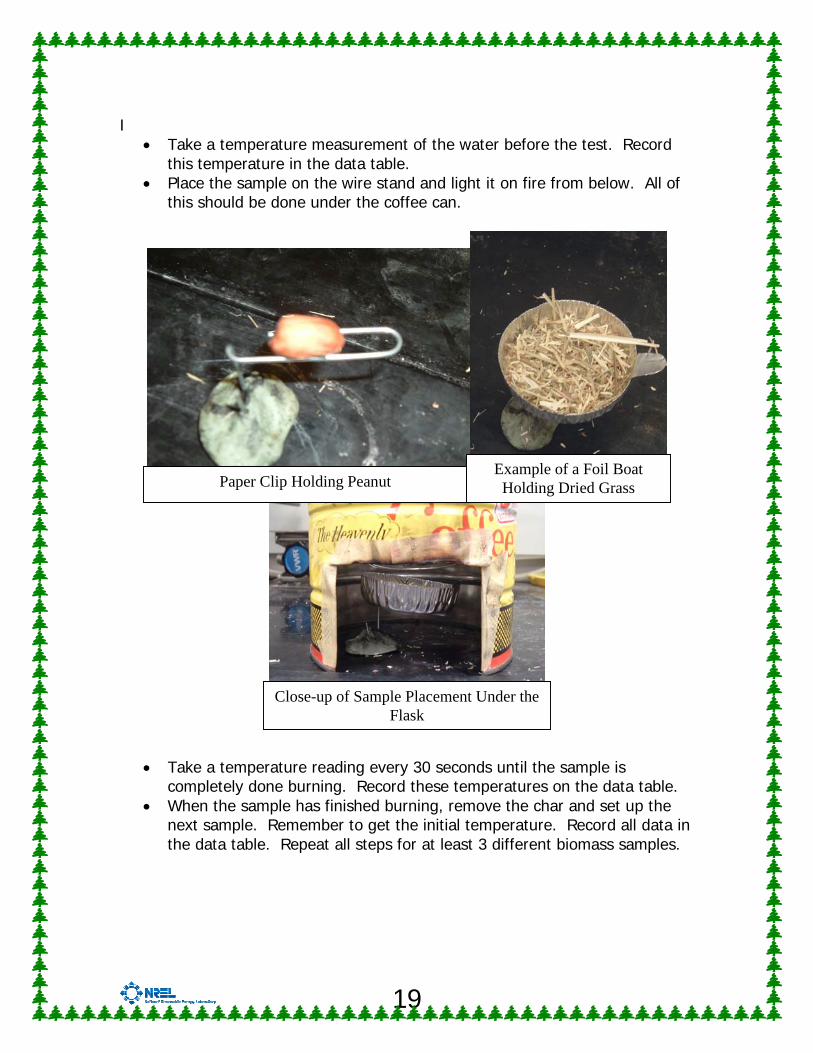
• Take a temperature measurement of the water before the test. Record this temperature in the data table.
• Place the sample on the wire stand and light it on fire from below. All of this should be done under the coffee can.
• Take a temperature reading every 30 seconds until the sample is completely done burning. Record these temperatures on the data table.
• When the sample has finished burning, remove the char and set up the next sample. Remember to get the initial temperature. Record all data in the data table. Repeat all steps for at least 3 different biomass samples.
Example of a Foil Boat Holding Dried Grass Paper Clip Holding Peanut
19
Close-up of Sample Placement Under the Flask
Data Table Analysis
1. Calculate the total change in temperature for each biomass sample.
Sample TI TF ∆T
2. Which sample had the greatest change in temperature?
20

3. Which type of Biomass would be best to burn in a factory and why?
4. Graph the results below labeling each axis using all correct units and scale.
21