Embed Size (px)
Citation preview
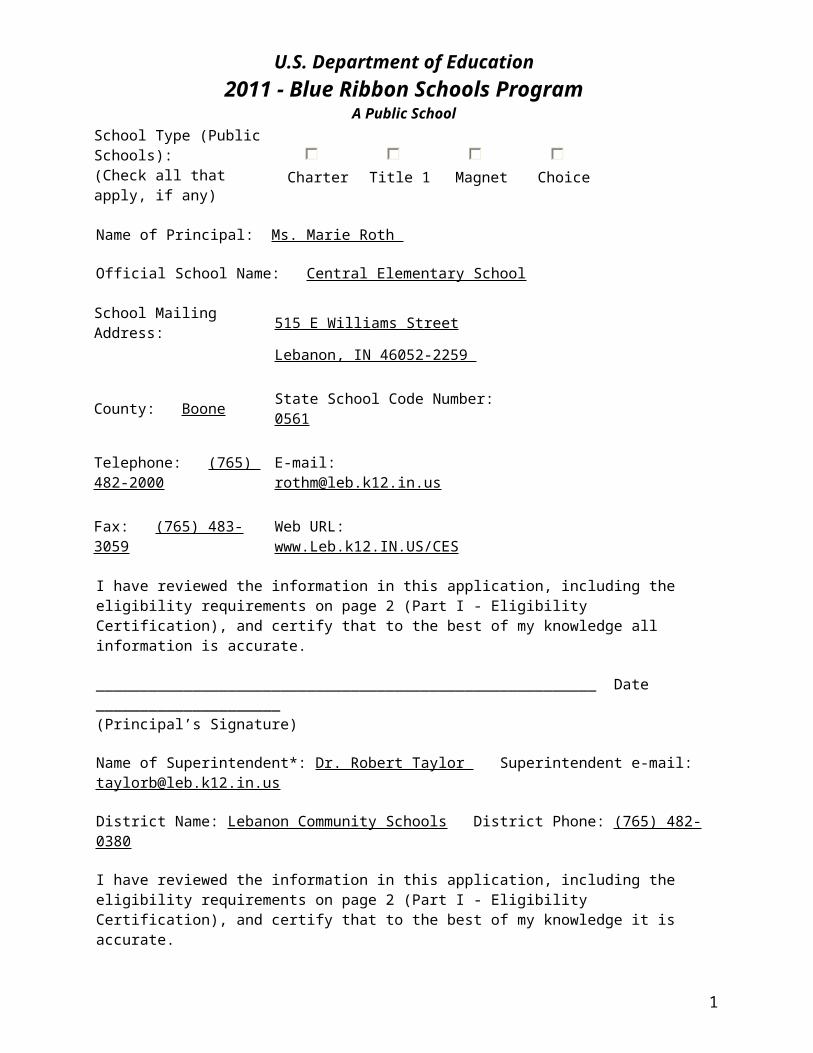
U.S. Department of Education2011 - Blue Ribbon Schools Program
A Public School School Type (Public Schools):
(Check all that apply, if any) Charter Title 1 Magnet Choice
Name of Principal: Ms. Marie Roth
Official School Name: Central Elementary School
School Mailing Address: 515 E Williams Street Lebanon, IN 46052-2259
County: Boone State School Code Number: 0561 Telephone: (765) 482-2000 E-mail: [email protected] Fax: (765) 483-3059 Web URL: www.Leb.k12.IN.US/CES
I have reviewed the information in this application, including the eligibility requirements on page 2 (Part I - Eligibility Certification), and certify that to the best of my knowledge all information is accurate.
_________________________________________________________ Date _____________________ (Principal’s Signature)
Name of Superintendent*: Dr. Robert Taylor Superintendent e-mail: [email protected]
District Name: Lebanon Community Schools District Phone: (765) 482-0380
I have reviewed the information in this application, including the eligibility requirements on page 2 (Part I - Eligibility Certification), and certify that to the best of my knowledge it is accurate.
_________________________________________________________ Date _____________________ (Superintendent’s Signature)
Name of School Board President/Chairperson: Ms. Michele Thomas
I have reviewed the information in this application, including the eligibility requirements on page 2 (Part I - Eligibility Certification), and certify that to the best of my knowledge it is accurate.
_________________________________________________________ Date _____________________ (School Board President’s/Chairperson’s Signature)
*Private Schools: If the information requested is not applicable, write N/A in the space.
The original signed cover sheet only should be converted to a PDF file and emailed to Aba Kumi, Blue Ribbon Schools Project Manager ([email protected]) or mailed by expedited mail or a courier mail service (such as Express Mail, FedEx or UPS) to Aba Kumi, Director, Blue Ribbon Schools Program, Office of Communications and Outreach, U.S. Department of Education, 400 Maryland Ave., SW, Room 5E103, Washington, DC 20202-8173.
11IN4
1
PART I - ELIGIBILITY CERTIFICATION 11IN4
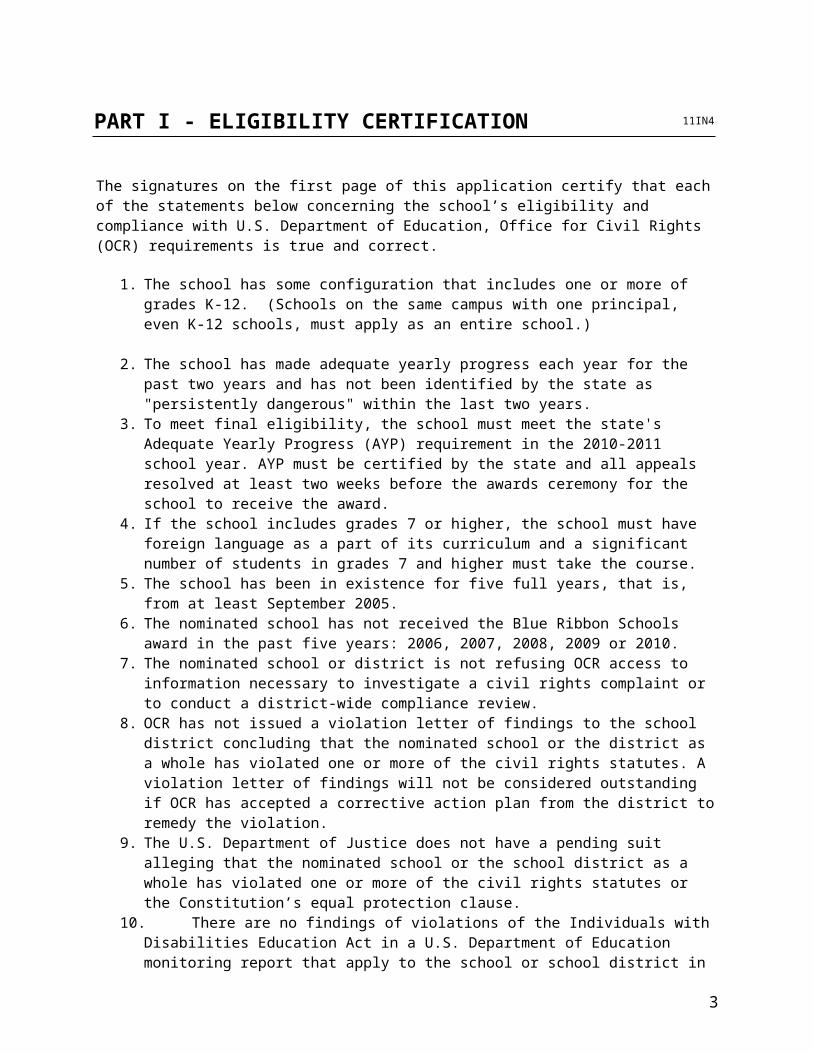
The signatures on the first page of this application certify that each of the statements below concerning the school’s eligibility and compliance with U.S. Department of Education, Office for Civil Rights (OCR) requirements is true and correct.
1. The school has some configuration that includes one or more of grades K-12. (Schools on the same campus with one principal, even K-12 schools, must apply as an entire school.)
2. The school has made adequate yearly progress each year for the past two years and has not been identified by the state as "persistently dangerous" within the last two years.
3. To meet final eligibility, the school must meet the state's Adequate Yearly Progress (AYP) requirement in the 2010-2011 school year. AYP must be certified by the state and all appeals resolved at least two weeks before the awards ceremony for the school to receive the award.
4. If the school includes grades 7 or higher, the school must have foreign language as a part of its curriculum and a significant number of students in grades 7 and higher must take the course.
5. The school has been in existence for five full years, that is, from at least September 2005.6. The nominated school has not received the Blue Ribbon Schools award in the past five years:
2006, 2007, 2008, 2009 or 2010.7. The nominated school or district is not refusing OCR access to information necessary to
investigate a civil rights complaint or to conduct a district-wide compliance review.8. OCR has not issued a violation letter of findings to the school district concluding that the
nominated school or the district as a whole has violated one or more of the civil rights statutes. A violation letter of findings will not be considered outstanding if OCR has accepted a corrective action plan from the district to remedy the violation.
9. The U.S. Department of Justice does not have a pending suit alleging that the nominated school or the school district as a whole has violated one or more of the civil rights statutes or the Constitution’s equal protection clause.
10. There are no findings of violations of the Individuals with Disabilities Education Act in a U.S. Department of Education monitoring report that apply to the school or school district in question; or if there are such findings, the state or district has corrected, or agreed to correct, the findings.
2
PART II - DEMOGRAPHIC DATA 11IN4
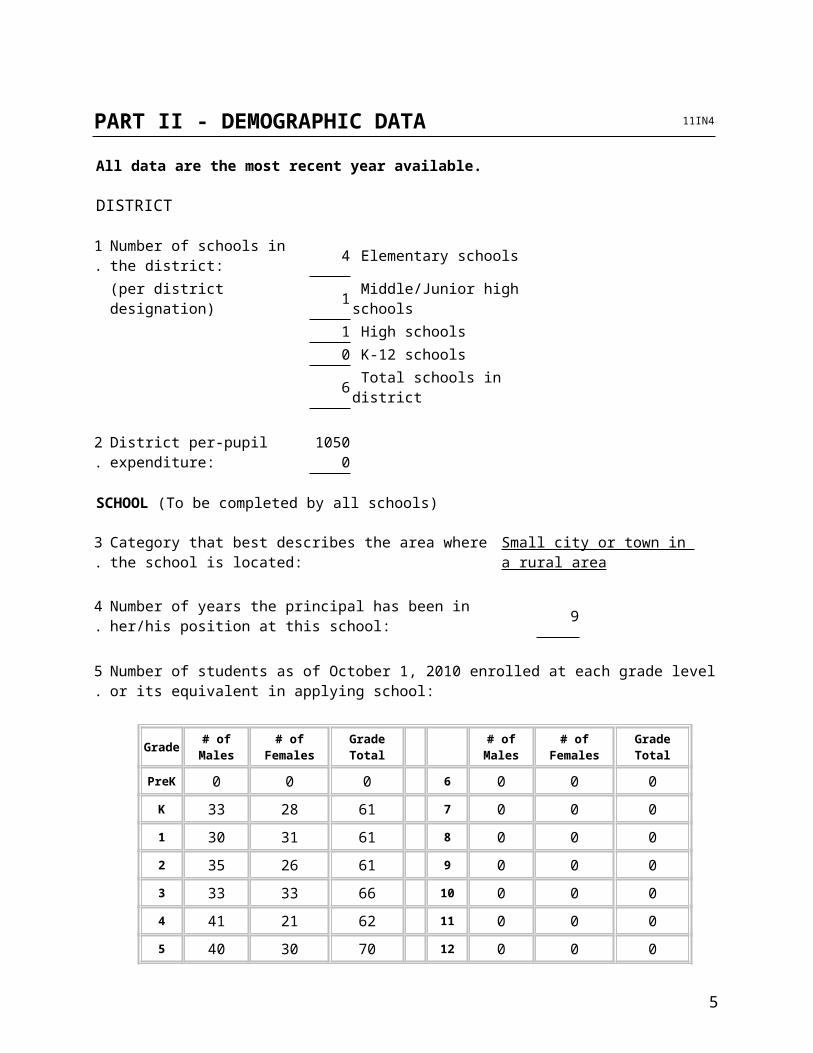
All data are the most recent year available.
DISTRICT
1. Number of schools in the district: 4 Elementary schools (per district designation) 1 Middle/Junior high schools
1 High schools 0 K-12 schools 6 Total schools in district
2. District per-pupil expenditure: 10500
SCHOOL (To be completed by all schools)
3. Category that best describes the area where the school is located: Small city or town in a rural area 4. Number of years the principal has been in her/his position at this school: 9 5. Number of students as of October 1, 2010 enrolled at each grade level or its equivalent in applying
school:
Grade # of Males # of Females Grade Total # of Males # of Females Grade Total
PreK 0 0 0 6 0 0 0
K 33 28 61 7 0 0 0
1 30 31 61 8 0 0 0
2 35 26 61 9 0 0 0
3 33 33 66 10 0 0 0
4 41 21 62 11 0 0 0
5 40 30 70 12 0 0 0
Total in Applying School: 381
3

11IN4
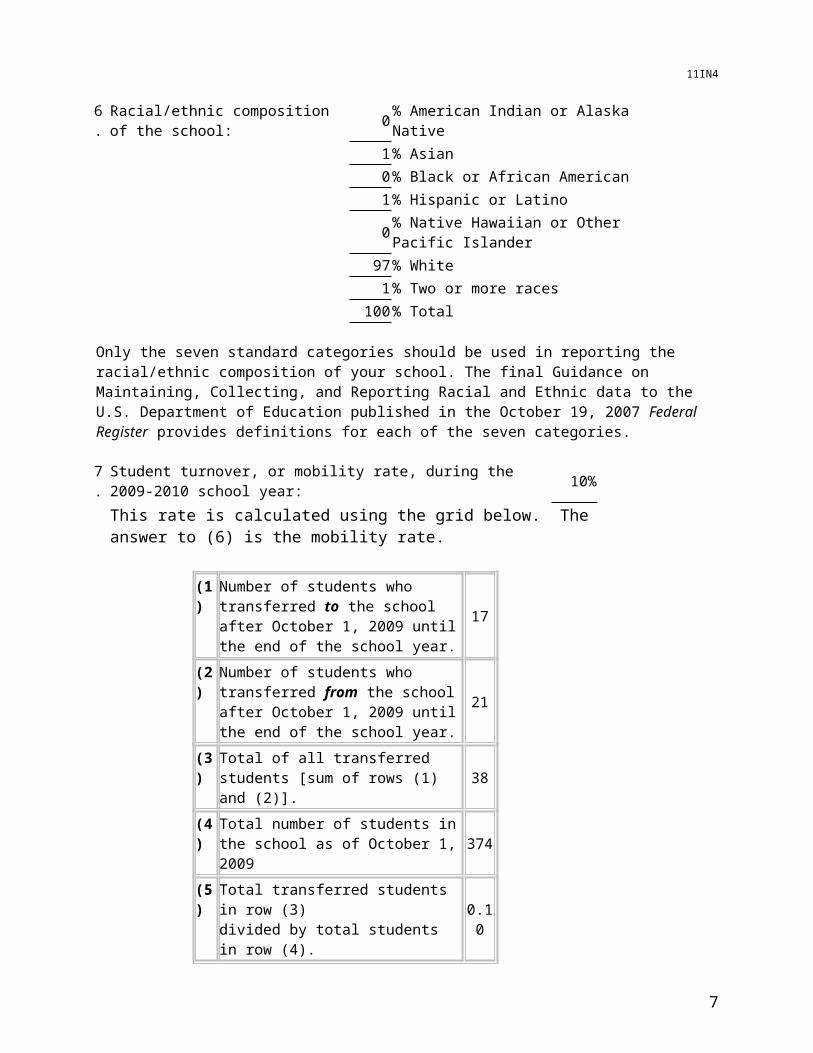
6. Racial/ethnic composition of the school: 0 % American Indian or Alaska Native 1 % Asian 0 % Black or African American 1 % Hispanic or Latino 0 % Native Hawaiian or Other Pacific Islander 97 % White 1 % Two or more races 100 % Total
Only the seven standard categories should be used in reporting the racial/ethnic composition of your school. The final Guidance on Maintaining, Collecting, and Reporting Racial and Ethnic data to the U.S. Department of Education published in the October 19, 2007 Federal Register provides definitions for each of the seven categories.
7. Student turnover, or mobility rate, during the 2009-2010 school year: 10%
This rate is calculated using the grid below. The answer to (6) is the mobility rate.
(1) Number of students who transferred to the school after October 1, 2009 until the end of the school year.
17
(2) Number of students who transferred from the school after October 1, 2009 until the end of the school year.
21
(3) Total of all transferred students [sum of rows (1) and (2)]. 38
(4) Total number of students in the school as of October 1, 2009 374
(5) Total transferred students in row (3)divided by total students in row (4). 0.10
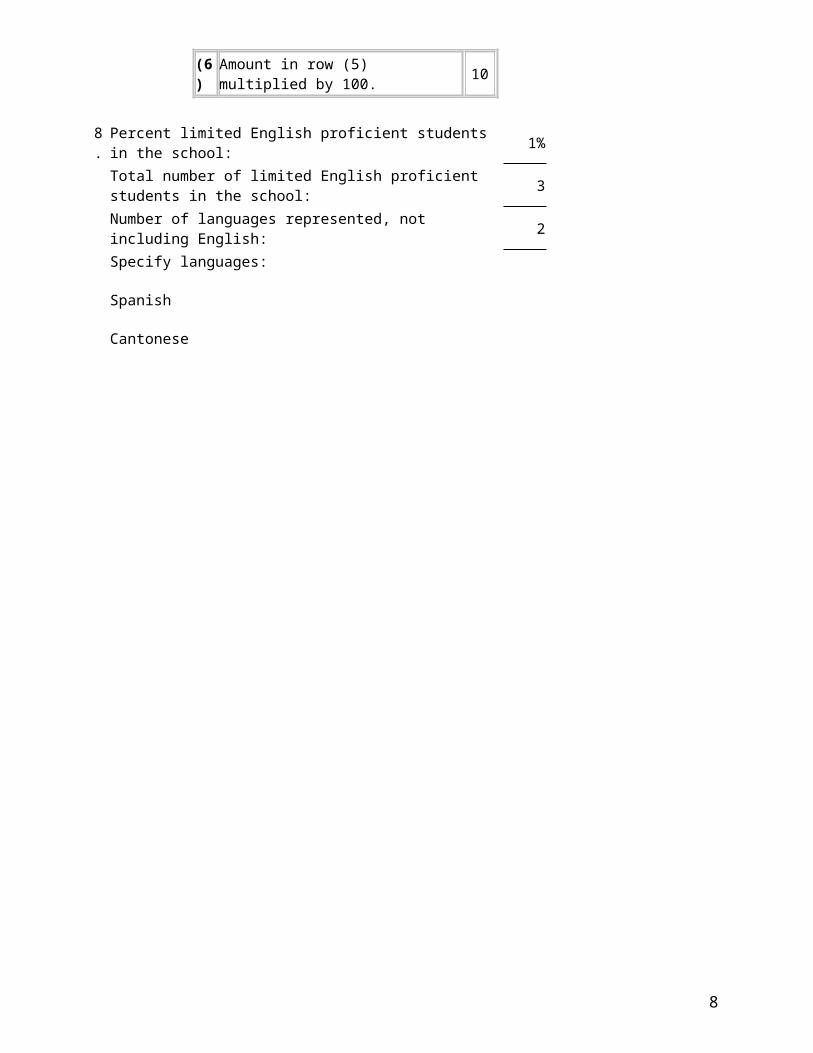
(6) Amount in row (5) multiplied by 100. 10
8. Percent limited English proficient students in the school: 1% Total number of limited English proficient students in the school: 3 Number of languages represented, not including English: 2
Specify languages:
Spanish
Cantonese
4
11IN4
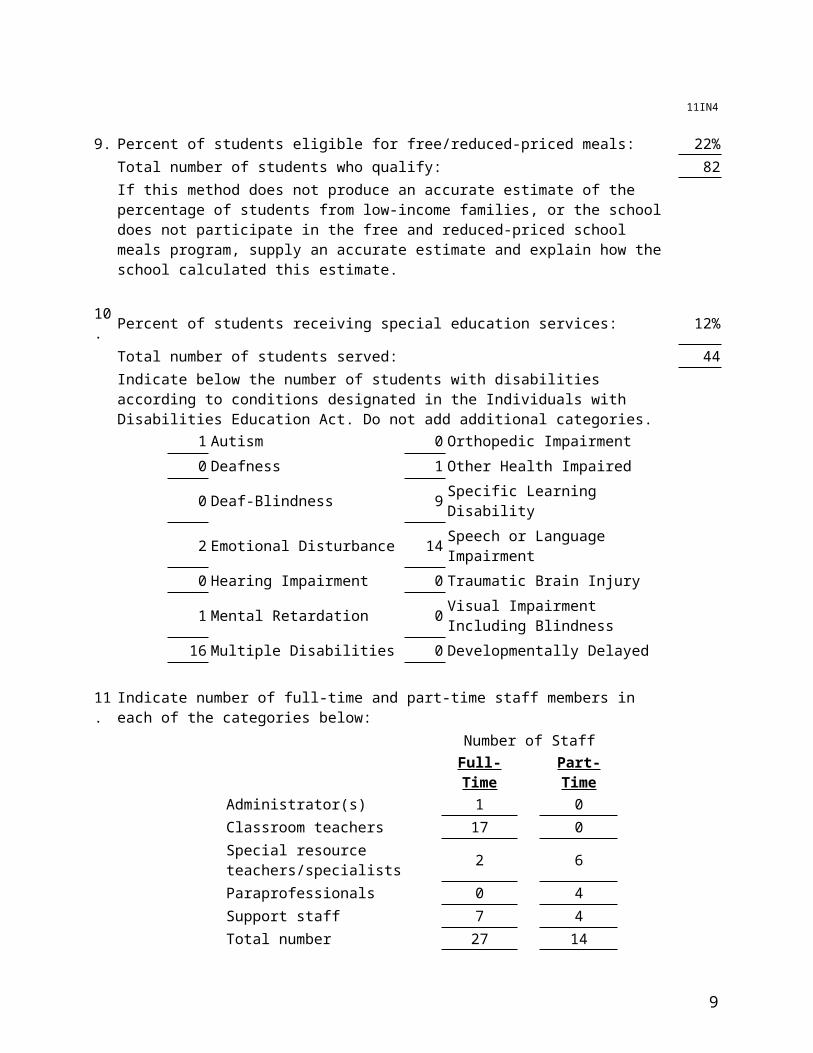
9. Percent of students eligible for free/reduced-priced meals: 22% Total number of students who qualify: 82
If this method does not produce an accurate estimate of the percentage of students from low-income families, or the school does not participate in the free and reduced-priced school meals program, supply an accurate estimate and explain how the school calculated this estimate.
10. Percent of students receiving special education services: 12% Total number of students served: 44
Indicate below the number of students with disabilities according to conditions designated in the Individuals with Disabilities Education Act. Do not add additional categories.
1 Autism 0 Orthopedic Impairment 0 Deafness 1 Other Health Impaired 0 Deaf-Blindness 9 Specific Learning Disability 2 Emotional Disturbance 14 Speech or Language Impairment 0 Hearing Impairment 0 Traumatic Brain Injury
1 Mental Retardation 0 Visual Impairment Including Blindness
16 Multiple Disabilities 0 Developmentally Delayed 11. Indicate number of full-time and part-time staff members in each of the categories below:
Number of Staff Full-Time Part-Time
Administrator(s) 1 0 Classroom teachers 17 0 Special resource teachers/specialists 2 6 Paraprofessionals 0 4 Support staff 7 4 Total number 27 14
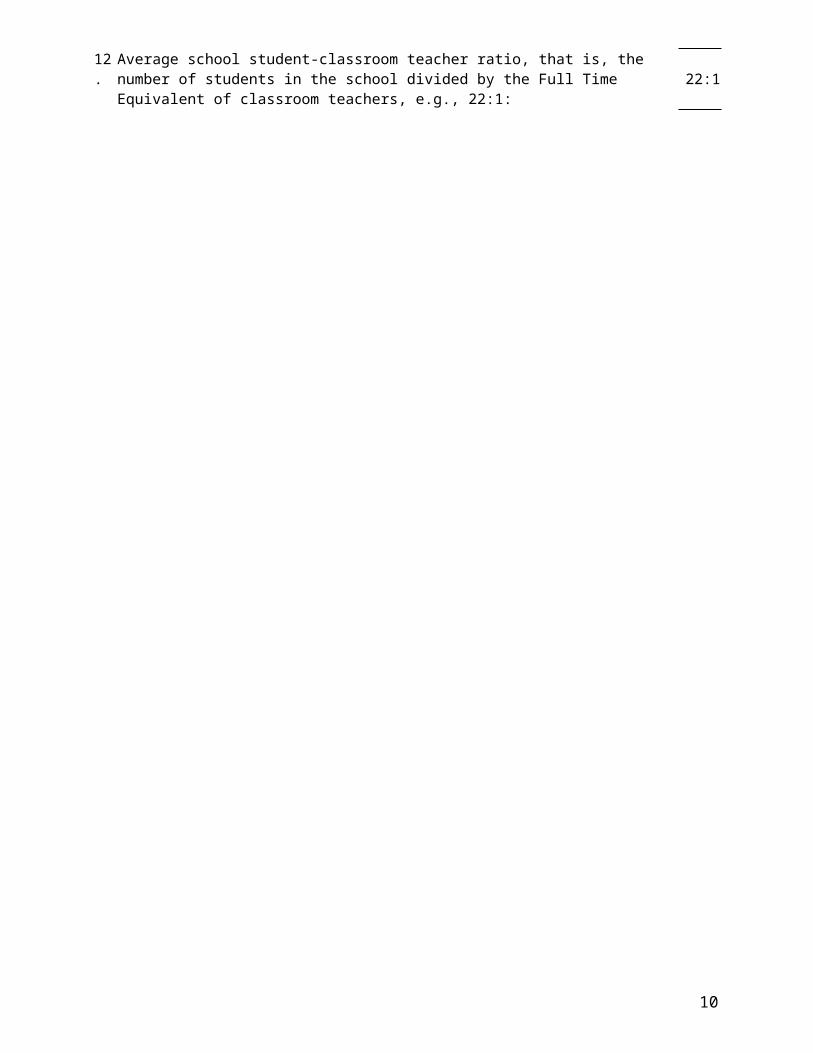
12. Average school student-classroom teacher ratio, that is, the number of students in the school
divided by the Full Time Equivalent of classroom teachers, e.g., 22:1: 22:1
5

11IN4
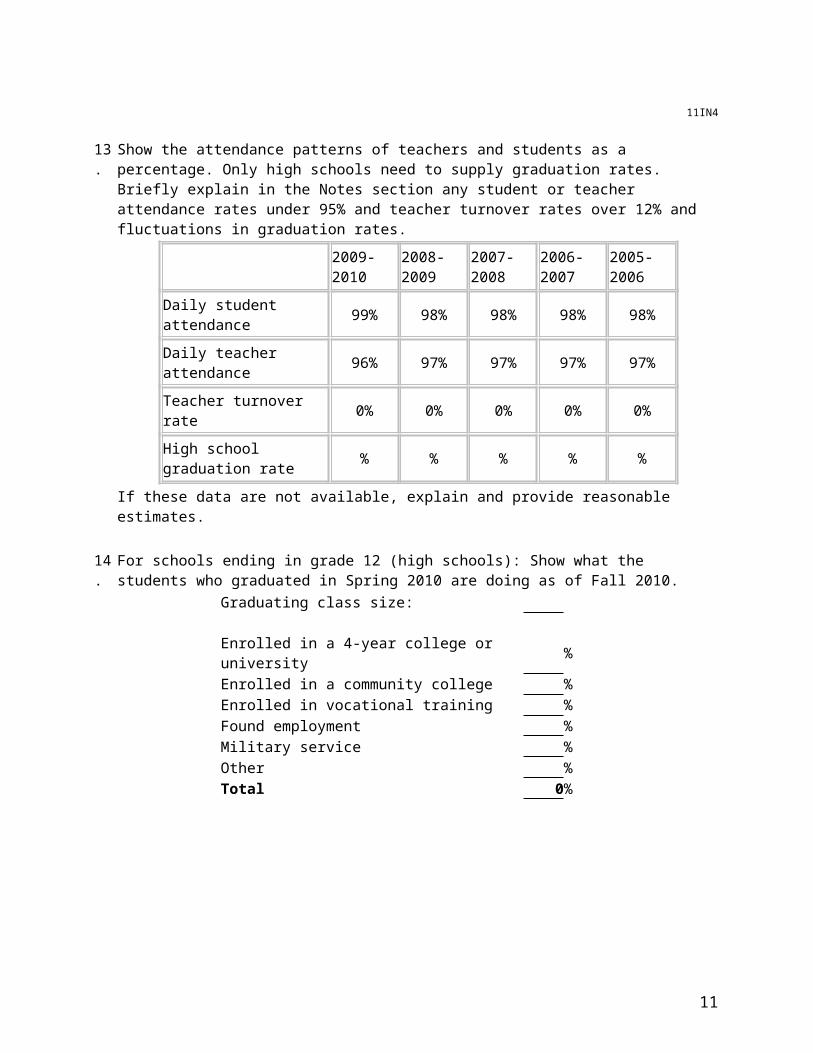
13. Show the attendance patterns of teachers and students as a percentage. Only high schools need to supply graduation rates. Briefly explain in the Notes section any student or teacher attendance rates under 95% and teacher turnover rates over 12% and fluctuations in graduation rates.
2009-2010 2008-2009 2007-2008 2006-2007 2005-2006
Daily student attendance 99% 98% 98% 98% 98%
Daily teacher attendance 96% 97% 97% 97% 97%
Teacher turnover rate 0% 0% 0% 0% 0%
High school graduation rate % % % % %
If these data are not available, explain and provide reasonable estimates. 14. For schools ending in grade 12 (high schools): Show what the students who graduated in Spring 2010
are doing as of Fall 2010. Graduating class size: Enrolled in a 4-year college or university % Enrolled in a community college % Enrolled in vocational training % Found employment % Military service % Other % Total 0%
6
PART III - SUMMARY 11IN4
Community Overview: Lebanon, IndianaPopulation - 14,222Median Income - $37, 791Ethnicity – 98.3% White, 1.6% HispanicMedian Housing Value - $90,900
Lebanon is a quaint community half way between Lafayette and Indianapolis. When visitors drive into town, the charming town square and the beautiful Boone County courthouse greet them. The two biggest gathering places in town are the pizza place on the square and the new Super Wal-Mart down the road. The newest amenity in Lebanon is Witham Hospital with its state-of-the-art medical center on the edge of town. Lebanon is a “bedroom community” and most residents work in Indianapolis, a mere 25 miles south. Residents value the small town feeling in Lebanon.
Mission Statement: Central Elementary School is dedicated to motivating students to become lifelong learners through the collaboration of students, staff, parents, and the school community. Our school will give students the opportunity to develop their optimum learning potential by providing a brain compatible learning atmosphere including: trust, meaningful content, choices, adequate time, and an enriched environment. Learning will be connected to real world experiences, enabling students to become responsible and productive citizens. Lifelong Guidelines: active listening, truth, trust, personal best, and no put downs.
Recognitions:
* In 1990, Central was designated a model teaching site for the CLASS (Connecting Learning Assures Student Success) Project, a school improvement initiative underwritten by the Indiana Department of Education. The foundation construct of this philosophy is the Integrated Thematic Instruction Model developed by Susan Kovalik, a pioneer in brain research.* From 1998 to 1999, Central Elementary enjoyed the National Blue Ribbon School Designation by the US Department of Education* In 2005, Principal Marie Roth was recognized at Principal of the Year, District 5 of the Indiana Association of School Principals (IASP)Principal Marie Roth was chosen to serve on the Indiana Association of School Principals (IASP) Board of Directors* In 2005, Indiana began categorizing schools into one of five levels. Central Elementary has received the highest rating of “Exemplary” all five years.* Central Elementary is listed as an Indiana Four Star School. Schools must score in the top 25% on the state standardized assessment for this recognition.
School Overview: Central Elementary serves a kindergarten through grade five population of approximately 380 students. Students come from the central and northeast attendance area of the town of Lebanon. The income of families ranges from lower to upper middle. There are an increasing number of single parent, extended, and blended families, as well as an increasing number of families who receive free/reduced lunch and textbooks. (In 2004-2005, our free/reduced amount was 16%. In 2010-2011, it is 29%.) The Central special needs population has not increased by we have seen an increase in the identification of autism and emotional disability. The faculty consists of fifteen regular classroom teachers, four shared special area teachers, (art/music/physical education/library), one shared speech/language therapist, one full-time and shared special needs teacher, one part-time counselor, a shared registered nurse, and several instructional assistants and support staff.
Central has enjoyed a long history of strong parent involvement. Our PTO supports several outstanding programs for Central families. This year the school staff has implemented a program to further involve
7
fathers in the school. The program is entitled Watch D.O.G.S. (Dads of Great Students) that encourages fathers and other positive male role models to participate in school activities. Every father is asked to give one day during the school year to help in his child’s classroom, assist with arrival/dismissal, work in the lunchroom, and participate in recess.
Additional opportunities are offered at Central to support the individualized needs of the students: science fair, spelling bee, Afternoons ROCK (for GR4-5 to encourage healthy choices), bully prevention seminars (GR1), art club, media club (runs morning televised news program), and buddy class pairings, to name a few.
8
PART IV - INDICATORS OF ACADEMIC SUCCESS 11IN4
1. Assessment Results:
The purpose of the Indiana Statewide Testing for Educational Progress Plus (ISTEP+) program is to measure student achievement in the subject areas of English/Language Arts, Mathematics, Science, and Social Studies. ISTEP+ scale scores typically will range from 100-800. Student achievement is reported in terms of three performance levels: Pass+, Pass, and Did Not Pass. Website: http://compass.doe.in.gov/Dashboard.aspx?view=SCHOOL&val=0561&desc=Central+Elementary+School
Significant Gains (2005-2010) – Language Arts• School – Growth in school wide performance from 86% to 93% since 2005. Total percent passing of students of poverty has also increased from 73% to 82%. Our special education numbers have grown in total passing from 57% to 68%.• Grade 3 - Significant gain in total passing from 82% to 93%. Growth from 45% to 67% total passing in special education. We saw a growth from 45% to 67% total passing in special education. • Grade 4 - Total passing increased from 83% to 93%. Students of poverty total passing rate increased significantly from 44% to 91%. Special needs students total passing increased from 53% to 78%.• Grade 5 - Students of poverty have held steady at 79-80% total passing.
Significant Losses (2005-2010) – Language Arts• Grade 3 - Students from poverty have almost doubled since 2005 and total percent passing has dropped 10% from 91 to 81%.• Grade 5 - Special education students have struggled in fifth grade over the five years. We are still behind, dropping from 73% to 50% total passing. This is an area that we have started addressing in our School Improvement Plan.
Significant Gains (2005-2010) – Mathematics• School - Total passing moved from 85% to 95% in five years. Special education students total passing increased from 54% to 84%.• Grade 3 - Gains in total passing from 86% to 92%. Special needs students total passing increased from 55% to 75%.• Grade 4 - We saw a significant gain in total passing from 77% to 93% with a gain in the area of Pass+ moving from 20% to 45%. We saw a HUGE gain in students of poverty total passing rate from 22% to 91%. Special needs students total passing increased from 47% to 78%.• Grade 5 - We have seen consistent high scores in fifth grade from 91% to 98% total passing with a HUGE gain in the area of Pass+ moving from 45% to 66%. 100% of students of poverty passed in 2005 and in 2010. 100% of special needs students passed in 2010 while only 64% passed in 2005.
Significant Losses (2005-2010) – Mathematics• Grade 3 - As strong as our students have been in math as a school, our students of poverty have not been doing as well. We have seen a drop from 91% to 75% total passing. We did see a gain from 9% to 33% achieving Pass+.
2010 – Language Arts and SubgroupsTotal Passing 93%Poverty Passing 82% Special Education Passing 68%
2010 – Mathematics and SubgroupsTotal Passing 95%
9
Poverty Passing 88%Special Education Passing 84%How are we addressing the 82% and 88% passing for students in poverty? Through Response to Intervention/Instruction (RTI), we are watching the achievement of this particular subgroup. Teachers are starting to better analyze data. We are learning that children of poverty have some unique needs. They also often lack the home structure that is able to support school success. We find that this group is responsive to computer based programs due to the immediate response factor. We have used several online programs (iStation, IXL, Reading A-Z, Breakthrough to Literacy, Read Naturally) resulting in increased student engagement.
How are we addressing the 68% and 84% passing for students in special education? Our special education teachers (1.5 teachers) have tried multiple ways to help this subgroup. Working with students in small groups and pre-teaching the lesson seems to be very helpful. We continue to struggle with the home component. We are seeing a decrease in parental invo. We have started a new fatherhood initiative this year. It is called Watch DOGS (Dads of Successful Students). We held a callout for all Central Elementary dads and we had over 200 attend our first session! Dads (grandfathers, uncles, step dads) sign up to give one day a year to the school. These special men are helping in our classrooms every day. We are finding that our special needs students are growing with this extra attention. It also makes a difference to have another person in the classroom to help work with small groups. Teachers are finding the extra set of hands helpful.
2. Using Assessment Results:
Teacher Data Analysis – Each time an assessment is given, teachers are asked to analyze the data. The first question they ask is, “Did 80% of my students master the assessment?” If the answer is no, then the teacher goes back and re-teaches the skill in a different way and reassesses. If the answer is yes, then the teacher separates the students into three groups: those who mastered skill and are ready for a higher skill, those on the line in need of some practice, and those below standard in the “red” who need immediate intervention. When a child has been in the “red” fairly often, the child is referred by the teacher to the Problem-Solving Team.
Problem-Solving Teams: Our entire staff is divided into three teams. We have teachers from all grades mixed on these teams. Each team meets one morning a week. Four members of the staff attend all three weekly team meetings: the two special needs teachers, the principal, and the counselor. During these meetings the teacher presents all relevant data on the student and all strategies that have been tried up to this point. The rest of the team brainstorms other strategies, mental health concerns, special needs concerns, medical concerns, etc. The parent is often invited to these sessions as well. Once the team comes up with a plan, the plan is implemented and then reviewed by the team in 2-4 weeks. If there are concerns beyond the academic, a child may be referred for help outside of the school. We have been fortunate to have a local mental health group working in our school. Parents pay through insurance or Medicaid for the services and the therapist works closely with the school. We continue to see a rise in students in need of mental health assistance.
Improving Teaching and Learning - The principal also reviews assessment data to see similarities and differences within a grade level. If one or two classes are mastering a skill but a third class is not, the principal will meet with the team to discuss successful strategies. The principal will also meet with the third teacher 1:1 to discuss the differences in the data. If necessary, the teacher will be given release time to observe a teaching strategy in another classroom.
3. Communicating Assessment Results:
Our school works very hard to communicate clearly and regularly with all stakeholders. Students often take their assessment goal with them into the computer lab. Teachers meet individually with students to discuss results from each of our assessments. Teachers have made reaching goals more fun by making each step towards the goal represent a part of an ice cream sundae. There is a chart in each room where students post a: bowl, spoon, scoops, and toppings, as their goals are achieved. Students love
10
to add to this chart each day as objectives are met. At the end of each quarter, students throughout the building have a sundae party with all the parts that they have accomplished. Parents volunteer to help with this celebration!
Parents are able to monitor student assessment results on our student management system (Skyward) from their computer. Many parents check this daily. The principal has received many positive comments from parents about the ability to see all assignments and assessments as soon as they are posted. Paper midterms are also sent home at the middle of each nine week grading period. Traditional parent teacher conferences are still held each fall and Central is fortunate to have a 98% attendance rate. Special needs students have annual case reviews but usually meet with a team more often. Informal parent conferences are held every day either in person or via phone. Teachers work hard to communicate with all parents.
Parents can also sign up for notifications each time an assessment is entered by the teacher. Parents and community members can receive emails directly from the principal about how the school is doing on assessments. Community members also are able to access the school website (www.leb.k12.in.us/CES) and links to the Indiana Department of Education data mining. We send a monthly school newsletter which is sent home on paper and also to parents via email. Lebanon is fortunate to have a daily newspaper (The Lebanon Reporter) that is very friendly to education. All of the schools are well represented by the newspaper. Just today, our science fair winners were in the paper both with a story and photo.
4. Sharing Lessons Learned:
Our staff works cooperatively together to ensure that we are using the best practices for our students. Our staff meetings are centered on what has worked best for us in our own classrooms. Central Elementary has also taken several opportunities to educate our community on how children learn and how to develop lifelong learners within our community. We have been given several opportunities to share our expertise to a wider audience both in Indiana and around the country. Our school not only seeks out best practices for each individual student, but we are also leaders in developing ways to share our strategies with our colleagues, district, community, and fellow educators around the world. We recently started communicating via Skype with teachers and students in other countries. The examples listed below are a sample of the leadership within our school:• First grade teachers presenting at a Susan Kovalik Thematic instruction conference in Phoenix, AZ.• Second grade teacher presenting on Accelerated Math at a Renaissance Learning Math Summit in Wisconsin. This teacher has had a National Model Classroom for several years. She taught Accelerated Math strategies in a school in Shelbyville, IN.• Teachers shared Accelerated Math strategies at the district high school, middle school, and all elementary schools.• Teacher presented to the Sheridan Elementary School an overview of Accelerated Math and success with the program.• Teachers presented yearly at the district elementary Literacy Summer Conference. They did several breakout sessions about successful teaching strategies in reading and language arts.• Teachers present best practices used for high ability/gifted students to other teachers in the district during monthly meetings. • Central Elementary teachers’ lessons have been published in the writing strategies book, 16 Writing Lessons to Prepare Students for the State Writing Assessment and More.• Teachers held a Family Literacy Night for the community to show families the importance of literacy and how to implement reading strategies at home.• Central Elementary is a sister school to a school in Haiti. The Central Elementary principal is in contact with the principal in Haiti. The principal has visited our school twice. Students Skyped with Haiti before and after the earthquake.• Teachers and students have Skyped with other students and teachers in various places around the world. One of our student teachers Skyped back to Central while studying abroad.• Central Elementary teachers communicate and publish lessons on the IDOE website Learning Connection.
11
PART V - CURRICULUM AND INSTRUCTION 11IN4
1. Curriculum:
Language Arts – The language arts curriculum is constantly being evaluated and improved according to research in best practice, current brain research, and state mandates. The curriculum is based on the Common Core Standards. The base of our instructional practice is guided reading following the models of Gay Su Pinnell and Irene Fountas. We have invested a great deal of funding in creating a book room with thousands of books, including bagged book sets available for class use. The district has also adopted a basal program (Pearson) to better support skill development. We found that our students improved in fluency and comprehension with guided reading but were lacking some specific skill development. Mixing the basal text and guided reading has proved faster growth than either program used separately. Our standardized test scores increased from 86% passing in 2006 to 92% passing in 2010 (Grades 3-5 ISTEP+).
Mathematics – The philosophy for teaching math at Central Elementary is to integrate several different instructional strategies and materials. We found great success with Everyday Math (University of Chicago). This complex way of teaching math was embraced by staff and students. Our standardized test scores increased from 85% passing in 2006 to 95% passing in 2010 (Grades 3-5 ISTEP+). Each day teachers teach a whole group lesson with Everyday Math and then students work at an individualized pace on Accelerated Math (RenLearn). Students may be working at/below/above grade level depending on skill level. This year we added IXL.com subscriptions for every student. Each student has a password to work on IXL.com at home and at school. Students have a friendly competition with other classmates to complete math problems on IXL.com outside of the school day. IXL.com goes past eighth grade math skill levels so students are able to continue their growth.
Visual and Performing Arts – Central Elementary has been fortunate through the years to have very gifted teachers in the arts. Students have been exposed to art exchanges with China. The art teacher designed a large stained glass feature for our front entryway based on photos of a local pond. The stained glass was assembled in China and shipped back to Lebanon for installation. There is also a large tile mural in our building with a tile created by every student. In the performing arts, our students enjoy a well-rounded curriculum including vocal and instrumental experiences. Students look forward to performing our holiday programs each year. Because we had such a large number of parents and community members in attendance at each show (700-800), our shows have been moved to the high school for the last several years! Our students also perform for the annual 25-act talent showcase.
Science – Science, like math, is integrated into the curriculum. Problem-solving skills are applicable to the study of science are introduced early, beginning in the intermediate grades, and the curriculum is adapted to reflect current research in best practice and alignment with state standards. Although it is required for fourth graders, the Science Fair is encouraged for all students. Almost 200 students (of 385) participate each year. Judges are brought in from the community and students present their projects throughout the day. An awards program is held in the evening to a standing-room-only crowd. Top students in each grade move on to the state level. Last year a student at Central was the top winner in the state for fifth grade!
Social Studies – A variety of developmentally appropriate teaching strategies are used to teach social studies. Our school culture is based on life skills emphasizing character development. Our entire school focuses on a different character each week throughout the school year. Community resources and technology are utilized to provide students with as many first-hand experiences as possible. Lebanon is fortunate to have a beautifully renovated library filled with local Lebanon and Indiana history. Students also take study trips to the Indiana State Government Center. Central Elementary was one of a small
12
number of Indiana schools chosen to attend the inauguration of the current governor, Mitch Daniels.
Physical Education, Health, and Nutrition – All students at Central participate in weekly physical education classes by a licensed physical education teacher. Throughout the year, several events are held to promote health and wellness. Students participate in Jump Rope for Heart each February raising money for the American Heart Association. In the spring students participate in the Presidential Fitness program. Awards for outstanding performance are given each year at our annual Awards Day. One of our huge community events is Field Day held during the last week of school! Our physical education teacher works with the entire staff and almost 100 parents to create stations around the outside of the building. Each team has students from K-5 to encourage good sportsmanship.
2. Reading/English:
Philosophy: Balanced Literacy with Guided ReadingThis philosophy was chosen after we saw so many students falling through the cracks with one whole group basal lesson. Students now work in small groups at their reading level. That level may be above at or below grade level. Each child’s reading level comes from a reading record administered frequently. This measure helps a teacher to know when to move a child to a higher (or lower) group. Book sets (6-7 copies of one text) are chosen from our book room. The book room has thousands of books in plastic bags ranging from level A to level Z. The leveling system is adopted from Irene Fountas and Gay Su Pinnell.
Adopted reading series:Houghton MifflinThe adopted series is also used for whole group instruction during our 90 minute literacy block in grades K-5 alongside guided reading. This allows teachers to focus in on a common grade level skill.
Literacy Stations by Debbie DillerAll of our staff has had training with Debbie Diller on implementing literacy stations while other students are involved in guided reading groups with the teacher. The stations provide additional skill development and can be tailored to a specific group of students, such as high ability/gifted.
We employ several tools for struggling readers. Students are identified by our assessments (Developmental Reading Assessment/Curriculum Based Measures/Running Records) are being in the green, yellow, or red area. Students in the red area are considered struggling and receive additional resources through Response to Instruction/Intervention (RTI). One of our most successful programs has been iStation, a computer based intervention program. The program monitors student growth and shows clearly when a child has progressed out of the red area. Most students spend 15 minutes a day on this program as an intervention. This program addresses all five areas of reading and provides teachers with progress monitoring results. This program was developed by the nation’s top reading specialists and utilizes effective instructional activities via the computer and printable worksheets. The program administers a test in all five areas of reading to establish baseline scores and to identify targeted areas for intervention. The student then participates in computerized activities at school that address the area of need and completes printable worksheet activities with educators or family members.
3. Mathematics:
Adopted math series: Everyday Math (University of Chicago)Everyday Math has made a tremendous difference in our math achievement. Students and teachers have found the program to be challenging and the pace rigorous. The first year of the program (six years ago) was an adjustment for parents, students, and teachers. We even held parent nights to talk about the shift in philosophy. Everyday Math is much more conceptual and less computational. Our students were not used to explaining HOW they arrived at an answer. They could give the right answer but needed to know the process to solve more advanced problems. Each year we saw our math scores improve on the state standardized test (ISTEP+) as students were using Everyday Math more.
13
Accelerated Math (Renaissance Learning) – Every student receives a whole group math lesson at grade level with Everyday Math. Each student also receives math instruction at an individualized level with Accelerated Math. Central Elementary students spend a minimum of 90 minutes a day engaged in math just as in literacy instruction. We have found this balance to be a key to our success. Parents volunteer to come each week and help with conferencing. A student conference with an adult each time they miss a problem. This allows reteaching and monitoring of how the child is doing. The classroom teacher also monitors the pace that students are working using the online tools from Acc Math. The mantra at Central is, “Every student scans every day” – meaning that each student must progress through objectives daily. Scanning is the way the teacher and the computer monitor daily progress. This program is equally helpful with students working below grade level.
At the start of each day, students work on a Daily Math Review (DMR). This is a worksheet with six problems addressing the six main core standards in math for that grade level. This helps teachers pinpoint an area that a specific student may be struggling.
We have recently purchased memberships for all students to IXL.com. This is an amazing website that allows students to work at any grade level in math. Students are rewarded for the amount of work that they do on the program at home, too. Students find the program entertaining and teachers find it effective in improving student math achievement!
4. Additional Curriculum Area:
Science is a strong focus at Central Elementary for many reasons. The main reasons are problem-solving and critical thinking embedded in the lessons. We feel that so many of these skills are transferable to other areas of life. The central theme in our school’s mission is being a lifelong learner.
Curriculum Mapping - Our district has been working on curriculum mapping for a few years. The first map that we are doing K-12 is science. We are focusing on essential questions and not on disconnected facts. Students will be focused on some of the same essential questions from K-12 building on their knowledge base. Here are some essential questions that we are focusing on: Why is it important to communicate and analyze data? What is the BEST way to record and communicate data? How can using a process help answer questions?
Hands On Lessons – Our teachers believe that science isn’t learned out of a book. It is learned by discovery and trial/error. Children enjoy learning for themselves. Science allows that time to explore. We have found that the new SmartBoards have helped students simulate some experiments that are too costly or dangerous to do in the classroom. They even enjoy dissecting the frog on the SmartBoard!
Science Fair – At Central Elementary, the science fair is a HUGE annual event! Students participate in grades K-5 (even though our state doesn’t allow kindergarten students to go on to regionals). The science fair is optional in all grades but fourth grade. Fourth grade is the year that students are to master the scientific process so the science fair is mandatory. The science fair is a community event! We have 12 judges ranging from retired science teachers to scientists in industry to local celebrities. There is standing room only in the evening when the trophies are handed out!! We choose an Honorable Mention, Second Place, and First Place winners at each grade level. There is also a Grand Champion and Reserve Grand Champion for the school. Last year, one of our students won first place for the state in fifth grade.
5. Instructional Methods:
At Central Elementary varied, differentiated instruction allows teachers to meet a range of needs in the classroom. Teachers adapt instruction to fit student learning style through multiple intelligences and the use of technology while remaining cognizant of student progress toward academic goals and standards. The following are examples of how instruction supports student weaknesses by appealing to student strengths and interests.
14
There are many school-wide examples of the use of multiple intelligences in the classroom through hands-on learning. For example word smart, tactile learners in the primary grades practice their spelling and vocabulary words with magnetic letters, while kinesthetic learners use a mat to step on each letter as he/she spells. In the upper grades, students make vocabulary flash cards with pictures and phrases or play ‘I Have, Who Has’ to practice their words and definitions. Singing songs is universal across the curriculum for learners of all ages, and appeals to music minded, auditory learners. For more abstract content such as science, primary learners construct their body parts on a paper bag vest to learn to about their organs, their placement, and their purpose through their songs and models, while bodily kinesthetic learners in the upper elementary benefit from creating human models of the sun, Earth, and moon to support understanding their relationships in space. When students are engaged and focused, they become an active part of the learning process.
Students are growing up with technology and responding positively when integrating it into daily academic learning. Technology integration is increasing, and it supplements many aspects of learning at all levels in the elementary. Central Elementary students benefit from multi-leveled instruction using the Accelerated Math program, which empowers students to grade their independent work with a scanner for immediate feedback and progress at their individual learning pace. Accelerated Reader, a sister program, allows students to read a story and test their comprehension on the computer. Students at all levels also benefit from the use of many websites – purchased subscriptions, websites linked to text book purchases, and free internet based websites – that align with state standards across the curriculum. At the primary level, students use computers daily in centers to support their language skill acquisition. In the upper elementary, technology – such as Microsoft Office tools, video/digital recorders, and cassette recorders – inspires creativity and meaningful learning for projects and skill application.
6. Professional Development:
Indiana eliminated professional development release time two years ago and professional development money a year ago. Even though this created an initial hardship, it did teach us some important lessons about what true professional development should look like in schools. We now have teachers sharing successful strategies from their classroom. Our teacher contract time is 8 a.m.-4 p.m. Students do not enter the building until 8:55 a.m. so we are able to do professional development at our building during that 8-8:55 a.m. time each day.
Teachers are sharing resources that they have learned from any conferences they were able to attend. Not having “traditional sage on the stage” staff development has actually been a blessing in disguise. Teachers have learned how much talent is in our OWN staff. Teachers comment that having professional development within our building allows for immediate application and support when needed. This morning we had a teacher share on instructional strategies using our Acuity assessment. Another teacher spoke about using picture books to teach reading skills in the upper grades. She shared handouts from a gifted conference she attended for the district. Teachers were very engaged!
The district and school’s professional development activities support student learning and are aligned with academic standards. For the past several years, our district has done intensive work with Heidi Hayes Jacobs and Janet Hale on curriculum mapping. Administrators and teachers have worked together throughout the summer and during the school year with stimulus funds. This has been successful mainly because teachers are being given the time to work together. Teachers develop and analyze lessons and assessments. One of the biggest disadvantages of our current teaching culture is isolation. Teachers are not encouraged and supported to work in a collaborative environment, so having all K-12 students in Lebanon engaged in lesson development and assessment is already making a difference. Teachers consistently communicate between buildings more now because those RELATIONSHIPS are being built and supported.
15
7. School Leadership:
*Central Elementary had seven principals in the nine years prior to our current principal hired in 2001.
Principal leadership at Central Elementary centers on relationships. There is a mutual respect between the principal and the staff. Staff members are not treated differently whether principal, custodian, teacher, or instructional assistant. Everyone is valued as a key person in the success of each child.
School leadership is about relationships. That sounds simple, but it is incredibly complicated. A school principal must keep a productive relationship with: students, staff, parents, other principals in the district, school board members, superintendent and assistants, building/grounds, transportation department, community newspaper, court system, child protective, family services, local churches, local businesses, etc. Keeping all of these relationships in balance requires constant communication, even if it is “just checking in” to be sure relationships are still positive.
How do I ensure that the following focus on improving student achievement?• Policies – A principal deals with a constant change in policies. I sit in district meetings every week listening to changes. During each meeting, I think about how these changes will impact Central Elementary. I speak out when the changes proposed do not match the goal of student achievement. This can often be very difficult especially when dealing with other schools which have different needs.• Programs – There are many programs that are proposed to school principals. One such proposal was for a free after school program (Afterschool ROCKS) for grades 4-5. The program focused on making good life choices and avoiding drugs/alcohol. This is a great opportunity for students so we moved forward.
(Parent of Special Needs Children) Central Elementary is a wonderful provider of education, leadership, and has a successful system in place for children with special needs. I have two children diagnosed with ADHD. When my eldest child started kindergarten, we knew there were behavior issues that needed to be dealt with. The principal met with me and together we developed a goal-oriented plan to help my daughter succeed. I know when it was time to place my child in a class for the next year, they took into consideration my daughter’s needs and made sure she had the teacher that best suited her learning style. Today, my son is at Central Elementary, dealing with the same issues. Once again, the principal and staff have shown exemplary support and experience in dealing with a child with ADHD. Overall, I do believe Central Elementary is a fantastic example of what a Blue Ribbon school should provide; not only a great education, but they support the students emotionally. With this, they also support parents and their needs.
16
PART VII - ASSESSMENT RESULTS
STATE CRITERION-REFERENCED TESTS Subject: Mathematics Grade: 3 Test: ISTEP+ Math Edition/Publication Year: (See Notes) Publisher: CTB McGraw-Hill
2009-2010 2008-2009 2007-2008 2006-2007 2005-2006
Testing Month May May Sep Sep Sep
SCHOOL SCORES
Pass and Pass Plus 92 92 86 81 86
Pass Plus 39 43 12 28 15
Number of students tested 61 61 59 54 65
Percent of total students tested 100 97 100 100 100
Number of students alternatively assessed 3
Percent of students alternatively assessed 5
SUBGROUP SCORES
1. Free/Reduced-Price Meals/Socio-economic Disadvantaged Students
Pass and Pass Plus 75 79 86 67 91
Pass Plus 33 14 7 11 9
Number of students tested 12 14 15 9 11
2. African American Students
Pass and Pass Plus
Pass Plus
Number of students tested
3. Hispanic or Latino Students
Pass and Pass Plus 100
Pass Plus 0
Number of students tested 1
4. Special Education Students
Pass and Pass Plus 75 78 56 53 55
Pass Plus 33 11 11 12 18
Number of students tested 12 9 9 17 11
5. English Language Learner Students
Pass and Pass Plus
Pass Plus
Number of students tested
6. White
Pass and Pass Plus 92 92 86 88 87
Pass Plus 40 42 10 30 16
Number of students tested 60 59 58 50 61
NOTES: The tests for 2009 and 2010 were published in 2009. The tests for 2005 through 2008 were published in 2005. The alternative test in 2010 is IMAST. It was developed by CTB McGraw-Hill working with IDOE. It has been approved as part of the State of Indiana's AYP program. The test measures the same Academic Standards as the ISTEP+, but simplifies the language.
11IN4
17
STATE CRITERION-REFERENCED TESTS Subject: Reading Grade: 3 Test: ISTEP+ Eng/LA Edition/Publication Year: (See Notes) Publisher: CTB McGraw-Hill
2009-2010 2008-2009 2007-2008 2006-2007 2005-2006
Testing Month May May Sep Sep Sep
SCHOOL SCORES
Pass and Pass Plus 93 92 83 89 82
Pass Plus 16 26 12 24 12
Number of students tested 61 61 59 54 65
Percent of total students tested 100 97 100 100 100
Number of students alternatively assessed 4
Percent of students alternatively assessed 7
SUBGROUP SCORES
1. Free/Reduced-Price Meals/Socio-economic Disadvantaged Students
Pass and Pass Plus 81 71 73 91
Pass Plus 0 0 7 9
Number of students tested 21 14 15 11
2. African American Students
Pass and Pass Plus
Pass Plus
Number of students tested
3. Hispanic or Latino Students
Pass and Pass Plus
Pass Plus
Number of students tested
4. Special Education Students
Pass and Pass Plus 67 45
Pass Plus 8 0
Number of students tested 12 11
5. English Language Learner Students
Pass and Pass Plus
Pass Plus
Number of students tested
6.
Pass and Pass Plus
Pass Plus
Number of students tested
NOTES: The tests for 2009 and 2010 were published in 2009. The tests for 2005 through 2008 were published in 2005. The alternative test in 2010 is IMAST. It was developed by CTB McGraw-Hill working with IDOE. It has been approved as part of the State of Indiana's AYP program. The test measures the same Academic Standards as the ISTEP+, but simplifies the language.
11IN4
18
STATE CRITERION-REFERENCED TESTS Subject: Mathematics Grade: 4 Test: ISTEP+ Math Edition/Publication Year: (See Notes) Publisher: CTB McGraw-Hill
2009-2010 2008-2009 2007-2008 2006-2007 2005-2006
Testing Month May May Sep Sep Sep
SCHOOL SCORES
Pass and Pass Plus 93 94 90 88 77
Pass Plus 45 41 33 28 20
Number of students tested 60 64 58 58 69
Percent of total students tested 97 98 100 100 99
Number of students alternatively assessed 2
Percent of students alternatively assessed 3
SUBGROUP SCORES
1. Free/Reduced-Price Meals/Socio-economic Disadvantaged Students
Pass and Pass Plus 91 94 79
Pass Plus 18 41 21
Number of students tested 11 17 14
2. African American Students
Pass and Pass Plus
Pass Plus
Number of students tested
3. Hispanic or Latino Students
Pass and Pass Plus
Pass Plus
Number of students tested
4. Special Education Students
Pass and Pass Plus 73 47
Pass Plus 18 7
Number of students tested 11 15
5. English Language Learner Students
Pass and Pass Plus
Pass Plus
Number of students tested
6.
Pass and Pass Plus
Pass Plus
Number of students tested
NOTES: The tests for 2009 and 2010 were published in 2009. The tests for 2005 through 2008 were published in 2005. The alternative test in 2010 is IMAST. It was developed by CTB McGraw-Hill working with IDOE. It has been approved as part of the State of Indiana's AYP program. The test measures the same Academic Standards as the ISTEP+, but simplifies the language.
11IN4
19
STATE CRITERION-REFERENCED TESTS Subject: Reading Grade: 4 Test: ISTEP+ Eng/LA Edition/Publication Year: (See Notes) Publisher: CTB McGraw HIll
2009-2010 2008-2009 2007-2008 2006-2007 2005-2006
Testing Month May May Sep Sep Sep
SCHOOL SCORES
Pass and Pass Plus 93 92 86 88 83
Pass Plus 23 17 19 7 12
Number of students tested 60 64 58 58 69
Percent of total students tested 97 98 100 100 99
Number of students alternatively assessed 2
Percent of students alternatively assessed 3
SUBGROUP SCORES
1. Free/Reduced-Price Meals/Socio-economic Disadvantaged Students
Pass and Pass Plus 91 82 64
Pass Plus 9 29 14
Number of students tested 11 17 14
2. African American Students
Pass and Pass Plus
Pass Plus
Number of students tested
3. Hispanic or Latino Students
Pass and Pass Plus
Pass Plus
Number of students tested
4. Special Education Students
Pass and Pass Plus 64 53
Pass Plus 7 7
Number of students tested 11 15
5. English Language Learner Students
Pass and Pass Plus
Pass Plus
Number of students tested
6.
Pass and Pass Plus
Pass Plus
Number of students tested
NOTES: The tests for 2009 and 2010 were published in 2009. The tests for 2005 through 2008 were published in 2005. The alternative test in 2010 is IMAST. It was developed by CTB McGraw-Hill working with IDOE. It has been approved as part of the State of Indiana's AYP program. The test measures the same Academic Standards as the ISTEP+, but simplifies the language.
11IN4
20
STATE CRITERION-REFERENCED TESTS Subject: Mathematics Grade: 5 Test: ISTEP+ Math Edition/Publication Year: (See Notes) Publisher: CTB McGraw-Hill
2009-2010 2008-2009 2007-2008 2006-2007 2005-2006
Testing Month May May Sep Sep Sep
SCHOOL SCORES
Pass and Pass Plus 98 92 88 88 91
Pass Plus 66 48 40 34 45
Number of students tested 65 60 65 67 67
Percent of total students tested 94 98 97 100 100
Number of students alternatively assessed 1
Percent of students alternatively assessed 2
SUBGROUP SCORES
1. Free/Reduced-Price Meals/Socio-economic Disadvantaged Students
Pass and Pass Plus 100 86 75 54 100
Pass Plus 53 14 19 23 20
Number of students tested 19 14 16 13 10
2. African American Students
Pass and Pass Plus
Pass Plus
Number of students tested
3. Hispanic or Latino Students
Pass and Pass Plus
Pass Plus
Number of students tested
4. Special Education Students
Pass and Pass Plus 100 60 53 64
Pass Plus 20 10 12 27
Number of students tested 10 10 17 11
5. English Language Learner Students
Pass and Pass Plus
Pass Plus
Number of students tested
6.
Pass and Pass Plus
Pass Plus
Number of students tested
NOTES: The tests for 2009 and 2010 were published in 2009. The tests for 2005 through 2008 were published in 2005. The alternative test in 2010 is IMAST. It was developed by CTB McGraw-Hill working with IDOE. It has been approved as part of the State of Indiana's AYP program. The test measures the same Academic Standards as the ISTEP+, but simplifies the language.
11IN4
21
STATE CRITERION-REFERENCED TESTS Subject: Reading Grade: 5 Test: ISTEP+ Eng/LA Edition/Publication Year: (See Notes) Publisher: CTB McGraw-Hill
2009-2010 2008-2009 2007-2008 2006-2007 2005-2006
Testing Month May May Sep Sep Sep
SCHOOL SCORES
Pass and Pass Plus 91 87 85 87 93
Pass Plus 22 20 3 13 27
Number of students tested 65 60 65 67 67
Percent of total students tested 96 100 100 100 100
Number of students alternatively assessed 2
Percent of students alternatively assessed 3
SUBGROUP SCORES
1. Free/Reduced-Price Meals/Socio-economic Disadvantaged Students
Pass and Pass Plus 79 71 75 62 80
Pass Plus 21 14 0 8 20
Number of students tested 19 14 16 13 10
2. African American Students
Pass and Pass Plus
Pass Plus
Number of students tested
3. Hispanic or Latino Students
Pass and Pass Plus
Pass Plus
Number of students tested
4. Special Education Students
Pass and Pass Plus 50 40 65 73
Pass Plus 0 0 0 9
Number of students tested 10 10 17 11
5. English Language Learner Students
Pass and Pass Plus
Pass Plus
Number of students tested
6.
Pass and Pass Plus
Pass Plus
Number of students tested
NOTES: The tests for 2009 and 2010 were published in 2009. The tests for 2005 through 2008 were published in 2005. The alternative test in 2010 is IMAST. It was developed by CTB McGraw-Hill working with IDOE. It has been approved as part of the State of Indiana's AYP program. The test measures the same Academic Standards as the ISTEP+, but simplifies the language.
11IN4
22
STATE CRITERION-REFERENCED TESTS Subject: Mathematics Grade: 0
2009-2010 2008-2009 2007-2008 2006-2007 2005-2006
Testing Month May May Sep Sep Sep
SCHOOL SCORES
Pass and Pass Plus 95 92 87 86 85
Pass Plus 51 43 29 30 27
Number of students tested 186 185 182 179 201
Percent of total students tested 96 100 100 100 99
Number of students alternatively assessed 8
Percent of students alternatively assessed 4
SUBGROUP SCORES
1. Free/Reduced-Price Meals/Socio-economic Disadvantaged Students
Pass and Pass Plus 88 82 78 67 73
Pass Plus 31 24 18 17 10
Number of students tested 51 45 45 30 30
2. African American Students
Pass and Pass Plus
Pass Plus
Number of students tested
3. Hispanic or Latino Students
Pass and Pass Plus
Pass Plus
Number of students tested
4. Special Education Students
Pass and Pass Plus 84 43 60 64 54
Pass Plus 23 14 11 12 16
Number of students tested 31 21 27 33 37
5. English Language Learner Students
Pass and Pass Plus
Pass Plus
Number of students tested
6.
Pass and Pass Plus
Pass Plus
Number of students tested
NOTES: The tests for 2009 and 2010 were published in 2009. The tests for 2005 through 2008 were published in 2005. The alternative test in 2010 is IMAST. It was developed by CTB McGraw-Hill working with IDOE. It has been approved as part of the State of Indiana's AYP program. The test measures the same Academic Standards as the ISTEP+, but simplifies the language.
11IN4
23
STATE CRITERION-REFERENCED TESTS Subject: Reading Grade: 0
2009-2010 2008-2009 2007-2008 2006-2007 2005-2006
Testing Month May May Sep Sep Sep
SCHOOL SCORES
Pass and Pass Plus 93 90 85 88 86
Pass Plus 20 21 11 15 22
Number of students tested 186 185 182 179 201
Percent of total students tested 96 99 96 100 99
Number of students alternatively assessed 8
Percent of students alternatively assessed 4
SUBGROUP SCORES
1. Free/Reduced-Price Meals/Socio-economic Disadvantaged Students
Pass and Pass Plus 82 76 71 70 73
Pass Plus 10 16 7 7 10
Number of students tested 51 45 45 30 30
2. African American Students
Pass and Pass Plus
Pass Plus
Number of students tested
3. Hispanic or Latino Students
Pass and Pass Plus
Pass Plus
Number of students tested
4. Special Education Students
Pass and Pass Plus 68 43 41 64 57
Pass Plus 23 5 4 12 5
Number of students tested 31 21 27 33 37
5. English Language Learner Students
Pass and Pass Plus
Pass Plus
Number of students tested
6.
Pass and Pass Plus
Pass Plus
Number of students tested
NOTES: The tests for 2009 and 2010 were published in 2009. The tests for 2005 through 2008 were published in 2005. The alternative test in 2010 is IMAST. It was developed by CTB McGraw-Hill working with IDOE. It has been approved as part of the State of Indiana's AYP program. The test measures the same Academic Standards as the ISTEP+, but simplifies the language.
11IN4
24