Embed Size (px)
Citation preview
8/15/2019 BPA aptamer
http://slidepdf.com/reader/full/bpa-aptamer 1/5
Ultrasensitive one-step rapid visual detection of bisphenol A in watersamples by label-free aptasensor
Zhanlong Mei a,1, Huaqin Chu a,b,1, Wei Chen a,n, Feng Xue a, Jian Liu a, Huaneng Xu b,Rui Zhang a, Lei Zheng a,n
a School of Biotechnology & Food Engineering, Key Lab of Food Nutrition & Safety of Anhui Province, Hefei University of Technology, Hefei 230009, PR Chinab School of Food Science & Technology, State Key Lab of Food Science & Technology, Jiangnan University, Wuxi 200234, PR China
a r t i c l e i n f o
Article history:
Received 14 May 2012
Received in revised form
12 June 2012
Accepted 14 June 2012Available online 1 July 2012
Keywords:
Gold nanoparticles
BPA detection
Aptamer
Label-free
Food safety
a b s t r a c t
A simple, one-step, rapid method to detect bisphenol A (BPA) using a label-free aptasensor is presented.
A high selective anti-BPA aptamer was added to gold nanoparticles (GNPs) to prepare the label-free
aptasensor for BPA, which maintains good tolerance of GNPs under aqueous conditions with high salt
concentrations. With the presence of BPA in the aptasensor system, the GNPs would aggregate by
competitive binding of BPA and aptamer. Detection results can be visualized by the aggregation-induced
color change of GNPs without the use of any instrumentation. The limit of visual detection (LOD) was
found to be 0.1 ng/mL by naked-eye observation, which was competitive to some current rapid BPA
detection methods, even some instrumental based methods. Besides the obvious advantages, including
reduced detection time and operation procedures, the results of this method meet the various detection
requirements for BPA and are comparable to the traditional ELISA and instrument-based methods. The
proposed one-step, label-free method was successfully used to determine BPA in actual water samples.
Crown Copyright & 2012 Published by Elsevier B.V. All rights reserved.
1. Introduction
Bisphenol A (BPA) is a widely used chemical and raw material for
epoxy resin, flame retardants and polycarbonate in plastic and paper
industries (Alonso-Magdalena et al., 2010; Bailin et al., 2008). Since
the first discovery of the release of BPA from polycarbonate bottle at
high temperature and pressures, greater attention has been paid to
research on BPA toxicity ( Jensen et al., 1995; Sharp et al., 1993).BPA is
currently regarded as an environmental endocrine disrupting chemi-
cal (EDC) that is potentially estrogenic. Data from multiple sources
indicate that the amount of PBA to which humans are exposed may
cause adverse health effects (Vandenberg et al., 2010). Moreover, in
adults, urinary BPA concentrations are positively associated with
cardiovascular disease, diabetes and impaired reproductive capacity.Recent in vivo and in vitro animal studies have documented that even
exposure to very low concentrations of BPA can significantly affect
cell proliferation and health, with the maximal effect at approxi-
mately 1010–108 M (Salian et al., 2011; Sheng and Zhu, 2011).
Meanwhile, researches also demonstrate that BPA can cause effect in
animal models at doses in the range of human exposures, indicating
that it can act at lower doses than predicted from some in vitro and
in vivo assays (Rechter et al., 2007; Vandenberg et al., 2007; Wetherill
et al., 2007). Thus, ultrasensitive and rapid detection of BPA in food
samples and food containers is of great importance for assuring
human health. In particular, for drinking water, BPA released from the
plastic packages or cups should be accurately monitored on-site for
food safety (Hengstler et al., 2011; Vandenberg et al., 2007).
Various conventional instrument-based methods have been
widely adopted for detection of BPA, including high pressure
liquid chromatography (HPLC) (Inoue et al., 2000; Watabe et al.,
2004), liquid chromatography (LC) (Zafra-Gomez et al., 2008), and
gas chromatography coupled with mass spectrometry (GC–MS)
(Kawaguchi et al., 2004). Samples must be pretreated adequately
to improve the evaporative ability of the analyte in GC-based
analytical methods, which is complicated and prone to pretreat-ment error. It has been reported that BPA can be detected by a
standard HPLC system with LOD of 200 ng/mL in European Union
and with a LOD of 0.04 ng/mL using a fluorescent detector
(Kuroda et al., 2003). However, all of these instruments are
expensive, have strict sample preparation requirements and
require trained operators. Immunoassay-based methods have also
attracted considerable attention for BPA detection due to the high
sensitivity and comparable low costs of these techniques
(Freymuth et al., 1986; Kim et al., 2007; Zhao et al., 2002;
Zheng et al., 2008). Determinations with immunoassay-based
methods, however, are strongly dependent on the quality of the
prepared antibody, while there have been some reports about
Contents lists available at SciVerse ScienceDirect
journal homepage: w ww.elsevier.com/locate/bios
Biosensors and Bioelectronics
0956-5663/$- see front matter Crown Copyright & 2012 Published by Elsevier B.V. All rights reserved.
http://dx.doi.org/10.1016/j.bios.2012.06.027
n Corresponding authors. Tel./fax: þ86 551 2919396.
E-mail addresses: [email protected],
[email protected] (W. Chen), [email protected] (L. Zheng).1 These two authors contributed equally to this paper.
Biosensors and Bioelectronics 39 (2013) 26–30
8/15/2019 BPA aptamer
http://slidepdf.com/reader/full/bpa-aptamer 2/5
nonspecific binding to the analogs, such as Bisphenol B (BPB) and
4,4-Bis-(4-hydroxyphenyl) valeric acid (Marchesini et al., 2005;
Ohkuma et al., 2002). Besides, according to the recent published
review about monitoring BPA in different biological samples
including urine, serum, saliva and tissue etc., even some of the
instrumental based methods and ELISA methods could not meet
the requirements of risk assessments of BPA at low levels
(Vandenberg et al., 2010). Thus, developing new, rapid, field-
deployable methods for BPA detection with high sensitivity andspecificity is of great importance for food safety and human
health.
Aptamers have received much attention since the first reports
on selection by both Ellington and Szostak (1990) and Tuerk and
Gold (1990). Aptamers screened by the classic systematic evolu-
tion of ligands by exponential enrichment (SELEX) technique have
the inherent characteristics of a high association constant, high
specificity, easy production and modification, cost-effectiveness
and stability (Xu et al., 2009). Aptamers, a potential replacement
probe for antibodies in the field of analytical science, have been
widely used for the development of novel detection methods.
Extensive research has been conducted using aptamer as recogni-
tion probes for different targets, including metal ions, organic
molecules, peptides, proteins and even whole cells (Bang et al.,
2005; Ho and Leclerc, 2004; Huang et al., 2005; Lin et al., 2006;
Stojanovic and Landry, 2002; Wilson and Szostak, 1999). To the
best of our knowledge, however, there is still no report on the use
of an aptamer probe for rapid, in-field BPA detection.
Herein, we present a one-step, rapid, label-free aptasensor for
BPA detection. The colorimetric detection results were visible to
the naked eye without the assistance of any instrumentation.
More importantly, the sensitivity of this one-step, label-free
aptasensor is comparable to that of the traditional ELISA and
some instrument-based methods, which is of great importance
for the current BPA risk assessments through the toxicokinetic
models. This label free BPA aptasensor is inexpensive, less time-
consuming, easy to operate and will likely facilitate sensitive, on-
site detection of BPA.
2. Materials and methods
2.1. Chemicals
Bisphenol A (BPA) was purchased from J&K Chemical Com-
pany, Shanghai. Chloroauric acid (HAuCl4) and sodium citrate
were obtained from Sigma-Aldrich, USA. Other normal chemicals,
including sodium chloride (NaCl), disodium hydrogen phosphate
(Na2HPO4) and monosodium phosphate (NaH2PO4), were all
purchased from Shanghai Chemical Reagents Company (Shanghai,
China). Anti-BPA aptamer was synthesized by Shengon Biotech-
nology Co. Ltd. (Shanghai, China). The sequence of the BPA was
designed as 5–CCG GTG GGT GGT CAG GTG GGA TAG CGT TCCGCG TAT GGC CCA GCG CAT CAC GGG TTC GCA CCA–3 according
to reported studies ( Jo et al., 2011). Millipore Milli-Q ultrapure
(418 MO) water was used throughout the whole research.
Actual water samples were taken from the tap water in our
laboratory and Caohu Lake in Anhui province, China. The UV–vis
spectra were measured with a UV 5100 spectrophotometer
(Wanyi Science & Technology Co. Ltd., Hefei, China).
2.2. Methods
Gold nanoparticles were prepared by the traditional chemical
reduction methods. Briefly, 0.1% chloroauric acid solution was
added to a flask and heated until boiling. Sodium citrate was
subsequently added quickly to the boiling solution. An obvious
color change of the reaction mixture was observed from trans-
parent to dark blue and finally wine red. The mixture was further
boiled for another 5 min and cooled to room temperatures.
Different amounts of sodium citrate solutions were added in the
process of preparation to obtain GNPs with various diameters.
The GNPs were subsequently cultured with anti-BPA aptamer
for 15 min and purified by centrifugation at the speed of
10,000 rpm for 5 min to obtain the aptamer-protected GNPs. To
test the salt tolerance of aptamer-protected GNPs, sodium chlor-ide (NaCl) solutions at different concentrations were added to the
aptamer–GNP solutions. The optimal concentration of NaCl was
defined as the highest concentration of NaCl which did not induce
the aggregation of aptamer–GNPs.
For BPA detection, anti-BPA aptamer was initially added to
form the GNP–aptamer complex, followed by addition of a NaCl
solution at a certain concentration. Subsequently, BPA standard
solutions at different concentrations were added to different
aliquots of aptamer–GNPs/NaCl solutions and cultured for
another 15 min. The qualitative results were visually determined
by naked-eye observation while the quantitative results were
obtained by measurements of UV–vis spectra.
3. Results and discussions
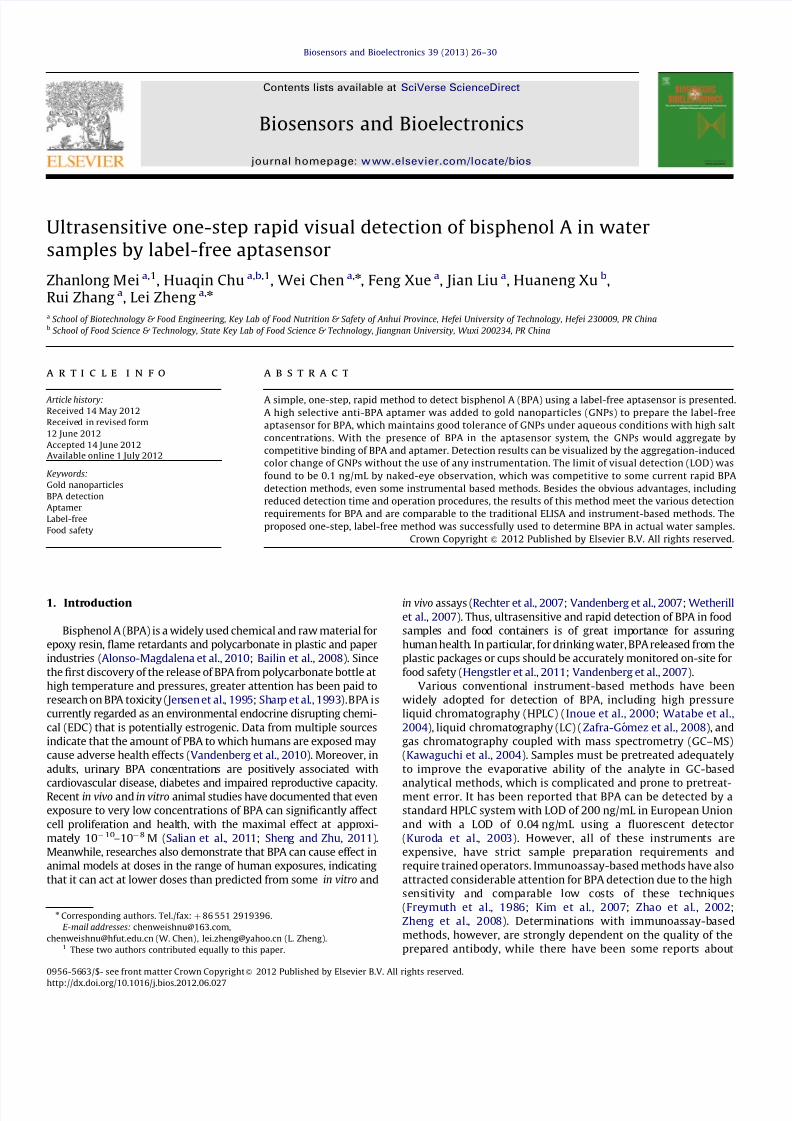
A schematic of the sensing principle is shown in Fig. 1. It is
easy to understand that salt solutions at high concentrations
could induce GNP aggregation by the electrostatic screening
effect. Visually, the color of the GNP solution changes from wine
red to blue during the aggregation. Moreover, the characteristic
plasmon peak of GNPs, which is very sensitive to the diameter of
GNPs in the solution, changes accordingly. Following this rule,
considering the sensitivity of the method, GNPs with the strong
surface plasmon signal, which is highly related to the size of
prepared gold nanoparticles, and the color variation under the
condition of BPA induced aggregations should be chosen as the
optimal indicator (See size optimization result in Fig. S2). In thisresearch, GNPs with the diameter of about 18 nm were adopted
(TEM image shown in Fig. S1). The intensity of GNP aggregation
can be analyzed from the variations in the plasmon peak;
a principle upon which many methods are based (Li et al., 2010;
Liu et al., 2011). We have previously reported on a colorimetric
method for melamine detection based on plasmon peak varia-
tions (Kuang et al., 2011). Herein, we first used an anti-BPA
aptamer to protect GNPs and enhance their salt tolerance. Then,
BPA was added to the protected-GNPs system to competitively
Fig. 1. Schematic diagram of rapid label-free BPA detection.
Z. Mei et al. / Biosensors and Bioelectronics 39 (2013) 26 –30 27
8/15/2019 BPA aptamer
http://slidepdf.com/reader/full/bpa-aptamer 3/5
bind with the aptamer due to the stronger affinity effects includ-
ing the electrostatic effect, hydrogen bond effect, and spatial
matching effect etc. ( Jo et al., 2011), which decreases salt
tolerance. In the presence of high salt concentration, the GNPs
re-aggregate and cause a color change in the detection system.
Finally, the relationship between BPA concentrations and varia-
tions of the plasmon peak can be developed, making both
qualitative and quantitative detection of BPA possible.
We first tested the salt tolerance of the prepared pure GNPs asa control. The images of the GNPs solution demonstrate what
happens in the presence of increased NaCl concentrations (see
details in Fig. S3). Only 10 mM NaCl induced GNP aggregation (Fig.
S3). After culturing with the aptamer solution, the salt tolerance
was greatly enhanced and GNP aggregation was not observed until
the NaCl concentration reached 40 mM (Fig. S4). From this result,
we can confirm that the ssDNA aptamer is indeed adsorbed onto
the surface of GNPs and protects the stability of GNPs under
conditions of high salt concentrations. It should be pointed out
that the concentration of the salt solution also needs to be
optimized for improvement of sensitivity. For one thing, the
higher concentration of used salt solution is good for the improve-
ment of sensitivity. For the other, higher concentration of used salt
solution would decrease the stability of intra-assay and reprodu-
cibility of the sensing system. Of note, due to the pretreatment of
aptamer protected gold nanoparticles with centrifugation, residue
citrate was not considered for the optimization of the detection.
Thus, 15 mM NaCl was adopted as the suitable concentration for
further experiments in this research. Besides, the ratio between
gold nanoparticles and aptamer could affect the final sensitivity.
Too many aptamers in the sensing system would sacrifice the
sensitivity while too few would decrease the stability of the
sensing system (see details of the gold nanoparticle/aptamer ratio
results in Fig. S5). 0.05 mM aptamer (final concentration) in the
100 mL 40 nM gold nanoparticle was adopted for following BPA
detection. Meanwhile, we also confirmed the effect of BPA to the
aggregation of gold nanoparticles as the control (Fig. S6). BPA at
different concentrations was added into the pure gold nanoparti-
cle solution and cultured for 15 min. From the results shown inFig. S6, it is found that the color of the gold nanoparticles is not
changed under the condition of added BPA at the concentration
from 0.01 to 10,000 ppb when compared with blank sample.
Therefore, we could confirm that the GNPs aggregation is not
induced by the existence of BPA.
Then, under optimized conditions, BAP standard stock solu-
tions at different concentrations were added to the aptamer-GNPs
solutions. After culturing for approximately 5 min, the sensing
results were first determined by naked-eye observation and then
further quantified by measurements of UV–vis spectra. As shown
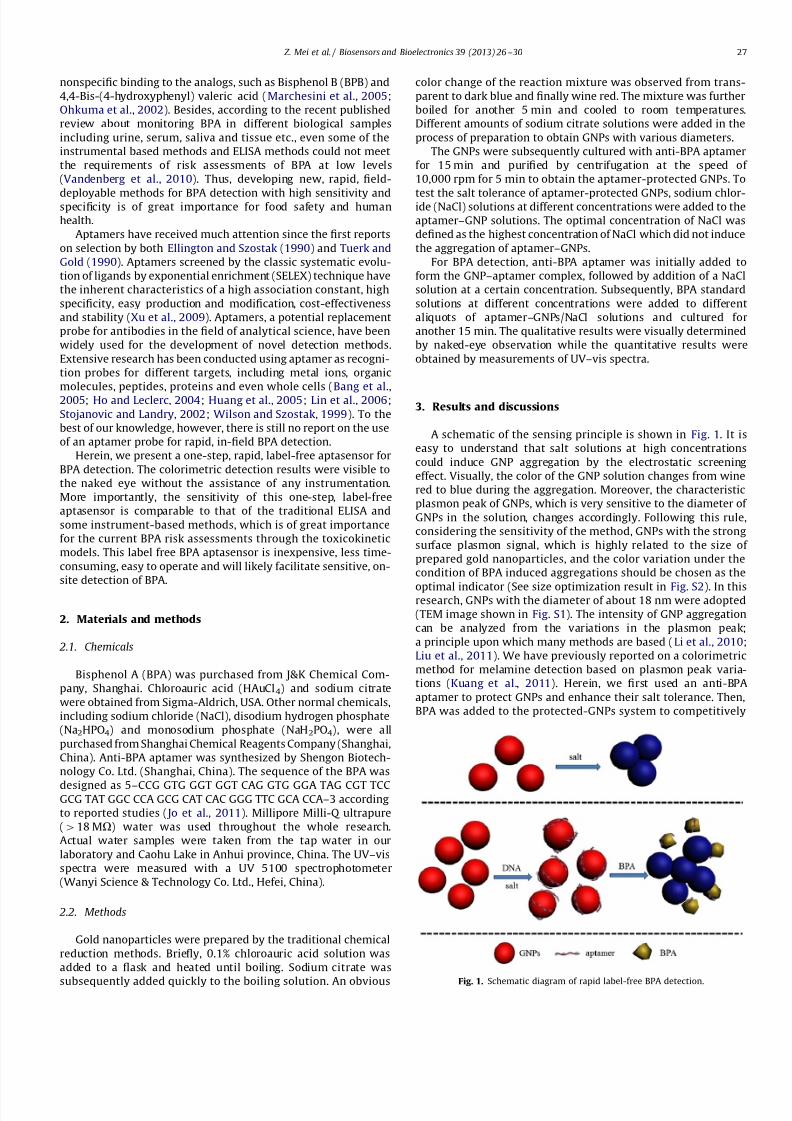
in Fig. 2, there was an obvious color change due to the addition of
BPA. More importantly, we found that only 0.01 ng/mL (ppb) BPA
in the detection system could induce a distinguishable color
change from red to slightly purple compared with a blank sample.
With an increase in the concentration of added BPA in the
detection system, the color changed to purple at 1 ng/mL, a dark
purple at 50 ng/mL and to blue at concentrations higher than
100 ng/mL. The following two aspects can be surmised from these
results. First, the addition of BPA induces the aggregation by
competitive binding with the aptamer. Second, 0.1 ng/mL is the
visual limit of detection (visual LOD) of this label-free aptasensorby naked-eye observation, which is much lower than the Chinese
Standard requirement of 50 ng/mL (the red dashed rectangle in
Fig. 2). The reason for the color change could be explained as
previously described. Namely, the added BPA could competitively
bind with the aptamer and induce the release of aptamer from the
surface of GNPs, which decreases the salt tolerance of GNPs and,
in turn, induces GNPs aggregation.
To further demonstrate the competitive binding of aptamer with
BPA in the detection system, some additional characterization was
carried out. It is well known that the conjugation constant of
aptamer is stronger than that of antibody and nonspecific adsorption
between aptamer and GNPs. The interaction between the aptamer
and target analyte BPA includes electrostatic force, van der Waals
force and spatial configurations and measurements of circular
dichroism (CD) spectra were conducted to characterize the aptamer
conformation after binding to the target BPA. The CD spectra of the
pure aptamer before and after the binding of BPA (with the removing
of gold nanoparticles and aggregations) were compared (see Sup-
porting Information Fig. S7). It is clear that the CD spectra of aptamer
after binding are stronger than that of the unbound aptamer. We also
found a new shoulder peak of the aptamer after binding, which
indicates the new structural conformation of the aptamers in the
solution. Collectively, all of these results confirm the binding of
aptamer and target BPA, which induces the release of aptamer from
GNPs and, in turn, induces GNP aggregation.
UV–vis spectroscopy is often used to assess the stability of
GNPs in solution as the intensity and peak position are both
sensitive to any aggregation that occurs. Therefore, we also
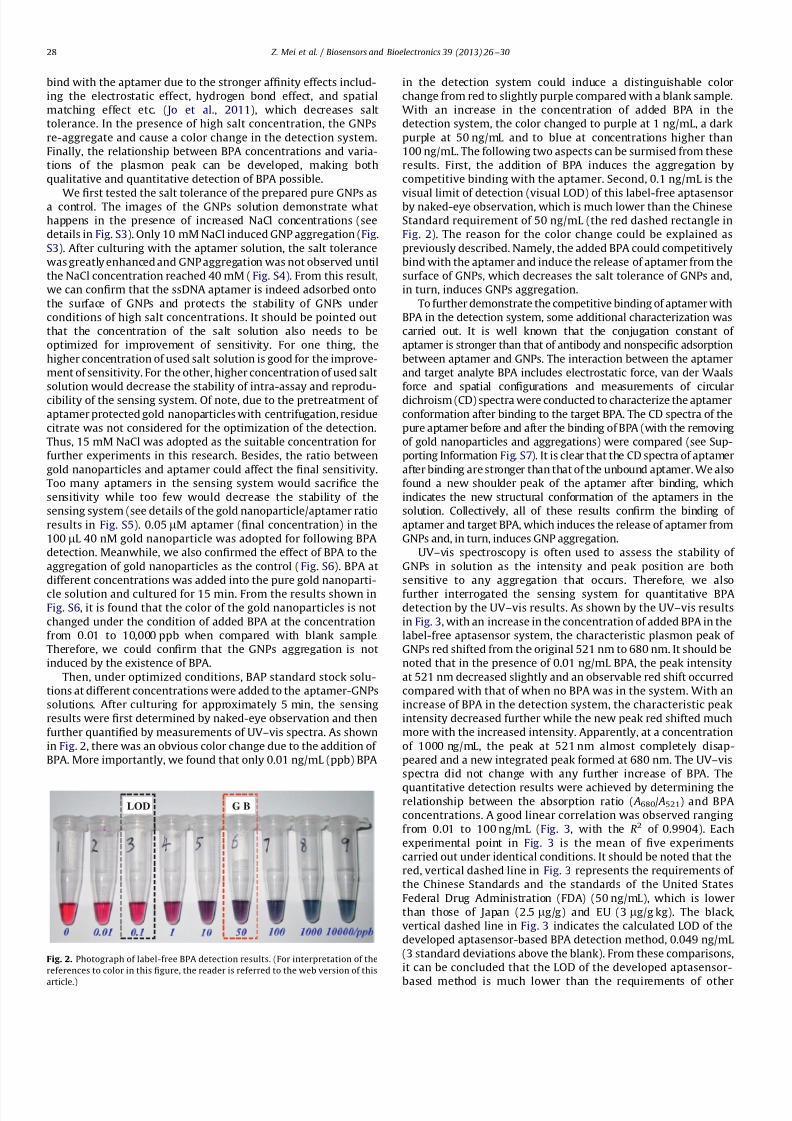
further interrogated the sensing system for quantitative BPAdetection by the UV–vis results. As shown by the UV–vis results
in Fig. 3, with an increase in the concentration of added BPA in the
label-free aptasensor system, the characteristic plasmon peak of
GNPs red shifted from the original 521 nm to 680 nm. It should be
noted that in the presence of 0.01 ng/mL BPA, the peak intensity
at 521 nm decreased slightly and an observable red shift occurred
compared with that of when no BPA was in the system. With an
increase of BPA in the detection system, the characteristic peak
intensity decreased further while the new peak red shifted much
more with the increased intensity. Apparently, at a concentration
of 1000 ng/mL, the peak at 521 nm almost completely disap-
peared and a new integrated peak formed at 680 nm. The UV–vis
spectra did not change with any further increase of BPA. The
quantitative detection results were achieved by determining therelationship between the absorption ratio ( A680/ A521) and BPA
concentrations. A good linear correlation was observed ranging
from 0.01 to 100 ng/mL (Fig. 3, with the R2 of 0.9904). Each
experimental point in Fig. 3 is the mean of five experiments
carried out under identical conditions. It should be noted that the
red, vertical dashed line in Fig. 3 represents the requirements of
the Chinese Standards and the standards of the United States
Federal Drug Administration (FDA) (50 ng/mL), which is lower
than those of Japan (2.5 mg/g) and EU (3 mg/g kg). The black,
vertical dashed line in Fig. 3 indicates the calculated LOD of the
developed aptasensor-based BPA detection method, 0.049 ng/mL
(3 standard deviations above the blank). From these comparisons,
it can be concluded that the LOD of the developed aptasensor-
based method is much lower than the requirements of other
G BLOD
Fig. 2. Photograph of label-free BPA detection results. (For interpretation of the
references to color in this figure, the reader is referred to the web version of this
article.)
Z. Mei et al. / Biosensors and Bioelectronics 39 (2013) 26 –3028
8/15/2019 BPA aptamer
http://slidepdf.com/reader/full/bpa-aptamer 4/5
countries and comparable to that of the ELISA and instrument-
based methods. More importantly, no more than 30 min is
required for BPA detection by this one-step, label-free aptasensor
method, which is the most obvious advantage compared with
other BPA detection methods, without considering the sample
pretreatments, operation procedures, and cost of the detections.
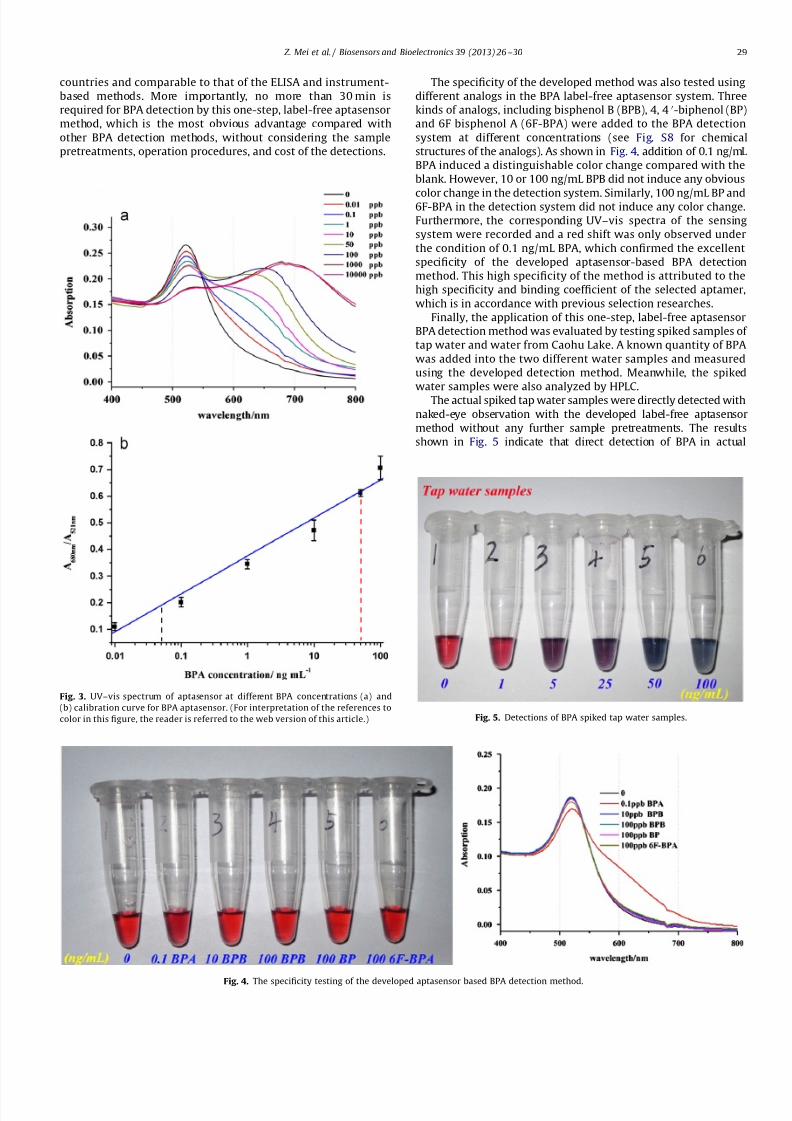
The specificity of the developed method was also tested using
different analogs in the BPA label-free aptasensor system. Three
kinds of analogs, including bisphenol B (BPB), 4, 4 0-biphenol (BP)
and 6F bisphenol A (6F-BPA) were added to the BPA detection
system at different concentrations (see Fig. S8 for chemical
structures of the analogs). As shown in Fig. 4, addition of 0.1 ng/mL
BPA induced a distinguishable color change compared with the
blank. However, 10 or 100 ng/mL BPB did not induce any obvious
color change in the detection system. Similarly, 100 ng/mL BP and6F-BPA in the detection system did not induce any color change.
Furthermore, the corresponding UV–vis spectra of the sensing
system were recorded and a red shift was only observed under
the condition of 0.1 ng/mL BPA, which confirmed the excellent
specificity of the developed aptasensor-based BPA detection
method. This high specificity of the method is attributed to the
high specificity and binding coefficient of the selected aptamer,
which is in accordance with previous selection researches.
Finally, the application of this one-step, label-free aptasensor
BPA detection method was evaluated by testing spiked samples of
tap water and water from Caohu Lake. A known quantity of BPA
was added into the two different water samples and measured
using the developed detection method. Meanwhile, the spiked
water samples were also analyzed by HPLC.
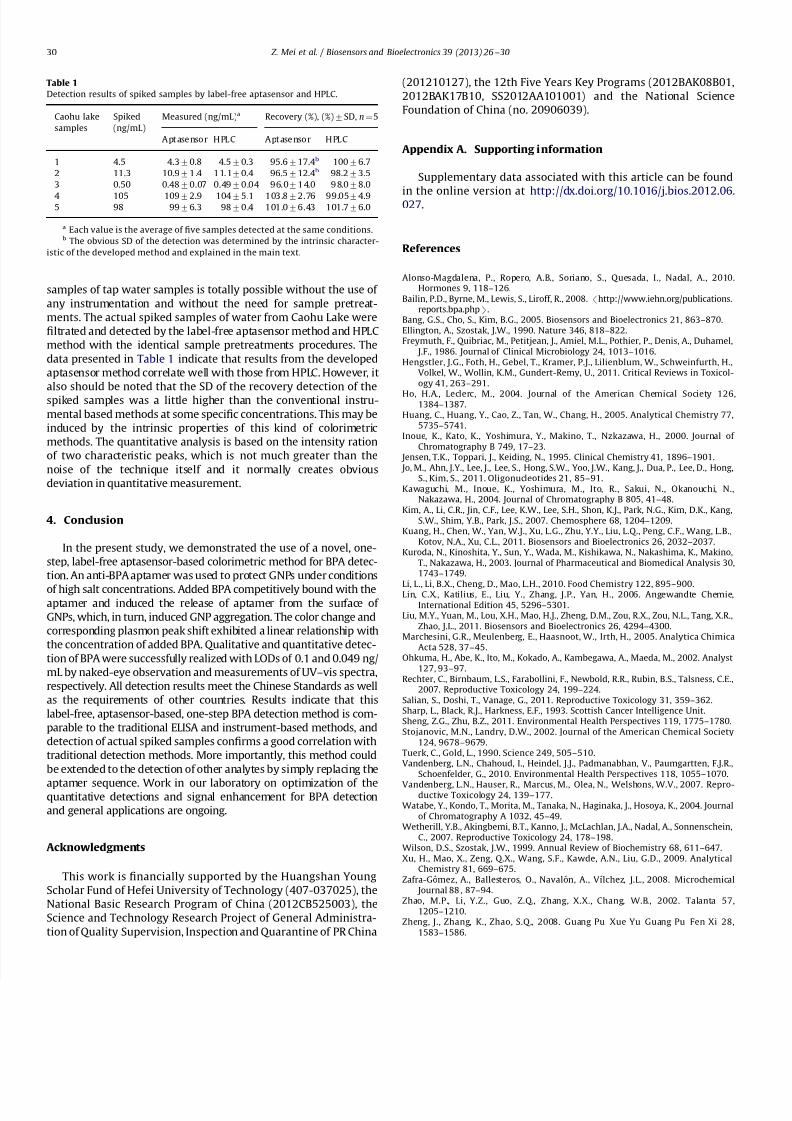
The actual spiked tap water samples were directly detected with
naked-eye observation with the developed label-free aptasensor
method without any further sample pretreatments. The results
shown in Fig. 5 indicate that direct detection of BPA in actual
Fig. 3. UV–vis spectrum of aptasensor at different BPA concentrations (a) and
(b) calibration curve for BPA aptasensor. (For interpretation of the references to
color in this figure, the reader is referred to the web version of this article.)
Fig. 4. The specificity testing of the developed aptasensor based BPA detection method.
Fig. 5. Detections of BPA spiked tap water samples.
Z. Mei et al. / Biosensors and Bioelectronics 39 (2013) 26 –30 29
8/15/2019 BPA aptamer
http://slidepdf.com/reader/full/bpa-aptamer 5/5
samples of tap water samples is totally possible without the use of
any instrumentation and without the need for sample pretreat-
ments. The actual spiked samples of water from Caohu Lake were
filtrated and detected by the label-free aptasensor method and HPLC
method with the identical sample pretreatments procedures. The
data presented in Table 1 indicate that results from the developed
aptasensor method correlate well with those from HPLC. However, it
also should be noted that the SD of the recovery detection of the
spiked samples was a little higher than the conventional instru-
mental based methods at some specific concentrations. This may be
induced by the intrinsic properties of this kind of colorimetric
methods. The quantitative analysis is based on the intensity ration
of two characteristic peaks, which is not much greater than the
noise of the technique itself and it normally creates obvious
deviation in quantitative measurement.
4. Conclusion
In the present study, we demonstrated the use of a novel, one-
step, label-free aptasensor-based colorimetric method for BPA detec-
tion. An anti-BPA aptamer was used to protect GNPs under conditions
of high salt concentrations. Added BPA competitively bound with theaptamer and induced the release of aptamer from the surface of
GNPs, which, in turn, induced GNP aggregation. The color change and
corresponding plasmon peak shift exhibited a linear relationship with
the concentration of added BPA. Qualitative and quantitative detec-
tion of BPA were successfully realized with LODs of 0.1 and 0.049 ng/
mL by naked-eye observation and measurements of UV–vis spectra,
respectively. All detection results meet the Chinese Standards as well
as the requirements of other countries. Results indicate that this
label-free, aptasensor-based, one-step BPA detection method is com-
parable to the traditional ELISA and instrument-based methods, and
detection of actual spiked samples confirms a good correlation with
traditional detection methods. More importantly, this method could
be extended to the detection of other analytes by simply replacing the
aptamer sequence. Work in our laboratory on optimization of thequantitative detections and signal enhancement for BPA detection
and general applications are ongoing.
Acknowledgments
This work is financially supported by the Huangshan Young
Scholar Fund of Hefei University of Technology (407-037025), the
National Basic Research Program of China (2012CB525003), the
Science and Technology Research Project of General Administra-
tion of Quality Supervision, Inspection and Quarantine of PR China
(201210127), the 12th Five Years Key Programs (2012BAK08B01,
2012BAK17B10, SS2012AA101001) and the National Science
Foundation of China (no. 20906039).
Appendix A. Supporting information
Supplementary data associated with this article can be found
in the online version at http://dx.doi.org/10.1016/j.bios.2012.06.027.
References
Alonso-Magdalena, P., Ropero, A.B., Soriano, S., Quesada, I., Nadal, A., 2010.Hormones 9, 118–126.
Bailin, P.D., Byrne, M., Lewis, S., Liroff, R., 2008. /http://www.iehn.org/publications.reports.bpa.phpS.
Bang, G.S., Cho, S., Kim, B.G., 2005. Biosensors and Bioelectronics 21, 863–870.Ellington, A., Szostak, J.W., 1990. Nature 346, 818–822.Freymuth, F., Quibriac, M., Petitjean, J., Amiel, M.L., Pothier, P., Denis, A., Duhamel,
J.F., 1986. Journal of Clinical Microbiology 24, 1013–1016.Hengstler, J.G., Foth, H., Gebel, T., Kramer, P.J., Lilienblum, W., Schweinfurth, H.,
Volkel, W., Wollin, K.M., Gundert-Remy, U., 2011. Critical Reviews in Toxicol-ogy 41, 263–291.
Ho, H.A., Leclerc, M., 2004. Journal of the American Chemical Society 126,1384–1387.
Huang, C., Huang, Y., Cao, Z., Tan, W., Chang, H., 2005. Analytical Chemistry 77,5735–5741.
Inoue, K., Kato, K., Yoshimura, Y., Makino, T., Nzkazawa, H., 2000. Journal of Chromatography B 749, 17–23.
Jensen, T.K., Toppari, J., Keiding, N., 1995. Clinical Chemistry 41, 1896–1901. Jo, M., Ahn, J.Y., Lee, J., Lee, S., Hong, S.W., Yoo, J.W., Kang, J., Dua, P., Lee, D., Hong,
S., Kim, S., 2011. Oligonucleotides 21, 85–91.Kawaguchi, M., Inoue, K., Yoshimura, M., Ito, R., Sakui, N., Okanouchi, N.,
Nakazawa, H., 2004. Journal of Chromatography B 805, 41–48.Kim, A., Li, C.R., Jin, C.F., Lee, K.W., Lee, S.H., Shon, K.J., Park, N.G., Kim, D.K., Kang,
S.W., Shim, Y.B., Park, J.S., 2007. Chemosphere 68, 1204–1209.Kuang, H., Chen, W., Yan, W.J., Xu, L.G., Zhu, Y.Y., Liu, L.Q., Peng, C.F., Wang, L.B.,
Kotov, N.A., Xu, C.L., 2011. Biosensors and Bioelectronics 26, 2032–2037.Kuroda, N., Kinoshita, Y., Sun, Y., Wada, M., Kishikawa, N., Nakashima, K., Makino,
T., Nakazawa, H., 2003. Journal of Pharmaceutical and Biomedical Analysis 30,1743–1749.
Li, L., Li, B.X., Cheng, D., Mao, L.H., 2010. Food Chemistry 122, 895–900.Lin, C.X., Katilius, E., Liu, Y., Zhang, J.P., Yan, H., 2006. Angewandte Chemie,
International Edition 45, 5296–5301.Liu, M.Y., Yuan, M., Lou, X.H., Mao, H.J., Zheng, D.M., Zou, R.X., Zou, N.L., Tang, X.R.,
Zhao, J.L., 2011. Biosensors and Bioelectronics 26, 4294–4300.Marchesini, G.R., Meulenberg, E., Haasnoot, W., Irth, H., 2005. Analytica Chimica
Acta 528, 37–45.Ohkuma, H., Abe, K., Ito, M., Kokado, A., Kambegawa, A., Maeda, M., 2002. Analyst
127, 93–97.Rechter, C., Birnbaum, L.S., Farabollini, F., Newbold, R.R., Rubin, B.S., Talsness, C.E.,
2007. Reproductive Toxicology 24, 199–224.Salian, S., Doshi, T., Vanage, G., 2011. Reproductive Toxicology 31, 359–362.Sharp, L., Black, R.J., Harkness, E.F., 1993. Scottish Cancer Intelligence Unit.Sheng, Z.G., Zhu, B.Z., 2011. Environmental Health Perspectives 119, 1775–1780.Stojanovic, M.N., Landry, D.W., 2002. Journal of the American Chemical Society
124, 9678–9679.Tuerk, C., Gold, L., 1990. Science 249, 505–510.Vandenberg, L.N., Chahoud, I., Heindel, J.J., Padmanabhan, V., Paumgartten, F.J.R.,
Schoenfelder, G., 2010. Environmental Health Perspectives 118, 1055–1070.
Vandenberg, L.N., Hauser, R., Marcus, M., Olea, N., Welshons, W.V., 2007. Repro-ductive Toxicology 24, 139–177.
Watabe, Y., Kondo, T., Morita, M., Tanaka, N., Haginaka, J., Hosoya, K., 2004. Journalof Chromatography A 1032, 45–49.
Wetherill, Y.B., Akingbemi, B.T., Kanno, J., McLachlan, J.A., Nadal, A., Sonnenschein,C., 2007. Reproductive Toxicology 24, 178–198.
Wilson, D.S., Szostak, J.W., 1999. Annual Review of Biochemistry 68, 611–647.Xu, H., Mao, X., Zeng, Q.X., Wang, S.F., Kawde, A.N., Liu, G.D., 2009. Analytical
Chemistry 81, 669–675.Zafra-Gomez, A., Ballesteros, O., Navalon, A., Vılchez, J.L., 2008. Microchemical
Journal 88 , 87–94.Zhao, M.P., Li, Y.Z., Guo, Z.Q., Zhang, X.X., Chang, W.B., 2002. Talanta 57,
1205–1210.Zheng, J., Zhang, K., Zhao, S.Q., 2008. Guang Pu Xue Yu Guang Pu Fen Xi 28,
1583–1586.
Table 1
Detection results of spiked samples by label-free aptasensor and HPLC.
Caohu lake
samples
Spiked
(ng/mL)
Measured (ng/mL)a Recovery (%), (%)7SD, n¼5
Apt asensor H PLC Apt asensor H PLC
1 4.5 4.370.8 4.570.3 95.6717.4b 10076.7
2 11.3 10.971 .4 1 1.170.4 96.5712.4b 98.273.5
3 0.50 0.4870.07 0.4970.04 96.071 4.0 9 8.078.0
4 105 10972.9 10475.1 103.872.76 99.0574.95 98 9976.3 9870.4 101.076.43 101.776.0
a Each value is the average of five samples detected at the same conditions.b The obvious SD of the detection was determined by the intrinsic character-
istic of the developed method and explained in the main text.
Z. Mei et al. / Biosensors and Bioelectronics 39 (2013) 26 –3030