Embed Size (px)
Citation preview
Breaking for Commercials:Characterizing Mobile Advertising
Narseo Vallina-Rodriguez†, Jay Shah†, Alessandro Finamore‡
Yan Grunenberger⋄, Hamed Haddadi§, Konstantina Papagiannaki⋄, Jon Crowcroft†University of Cambridge†, Politecnico di Torino‡, Telefonica Research⋄
Queen Mary University of London§[email protected]†, [email protected]‡, {yan,dina}@tid.es⋄
ABSTRACT
Mobile phones and tablets can be considered as the first incarnationof the post-PC era. Their explosive adoption rate has been drivenby a number of factors, with the most signifcant influence beingapplications (apps) and app markets. Individuals and organizationsare able to develop and publish apps, and the most popular form ofmonetization is mobile advertising.
The mobile advertisement (ad) ecosystem has been the target ofprior research, but these works typically focused on a small set ofapps or are from a user privacy perspective. In this work we makeuse of a unique, anonymized data set corresponding to one day oftraffic for a major European mobile carrier with more than 3 millionsubscribers. We further take a principled approach to characterizemobile ad traffic along a number of dimensions, such as overalltraffic, frequency, as well as possible implications in terms of en-ergy on a mobile device.
Our analysis demonstrates a number of inefficiencies in today’sad delivery. We discuss the benefits of well-known techniques,such as pre-fetching and caching, to limit the energy and networksignalling overhead caused by current systems. A prototype im-plementation on Android devices demonstrates an improvement of50% in terms of energy consumption for offline ad-sponsored appswhile limiting the amount of ad related traffic.
Keywords
Energy, Advertisement, Smartphones, Traffic, Cellular, Caching
Categories and Subject Descriptors
D.4.8 [Performance]: Measurements
Permission to make digital or hard copies of all or part of this work forpersonal or classroom use is granted without fee provided that copies arenot made or distributed for profit or commercial advantage and that copiesbear this notice and the full citation on the first page. To copy otherwise, torepublish, to post on servers or to redistribute to lists, requires prior specificpermission and/or a fee.IMC’12, November 14–16, 2012, Boston, Massachusetts, USA.Copyright 2012 ACM 978-1-4503-1705-4/12/11 ...$15.00.
1. INTRODUCTIONMobile application (app) markets have been a major success and
adoption factor for smartphones, allowing individuals and organi-zations to develop and sell apps to interested users. The App Storefrom Apple and Google Play (previously named Android Market)from Google are the two major platforms where developers sell orfreely share their apps. Both Apple and Google have played a majorrole in democratizing revenues related to mobile apps. In particu-lar, considering that 73% of the apps in Google Play are free [1],it can be expected that free apps tend to obtain a larger number ofdownloads than paid apps1. The revenue model adopted by manyfree apps includes advertisements (ads) that are embedded in theapp and displayed at various points during use. The adoption of thead model in mobile apps has strong implications for both the usersand the network. As an example, a recent study shows that 65-75%of the energy consumed in a gaming app (Angry Birds) on Androiddevices is spent by third party advertising modules [2].
Mobile advertising has been the focus of recent research, target-ing the system design [3], energy [2, 4], and privacy aspects of adservices [5, 6]. However, there is still very little known about thead delivery mechanisms adopted in current mobile networks. Thishappens primarily because existing work tends to focus on the in-spection of traffic generated by a small number of popular apps.In this work, we aim to characterize and quantify ad traffic in realmobile networks. For that, we study a data trace covering one dayof traffic for more than 3 million subscribers of a major Europeanmobile carrier.
In such an attempt, we develop a methodology for the classi-fication of ad traffic that incorporates the inspection of the SDKsprovided by ad networks, traffic inspection of mobile apps, as wellas rules extracted through a web log obtained from the aforemen-tioned network. Using a rule set comprising 122 rules, we classifytraffic into i) ad networks, ii) analytics, and iii) mediation services,and study its characteristics along a number of dimensions (traf-fic volume, frequency, type of content, etc.) for three major mobileplatforms found in the trace. Our analysis reveals several propertiesof the mobile ad ecosystem:
• The mobile ad ecosystem is overcrowded and unmoderated,with AdMob and other Google services being the leaders.
• Ads are not just a strain on Android devices but are alsoprominent on Apple devices.
• Ads account for 1% of all mobile traffic in our data set, asignificant component of the daily traffic of each device. Re-
1Although no ground truth data has been publicly available to con-firm this conjecture.
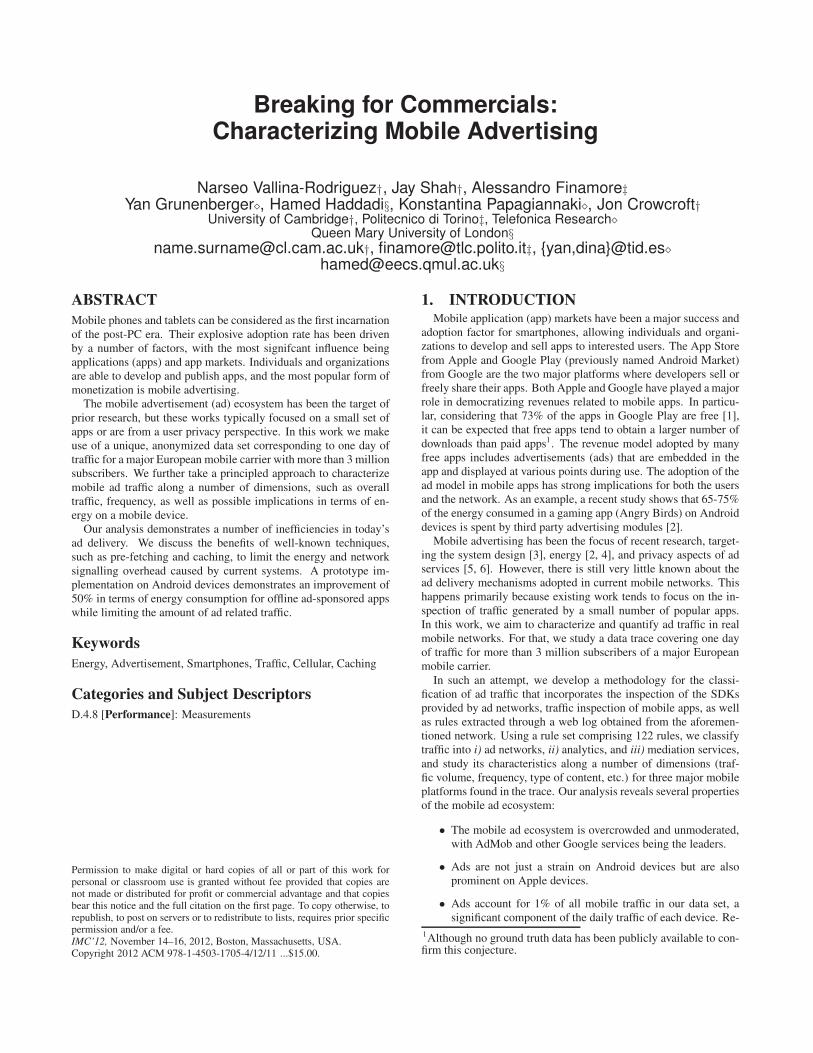
Figure 1: The mobile advertising ecosystem and the interaction
of the players within it.
Provider Retrieval Mechanism Refresh Interval (s)Push Pull Min Max
AdMob X X 12 120
Millennial Media X 15 N/A
InMobi X 20 N/A
Table 1: Description of the refresh intervals and retrieval mech-
anisms supported by three popular ad networks.
sults show that for 3% of Android devices, ads account formore than 1 MB, while for Apple devices this is even higherand corresponds to more than 3 MB.
• Mobile ad traffic is mainly composed of static images andtext files that are likely to be re-downloaded, with refreshintervals in the order of just a few seconds.
• Mobile ad traffic is the only type of network activity for someapps.
On a wired network, the transmissions of traffic can be assumedto be "free”, however on a mobile network these are accompaniedby control channel signalling overhead, use of scarce spectrum re-sources and battery implications. Low refresh intervals for down-loading objects that have already been fetched previously furtherdepletes the scarce resources of mobile networks. Moreover, solu-tions, such as pre-fetching and caching, are well understood in thesystem and networking community to readily provide solutions toa more spectrum-aware and energy-aware delivery of ads. Lever-aging these techniques, we developed a system, called AdCache,that enables energy efficient and network friendly cache-based addelivery, built on the intrinsic characteristics of ad traffic and mo-bile apps. AdCache enables the retrieval of ads under optimal net-work connectivity conditions for later display to the user, henceavoiding excessive energy wastage, signalling strains on the net-work and worsening the app responsiveness. We implement andtest AdCache on Android devices and show that it is able to reducethe energy consumption of mobile advertising in offline apps by upto 50% even with a low ad refresh interval of 20 seconds.
2. EXTRACTING AD TRAFFICThe mobile ad ecosystem, as detailed by Leontiadis et al [1],
comprises multiple players: brands wanting to attract consumers,ad agencies designing ad campaigns for brands, ad networks usedfor distribution, publishers who create and publish mobile apps,and users to which ads are shown. Mediation services are an addi-tional player that integrates several ad networks, allowing publish-ers to combine different ad networks and switch between them onthe fly. Their main advantage is that they can potentially increasethe publisher’s revenues as if one ad network fails to return an ad atits slot, it can try another ad network to fill this gap.
Rank Application Name Category Ad Provider
1 Facebook Social Network N/A2 Talking Pierre Entertainment MobClix
3 Ceramic Destroyer Arcade AdMob
4 WhatsApp Communication N/A
5 Cartoon Camera Photo MobFox, MadVerti
6 Skype Communication N/A
7 Angry Birds Arcade Burstly
8 Onavo Tools N/A
9 Talking Tom Cat 2 Entertainment MobClix10 Viber Communication N/A
Table 2: Usage of ad networks on the top 10 most popular free
mobile apps in the UK (As of 27th Feb. 2012).
URL domain Object path Type Role
media.admob.com adk-core-v40.js Ad Net Conf. Script
*.g.doubleclick.net mads/gma Ad Net Get Ad*.googlesyndication.com pagead/simgad Ad Net Get Ad
*.googlesyndication.com pagead/js Ad Net Static content
*.googlesyndication.com pagead Ad Net Static content
*.g.doubleclick.net aclk Ad Net Report Click
Table 3: Extract of the rule set for AdMob.
Ad networks and publishers are pursuing common objectives.Ad networks wish to maximize the number of clicks on ads throughtargeting the right users to satisfy the demands of the advertisers.Meanwhile, publishers are looking to maximize their revenue byincreasing their click-through rate (the number of clicks on an addivided by the number of times an ad is shown), using mediationservices to fill up their advertising space, and obtain profiling in-formation for targeting. Rather than inspecting all the relationsbetween the players in this complex ecosystem, we focus our in-terest on the distribution mechanism used by ad networks and ad-sponsored apps running on the device, as depicted in Figure 1.
2.1 Understanding ad networks’ SDKs
The ecosystem leverages the relative simplicity in incorporatingads in mobile app development. Ad networks provide a SoftwareDevelopment Kit (SDK) that enables integration of ads into mobileapps, hiding the protocol peculiarities. As shown in Table 1, pop-ular ad networks such as AdMob, Millennial Media and InMobiallow developers to define which kind of ads are embedded, howthey are delivered (push/pull techniques) and how often they arerefreshed. The most common type of ad in mobile apps are ban-ners (they are placed at the top or bottom of the screen and spanits width) and interstitials (full-screen ads, covering a large part orall of the screen for a short period of time). Unlike banners, in-terstitials are typically shown as users transition between differentactivities in the app. Banners are usually composed by text, images,and Javascript code.
The protocols used by ad networks for fetching and reportingare generally based on plain HTTP requests using REST APIs, withmost using HTTP GET methods. However, the ad networks studieddiffer slightly in the way they interact. As an example, AdMob actsas an internal mediation service to aggregate all Google’s services(e.g. Doubleclick and AdSense) whereas InMobi only requires asingle HTTP POST request per action. Millennial Media needstwo HTTP connections with two different servers: one to get thead, and the other one to get the associated static content.
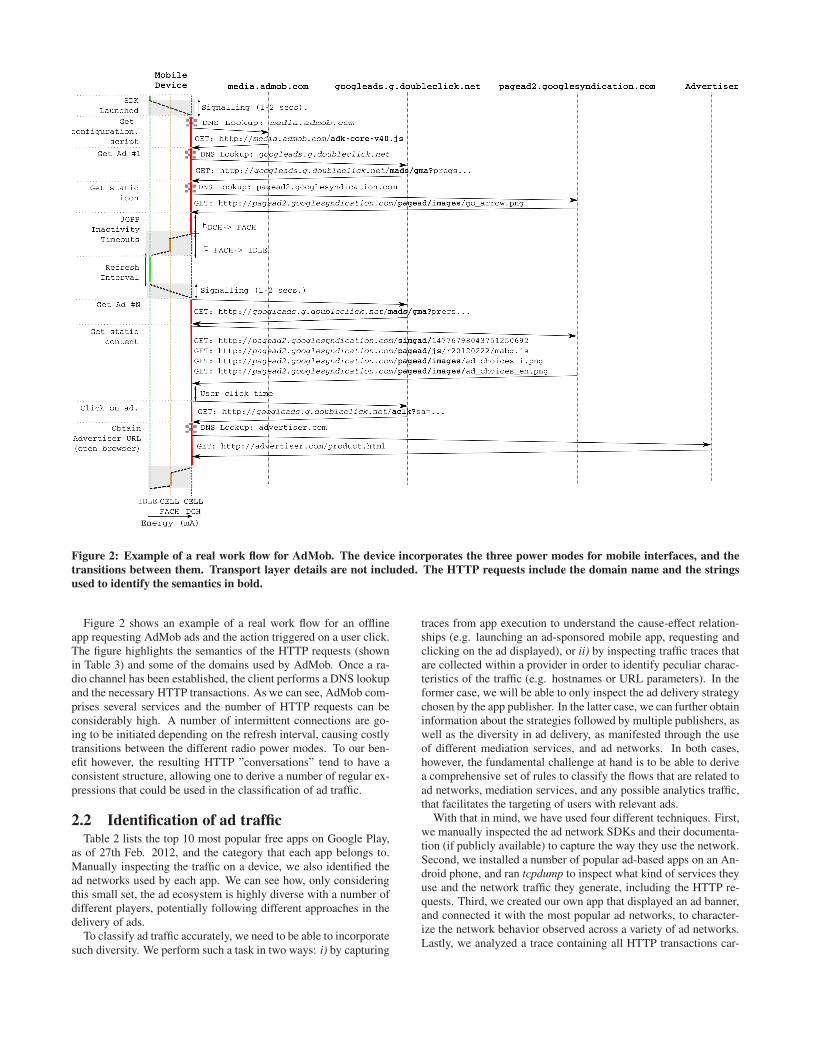
Figure 2: Example of a real work flow for AdMob. The device incorporates the three power modes for mobile interfaces, and the
transitions between them. Transport layer details are not included. The HTTP requests include the domain name and the strings
used to identify the semantics in bold.
Figure 2 shows an example of a real work flow for an offlineapp requesting AdMob ads and the action triggered on a user click.The figure highlights the semantics of the HTTP requests (shownin Table 3) and some of the domains used by AdMob. Once a ra-dio channel has been established, the client performs a DNS lookupand the necessary HTTP transactions. As we can see, AdMob com-prises several services and the number of HTTP requests can beconsiderably high. A number of intermittent connections are go-ing to be initiated depending on the refresh interval, causing costlytransitions between the different radio power modes. To our ben-efit however, the resulting HTTP ”conversations” tend to have aconsistent structure, allowing one to derive a number of regular ex-pressions that could be used in the classification of ad traffic.
2.2 Identification of ad trafficTable 2 lists the top 10 most popular free apps on Google Play,
as of 27th Feb. 2012, and the category that each app belongs to.Manually inspecting the traffic on a device, we also identified thead networks used by each app. We can see how, only consideringthis small set, the ad ecosystem is highly diverse with a number ofdifferent players, potentially following different approaches in thedelivery of ads.
To classify ad traffic accurately, we need to be able to incorporatesuch diversity. We perform such a task in two ways: i) by capturing
traces from app execution to understand the cause-effect relation-ships (e.g. launching an ad-sponsored mobile app, requesting andclicking on the ad displayed), or ii) by inspecting traffic traces thatare collected within a provider in order to identify peculiar charac-teristics of the traffic (e.g. hostnames or URL parameters). In theformer case, we will be able to only inspect the ad delivery strategychosen by the app publisher. In the latter case, we can further obtaininformation about the strategies followed by multiple publishers, aswell as the diversity in ad delivery, as manifested through the useof different mediation services, and ad networks. In both cases,however, the fundamental challenge at hand is to be able to derivea comprehensive set of rules to classify the flows that are related toad networks, mediation services, and any possible analytics traffic,that facilitates the targeting of users with relevant ads.
With that in mind, we have used four different techniques. First,we manually inspected the ad network SDKs and their documenta-tion (if publicly available) to capture the way they use the network.Second, we installed a number of popular ad-based apps on an An-droid phone, and ran tcpdump to inspect what kind of services theyuse and the network traffic they generate, including the HTTP re-quests. Third, we created our own app that displayed an ad banner,and connected it with the most popular ad networks, to character-ize the network behavior observed across a variety of ad networks.Lastly, we analyzed a trace containing all HTTP transactions car-
0.003
0.03
0.3
0.001
0.01
0.1
1
0.001 0.01 0.1 1 10
CC
DF
Regex Traffic Volume [MB]
AndroidiPhone
iPad
Figure 3: CCDF of the volume of ad traffic per user.
ried out by more than 3 million subscribers during a whole dayon a mobile network covering an entire country in Europe. In thislatter case, we made sure to filter out traffic resulting from non-mobile devices, given that the network in question allows tetheringand offers 3G USB dongles that are used by non-mobile devices toconnect to the mobile network.
The combination of the four processes, mentioned above, helpedus obtain a set of 122 rules featuring regular expressions that areable to parse a URL and classify traffic as i) ad network, ii) ana-lytics, iii) mediation service, or iv) other. The rule set also helpsus to identify the type of action to be performed given a HTTP re-quest. In Table 3, we show some examples of the rules obtained.Each rule, defined by a domain and URL object path, identifies thetype of service, goal of the request (e.g. obtain configuration script,an ad or reporting a click), ad network and HTTP request method(e.g. POST vs. GET) used. The compiled dictionary is publiclyavailable at [7].
3. AD TRAFFIC CHARACTERISATIONIn this section we characterize ad traffic leveraging on a data
set containing 1.7 billion traffic connections, which corresponds to22TB of volume downloaded on 13th Aug. 2011 by more than 3million subscribers of a major European mobile network. The dataset comprises all TCP traffic, excluding HTTPS, seen by acceler-ation proxies installed on the network, that also cache and com-press content for more efficient delivery. To the best of our knowl-edge, and according to the level of traffic at the peering point ofthis provider, we estimate the proportion of the secure traffic to be11.5%.
The monitoring activity at each vantage point is reported in a setof text log files. Each entry in the logs contains a set of standardinformation, such as IP addresses, port numbers, number of bytesdownloaded, and other HTTP specific information, such as contenttype, HTTP user agent, and HTTP response code. User informationis anonymized but consistently hashed to a unique ID. Each line ofthe logs corresponds to a different TCP connection performed by auser.
The operator under study allows tethering and 3G connectivitythrough a USB dongle. In order to ensure that our analysis focuseson ad traffic generated truly by mobile devices and apps, we havefiltered out this traffic. To achieve this we used a methodologybased on the inspection of the HTTP user agent, normally includinginformation about the Operating System (OS) of the device. AllPC users, as well as those found to be using more than one OSduring the day, have been filtered out from the original data set.This amount of traffic is not negligible, corresponding to 29.6% ofthe bytes downloaded by 7.2% of the users. This step further allows
0
0.2
0.4
0.6
0.8
1
0 0.1 0.2 0.3 0.4 0.5 0.6 0.7 0.8 0.9 1
CD
F
Ratio Regex/Total Traffic Volume
AndroidiPhone
iPad
Figure 4: The fraction of mobile ad ecosystem traffic over the
total traffic.
us to study ad delivery against the type of the platform used, e.g.Android, iPhone and iPad.
In what follows, we study the ad, mediation, and analytics traffic(called regex traffic for short) extracted from the sanitized mobiledata set. We want to highlight that analytics services provide a stan-dard framework to control the general activity of apps so they arenot adopted in ad-sponsored apps only. However, we decided toinclude them in the analysis for completeness. We focus our char-acterization along five main axes: i) overall volume of ad services,ii) main actors, iii) type of ad content, iv) generating apps, and v)
ad frequency.
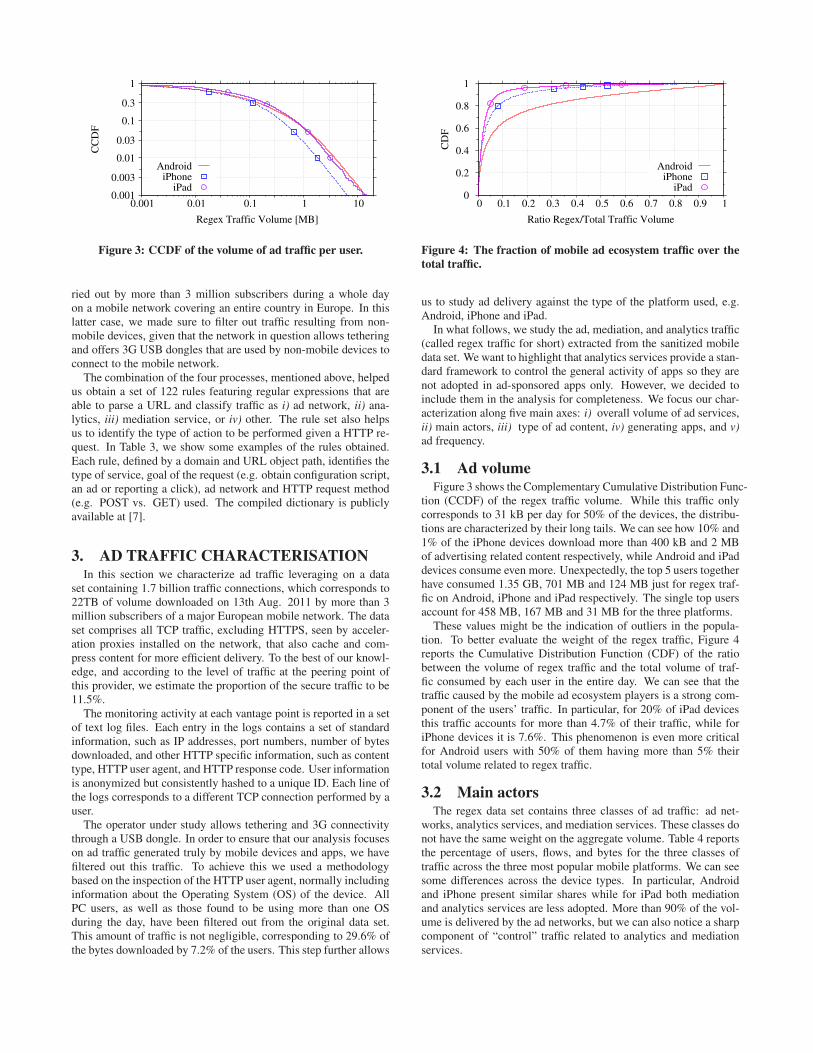
3.1 Ad volumeFigure 3 shows the Complementary Cumulative Distribution Func-
tion (CCDF) of the regex traffic volume. While this traffic onlycorresponds to 31 kB per day for 50% of the devices, the distribu-tions are characterized by their long tails. We can see how 10% and1% of the iPhone devices download more than 400 kB and 2 MBof advertising related content respectively, while Android and iPaddevices consume even more. Unexpectedly, the top 5 users togetherhave consumed 1.35 GB, 701 MB and 124 MB just for regex traf-fic on Android, iPhone and iPad respectively. The single top usersaccount for 458 MB, 167 MB and 31 MB for the three platforms.
These values might be the indication of outliers in the popula-tion. To better evaluate the weight of the regex traffic, Figure 4reports the Cumulative Distribution Function (CDF) of the ratiobetween the volume of regex traffic and the total volume of traf-fic consumed by each user in the entire day. We can see that thetraffic caused by the mobile ad ecosystem players is a strong com-ponent of the users’ traffic. In particular, for 20% of iPad devicesthis traffic accounts for more than 4.7% of their traffic, while foriPhone devices it is 7.6%. This phenomenon is even more criticalfor Android users with 50% of them having more than 5% theirtotal volume related to regex traffic.
3.2 Main actorsThe regex data set contains three classes of ad traffic: ad net-
works, analytics services, and mediation services. These classes donot have the same weight on the aggregate volume. Table 4 reportsthe percentage of users, flows, and bytes for the three classes oftraffic across the three most popular mobile platforms. We can seesome differences across the device types. In particular, Androidand iPhone present similar shares while for iPad both mediationand analytics services are less adopted. More than 90% of the vol-ume is delivered by the ad networks, but we can also notice a sharpcomponent of “control” traffic related to analytics and mediationservices.
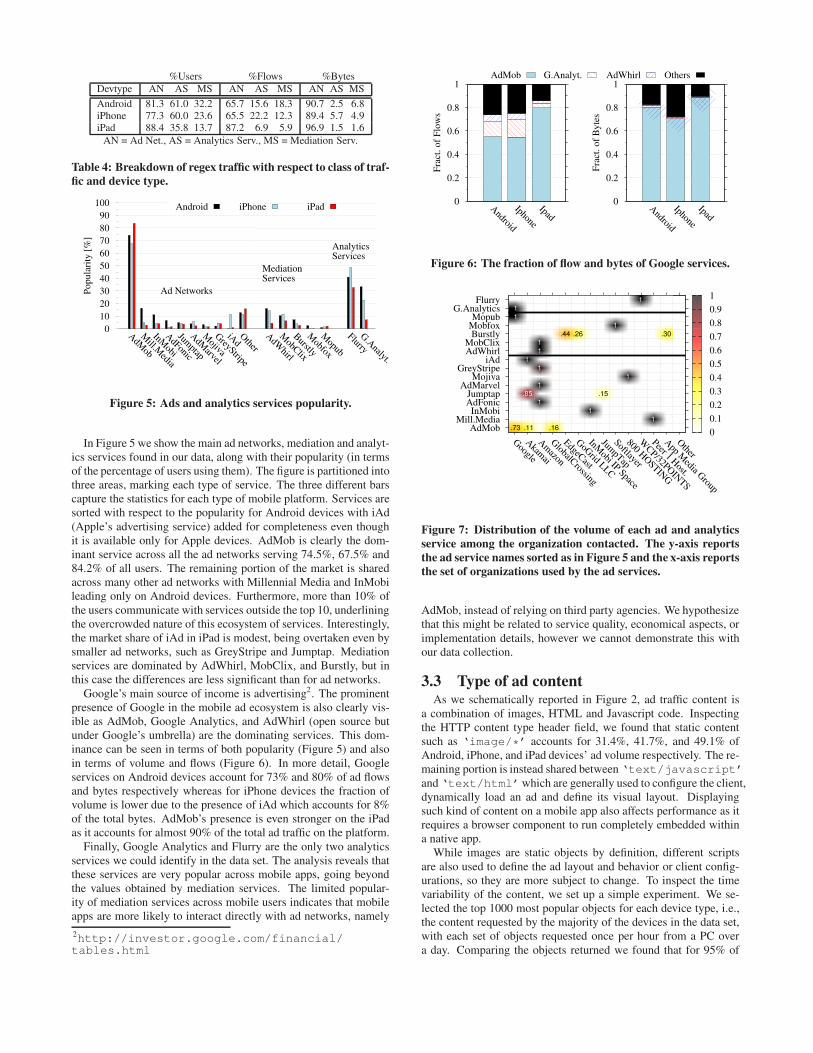
%Users %Flows %BytesDevtype AN AS MS AN AS MS AN AS MS
Android 81.3 61.0 32.2 65.7 15.6 18.3 90.7 2.5 6.8iPhone 77.3 60.0 23.6 65.5 22.2 12.3 89.4 5.7 4.9iPad 88.4 35.8 13.7 87.2 6.9 5.9 96.9 1.5 1.6
AN = Ad Net., AS = Analytics Serv., MS = Mediation Serv.
Table 4: Breakdown of regex traffic with respect to class of traf-
fic and device type.
0
10
20
30
40
50
60
70
80
90
100
AdM
ob
Mill.M
edia
InMobi
AdFonic
Jumptap
AdM
arvel
Mojiva
GreyStripe
iAd
Other
Popula
rity
[%
]
Ad Networks
Android iPhone iPad
AdW
hirl
MobClix
Burstly
Mobfox
Mopub
MediationServices
Flurry
G.A
nalyt.
AnalyticsServices
Figure 5: Ads and analytics services popularity.
In Figure 5 we show the main ad networks, mediation and analyt-ics services found in our data, along with their popularity (in termsof the percentage of users using them). The figure is partitioned intothree areas, marking each type of service. The three different barscapture the statistics for each type of mobile platform. Services aresorted with respect to the popularity for Android devices with iAd(Apple’s advertising service) added for completeness even thoughit is available only for Apple devices. AdMob is clearly the dom-inant service across all the ad networks serving 74.5%, 67.5% and84.2% of all users. The remaining portion of the market is sharedacross many other ad networks with Millennial Media and InMobileading only on Android devices. Furthermore, more than 10% ofthe users communicate with services outside the top 10, underliningthe overcrowded nature of this ecosystem of services. Interestingly,the market share of iAd in iPad is modest, being overtaken even bysmaller ad networks, such as GreyStripe and Jumptap. Mediationservices are dominated by AdWhirl, MobClix, and Burstly, but inthis case the differences are less significant than for ad networks.
Google’s main source of income is advertising2. The prominentpresence of Google in the mobile ad ecosystem is also clearly vis-ible as AdMob, Google Analytics, and AdWhirl (open source butunder Google’s umbrella) are the dominating services. This dom-inance can be seen in terms of both popularity (Figure 5) and alsoin terms of volume and flows (Figure 6). In more detail, Googleservices on Android devices account for 73% and 80% of ad flowsand bytes respectively whereas for iPhone devices the fraction ofvolume is lower due to the presence of iAd which accounts for 8%of the total bytes. AdMob’s presence is even stronger on the iPadas it accounts for almost 90% of the total ad traffic on the platform.
Finally, Google Analytics and Flurry are the only two analyticsservices we could identify in the data set. The analysis reveals thatthese services are very popular across mobile apps, going beyondthe values obtained by mediation services. The limited popular-ity of mediation services across mobile users indicates that mobileapps are more likely to interact directly with ad networks, namely
2http://investor.google.com/financial/tables.html
0
0.2
0.4
0.6
0.8
1
Android
Iphone
Ipad
Fra
ct. of
Flo
ws
AdMob G.Analyt.
0
0.2
0.4
0.6
0.8
1
Android
Iphone
Ipad
Fra
ct. of
Byte
s
AdWhirl Others
Figure 6: The fraction of flow and bytes of Google services.
AdMobMill.Media
InMobiAdFonicJumptap
AdMarvelMojiva
GreyStripeiAd
AdWhirlMobClix
BurstlyMobfoxMopub
G.AnalyticsFlurry
Akam
ai
Am
azon
GlobalCrossing
EdgeCast
GoG
rid LLC
InMobi IP Space
JumpTap
Softlayer
800 HO
STING
WCP/32PO
INTS
Peer 1 Host.
App M
edia Group
Other
0
0.1
0.2
0.3
0.4
0.5
0.6
0.7
0.8
0.9
1
.73 .11 .16
1
1
1
.85 .15
1
1
1
1
1
1
.44 .26 .30
1
1
1
1
Figure 7: Distribution of the volume of each ad and analytics
service among the organization contacted. The y-axis reports
the ad service names sorted as in Figure 5 and the x-axis reports
the set of organizations used by the ad services.
AdMob, instead of relying on third party agencies. We hypothesizethat this might be related to service quality, economical aspects, orimplementation details, however we cannot demonstrate this withour data collection.
3.3 Type of ad contentAs we schematically reported in Figure 2, ad traffic content is
a combination of images, HTML and Javascript code. Inspectingthe HTTP content type header field, we found that static contentsuch as ‘image/*’ accounts for 31.4%, 41.7%, and 49.1% ofAndroid, iPhone, and iPad devices’ ad volume respectively. The re-maining portion is instead shared between ‘text/javascript’and ‘text/html’which are generally used to configure the client,dynamically load an ad and define its visual layout. Displayingsuch kind of content on a mobile app also affects performance as itrequires a browser component to run completely embedded withina native app.
While images are static objects by definition, different scriptsare also used to define the ad layout and behavior or client config-urations, so they are more subject to change. To inspect the timevariability of the content, we set up a simple experiment. We se-lected the top 1000 most popular objects for each device type, i.e.,the content requested by the majority of the devices in the data set,with each set of objects requested once per hour from a PC overa day. Comparing the objects returned we found that for 95% of
Top AdMob Android AppsRank App Name Category Users (%)
1 Angry Birds Arcade 11.48
2 Advanced Task Killer System Tools 9.77
3 Soccer Scores (FotMob) Sports 3.53
4 Drag Racing Arcade 2.69
5 Bubble Blast Arcade 2.69
Top AdMob iPhone Apps
Rank App Name Category Users (%)
1 TV Guide Entertainment 5.96
2 Grindr Dating 4.21
3 iFooty Sports 4.01
4 Words with Friends Arcade 3.51
5 Solitaire Arcade 2.80
Table 5: Top apps requesting AdMob ads both in Android and
iPhone. The right column indicates the percentage of users that
had installed the app out of the total users with AdMob traffic
for a given platform.
the cases there are no differences and many objects in the remain-ing 5% corresponds to scripts differing only because of timestampsembedded in the code, proving that ad content for mobile apps isstatic.
Inspecting the hostnames and server IPs we have noticed thatthe content is usually served through Content Delivery Networks(CDNs). For each ad service we identified the CDN/hosts theyuse, measuring the amount of bytes served by the CDN/host andnormalizing the values with respect to the total volume of eachad service. To retrieve this information we relied on a commer-cial database provided by MaxMind3 that maps an IP address tothe name of the organization (AS, CDN, network operator, hostingcompany, etc.) that owns it. In Figure 7, we report a heat mapto show the relationships between ad services and the CDN/hostsserving their content. The y-axis reports the ad service namessorted as in Figure 5. The services are grouped together accord-ing to the three classes of services previously introduced: analyticsservices, mediation services and ad networks. The x-axis reportsthe set of organizations used by the ad services. From the marketpoint of view, the heat map is sparse, given that most ad servicesuse a different organization for serving content. Most of the ad ser-vices are served by a single organization, except AdMob, Burstlyand Jumptap, all of which balance the volume downloaded across2 or 3 organizations. Beside Google, the only exception is Amazonwhich is preferred to Akamai by many ad services.
3.4 Greedy apps requesting adsTraffic classification of mobile apps is not a trivial task. The
methodologies available in the literature are usually based on theinspection of both the user agent and URL of HTTP requests [8].However, we found these techniques inaccurate especially for An-droid where the user agent is usually not customized by app pub-lishers. Considering the URLs of ad traffic, we noticed some pa-rameters related to configuration (e.g., format and size of the ad),and tracking info (e.g., country code, GPS position) but we foundalso some identifiers related to the app name generating the traffic.In particular, some ad services identify apps using a hash code, thepackage name (e.g., com.rovio.angrybirds) or the real name (e.g.,Angry Birds). While package names can be mapped to the realname using information available on the market, this is not truefor hash codes which are created by the service when the publisher
3http://www.maxmind.com/app/organization
0
0.2
0.4
0.6
0.8
1
1 10 100 1000 10000
CD
F
Idle [s]
Android
AllMediat. Serv.Analyt. Serv.
Ad Net 0
0.2
0.4
0.6
0.8
1
1 10 100 1000 10000
Idle [s]
iPhone
AllMediat. Serv.Analyt. Serv.
Ad Net
Figure 8: CDF of the interleave between consecutive activity
periods.
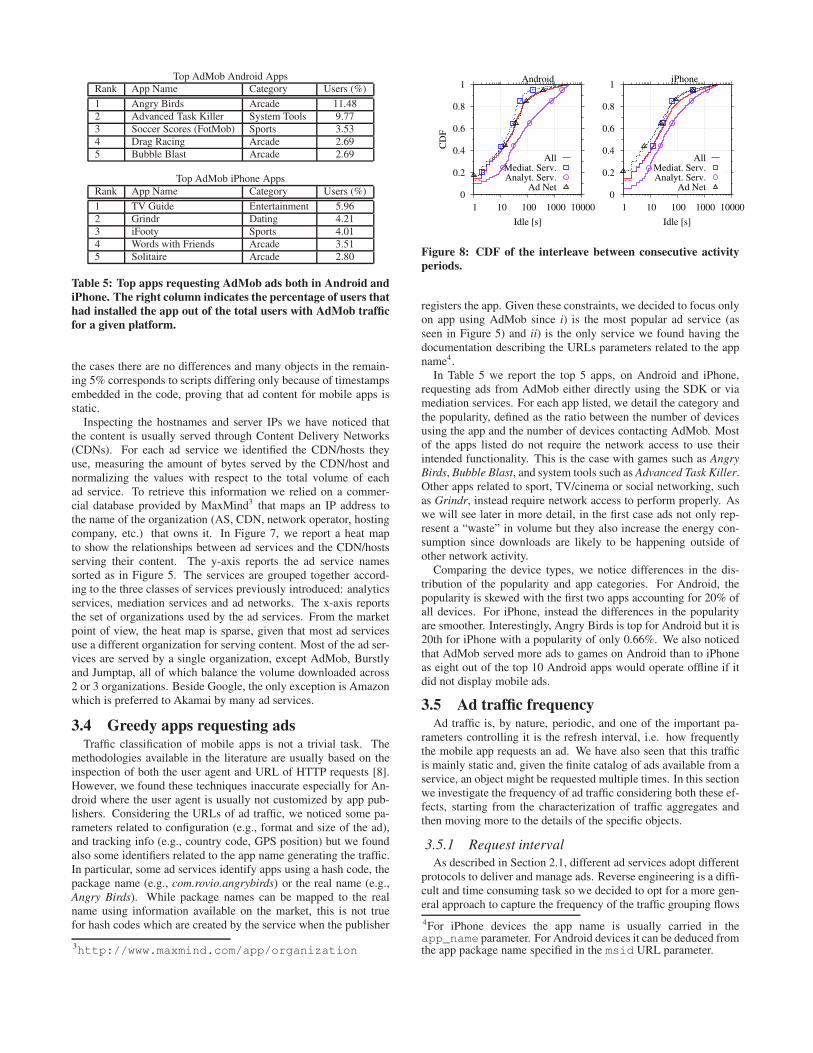
registers the app. Given these constraints, we decided to focus onlyon app using AdMob since i) is the most popular ad service (asseen in Figure 5) and ii) is the only service we found having thedocumentation describing the URLs parameters related to the appname4.
In Table 5 we report the top 5 apps, on Android and iPhone,requesting ads from AdMob either directly using the SDK or viamediation services. For each app listed, we detail the category andthe popularity, defined as the ratio between the number of devicesusing the app and the number of devices contacting AdMob. Mostof the apps listed do not require the network access to use theirintended functionality. This is the case with games such as AngryBirds, Bubble Blast, and system tools such as Advanced Task Killer.Other apps related to sport, TV/cinema or social networking, suchas Grindr, instead require network access to perform properly. Aswe will see later in more detail, in the first case ads not only rep-resent a “waste” in volume but they also increase the energy con-sumption since downloads are likely to be happening outside ofother network activity.
Comparing the device types, we notice differences in the dis-tribution of the popularity and app categories. For Android, thepopularity is skewed with the first two apps accounting for 20% ofall devices. For iPhone, instead the differences in the popularityare smoother. Interestingly, Angry Birds is top for Android but it is20th for iPhone with a popularity of only 0.66%. We also noticedthat AdMob served more ads to games on Android than to iPhoneas eight out of the top 10 Android apps would operate offline if itdid not display mobile ads.
3.5 Ad traffic frequencyAd traffic is, by nature, periodic, and one of the important pa-
rameters controlling it is the refresh interval, i.e. how frequentlythe mobile app requests an ad. We have also seen that this trafficis mainly static and, given the finite catalog of ads available from aservice, an object might be requested multiple times. In this sectionwe investigate the frequency of ad traffic considering both these ef-fects, starting from the characterization of traffic aggregates andthen moving more to the details of the specific objects.
3.5.1 Request interval
As described in Section 2.1, different ad services adopt differentprotocols to deliver and manage ads. Reverse engineering is a diffi-cult and time consuming task so we decided to opt for a more gen-eral approach to capture the frequency of the traffic grouping flows
4For iPhone devices the app name is usually carried in theapp_name parameter. For Android devices it can be deduced fromthe app package name specified in the msid URL parameter.
1
10
100
1000
1 5 10 15 20 25 30 35 40 45 50
Req
ues
ts p
er d
evic
e
Object Popularity Rank
Android
50th perc
1
10
100
1000
1 5 10 15 20 25 30 35 40 45 50
Req
ues
ts p
er d
evic
e
Object Popularity Rank
iPhone
50th perc
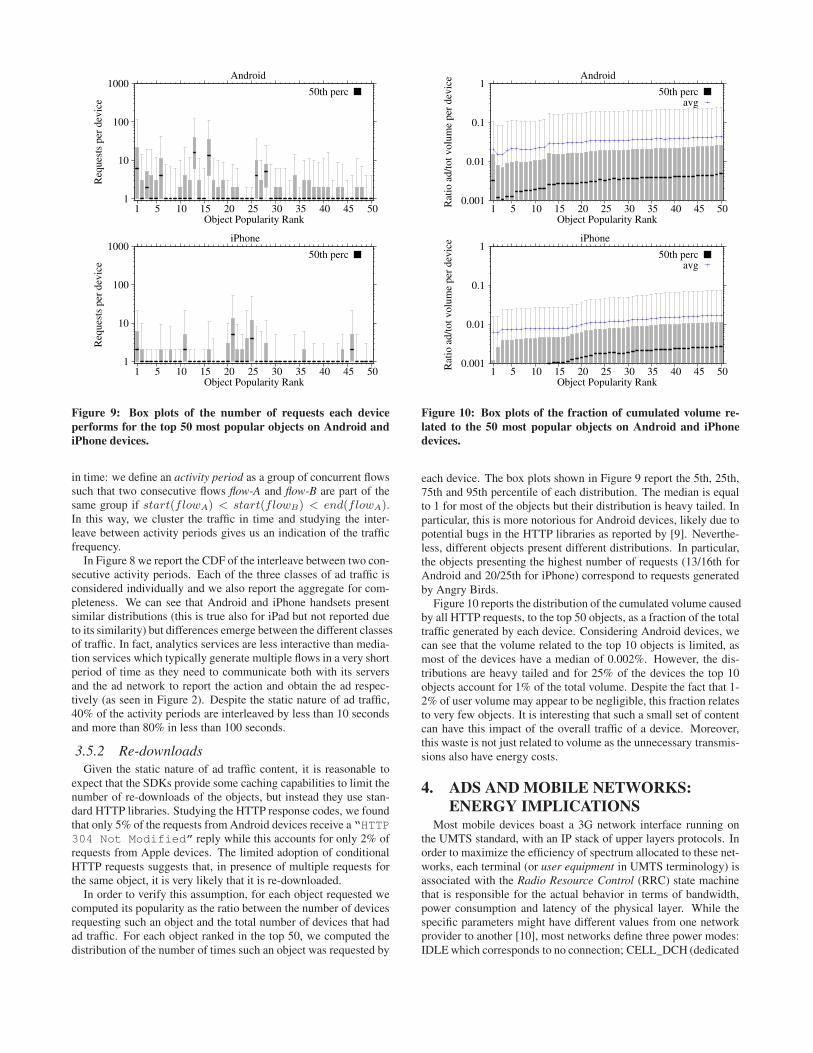
Figure 9: Box plots of the number of requests each device
performs for the top 50 most popular objects on Android and
iPhone devices.
in time: we define an activity period as a group of concurrent flowssuch that two consecutive flows flow-A and flow-B are part of thesame group if start(flowA) < start(flowB) < end(flowA).In this way, we cluster the traffic in time and studying the inter-leave between activity periods gives us an indication of the trafficfrequency.
In Figure 8 we report the CDF of the interleave between two con-secutive activity periods. Each of the three classes of ad traffic isconsidered individually and we also report the aggregate for com-pleteness. We can see that Android and iPhone handsets presentsimilar distributions (this is true also for iPad but not reported dueto its similarity) but differences emerge between the different classesof traffic. In fact, analytics services are less interactive than media-tion services which typically generate multiple flows in a very shortperiod of time as they need to communicate both with its serversand the ad network to report the action and obtain the ad respec-tively (as seen in Figure 2). Despite the static nature of ad traffic,40% of the activity periods are interleaved by less than 10 secondsand more than 80% in less than 100 seconds.
3.5.2 Re-downloads
Given the static nature of ad traffic content, it is reasonable toexpect that the SDKs provide some caching capabilities to limit thenumber of re-downloads of the objects, but instead they use stan-dard HTTP libraries. Studying the HTTP response codes, we foundthat only 5% of the requests from Android devices receive a “HTTP304 Not Modified” reply while this accounts for only 2% ofrequests from Apple devices. The limited adoption of conditionalHTTP requests suggests that, in presence of multiple requests forthe same object, it is very likely that it is re-downloaded.
In order to verify this assumption, for each object requested wecomputed its popularity as the ratio between the number of devicesrequesting such an object and the total number of devices that hadad traffic. For each object ranked in the top 50, we computed thedistribution of the number of times such an object was requested by
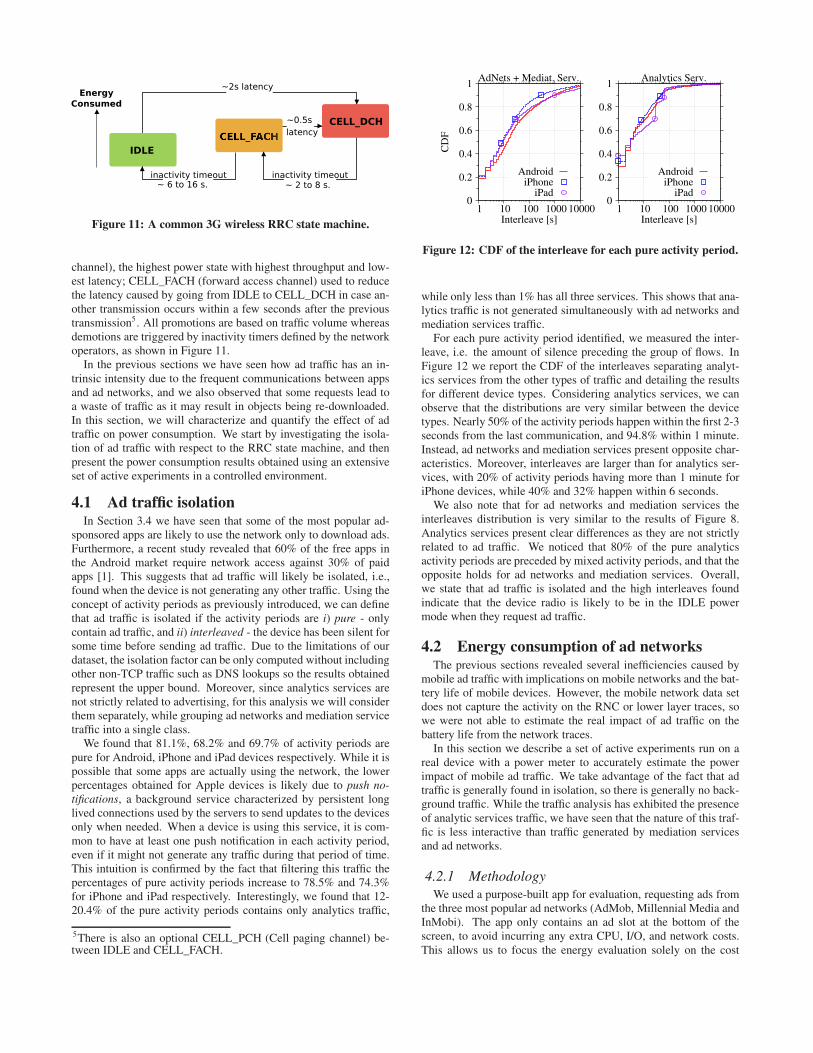
0.001
0.01
0.1
1
1 5 10 15 20 25 30 35 40 45 50Rat
io a
d/t
ot
volu
me
per
dev
ice
Object Popularity Rank
Android
50th percavg
0.001
0.01
0.1
1
1 5 10 15 20 25 30 35 40 45 50Rat
io a
d/t
ot
volu
me
per
dev
ice
Object Popularity Rank
iPhone
50th percavg
Figure 10: Box plots of the fraction of cumulated volume re-
lated to the 50 most popular objects on Android and iPhone
devices.
each device. The box plots shown in Figure 9 report the 5th, 25th,75th and 95th percentile of each distribution. The median is equalto 1 for most of the objects but their distribution is heavy tailed. Inparticular, this is more notorious for Android devices, likely due topotential bugs in the HTTP libraries as reported by [9]. Neverthe-less, different objects present different distributions. In particular,the objects presenting the highest number of requests (13/16th forAndroid and 20/25th for iPhone) correspond to requests generatedby Angry Birds.
Figure 10 reports the distribution of the cumulated volume causedby all HTTP requests, to the top 50 objects, as a fraction of the totaltraffic generated by each device. Considering Android devices, wecan see that the volume related to the top 10 objects is limited, asmost of the devices have a median of 0.002%. However, the dis-tributions are heavy tailed and for 25% of the devices the top 10objects account for 1% of the total volume. Despite the fact that 1-2% of user volume may appear to be negligible, this fraction relatesto very few objects. It is interesting that such a small set of contentcan have this impact of the overall traffic of a device. Moreover,this waste is not just related to volume as the unnecessary transmis-sions also have energy costs.
4. ADS ANDMOBILE NETWORKS:
ENERGY IMPLICATIONSMost mobile devices boast a 3G network interface running on
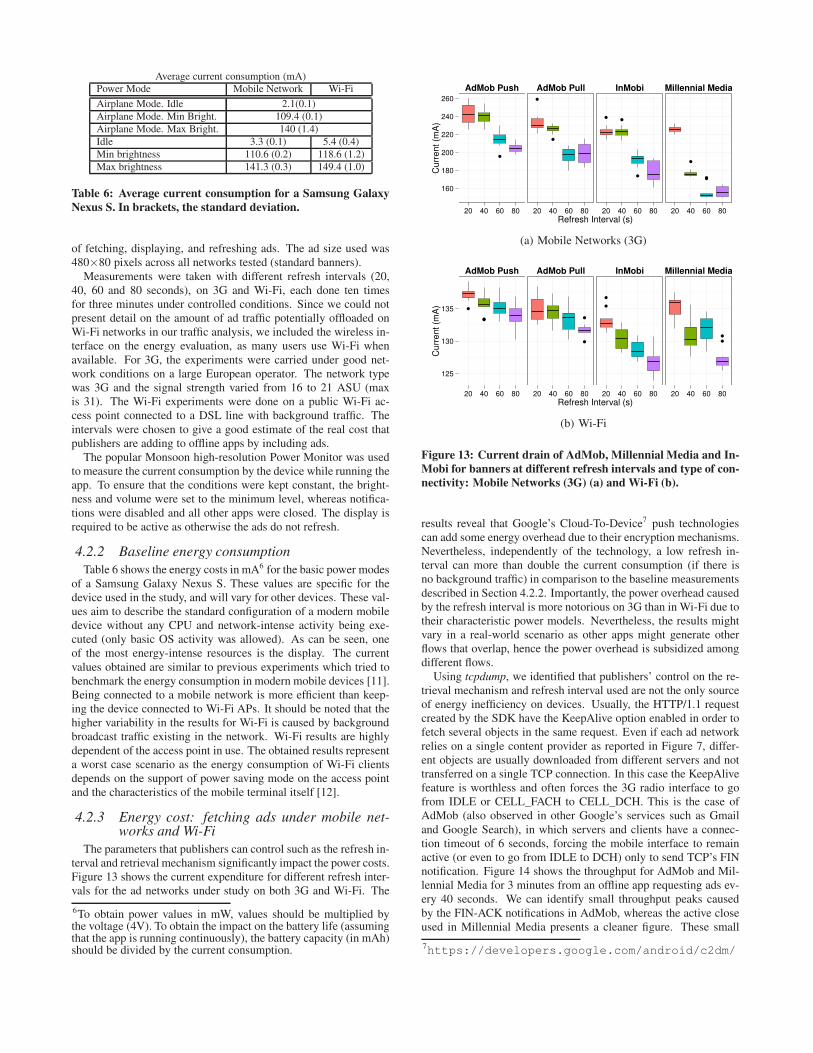
the UMTS standard, with an IP stack of upper layers protocols. Inorder to maximize the efficiency of spectrum allocated to these net-works, each terminal (or user equipment in UMTS terminology) isassociated with the Radio Resource Control (RRC) state machinethat is responsible for the actual behavior in terms of bandwidth,power consumption and latency of the physical layer. While thespecific parameters might have different values from one networkprovider to another [10], most networks define three power modes:IDLE which corresponds to no connection; CELL_DCH (dedicated
IDLE
CELL_DCH
~2s latency
inactivity timeout inactivity timeout
~0.5s
Energy
Consumed
latency
~ 2 to 8 s.~ 6 to 16 s.
Figure 11: A common 3G wireless RRC state machine.
channel), the highest power state with highest throughput and low-est latency; CELL_FACH (forward access channel) used to reducethe latency caused by going from IDLE to CELL_DCH in case an-other transmission occurs within a few seconds after the previoustransmission5. All promotions are based on traffic volume whereasdemotions are triggered by inactivity timers defined by the networkoperators, as shown in Figure 11.
In the previous sections we have seen how ad traffic has an in-trinsic intensity due to the frequent communications between appsand ad networks, and we also observed that some requests lead toa waste of traffic as it may result in objects being re-downloaded.In this section, we will characterize and quantify the effect of adtraffic on power consumption. We start by investigating the isola-tion of ad traffic with respect to the RRC state machine, and thenpresent the power consumption results obtained using an extensiveset of active experiments in a controlled environment.
4.1 Ad traffic isolationIn Section 3.4 we have seen that some of the most popular ad-
sponsored apps are likely to use the network only to download ads.Furthermore, a recent study revealed that 60% of the free apps inthe Android market require network access against 30% of paidapps [1]. This suggests that ad traffic will likely be isolated, i.e.,found when the device is not generating any other traffic. Using theconcept of activity periods as previously introduced, we can definethat ad traffic is isolated if the activity periods are i) pure - onlycontain ad traffic, and ii) interleaved - the device has been silent forsome time before sending ad traffic. Due to the limitations of ourdataset, the isolation factor can be only computed without includingother non-TCP traffic such as DNS lookups so the results obtainedrepresent the upper bound. Moreover, since analytics services arenot strictly related to advertising, for this analysis we will considerthem separately, while grouping ad networks and mediation servicetraffic into a single class.
We found that 81.1%, 68.2% and 69.7% of activity periods arepure for Android, iPhone and iPad devices respectively. While it ispossible that some apps are actually using the network, the lowerpercentages obtained for Apple devices is likely due to push no-
tifications, a background service characterized by persistent longlived connections used by the servers to send updates to the devicesonly when needed. When a device is using this service, it is com-mon to have at least one push notification in each activity period,even if it might not generate any traffic during that period of time.This intuition is confirmed by the fact that filtering this traffic thepercentages of pure activity periods increase to 78.5% and 74.3%for iPhone and iPad respectively. Interestingly, we found that 12-20.4% of the pure activity periods contains only analytics traffic,
5There is also an optional CELL_PCH (Cell paging channel) be-tween IDLE and CELL_FACH.
0
0.2
0.4
0.6
0.8
1
1 10 100 1000 10000
CD
F
Interleave [s]
AdNets + Mediat. Serv.
AndroidiPhone
iPad 0
0.2
0.4
0.6
0.8
1
1 10 100 1000 10000Interleave [s]
Analytics Serv.
AndroidiPhone
iPad
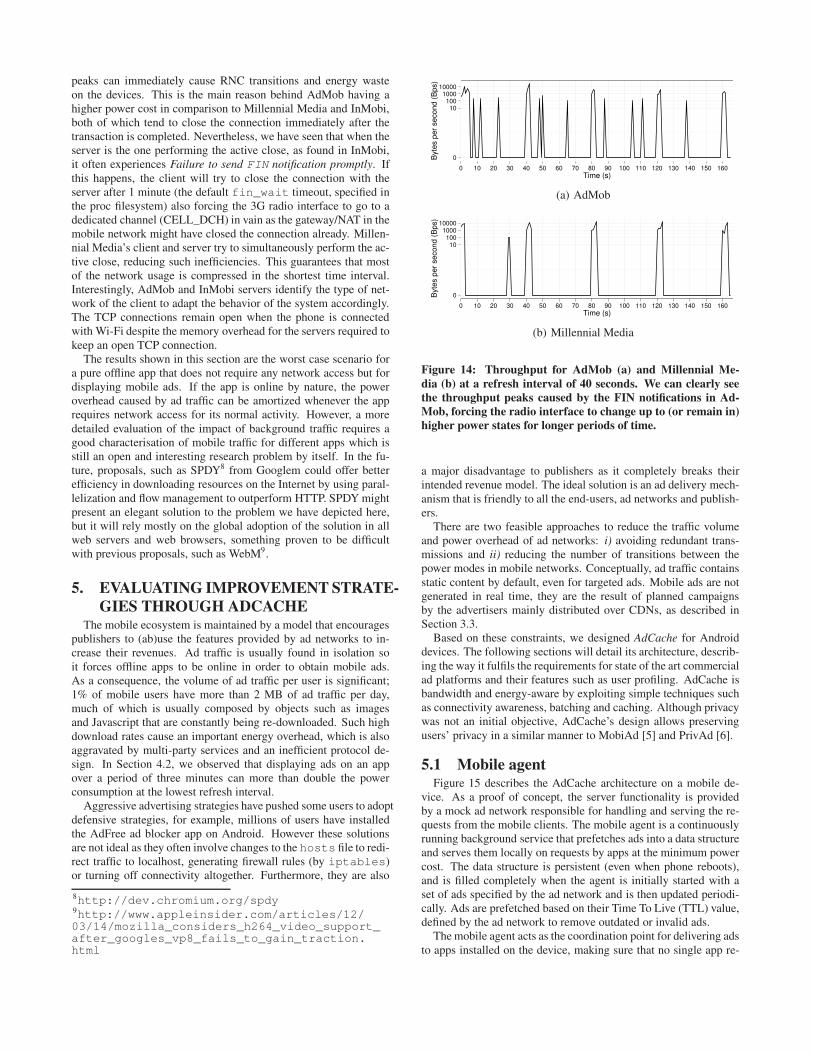
Figure 12: CDF of the interleave for each pure activity period.
while only less than 1% has all three services. This shows that ana-lytics traffic is not generated simultaneously with ad networks andmediation services traffic.
For each pure activity period identified, we measured the inter-leave, i.e. the amount of silence preceding the group of flows. InFigure 12 we report the CDF of the interleaves separating analyt-ics services from the other types of traffic and detailing the resultsfor different device types. Considering analytics services, we canobserve that the distributions are very similar between the devicetypes. Nearly 50% of the activity periods happen within the first 2-3seconds from the last communication, and 94.8% within 1 minute.Instead, ad networks and mediation services present opposite char-acteristics. Moreover, interleaves are larger than for analytics ser-vices, with 20% of activity periods having more than 1 minute foriPhone devices, while 40% and 32% happen within 6 seconds.
We also note that for ad networks and mediation services theinterleaves distribution is very similar to the results of Figure 8.Analytics services present clear differences as they are not strictlyrelated to ad traffic. We noticed that 80% of the pure analyticsactivity periods are preceded by mixed activity periods, and that theopposite holds for ad networks and mediation services. Overall,we state that ad traffic is isolated and the high interleaves foundindicate that the device radio is likely to be in the IDLE powermode when they request ad traffic.
4.2 Energy consumption of ad networksThe previous sections revealed several inefficiencies caused by
mobile ad traffic with implications on mobile networks and the bat-tery life of mobile devices. However, the mobile network data setdoes not capture the activity on the RNC or lower layer traces, sowe were not able to estimate the real impact of ad traffic on thebattery life from the network traces.
In this section we describe a set of active experiments run on areal device with a power meter to accurately estimate the powerimpact of mobile ad traffic. We take advantage of the fact that adtraffic is generally found in isolation, so there is generally no back-ground traffic. While the traffic analysis has exhibited the presenceof analytic services traffic, we have seen that the nature of this traf-fic is less interactive than traffic generated by mediation servicesand ad networks.
4.2.1 Methodology
We used a purpose-built app for evaluation, requesting ads fromthe three most popular ad networks (AdMob, Millennial Media andInMobi). The app only contains an ad slot at the bottom of thescreen, to avoid incurring any extra CPU, I/O, and network costs.This allows us to focus the energy evaluation solely on the cost
Average current consumption (mA)Power Mode Mobile Network Wi-Fi
Airplane Mode. Idle 2.1(0.1)
Airplane Mode. Min Bright. 109.4 (0.1)
Airplane Mode. Max Bright. 140 (1.4)
Idle 3.3 (0.1) 5.4 (0.4)
Min brightness 110.6 (0.2) 118.6 (1.2)
Max brightness 141.3 (0.3) 149.4 (1.0)
Table 6: Average current consumption for a Samsung Galaxy
Nexus S. In brackets, the standard deviation.
of fetching, displaying, and refreshing ads. The ad size used was480×80 pixels across all networks tested (standard banners).
Measurements were taken with different refresh intervals (20,40, 60 and 80 seconds), on 3G and Wi-Fi, each done ten timesfor three minutes under controlled conditions. Since we could notpresent detail on the amount of ad traffic potentially offloaded onWi-Fi networks in our traffic analysis, we included the wireless in-terface on the energy evaluation, as many users use Wi-Fi whenavailable. For 3G, the experiments were carried under good net-work conditions on a large European operator. The network typewas 3G and the signal strength varied from 16 to 21 ASU (maxis 31). The Wi-Fi experiments were done on a public Wi-Fi ac-cess point connected to a DSL line with background traffic. Theintervals were chosen to give a good estimate of the real cost thatpublishers are adding to offline apps by including ads.
The popular Monsoon high-resolution Power Monitor was usedto measure the current consumption by the device while running theapp. To ensure that the conditions were kept constant, the bright-ness and volume were set to the minimum level, whereas notifica-tions were disabled and all other apps were closed. The display isrequired to be active as otherwise the ads do not refresh.
4.2.2 Baseline energy consumption
Table 6 shows the energy costs in mA6 for the basic power modesof a Samsung Galaxy Nexus S. These values are specific for thedevice used in the study, and will vary for other devices. These val-ues aim to describe the standard configuration of a modern mobiledevice without any CPU and network-intense activity being exe-cuted (only basic OS activity was allowed). As can be seen, oneof the most energy-intense resources is the display. The currentvalues obtained are similar to previous experiments which tried tobenchmark the energy consumption in modern mobile devices [11].Being connected to a mobile network is more efficient than keep-ing the device connected to Wi-Fi APs. It should be noted that thehigher variability in the results for Wi-Fi is caused by backgroundbroadcast traffic existing in the network. Wi-Fi results are highlydependent of the access point in use. The obtained results representa worst case scenario as the energy consumption of Wi-Fi clientsdepends on the support of power saving mode on the access pointand the characteristics of the mobile terminal itself [12].
4.2.3 Energy cost: fetching ads under mobile net-works and Wi-Fi
The parameters that publishers can control such as the refresh in-terval and retrieval mechanism significantly impact the power costs.Figure 13 shows the current expenditure for different refresh inter-vals for the ad networks under study on both 3G and Wi-Fi. The
6To obtain power values in mW, values should be multiplied bythe voltage (4V). To obtain the impact on the battery life (assumingthat the app is running continuously), the battery capacity (in mAh)should be divided by the current consumption.
AdMob Push AdMob Pull InMobi Millennial Media
160
180
200
220
240
260
20 40 60 80 20 40 60 80 20 40 60 80 20 40 60 80
Refresh Interval (s)
Curr
ent (m
A)
(a) Mobile Networks (3G)
AdMob Push AdMob Pull InMobi Millennial Media
125
130
135
20 40 60 80 20 40 60 80 20 40 60 80 20 40 60 80
Refresh Interval (s)
Curr
ent (m
A)
(b) Wi-Fi
Figure 13: Current drain of AdMob, Millennial Media and In-
Mobi for banners at different refresh intervals and type of con-
nectivity: Mobile Networks (3G) (a) and Wi-Fi (b).
results reveal that Google’s Cloud-To-Device7 push technologiescan add some energy overhead due to their encryption mechanisms.Nevertheless, independently of the technology, a low refresh in-terval can more than double the current consumption (if there isno background traffic) in comparison to the baseline measurementsdescribed in Section 4.2.2. Importantly, the power overhead causedby the refresh interval is more notorious on 3G than in Wi-Fi due totheir characteristic power models. Nevertheless, the results mightvary in a real-world scenario as other apps might generate otherflows that overlap, hence the power overhead is subsidized amongdifferent flows.
Using tcpdump, we identified that publishers’ control on the re-trieval mechanism and refresh interval used are not the only sourceof energy inefficiency on devices. Usually, the HTTP/1.1 requestcreated by the SDK have the KeepAlive option enabled in order tofetch several objects in the same request. Even if each ad networkrelies on a single content provider as reported in Figure 7, differ-ent objects are usually downloaded from different servers and nottransferred on a single TCP connection. In this case the KeepAlivefeature is worthless and often forces the 3G radio interface to gofrom IDLE or CELL_FACH to CELL_DCH. This is the case ofAdMob (also observed in other Google’s services such as Gmailand Google Search), in which servers and clients have a connec-tion timeout of 6 seconds, forcing the mobile interface to remainactive (or even to go from IDLE to DCH) only to send TCP’s FINnotification. Figure 14 shows the throughput for AdMob and Mil-lennial Media for 3 minutes from an offline app requesting ads ev-ery 40 seconds. We can identify small throughput peaks causedby the FIN-ACK notifications in AdMob, whereas the active closeused in Millennial Media presents a cleaner figure. These small
7https://developers.google.com/android/c2dm/
peaks can immediately cause RNC transitions and energy wasteon the devices. This is the main reason behind AdMob having ahigher power cost in comparison to Millennial Media and InMobi,both of which tend to close the connection immediately after thetransaction is completed. Nevertheless, we have seen that when theserver is the one performing the active close, as found in InMobi,it often experiences Failure to send FIN notification promptly. Ifthis happens, the client will try to close the connection with theserver after 1 minute (the default fin_wait timeout, specified inthe proc filesystem) also forcing the 3G radio interface to go to adedicated channel (CELL_DCH) in vain as the gateway/NAT in themobile network might have closed the connection already. Millen-nial Media’s client and server try to simultaneously perform the ac-tive close, reducing such inefficiencies. This guarantees that mostof the network usage is compressed in the shortest time interval.Interestingly, AdMob and InMobi servers identify the type of net-work of the client to adapt the behavior of the system accordingly.The TCP connections remain open when the phone is connectedwith Wi-Fi despite the memory overhead for the servers required tokeep an open TCP connection.
The results shown in this section are the worst case scenario fora pure offline app that does not require any network access but fordisplaying mobile ads. If the app is online by nature, the poweroverhead caused by ad traffic can be amortized whenever the apprequires network access for its normal activity. However, a moredetailed evaluation of the impact of background traffic requires agood characterisation of mobile traffic for different apps which isstill an open and interesting research problem by itself. In the fu-ture, proposals, such as SPDY8 from Googlem could offer betterefficiency in downloading resources on the Internet by using paral-lelization and flow management to outperform HTTP. SPDY mightpresent an elegant solution to the problem we have depicted here,but it will rely mostly on the global adoption of the solution in allweb servers and web browsers, something proven to be difficultwith previous proposals, such as WebM9.
5. EVALUATING IMPROVEMENTSTRATE-
GIES THROUGH ADCACHEThe mobile ecosystem is maintained by a model that encourages
publishers to (ab)use the features provided by ad networks to in-crease their revenues. Ad traffic is usually found in isolation soit forces offline apps to be online in order to obtain mobile ads.As a consequence, the volume of ad traffic per user is significant;1% of mobile users have more than 2 MB of ad traffic per day,much of which is usually composed by objects such as imagesand Javascript that are constantly being re-downloaded. Such highdownload rates cause an important energy overhead, which is alsoaggravated by multi-party services and an inefficient protocol de-sign. In Section 4.2, we observed that displaying ads on an appover a period of three minutes can more than double the powerconsumption at the lowest refresh interval.
Aggressive advertising strategies have pushed some users to adoptdefensive strategies, for example, millions of users have installedthe AdFree ad blocker app on Android. However these solutionsare not ideal as they often involve changes to the hosts file to redi-rect traffic to localhost, generating firewall rules (by iptables)or turning off connectivity altogether. Furthermore, they are also
8http://dev.chromium.org/spdy9http://www.appleinsider.com/articles/12/03/14/mozilla_considers_h264_video_support_after_googles_vp8_fails_to_gain_traction.html
0
10100
100010000
0 10 20 30 40 50 60 70 80 90 100 110 120 130 140 150 160
Time (s)
Byte
s p
er
se
co
nd
(B
ps)
(a) AdMob
0
10100
100010000
0 10 20 30 40 50 60 70 80 90 100 110 120 130 140 150 160
Time (s)
Byte
s p
er
se
co
nd
(B
ps)
(b) Millennial Media
Figure 14: Throughput for AdMob (a) and Millennial Me-
dia (b) at a refresh interval of 40 seconds. We can clearly see
the throughput peaks caused by the FIN notifications in Ad-
Mob, forcing the radio interface to change up to (or remain in)
higher power states for longer periods of time.
a major disadvantage to publishers as it completely breaks theirintended revenue model. The ideal solution is an ad delivery mech-anism that is friendly to all the end-users, ad networks and publish-ers.
There are two feasible approaches to reduce the traffic volumeand power overhead of ad networks: i) avoiding redundant trans-missions and ii) reducing the number of transitions between thepower modes in mobile networks. Conceptually, ad traffic containsstatic content by default, even for targeted ads. Mobile ads are notgenerated in real time, they are the result of planned campaignsby the advertisers mainly distributed over CDNs, as described inSection 3.3.
Based on these constraints, we designed AdCache for Androiddevices. The following sections will detail its architecture, describ-ing the way it fulfils the requirements for state of the art commercialad platforms and their features such as user profiling. AdCache isbandwidth and energy-aware by exploiting simple techniques suchas connectivity awareness, batching and caching. Although privacywas not an initial objective, AdCache’s design allows preservingusers’ privacy in a similar manner to MobiAd [5] and PrivAd [6].
5.1 Mobile agentFigure 15 describes the AdCache architecture on a mobile de-
vice. As a proof of concept, the server functionality is providedby a mock ad network responsible for handling and serving the re-quests from the mobile clients. The mobile agent is a continuouslyrunning background service that prefetches ads into a data structureand serves them locally on requests by apps at the minimum powercost. The data structure is persistent (even when phone reboots),and is filled completely when the agent is initially started with aset of ads specified by the ad network and is then updated periodi-cally. Ads are prefetched based on their Time To Live (TTL) value,defined by the ad network to remove outdated or invalid ads.
The mobile agent acts as the coordination point for delivering adsto apps installed on the device, making sure that no single app re-
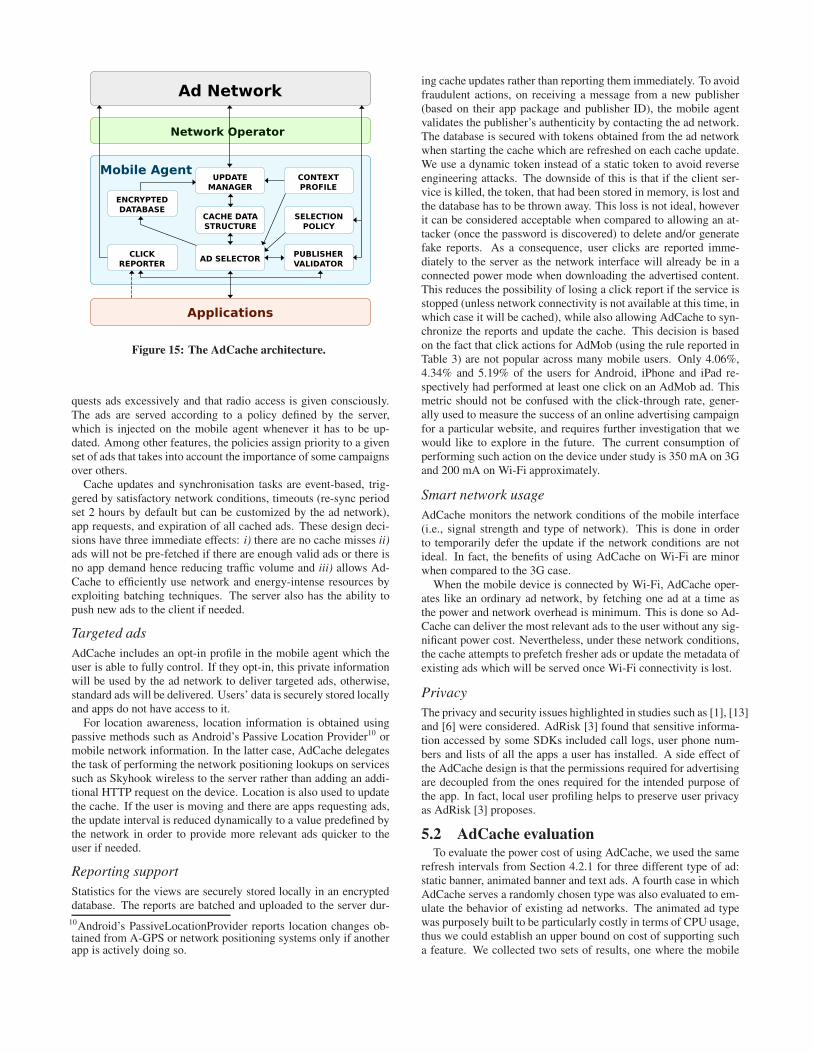
Mobile Agent
CLICK
REPORTERAD SELECTOR
PUBLISHER
VALIDATOR
CACHE DATA
STRUCTURE
ENCRYPTED
DATABASE
UPDATE
MANAGER
CONTEXT
PROFILE
Network Operator
SELECTION
POLICY
Ad Network
Applications
Figure 15: The AdCache architecture.
quests ads excessively and that radio access is given consciously.The ads are served according to a policy defined by the server,which is injected on the mobile agent whenever it has to be up-dated. Among other features, the policies assign priority to a givenset of ads that takes into account the importance of some campaignsover others.
Cache updates and synchronisation tasks are event-based, trig-gered by satisfactory network conditions, timeouts (re-sync periodset 2 hours by default but can be customized by the ad network),app requests, and expiration of all cached ads. These design deci-sions have three immediate effects: i) there are no cache misses ii)ads will not be pre-fetched if there are enough valid ads or there isno app demand hence reducing traffic volume and iii) allows Ad-Cache to efficiently use network and energy-intense resources byexploiting batching techniques. The server also has the ability topush new ads to the client if needed.
Targeted ads
AdCache includes an opt-in profile in the mobile agent which theuser is able to fully control. If they opt-in, this private informationwill be used by the ad network to deliver targeted ads, otherwise,standard ads will be delivered. Users’ data is securely stored locallyand apps do not have access to it.
For location awareness, location information is obtained usingpassive methods such as Android’s Passive Location Provider10 ormobile network information. In the latter case, AdCache delegatesthe task of performing the network positioning lookups on servicessuch as Skyhook wireless to the server rather than adding an addi-tional HTTP request on the device. Location is also used to updatethe cache. If the user is moving and there are apps requesting ads,the update interval is reduced dynamically to a value predefined bythe network in order to provide more relevant ads quicker to theuser if needed.
Reporting support
Statistics for the views are securely stored locally in an encrypteddatabase. The reports are batched and uploaded to the server dur-
10Android’s PassiveLocationProvider reports location changes ob-tained from A-GPS or network positioning systems only if anotherapp is actively doing so.
ing cache updates rather than reporting them immediately. To avoidfraudulent actions, on receiving a message from a new publisher(based on their app package and publisher ID), the mobile agentvalidates the publisher’s authenticity by contacting the ad network.The database is secured with tokens obtained from the ad networkwhen starting the cache which are refreshed on each cache update.We use a dynamic token instead of a static token to avoid reverseengineering attacks. The downside of this is that if the client ser-vice is killed, the token, that had been stored in memory, is lost andthe database has to be thrown away. This loss is not ideal, howeverit can be considered acceptable when compared to allowing an at-tacker (once the password is discovered) to delete and/or generatefake reports. As a consequence, user clicks are reported imme-diately to the server as the network interface will already be in aconnected power mode when downloading the advertised content.This reduces the possibility of losing a click report if the service isstopped (unless network connectivity is not available at this time, inwhich case it will be cached), while also allowing AdCache to syn-chronize the reports and update the cache. This decision is basedon the fact that click actions for AdMob (using the rule reported inTable 3) are not popular across many mobile users. Only 4.06%,4.34% and 5.19% of the users for Android, iPhone and iPad re-spectively had performed at least one click on an AdMob ad. Thismetric should not be confused with the click-through rate, gener-ally used to measure the success of an online advertising campaignfor a particular website, and requires further investigation that wewould like to explore in the future. The current consumption ofperforming such action on the device under study is 350 mA on 3Gand 200 mA on Wi-Fi approximately.
Smart network usage
AdCache monitors the network conditions of the mobile interface(i.e., signal strength and type of network). This is done in orderto temporarily defer the update if the network conditions are notideal. In fact, the benefits of using AdCache on Wi-Fi are minorwhen compared to the 3G case.
When the mobile device is connected by Wi-Fi, AdCache oper-ates like an ordinary ad network, by fetching one ad at a time asthe power and network overhead is minimum. This is done so Ad-Cache can deliver the most relevant ads to the user without any sig-nificant power cost. Nevertheless, under these network conditions,the cache attempts to prefetch fresher ads or update the metadata ofexisting ads which will be served once Wi-Fi connectivity is lost.
Privacy
The privacy and security issues highlighted in studies such as [1], [13]and [6] were considered. AdRisk [3] found that sensitive informa-tion accessed by some SDKs included call logs, user phone num-bers and lists of all the apps a user has installed. A side effect ofthe AdCache design is that the permissions required for advertisingare decoupled from the ones required for the intended purpose ofthe app. In fact, local user profiling helps to preserve user privacyas AdRisk [3] proposes.
5.2 AdCache evaluationTo evaluate the power cost of using AdCache, we used the same
refresh intervals from Section 4.2.1 for three different type of ad:static banner, animated banner and text ads. A fourth case in whichAdCache serves a randomly chosen type was also evaluated to em-ulate the behavior of existing ad networks. The animated ad typewas purposely built to be particularly costly in terms of CPU usage,thus we could establish an upper bound on cost of supporting sucha feature. We collected two sets of results, one where the mobile
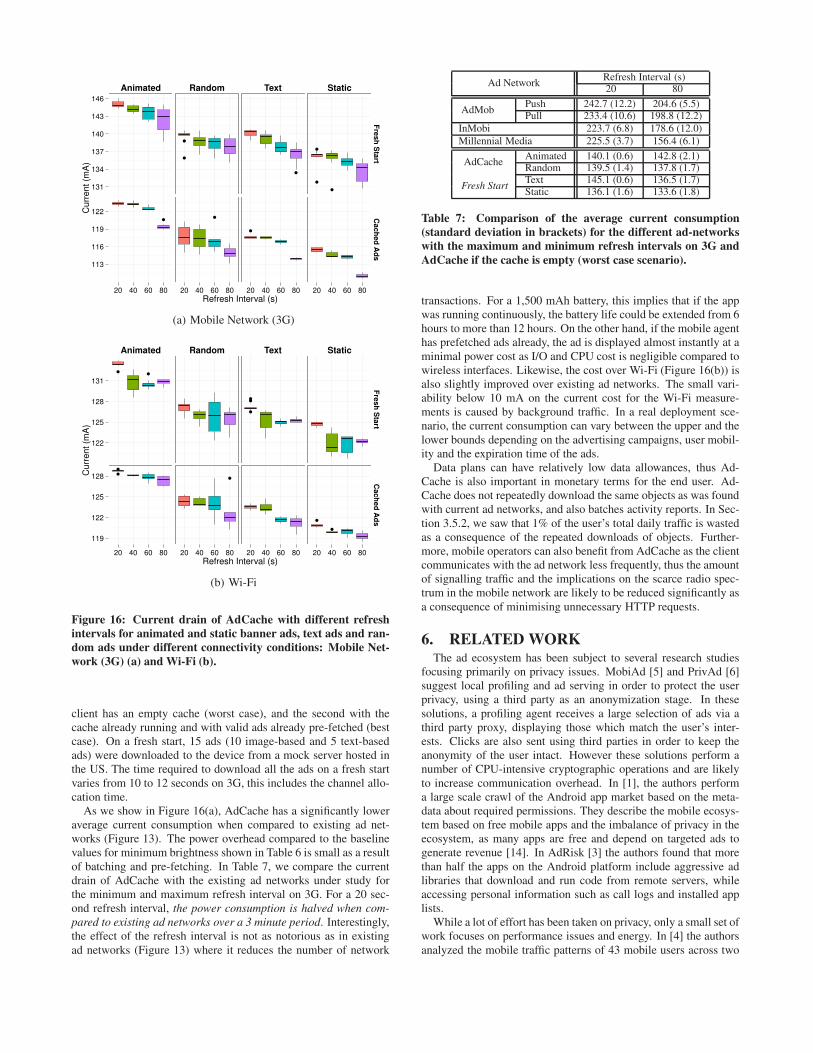
Animated Random Text Static
131
134
137
140
143
146
113
116
119
122
Fre
sh
Sta
rtC
ach
ed
Ad
s
20 40 60 80 20 40 60 80 20 40 60 80 20 40 60 80
Refresh Interval (s)
Curr
ent (m
A)
(a) Mobile Network (3G)
Animated Random Text Static
122
125
128
131
119
122
125
128
Fre
sh
Sta
rtC
ach
ed
Ad
s
20 40 60 80 20 40 60 80 20 40 60 80 20 40 60 80
Refresh Interval (s)
Curr
ent (m
A)
(b) Wi-Fi
Figure 16: Current drain of AdCache with different refresh
intervals for animated and static banner ads, text ads and ran-
dom ads under different connectivity conditions: Mobile Net-
work (3G) (a) and Wi-Fi (b).
client has an empty cache (worst case), and the second with thecache already running and with valid ads already pre-fetched (bestcase). On a fresh start, 15 ads (10 image-based and 5 text-basedads) were downloaded to the device from a mock server hosted inthe US. The time required to download all the ads on a fresh startvaries from 10 to 12 seconds on 3G, this includes the channel allo-cation time.
As we show in Figure 16(a), AdCache has a significantly loweraverage current consumption when compared to existing ad net-works (Figure 13). The power overhead compared to the baselinevalues for minimum brightness shown in Table 6 is small as a resultof batching and pre-fetching. In Table 7, we compare the currentdrain of AdCache with the existing ad networks under study forthe minimum and maximum refresh interval on 3G. For a 20 sec-ond refresh interval, the power consumption is halved when com-
pared to existing ad networks over a 3 minute period. Interestingly,the effect of the refresh interval is not as notorious as in existingad networks (Figure 13) where it reduces the number of network
Ad NetworkRefresh Interval (s)20 80
AdMobPush 242.7 (12.2) 204.6 (5.5)Pull 233.4 (10.6) 198.8 (12.2)
InMobi 223.7 (6.8) 178.6 (12.0)
Millennial Media 225.5 (3.7) 156.4 (6.1)
AdCacheAnimated 140.1 (0.6) 142.8 (2.1)Random 139.5 (1.4) 137.8 (1.7)
Fresh StartText 145.1 (0.6) 136.5 (1.7)Static 136.1 (1.6) 133.6 (1.8)
Table 7: Comparison of the average current consumption
(standard deviation in brackets) for the different ad-networks
with the maximum and minimum refresh intervals on 3G and
AdCache if the cache is empty (worst case scenario).
transactions. For a 1,500 mAh battery, this implies that if the appwas running continuously, the battery life could be extended from 6hours to more than 12 hours. On the other hand, if the mobile agenthas prefetched ads already, the ad is displayed almost instantly at aminimal power cost as I/O and CPU cost is negligible compared towireless interfaces. Likewise, the cost over Wi-Fi (Figure 16(b)) isalso slightly improved over existing ad networks. The small vari-ability below 10 mA on the current cost for the Wi-Fi measure-ments is caused by background traffic. In a real deployment sce-nario, the current consumption can vary between the upper and thelower bounds depending on the advertising campaigns, user mobil-ity and the expiration time of the ads.
Data plans can have relatively low data allowances, thus Ad-Cache is also important in monetary terms for the end user. Ad-Cache does not repeatedly download the same objects as was foundwith current ad networks, and also batches activity reports. In Sec-tion 3.5.2, we saw that 1% of the user’s total daily traffic is wastedas a consequence of the repeated downloads of objects. Further-more, mobile operators can also benefit from AdCache as the clientcommunicates with the ad network less frequently, thus the amountof signalling traffic and the implications on the scarce radio spec-trum in the mobile network are likely to be reduced significantly asa consequence of minimising unnecessary HTTP requests.
6. RELATED WORKThe ad ecosystem has been subject to several research studies
focusing primarily on privacy issues. MobiAd [5] and PrivAd [6]suggest local profiling and ad serving in order to protect the userprivacy, using a third party as an anonymization stage. In thesesolutions, a profiling agent receives a large selection of ads via athird party proxy, displaying those which match the user’s inter-ests. Clicks are also sent using third parties in order to keep theanonymity of the user intact. However these solutions perform anumber of CPU-intensive cryptographic operations and are likelyto increase communication overhead. In [1], the authors performa large scale crawl of the Android app market based on the meta-data about required permissions. They describe the mobile ecosys-tem based on free mobile apps and the imbalance of privacy in theecosystem, as many apps are free and depend on targeted ads togenerate revenue [14]. In AdRisk [3] the authors found that morethan half the apps on the Android platform include aggressive adlibraries that download and run code from remote servers, whileaccessing personal information such as call logs and installed applists.
While a lot of effort has been taken on privacy, only a small set ofwork focuses on performance issues and energy. In [4] the authorsanalyzed the mobile traffic patterns of 43 mobile users across two
different mobile platforms using packet sniffers. They find dailytraffic generation patterns of users and highlight the inefficienciescaused by the generally small transfer size of packets. Both [1]and [13] suggest the need to decouple the flow of information be-tween publishers, users and ad networks to better optimize energyconsumption. Eprof [2] is the first energy profiler for smartphoneapps. It found that as much as 75% of the energy consumed by freeapps is spent on mobile advertising.
The characteristics of the current mobile stacks and the tied re-lationship with energy management have been extensively studiedin the recent literature. Studies cover topics ranging from the low-est level of the 3G network stack with the radio resource allocationmanagement [10] to the highest level of the stack with the impactof Javascript and HTML code in web pages [15] on mobile de-vices. Other pieces of work tried to analyze the impact of middleboxes [16], along with other contributions such as [17] and [18].
Caching has been a popular solution for constrained systemsand networks, specially those with poor connectivity conditions.Caching has been proposed already as an efficient way of savingenergy on mobile networks [12]. In [19], the authors aim to reducethe bandwidth cost of mobile apps by proposing an HTTP proxy-based caching mechanism. They also highlight the potential ineffi-ciencies that can be found in terms of energy. In our work, we provethe efficiency of an independent caching system using a variety ofenergy measurements on 3G and Wi-Fi. AdCache also provides theability to separate permissions between advertising and app func-tionality, hence enabling AdCache to be a privacy-preserving pro-filer and advertising system.
The works described above are usually based on active experi-ments performed on a set of smartphones. To the best of our knowl-edge, this paper presents the first in-depth analysis of the ad net-work and mediation services ecosystem conducted on traffic froma real network. We did not limit our analysis to a single devicetype or ad agency, but instead we consistently compared Android,iPhone and iPad devices. We found several inefficiencies consid-ering the wastage of both energy and bandwidth, and we designedAdCache to limit them.
7. CONCLUSIONIn this paper, we undertook the first in-depth analysis of a large
mobile ad traffic data set. Our findings confirm on a large scalethat: i) ad networks impact a large proportion of users, especiallyon Android, but also on iPhone and iPad; ii) the ad ecosystem formobile apps is mainly dominated by Google services (e.g. AdMob,AdWhirl and Google Analytics); iii) ad traffic can be a significantfraction of the total traffic of the users; iv) mobile ad traffic is re-sponsible for important energy and network overhead by forcingoffline apps to become online apps; and v) many of these requestsare redundant due to the lack of caching capabilities in the SDKs.By taking a closer look at the popular AdMob service, we identifythat the typical session of such traffic is quite short and very similarto the demotion timeouts used by the 3GPP network technology.
We identify a clear incompatibility of the current ad distributionmechanisms with the quasi-static nature of ad content. During theanalysis of the data set, we have been surprised to see the impact ofthe user profiling traffic. We noticed a significant number of trans-missions to analytic services with similar energy and bandwidthusage issues as seen in ad networks.
We demonstrate the advantages of a caching approach throughthe implementation and evaluation of AdCache, a first step into re-ducing the impact of ad traffic on battery life and controlling thetraffic generated by ad networks. We demonstrate AdCache’s via-bility in terms of energy savings to tackle the identified issues re-
lated to ads traffic. Our future objectives go along two points, firstof which, we are planning to characterize the mobile ad ecosystemin greater detail, specially from an economics perspective, takingadvantage of the potential of the rule set. Second, we would liketo continue researching an energy and spectrum efficient ad de-livery mechanism by introducing more embedded logic, enablingmore offline capabilities such as user profiling, analytics supportand greater fine-grained targeted advertising.
Acknowledgements
Narseo Vallina-Rodriguez is partially funded by a Qualcomm Inno-vation Fellowship and Alessandro Finamore by the EU-IP projectmPlane funded by the European Commission under the grant n-318627. The authors would also like to thank the anonymous re-viewers and our shepherd Chen-Nee Chuah (UC Davids) for con-structive feedback on preparation of the final version of this pa-per. We also wish to thank Steve Uhlig (Queen Mary, University ofLondon), Vijay Erramilli (Telefonica Research), Charalampos Rot-sos, Steve Hand, Ilias Leontiadis, Christos Efstratiou, and DanieleQuercia (University of Cambridge) for insightful comments andfeedback.
8. REFERENCES
[1] Ilias Leontiadis, Christos Efstratiou, Marco Picone, andCecilia Mascolo. Don’t kill my ads!: balancing privacy in anad-supported mobile application market. In Proceedings of
the Twelfth Workshop on Mobile Computing Systems &
Applications, HotMobile ’12, pages 2:1–2:6, New York, NY,USA, 2012. ACM.
[2] Abhinav Pathak, Y. Charlie Hu, Ming Zhang, Paramvir Bahl,and Yi-Min Wang. Fine-grained power modeling forsmartphones using system call tracing. In Proceedings of the
sixth conference on Computer systems, EuroSys ’11, pages153–168, New York, NY, USA, 2011. ACM.
[3] Michael C. Grace, Wu Zhou, Xuxian Jiang, andAhmad-Reza Sadeghi. Unsafe exposure analysis of mobilein-app advertisements. In Proceedings of the fifth ACM
conference on Security and Privacy in Wireless and Mobile
Networks, WISEC ’12, pages 101–112, New York, NY,USA, 2012. ACM.
[4] Hossein Falaki, Dimitrios Lymberopoulos, Ratul Mahajan,Srikanth Kandula, and Deborah Estrin. A first look at trafficon smartphones. In Proceedings of the 10th annual
conference on Internet measurement, IMC ’10, pages281–287, New York, NY, USA, 2010. ACM.
[5] Hamed Haddadi, Pan Hui, and Ian Brown. Mobiad: privateand scalable mobile advertising. In Proceedings of the fifth
ACM international workshop on Mobility in the evolving
internet architecture, MobiArch ’10, pages 33–38, NewYork, NY, USA, 2010. ACM.
[6] Saikat Guha, Alexey Reznichenko, Kevin Tang, HamedHaddadi, and Paul Francis. Serving ads from localhost forperformance, privacy, and profit. In In Proceedings of the 8th
Workshop on Hot Topics in Networks, 2009.
[7] Ad Regex Dictionary.http://www.retitlc.polito.it/finamore/
mobileAdRegexDictionary.xlsx, 2012.
[8] Qiang Xu, Jeffrey Erman, Alexandre Gerber, Zhuoqing Mao,Jeffrey Pang, and Shobha Venkataraman. Identifying diverseusage behaviors of smartphone apps. In Proceedings of the
2011 ACM SIGCOMM conference on Internet measurement
conference, IMC ’11, pages 329–344, New York, NY, USA,2011. ACM.
[9] Feng Qian, Kee Shen Quah, Junxian Huang, Jeffrey Erman,Alexandre Gerber, Zhuoqing Mao, Subhabrata Sen, andOliver Spatscheck. Web caching on smartphones: ideal vs.reality. In Proceedings of the 10th international conference
on Mobile systems, applications, and services, MobiSys ’12,pages 127–140, New York, NY, USA, 2012. ACM.
[10] Feng Qian, Zhaoguang Wang, Alexandre Gerber,Zhuoqing Morley Mao, Subhabrata Sen, and OliverSpatscheck. Characterizing radio resource allocation for 3Gnetworks. In Proceedings of the 10th annual conference on
Internet measurement, IMC ’10, pages 137–150, New York,NY, USA, 2010. ACM.
[11] Aaron Carroll and Gernot Heiser. An analysis of powerconsumption in a smartphone. In Proceedings of the 2010
USENIX conference on USENIX annual technical
conference, USENIXATC’10, pages 21–21, Berkeley, CA,USA, 2010. USENIX Association.
[12] Niranjan Balasubramanian, Aruna Balasubramanian, andArun Venkataramani. Energy consumption in mobile phones:a measurement study and implications for networkapplications. In Proceedings of the 9th ACM SIGCOMM
conference on Internet measurement conference, IMC ’09,pages 280–293, New York, NY, USA, 2009. ACM.
[13] Paul Pearce, Adrienne Porter Felt, Gabriel Nunez, and DavidWagner. Addroid: Privilege separation for applications andadvertisers in android. In Proceedings of ACM Symposium
on Information, Computer and Communications Security,AsiaCCS’12. ACM, 2012.
[14] William Enck, Peter Gilbert, Byung-Gon Chun, Landon P.Cox, Jaeyeon Jung, Patrick McDaniel, and Anmol N. Sheth.Taintdroid: an information-flow tracking system for realtimeprivacy monitoring on smartphones. In Proceedings of the
9th USENIX conference on Operating systems design and
implementation, OSDI’10, pages 1–6, Berkeley, CA, USA,2010. USENIX Association.
[15] Narendran Thiagarajan, Gaurav Aggarwal, Angela Nicoara,Dan Boneh, and Jatinder P. Singh. Who killed my battery?:analyzing mobile browser energy consumption. InProceedings of the 21st international conference on World
Wide Web, WWW ’12, pages 41–50, New York, NY, USA,April 2012. ACM.
[16] Zhaoguang Wang, Zhiyun Qian, Qiang Xu, Zhuoqing Mao,and Ming Zhang. An untold story of middleboxes in cellularnetworks. SIGCOMM Comput. Commun. Rev.,41(4):374–385, August 2011.
[17] Narseo Vallina-Rodriguez and Jon Crowcroft. Energymanagement techniques in modern smartphones.Communications Surveys Tutorials, IEEE, PP, 2012.
[18] H. Haverinen, J. Siren, and P. Eronen. Energy consumptionof always-on applications in wcdma networks. In Vehicular
Technology Conference, 2007. VTC2007-Spring. IEEE 65th,pages 964 –968, april 2007.
[19] Azeem J. Khan, V. Subbaraju, Archan Misra, and SrinivasanSeshan. Mitigating the true cost of advertisement-supported”free” mobile applications. In HotMobile’12, 2012.


![commercials [kə‘mə: ʃ əl] 商业广 告 news weather forecast](https://img.pdfslide.tips/doc/110x75/5697bfbf1a28abf838ca36c2/commercials-km-l-news-weather-forecast.jpg)