Embed Size (px)
Citation preview

UNIVERSITY OF OULU P .O. Box 8000 F I -90014 UNIVERSITY OF OULU FINLAND
A C T A U N I V E R S I T A T I S O U L U E N S I S
University Lecturer Tuomo Glumoff
University Lecturer Santeri Palviainen
Postdoctoral research fellow Sanna Taskila
Professor Olli Vuolteenaho
University Lecturer Veli-Matti Ulvinen
Planning Director Pertti Tikkanen
Professor Jari Juga
University Lecturer Anu Soikkeli
Professor Olli Vuolteenaho
Publications Editor Kirsti Nurkkala
ISBN 978-952-62-1637-9 (Paperback)ISBN 978-952-62-1638-6 (PDF)ISSN 0355-3213 (Print)ISSN 1796-2226 (Online)
U N I V E R S I TAT I S O U L U E N S I SACTAC
TECHNICA
U N I V E R S I TAT I S O U L U E N S I SACTAC
TECHNICA
OULU 2017
C 622
Xiaobai Li
READING SUBTLE INFORMATION FROM HUMAN FACES
UNIVERSITY OF OULU GRADUATE SCHOOL;UNIVERSITY OF OULU,FACULTY OF INFORMATION TECHNOLOGY AND ELECTRICAL ENGINEERING;INFOTECH OULU
C 622
AC
TAX
iaobai Li
C622etukansi.kesken.fm Page 1 Thursday, August 24, 2017 11:59 AM


ACTA UNIVERS ITAT I S OULUENS I SC Te c h n i c a 6 2 2
XIAOBAI LI
READING SUBTLE INFORMATION FROM HUMAN FACES
Academic dissertation to be presented with the assent ofthe Doctoral Training Committee of Technology andNatural Sciences of the University of Oulu for publicdefence in the Leena Palotie auditorium (101A) of theFaculty of Medicine (Aapistie 5 A), on 18 September 2017,at 13 p.m.
UNIVERSITY OF OULU, OULU 2017

Copyright © 2017Acta Univ. Oul. C 622, 2017
Supervised byProfessor Matti PietikäinenAssociate Professor Guoying Zhao
Reviewed byDoctor Julia KuosmanenProfessor Thomas Moeslund
ISBN 978-952-62-1637-9 (Paperback)ISBN 978-952-62-1638-6 (PDF)
ISSN 0355-3213 (Printed)ISSN 1796-2226 (Online)
Cover DesignRaimo Ahonen
JUVENES PRINTTAMPERE 2017
OpponentProfessor Karen Eguiazarian
Li, Xiaobai, Reading subtle information from human faces. University of Oulu Graduate School; University of Oulu; Faculty of Information Technologyand Electrical Engineering; Infotech OuluActa Univ. Oul. C 622, 2017University of Oulu, P.O. Box 8000, FI-90014 University of Oulu, Finland
Abstract
The face plays an important role in our social interactions as it conveys rich sources ofinformation. We can read a lot from one face image, but there is also information we cannotperceive without special devices. The thesis concerns using computer vision methodologies toanalyse two kinds of subtle facial information that can hardly be perceived by naked eyes: themicro-expression (ME), and the heart rate (HR).
MEs are rapid, involuntary facial expressions which reveal emotions people do not intend toshow. It is difficult for people to perceive MEs as they are too fast and subtle, thus automatic MEanalysis is valuable work which may lead to important applications. In the thesis, the progressesof ME studies are reviewed, and four parts of work are described. 1) We introduce the firstspontaneous ME database, the SMIC. The lacking of data is hindering ME analysis research, as itis difficult to collect spontaneous MEs. The protocol for inducing and annotating SMIC isintroduced to help future ME collections. 2) A framework including three features and a videomagnification process is introduced for ME recognition, which outperforms other state-of-the-artmethods on two ME databases. 3) An ME spotting method based on feature difference analysis isdescribed, which can spot MEs from spontaneous long videos. 4) An automatic ME analysissystem (MESR) was proposed for firstly spotting and then recognising MEs.
The HR is an important indicator of our health and emotional status. Traditional HRmeasurements require skin-contact which cannot be applied remotely. We propose a methodwhich can counter for illumination changes and head motions and measure HR remotely fromcolor facial videos. We also apply the method for solving the face anti-spoofing problem. Weshow that the pulse-based feature is more robust than traditional texture-based features againstunseen mask spoofs. We also show that the proposed pulse-based feature can be combined withother features to build a cascade system for detecting multiple types of attacks.
At last, we summarize the contributions of the work, and propose future plans about ME andHR studies based on limitations of the current work. It is also planned to combine the ME and HR(maybe also other subtle signals from face) to build a multimodal system for affective statusanalysis.
Keywords: affective, anti-spoofing, face, heart rate, micro-expression

Li, Xiaobai, Piilotiedon tulkinta ihmisen kasvoista. Oulun yliopiston tutkijakoulu; Oulun yliopisto; Tieto- ja sähkötekniikan tiedekunta; InfotechOuluActa Univ. Oul. C 622, 2017Oulun yliopisto, PL 8000, 90014 Oulun yliopisto
Tiivistelmä
Kasvot ovat monipuolinen informaatiolähde ja keskeinen ihmisten välisessä vuorovaikutuksessa.Pystymme päättelemään paljon yhdestäkin kasvokuvasta, mutta kasvoissa on paljon tietoa, jotaei pysty irrottamaan ilman erityiskeinoja. Tässä työssä analysoidaan konenäöllä ihmiselle vai-keasti havaittavaa tietoa: mikroilmeitä ja sydämen sykettä.
Tahdosta riippumattomat mikroilmeet paljastavat tunteita, joita ihmiset pyrkivät piilotta-maan. Mikroilmeiden havaitseminen on vaikeaa niiden nopeuden ja pienuuden vuoksi, jotenautomaattinen analyysi voi johtaa uusiin merkittäviin sovelluksiin. Tämä työ tarkastelee mikroil-metutkimuksen edistysaskeleita ja sisältää neljä uutta tulosta. 1) Spontaanien mikroilmeiden tie-tokanta (Spontaneous MIcroexpression Corpus, SMIC). Spontaanien mikroilmeiden aiheuttami-nen datan saamiseksi on oma haasteensa. SMIC:n keräämisessä ja mikroilmeiden annotoinnissakäytetty menettely on kuvattu myöhemmän datan keruun ohjeistukseksi. 2) Aiempia mikroilmei-den tunnistusmenetelmiä paremmaksi kahden testitietokannan avulla todennettu ratkaisu, jokakäyttää kolmea eri piirrettä ja videon suurennusta. 3) Piirre-eroanalyysiin perustuva mikroilmei-den havaitsemismenetelmä, joka havaitsee ne pitkistä realistisista videoista. 4) Automaattinenanalyysijärjestelmä (Micro-Expression Spotting and Recognition, MESR), jossa mikroilmeethavaitaan ja tunnistetaan.
Sydämen syke on tärkeä terveyden ja tunteiden indikoija. Perinteiset sykkeenmittausmenetel-mät vaativat ihokontaktia, eivätkä siten toimii etäältä. Tässä työssä esitetään sykkeen videoltapienistä värimuutoksista mittaava menetelmä, joka sietää valaistusmuutoksia ja sallii pään liik-keet. Menetelmä on monikäyttöinen ja sen sovelluksena kuvataan todellisten kasvojen varmenta-minen sykemittauksella. Tulokset osoittavat sykepiirteiden toimivan perinteisiä tekstuuripiirtei-tä paremmin uudenlaisia naamarihuijauksia vastaan. Syketietoa voidaan myös käyttää osana sar-jatyyppisissä ratkaisuissa havaitsemaan useanlaisia huijausyrityksiä.
Työn yhteenveto keskittyy suunnitelmiin parantaa mikroilmeiden ja sydämen sykkeen ana-lyysimenetelmiä nykyisen tutkimuksen rajoitteiden pohjalta. Tavoitteena on yhdistää mikroil-meiden ja sydämen sykkeen analyysit, sekä mahdollisesti muuta kasvoista saatavaa tietoa, multi-modaaliseksi affektiivisen tilan määrittäväksi ratkaisuksi.
Asiasanat: affektiivinen, huijausesto, kasvot, mikroilme, sydämen syke


To my family, and Valio.

8

Acknowledgements
The research work of this thesis was carried out in the Center for Machine Vision andSignal Analysis at University of Oulu, Finland, between 2011 and 2016. First of all,I would like to express my gratitude to my supervisors, Prof. Matti Pietikäinen andAssociate Prof. Guoying Zhao, for their supports and guidances. I am especially gratefulfor their trust and patience allowing enough time for me to try out ideas and graduallybecome an independent researcher.
The Center for Machine Vision and Signal Analysis has been an excellent place formy study, not only because of the very pleasant and easy-going atmosphere, but alsobecause of the talented and helpful personnels. I’m very grateful to be able to workwith these amazing people in our group. I am especially thankful to all my co-authors,I couldn’t have accomplished these achievements without their help.
I would like to gratefully acknowledge the official reviewers, Prof. Thomas B.Moeslund and Dr. Julia Kuosmanen for their constructive comments and feedbacks.I also want to thank Prof. Olli Silvén for helping translate the abstract into Finnish onsuch a short notice.
I would like to thank Infotech Oulu Doctoral Program for the financial support thathas given me the possibility to focus on the research topic throughout my doctoralstudies and to compile a unified thesis.
The time of PhD studying marks a special journey in my life, with pains and gains.I wish to express my deepest gratitude to my family and all my friends. It was yoursupport and love, that helped me through the valleys and reached the view up on the moun-tain. My parents are always the solid harbour, encouraging me to sail out chasing dreams.And there is my dear husband Qiang, his companion gave me strength during the journey.I also feel lucky to have my dog Valio. He is the chocolate that sweets up every day.
Oulu, August 2017.
9

10

Abbreviations
3DMAD 3D mask attack dataset
AFF Average feature frame
AU Action Unit
AUC Area under the ROC-curve
BP Blood pressure
bpm (Heart) beats per minute
BVP Blood volume pulse
CASME Chinese Academy of Sciences micro-expression database
CASMEII The 2nd version of CASME
CF Current frame
CNN Convolutional neural networks
DCT Discrete cosine transform
DRMF Discriminative response map fitting
DRLSE Distance regularized level set evolution
ECG Electrocardiography
EER Equal error rate
FD Feature difference
FE Facial expression
FFT Fast Fourier transform
FNR False negative rate
FPR False positive rate
fps Frames per second
Hb Hemoglobin
HCI Human-computer interaction
HF Head frame
HIGO Histograms of image gradients orientation
HMMs Hidden Markov Models
HOF Histogram of optical flow
HOG Histograms of oriented gradients
HR Heart rate
HRV Heart rate variation
11

HS High speed (camera)
HTER Half total error rate
ICA Independent Component Analysis
KLT Kanade-Lucas-Tomasi
LBP Local Binary Pattern
LBP-TOP LBP on three orthogonal planes
LED Light-emitting diode
LMS Least mean square
LWM Local weighted mean
ME Micro-expression
MESR Micro-expression spotting and recognition system
METT Micro-expression training tool
MFSD The MSU Mobile Face Spoofing Dataset
NIR Near-infrared (camera)
NLMS Normalized least mean square
PCA Principal Component Analysis
PPG Photoplethysmography
PSD Power spectral density
REAL-F High quality 3D mask attack dataset
RMSE Root mean square error
ROC Receiver operating characteristic
ROI Region of interests
RR Respiration rate
SD Standard deviation
SMIC Spontaneous micro-expression corpus
SMIC-E The extended version of SMIC
SMIC-sub The 1st version of SMIC
SVM Support Vector Machine
TF Tail frame
TIM Temporal interpolation model
VIS Visible light (camera)
12

List of original publications
This thesis is based on the following articles, which are referred to in the text by theirRoman numerals (I–V):
I Pfister T, Li X, Zhao G & Pietikäinen M (2011) Recognising spontaneous facial micro-expressions. IEEE International Conference on Computer Vision (ICCV), 2011, 1449-1456.
II Li X, Pfister T, Huang X, Zhao G & Pietikäinen M (2013) A spontaneous micro-expressiondatabase: Inducement, collection and baseline. 10th IEEE International Conference andWorkshops on Automatic Face and Gesture Recognition (FG), 2013: 1-6.
III Li X, Hong X, Moilanen A, Huang X, Pfister T, Zhao G, & Pietikäinen M (2017) Towardsreading hidden emotions: A comparative study of spontaneous micro-expression spottingand recognition methods. IEEE Transactions on Affective Computing (In press, availableonline).
IV Li X, Chen J, Zhao G, & Pietikäinen (2014) Remote heart rate measurement from facevideos under realistic situations. Proceedings of the IEEE Conference on Computer Visionand Pattern Recognition (CVPR) 2014: 4264-4271.
V Li X, Komulainen J, Zhao G, Yuen PC & Pietikäinen M (2016) Generalized face anti-spoofing by detecting pulse from face videos. 23rd International Conference on PatternRecognition (ICPR) 2016: 4244-4249.
Publication I is a joint work with Dr. Tomas Pfister. The idea of how to collect micro-expression data was from the present author, and the major work of data collection andannotation was done by the present author. The present author also helped in designingthe structure of experiments and the discussion of the results in paper I. The author ofthe dissertation is the first author in articles II-V, thus carried the main responsibility forthe writing of all four papers, while valuable comments and suggestions were given byco-authors. For publication II, all work about the database creation and annotation weredone by the present author. The present author also carried out part of the data evaluationexperiments with the help of the second author Dr. Xiaohua Huang. Publication III is acomposition of four sections of studies including nine experiments. The present authortook an important role in creation of the ideas presented in the paper, designed thestructure of whole paper, summarized and organized experimental results for discussions,and carried out one section of experiments about human subjects evaluation. The secondauthor Dr. Xiaopeng Hong and the third author Antti Moilanen greatly helped with theconducting of experiments for the other three sections. For publication IV and V, thepresent author was the major role of creating the ideas, conducting the experiments, andpresenting all the results with discussions and conclusions, while valuable commentsand suggestions were given by co-authors.
13

The author of the dissertation also collaborated and contributed to several otherrelevant publications, of which the contents are not included in the thesis due to lengthlimitation, including:
1. Yan W, Li X, Wang S, Zhao G, Liu Y, Chen Y & Fu X (2014) CASMEII: An improvedspontaneous micro-expression database and the baseline evaluation. PloS one 9(1), e86041.
2. Wang S, Yan W, Li X, Zhao G, Zhou C, Fu X, Yang M & Tao J (2015) Micro-expressionrecognition using color spaces. IEEE Transaction on Image Processing 24 (12), 6034-6047.
3. Huang X, Kortelainen J, Zhao G, Li X, Moilanen A, Seppänen T & Pietikäinen M (2016)Multi-modal emotion analysis from facial expressions and electroencephalogram. ComputerVision and Image Understanding. 2016, 147: 114-124.
4. Kortelainen J, Tiinanen S, Huang X, Li X, Laukka S, A, Pietikäinen M & Seppänen T (2012)Multimodal emotion recognition by combining physiological signals and facial expressions: Apreliminary study. Annual International Conference of the IEEE Engineering in Medicine andBiology Society. 2012, 5238-5241.
14

Contents
AbstractTiivistelmäAcknowledgements 9Abbreviations 11List of original publications 13Contents 151 Introduction 17
1.1 Background and motivation . . . . . . . . . . . . . . . . . . . . . . . . . . . . . . . . . . . . . . . . . . . 17
1.2 Aims and objectives . . . . . . . . . . . . . . . . . . . . . . . . . . . . . . . . . . . . . . . . . . . . . . . . . . 18
1.3 Summary of original articles . . . . . . . . . . . . . . . . . . . . . . . . . . . . . . . . . . . . . . . . . . 19
1.4 Organization of the thesis . . . . . . . . . . . . . . . . . . . . . . . . . . . . . . . . . . . . . . . . . . . . . 21
2 Reading micro-expressions 232.1 Introduction . . . . . . . . . . . . . . . . . . . . . . . . . . . . . . . . . . . . . . . . . . . . . . . . . . . . . . . . . 23
2.1.1 ME study in psychology . . . . . . . . . . . . . . . . . . . . . . . . . . . . . . . . . . . . . . . 23
2.1.2 ME study in computer vision . . . . . . . . . . . . . . . . . . . . . . . . . . . . . . . . . . . 24
2.1.3 Spontaneous vs. posed MEs . . . . . . . . . . . . . . . . . . . . . . . . . . . . . . . . . . . . 25
2.2 Related work . . . . . . . . . . . . . . . . . . . . . . . . . . . . . . . . . . . . . . . . . . . . . . . . . . . . . . . . 26
2.2.1 Review of ME databases . . . . . . . . . . . . . . . . . . . . . . . . . . . . . . . . . . . . . . . 26
2.2.2 Review of ME recognition studies . . . . . . . . . . . . . . . . . . . . . . . . . . . . . . . 28
2.2.3 Review of ME spotting studies . . . . . . . . . . . . . . . . . . . . . . . . . . . . . . . . . . 30
2.3 Collecting spontaneous ME data . . . . . . . . . . . . . . . . . . . . . . . . . . . . . . . . . . . . . . .32
2.3.1 Inducement . . . . . . . . . . . . . . . . . . . . . . . . . . . . . . . . . . . . . . . . . . . . . . . . . . . 32
2.3.2 Annotation . . . . . . . . . . . . . . . . . . . . . . . . . . . . . . . . . . . . . . . . . . . . . . . . . . . 36
2.3.3 The SMIC database . . . . . . . . . . . . . . . . . . . . . . . . . . . . . . . . . . . . . . . . . . . . 37
2.4 ME recognition . . . . . . . . . . . . . . . . . . . . . . . . . . . . . . . . . . . . . . . . . . . . . . . . . . . . . . 38
2.4.1 A framework for ME recognition . . . . . . . . . . . . . . . . . . . . . . . . . . . . . . . 38
2.4.2 Evaluation of the framework . . . . . . . . . . . . . . . . . . . . . . . . . . . . . . . . . . . . 44
2.5 ME spotting . . . . . . . . . . . . . . . . . . . . . . . . . . . . . . . . . . . . . . . . . . . . . . . . . . . . . . . . . 49
2.5.1 A method for ME spotting . . . . . . . . . . . . . . . . . . . . . . . . . . . . . . . . . . . . . . 50
2.5.2 Experimental results . . . . . . . . . . . . . . . . . . . . . . . . . . . . . . . . . . . . . . . . . . . 53
15

2.6 An automatic ME analysis system (MESR) combining Spotting andRecognition . . . . . . . . . . . . . . . . . . . . . . . . . . . . . . . . . . . . . . . . . . . . . . . . . . . . . . . . . 55
2.7 Conclusion . . . . . . . . . . . . . . . . . . . . . . . . . . . . . . . . . . . . . . . . . . . . . . . . . . . . . . . . . . 573 Heart rate measurement from face and its application for face
anti-spoofing 593.1 Introduction . . . . . . . . . . . . . . . . . . . . . . . . . . . . . . . . . . . . . . . . . . . . . . . . . . . . . . . . . 593.2 Related works . . . . . . . . . . . . . . . . . . . . . . . . . . . . . . . . . . . . . . . . . . . . . . . . . . . . . . . 603.3 Measuring HR from face under realistic situations . . . . . . . . . . . . . . . . . . . . . . . 63
3.3.1 Method . . . . . . . . . . . . . . . . . . . . . . . . . . . . . . . . . . . . . . . . . . . . . . . . . . . . . . . 633.3.2 Experimental results . . . . . . . . . . . . . . . . . . . . . . . . . . . . . . . . . . . . . . . . . . . 69
3.4 Application for face anti-spoofing . . . . . . . . . . . . . . . . . . . . . . . . . . . . . . . . . . . . . 743.4.1 Background review . . . . . . . . . . . . . . . . . . . . . . . . . . . . . . . . . . . . . . . . . . . . 753.4.2 A Pulse-based method for face anti-spoofing . . . . . . . . . . . . . . . . . . . . . 773.4.3 Experimental results . . . . . . . . . . . . . . . . . . . . . . . . . . . . . . . . . . . . . . . . . . . 78
3.5 Conclusion . . . . . . . . . . . . . . . . . . . . . . . . . . . . . . . . . . . . . . . . . . . . . . . . . . . . . . . . . . 844 Summary 87
4.1 Contributions . . . . . . . . . . . . . . . . . . . . . . . . . . . . . . . . . . . . . . . . . . . . . . . . . . . . . . . . 874.2 Limitations and future work . . . . . . . . . . . . . . . . . . . . . . . . . . . . . . . . . . . . . . . . . . . 89
4.2.1 ME analysis . . . . . . . . . . . . . . . . . . . . . . . . . . . . . . . . . . . . . . . . . . . . . . . . . . 894.2.2 HR measurement . . . . . . . . . . . . . . . . . . . . . . . . . . . . . . . . . . . . . . . . . . . . . . 904.2.3 Combining ME and HR for affective status analysis . . . . . . . . . . . . . . . 90
References 93Original publications 99
16

1 Introduction
1.1 Background and motivation
We, the human beings, are face experts. You might be so used to it that you did not evenrealize, that we have extraordinary ability to acquire rich information from human faces.Compared to other kinds of objects, e.g., dogs or houses, our brains have developedspecial function modules for the face so that we are better at processing it. One reasonfor why we have gain the face-expertise cognitive ability might be for coping withcomplex social interactions.
Human faces are rich sources of visual information. We can read many things froma face image. If it is of a known person, we can recognize him or her immediately; if itis of a stranger, we can still make good guesses about the person’s gender, age, ethnicity,and also perceive his or her emotional status if the face is not neutral. But this doesn’tmean that we have got the ‘full package’. Despite the fact that we are face-experts, thereis still facial information that we are not able to read with our naked eyes.
I was always fascinated with human faces that my Bachelor and Master studieswere all about the face. During early stage of my Doctor study, I found that amongthe plenteous information exhibited on our faces, there are some interesting sourcesof information that can hardly be captured by human eyes. The first kind of suchinformation is the micro-expression (ME), which indicates a phenomenon of very fastand subtle facial expression that occur on human faces. The second kind is facial heartrate (HR) information, which indicates the phenomenon of facial skin color changes thatcaused by the heart beat and facial vascular volume changes.
Our visual cognition function is more sophisticatedly built-up in our brains comparingto other senses (e.g., hearing and smell). However our ability to acquire visualinformation is nevertheless limited by the physiological mechanism. Visual changes thatfall beyond our perceptional range (either too subtle in the spatial domain or too fast inthe time domain) will be omitted by our eyes. We hardly see an ME from someone’sface because an ME occurs briefly, and during the flash of its presence the involvedmuscle movement is also too small for us to capture. The facial HR color changes arepersistently presented on the face, but nobody can read people’s heart rate from a facebecause the color changes (caused by heart pulsation) are too subtle for our eyes. But a
17

fast speed and high resolution camera is capable of physically capturing these subtlevisual changes.
The computer was invented for the purpose of helping us human beings to betterprocess information, and the human face has always been one of the most popular topics.It is one way of thinking to train computers for a task that humans are capable (e.g., facedetection, or face recognition), and we train them to do it better and faster. On the otherside, we can also train computers for tasks that we are incapable, i.e., capturing subtleinformation that can hardly be perceived with naked eyes. How can we train computersto achieve subtle information such as the ME and HR from facial videos? This thoughtleads to all the research works in my dissertation.
1.2 Aims and objectives
The first main objective of my PhD study is about ME analysis. Since affectivecomputing is one major focus in our research group, I was looking for something thatis ‘related to emotion analysis’ and is about ‘the face’ to be my thesis topic. In onegroup meeting in 2010, the idea of ME was firstly brought up by Dr. Tomas Pfister, theco-author of papers I, II and III, and I was immediately attracted by it. At that time, theME came to more people’s knowledge since psychological studies found it might be aclue for lie detection, and there were popular TV series based on the idea. MEs are toosubtle for people to see except trained specialists, both Tomas and I thought it would bea valuable and interesting study to build a framework for automatic ME recognition.
During the research of ME recognition I soon realized the problem of lacking properdatabase. As the ME was a new topic at that time, there was no spontaneous ME databaseavailable. Collecting a spontaneous ME database was added as one sub-objective ofmy PhD study. Later on after I made some progress about ME recognition, it seemedreasonable to also consider the problem of ME spotting, which could be combined withME recognition to form a more complete system of automatic ME analysis. So to builda full automatic ME analysis system for spotting and then recognising MEs was addedlater as an extended sub-objective about ME analysis.
The second main objective of my PhD study is HR measurement from face. It mayseem deviated but my original purpose of studying HR measurement was to analyse theemotional status from a multimodal perspective. In 2011 I was involved in one projectfocusing on multimodal emotional analysis. I was looking for methods to combine HRwith facial clues for emotional status analysis, when I came across the paper (Poh et al.
18
2010) which proposed a method to measure HR remotely from facial videos. I tested themethod on several facial videos, and found it worked well only on videos recorded undercontrolled conditions. But for videos containing illumination changes and motions (e.g.,the video clips we collected containing MEs), the method didn’t work well. Since it issuch an attracting idea that multimodal emotion recognition might be realized usingonly face videos as the input, I decided to set it as my second objective, and devote timeto improve the HR measurement method so that it can be used on videos with facialexpressions.
Meanwhile I also thought about potential applications of the remote HR measurementtechnology. Biometrics and face anti-spoofing was another research focus in our group,so one intuitive idea was that the HR information could be utilized to detect face livenessfor anti-spoofing, which was setted as one sub-objective for my HR measurement study.
1.3 Summary of original articles
Five articles were published according to the objectives described ahead. Paper I,paper II and paper III are under the scope of the first main objective about ME analysis.Paper I and paper III propose ME recognition methods; paper II provides a spontaneousME database; paper III also proposes an ME spotting method and a full automaticME analysis system for both ME spotting and recognition. Paper IV and paper Vare under the scope of the second main objective about HR measurement. Paper IVproposes an improved HR measurement method; paper V applies the method for theface anti-spoofing problem. Contents of each article are briefly introduced bellow.
Paper I is my first work about the spontaneous facial ME analysis which were donein collaborating with Dr. Tomas Pfister. It is difficult to elicit spontaneous MEs andthere was no data available before this work. One important contribution of this work isthat we introduced an inhibited emotion inducing paradigm which allow us to collect thefirst spontaneous ME corpus, referred as the first version of SMIC. By the time whenthis paper was submitted a small part of SMIC data was ready, which includes 77 MEsfrom six subjects. Another contribution of this paper is that we proposed a methodframework for ME recognition. The method is tested on the collected SMIC data andachieved promising results.
Paper II introduces the full version of the SMIC databse. The first version of SMICused in paper I includes six subjects’ data recorded with one camera. After that wecontinued data collection and expanded SMIC, the final version of SMIC includes
19

16 subjects’ data recorded with three cameras. Altogether 164 MEs were annotatedfrom the original videos and labelled into three emotional categories. The data ispublicly shared (http://www.cse.oulu.fi/SMICDatabase) since the publication ofthis paper to facilitate ME studies. Besides, paper II introduces in details about theprotocol we used to collect SMIC, including the set-ups, emotion inducing materials, andthe annotation process which will help future ME collecting work. ME recognition testsare performed on the three datasets of SMIC using the LBP-TOP (Zhao & Pietikäinen2007) feature with SVM (Chang & Lin 2011), and the results are provided as baselinesfor comparisons.
Paper III is the composition of four parts of ME studies achieved lately by thecollaboration of all authors. Firstly, we propose an ME recognition framework involvesboth temporal interpolation and video motion magnification to facilitate ME recognitionperformance. The framework is comprehensively evaluated on each step with threedifferent features. The best configuration of the framework outperforms previousmethods by a large margin on two spontaneous ME databases. Secondly, we alsopropose a framework for spotting MEs from spontaneous long video sequences. In thethird part, we propose a full automatic ME analysis system (MESR), which first spotand then recognize MEs. Finally, we also enrol human subjects to compare humansubjects’ performance with the computer’s, and results demonstrate that our proposedmethods can achieve comparable or even better performance than humans.
Paper IV proposes an improved method for remote HR measurement from facialvideos. The method includes three major steps that deal with the noises caused by rigidhead motions, illumination changes, and non-rigid facial movements accordingly. Theproposed method shows significant advantage over previous methods (Poh et al. 2010,Balakrishnan et al. 2013) on videos recorded under more challenging conditions whenillumination variations and head motions are involved. The proposed method suits betterfor HR measurement under some human-computer-interaction (HCI) scenarios, suchlike movie watching or video game playing.
In paper V, the HR measurement method was applied for solving the face anti-spoofing problem. This paper was done by collaborating with Dr. Jukka Komulainenwho is an expert in face anti-spoofing research field. Basing on the fact that a pulse signalexists in real living faces but not in any mask or print materials, the HR measurementmethod was used to build a pulse-based solution for face liveness detection. Theproposed method is evaluated on three databases and results show that the pulse-basedmethod can detect both mask attacks and print attacks but not video attacks. A robust
20

cascade system is also proposed combining the pulse-based feature with traditionaltexture-based features to work together against different types of attacks. The cascadesystem suits the need in real application scenarios where various types of attacks mayhappen.
1.4 Organization of the thesis
This thesis is organized as follows:Chapter 1 briefly introduces the contents of the thesis: including the background and
motivations of my PhD study, the objectives, and the contributions and contents of thefive original articles that are covered in the thesis.
Chapter 2 introduces the work about ME analysis, including the inducement andannotation of ME data, ME recognition method, ME spotting method and the MESRsystem. This part of contents include data, methods, and results that were originallypresented in papers I, II and III.
Chapter 3 introduces the work about measuring HR from facial videos, including aliterature review of previous research, a proposed method for HR measurement undermore challenging conditions, and the application of the method for face anti-spoofingproblem. This part of contents include methods, data, and results that were originallypresented in paper IV and paper V.
Chapter 4 summarizes contributions of all the work, discusses about limitations andpropose future research plans.
21

22
2 Reading micro-expressions
2.1 Introduction
2.1.1 ME study in psychology
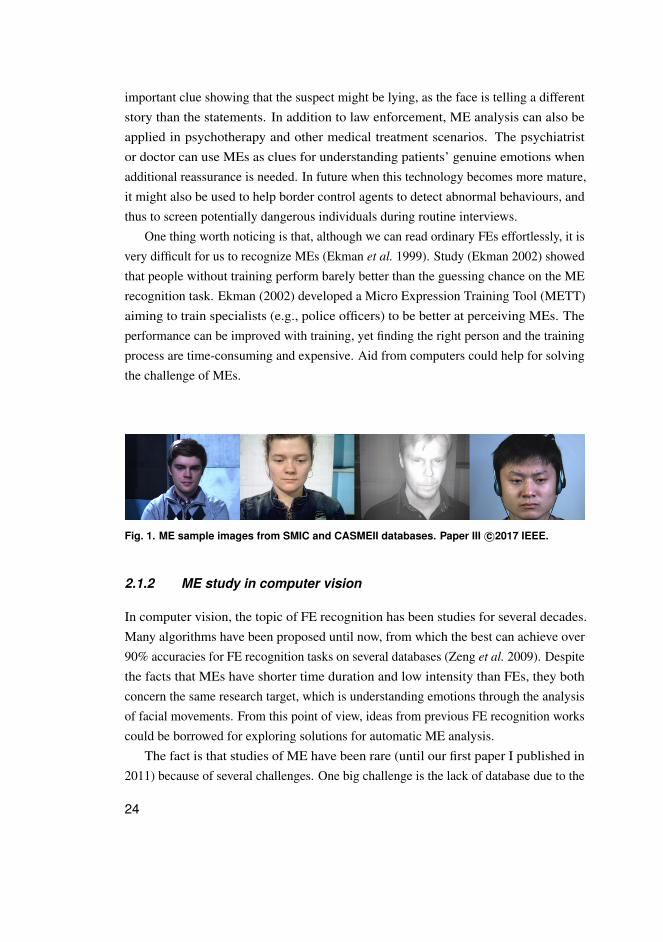
Emotion plays an important role in our social interactions. Facial expression (FE) is oneof the major ways through which we express our own and perceive others’ emotions.Aside from the ordinary FEs that we see everyday, there are other circumstances whenpeople try to hide their feelings, and the suppressed emotions manifest themselves in aspecial form of micro-expressions (ME). An ME is a very brief, involuntary FE thatreveals people’s true feelings. ME may occur in high-stake situations when peopletry to conceal or mask their true feelings for either gaining advantage or avoiding loss(Ekman 2003). Figure 1 shows ME sample images from two ME databases. MEs aredifferent from ordinary FEs from two aspects. First, MEs are much shorter than ordinaryFEs. According to studies of Yan et al. (2013a) and Matsumoto & Hwang (2011), thelength definition varies from 1/25 to 1/2 second. Second, for MEs the involved musclemovements are subtle and sometimes also unilateral (Porter & ten Brinke 2008), whileordinary FEs movements are usually bilateral and more intense.
The first ME phenominen was reported by Haggard & Isaacs (1966), who calledthem ‘micromomentary facial expression’. After three years Ekman & Friesen (1969)also reported finding MEs while examining a psychiatric patient’s video. The patientwith depression problem appeared to be happy during the consulting meeting. Butafter detailed checking of the video tape Ekman et al. found a brief anguish expressionlasting for only two frames (1/12 second). In the patient’s another consulting sessionshe confessed that she lied to conceal her plan to commit suicide. In the followingdecades, Ekman and his colleague continued their research about MEs (Frank & Ekman1997, Ekman 2003, 2002). Their works have drawn increasing interests from bothacademic and commercial communities.
The topic of ME attracts considerable interests because it may lead to many potentialapplications. Spontaneous MEs occur involuntarily even though one may try to putwillpower to inhibit such behaviour (Ekman 2007). Due to this property, ME isconsidered to be an important clue for detecting lies (Ekman 2009, 2003). For example,when police officers are interrogating suspects, any ME found on the face could be
23
important clue showing that the suspect might be lying, as the face is telling a differentstory than the statements. In addition to law enforcement, ME analysis can also beapplied in psychotherapy and other medical treatment scenarios. The psychiatristor doctor can use MEs as clues for understanding patients’ genuine emotions whenadditional reassurance is needed. In future when this technology becomes more mature,it might also be used to help border control agents to detect abnormal behaviours, andthus to screen potentially dangerous individuals during routine interviews.
One thing worth noticing is that, although we can read ordinary FEs effortlessly, it isvery difficult for us to recognize MEs (Ekman et al. 1999). Study (Ekman 2002) showedthat people without training perform barely better than the guessing chance on the MErecognition task. Ekman (2002) developed a Micro Expression Training Tool (METT)aiming to train specialists (e.g., police officers) to be better at perceiving MEs. Theperformance can be improved with training, yet finding the right person and the trainingprocess are time-consuming and expensive. Aid from computers could help for solvingthe challenge of MEs.
Fig. 1. ME sample images from SMIC and CASMEII databases. Paper III c©2017 IEEE.
2.1.2 ME study in computer vision
In computer vision, the topic of FE recognition has been studies for several decades.Many algorithms have been proposed until now, from which the best can achieve over90% accuracies for FE recognition tasks on several databases (Zeng et al. 2009). Despitethe facts that MEs have shorter time duration and low intensity than FEs, they bothconcern the same research target, which is understanding emotions through the analysisof facial movements. From this point of view, ideas from previous FE recognition workscould be borrowed for exploring solutions for automatic ME analysis.
The fact is that studies of ME have been rare (until our first paper I published in2011) because of several challenges. One big challenge is the lack of database due to the
24
difficulty of gathering spontaneous MEs. Other challenges include developing methodsthat are able to counter for the short duration and low intensity of MEs.
Like the studies about FEs, the problem of automatic ME analysis can be consideredin two major tasks: i.e., detection and recognition. First, detection, or ME spotting, asreferred in this thesis, indicates the task of finding the time point when an ME occursin its video context. Second, ME recognition, indicates the task of recognizing thecategory of the expression (and thus the undergoing emotion) that the ME presents. Inthe following sections of the chapter, works about both ME recognition and ME spottingwill be introduced and discussed.
2.1.3 Spontaneous vs. posed MEs
There is one important concept needs to be clarified. An ordinary FE can be eitherspontaneous or posed according to how the expression was generated. A posed FE isperformed on purpose to acted like a certain kind of emotion, while a spontaneous FEmeans the person is expression his or her genuine feeling. There are both spontaneousand posed FE data explored in FE studies. There is similar issue for ME studies. Whiletalking about MEs in previous contents ‘spontaneous’ is always used as the adjective. Weuse the word ‘spontaneous’ to emphasize that the MEs occur (or were induced) naturallyas the person is actually having the emotional feelings underneath. ‘Spontaneous’ isused to distinguish genuine MEs from ‘posed’ ones, which were introduced by someresearchers in their studies to bypass the difficulty of getting spontaneous data. Forexample, Shreve et al. (2009, 2011) reported collecting a posed ME database by askingparticipants to perform expressions as fast as possible.
We don’t think posed ME data can be used to replace (or together with) spontaneousME data, as these two data are different from each other. Considering the onset phaseof MEs, posed MEs are quite different from spontaneous ones in both spatial andtemporal properties (Porter & ten Brinke 2008, Yan et al. 2013a) as they are generatedunder different mechanisms. Considering the contexts of the videos there are also bigdifferences. Posed ME clips generated by expression mimicking and video editing(down-sample frames) usually have abrupt onsets and offsets, and other irrelevantmotions are prohibited. On the other side, a spontaneous ME occurred in naturalcircumstance may come along with complex video contexts including motions suchas head movements and eye blinks. Basing on these facts, studies done using posedME data can not really solve the problem of automatic ME analysis in practice. In the
25
following contents of the thesis, all works were done on spontaneous MEs, and the word‘ME’ indicates spontaneous MEs if not otherwise specified.
2.2 Related work
Research works about ME analysis are briefly reviewed in this section in three subsec-tions. Subsection 2.2.1 is about ME databases; Subsection 2.2.2 is about ME recognitionmethods; and Subsection 2.2.3 is about ME spotting methods.
2.2.1 Review of ME databases
For the research about ordinary FE recognition, benchmark databases such as JAFFE(Kamachi et al. 1998), CK (Kanade et al. 2000) and MMI (Pantic et al. 2005) havegreatly promoted the emergence of new algorithms. Due to the difficulty of inducingspontaneous MEs, the lack of ME data is the first obstacle in the way of ME research.
ME has been studied by psychologists for long time, and there are a few ME sampleclips from psychological studies that are widely spread through the internet. But wedidn’t find any big dataset shared from psychological research groups. The first reasonis that psychological research is more concerned about the properties of ME per se, e.g.,when it occurs or what it looks like, so they don’t need such big number of MEs as instudies of computational methods. In other cases even some psychological research didinvolves lots of ME samples, the data can not be publicly shared due to the restriction ofdata confidentiality, e.g., of patients’ medical records or judicial interrogation records.
In the early stage of ME analysis around 2009, some researchers collected posedME data in their studies to bypass the difficulty of achieving spontaneous MEs. Shreveet al. (2009, 2011) reported collecting a database called USF-HD which contains 100clips of posed MEs. The authors asked subjects to mimic ME samples showed on onescreen. Polikovsky et al. (2009) also collected a posed ME database by asking subjectsto perform seven basic emotions with low intensity and go back to neutral expression asquickly as possible. The data was recorded by a high speed camera with 200 frames persecond (fps). Detail properties of these posed ME databases are listed in Table 1. As theearly attempts towards automatic ME analysis, it is fine to use posed data for breakingthe ice. However since posed MEs can not resemble spontaneous MEs in reality, makingefforts to collect spontaneous ME data is the right path in the following works.
26
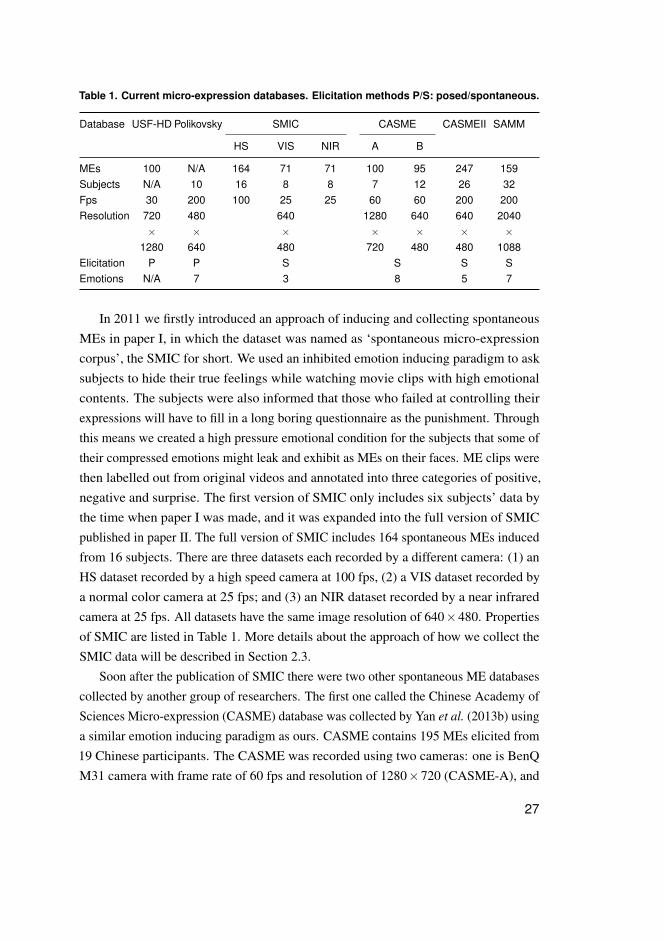
Table 1. Current micro-expression databases. Elicitation methods P/S: posed/spontaneous.
Database USF-HD Polikovsky SMIC CASME CASMEII SAMM
HS VIS NIR A B
MEs 100 N/A 164 71 71 100 95 247 159Subjects N/A 10 16 8 8 7 12 26 32Fps 30 200 100 25 25 60 60 200 200Resolution 720 480 640 1280 640 640 2040
× × × × × × ×1280 640 480 720 480 480 1088
Elicitation P P S S S SEmotions N/A 7 3 8 5 7
In 2011 we firstly introduced an approach of inducing and collecting spontaneousMEs in paper I, in which the dataset was named as ‘spontaneous micro-expressioncorpus’, the SMIC for short. We used an inhibited emotion inducing paradigm to asksubjects to hide their true feelings while watching movie clips with high emotionalcontents. The subjects were also informed that those who failed at controlling theirexpressions will have to fill in a long boring questionnaire as the punishment. Throughthis means we created a high pressure emotional condition for the subjects that some oftheir compressed emotions might leak and exhibit as MEs on their faces. ME clips werethen labelled out from original videos and annotated into three categories of positive,negative and surprise. The first version of SMIC only includes six subjects’ data bythe time when paper I was made, and it was expanded into the full version of SMICpublished in paper II. The full version of SMIC includes 164 spontaneous MEs inducedfrom 16 subjects. There are three datasets each recorded by a different camera: (1) anHS dataset recorded by a high speed camera at 100 fps, (2) a VIS dataset recorded bya normal color camera at 25 fps; and (3) an NIR dataset recorded by a near infraredcamera at 25 fps. All datasets have the same image resolution of 640×480. Propertiesof SMIC are listed in Table 1. More details about the approach of how we collect theSMIC data will be described in Section 2.3.
Soon after the publication of SMIC there were two other spontaneous ME databasescollected by another group of researchers. The first one called the Chinese Academy ofSciences Micro-expression (CASME) database was collected by Yan et al. (2013b) usinga similar emotion inducing paradigm as ours. CASME contains 195 MEs elicited from19 Chinese participants. The CASME was recorded using two cameras: one is BenQM31 camera with frame rate of 60 fps and resolution of 1280×720 (CASME-A), and
27

the other is Point Grey GRAS-03K2C camera with frame rate of 60 fps and resolutionof 640×480 (CASME-B). MEs in the CASME database were first labelled with actionunits (AU) (Ekman & Friesen 1978), and then classified into eight emotion categoriesincluding amusement, sadness, disgust, surprise, contempt, fear, repression and tension.The author of CASME later collaborated with me and built a second version of CASME,the CASMEII (Yan et al. 2014), as we all realized that more spontaneous ME sampleswere still needed for ME studies. CASMEII provides more ME samples with higherspatial and temporal resolutions. The new database was recorded at 200 fps with anaverage face size of 280×340. 247 ME samples from 26 Chinese subjects were labelledout from the recorded videos. CASMEII samples have both AU labels and emotionlabels of five classes, i.e., happiness, disgust, surprise, repression and other. There isone recent spontaneous ME database SAMM (Davison et al. 2016) which also usedsimilar emotion inducing paradigm to get 159 MEs of 32 participants from 13 differentethnicities. SAMM data has even higher frame resolution of 2040×1088 and a framerate of 200 fps. The data provide both AU labels and seven emotional labels. Allmentioned current ME databases are listed in Table 1 for comparison.
2.2.2 Review of ME recognition studies
The task of ME recognition is similar to ordinary FE recognition, given a labelled outME clip (a sequence of frames containing from the onset to offset of the subtle facialmovement), we train a classifier to classify it into two or more categories (e.g., happy,sad and etc.) according to the expressed emotional contents. Studies on ME recognitionare more prominent than those of ME spotting in the literature, and algorithms havebeen proposed and tested on both posed and spontaneous data.
Early works started by using posed ME data. Polikovsky et al. (2009) and Polikovsky& Kameda (2013) used a 3D gradient descriptor for the recognition of AU-labelledMEs, and their proposed method was tested on their own collected posed ME data.In another work, Wu et al. (2011) combined Gentleboost and an SVM classifier torecognize synthetic ME samples from the METT training tool.
Later on since the emerging of spontaneous ME databases, there were more studiesexploring the problem of ME recognition using spontaneous ME databases. In 2011we proposed the first pipeline for ME recognition in paper I, and achieved promisingresults on the first version of SMIC dataset including 77 spontaneous ME samples. Inthis method a temporal interpolation model (TIM) (Zhou et al. 2011) was employed to
28
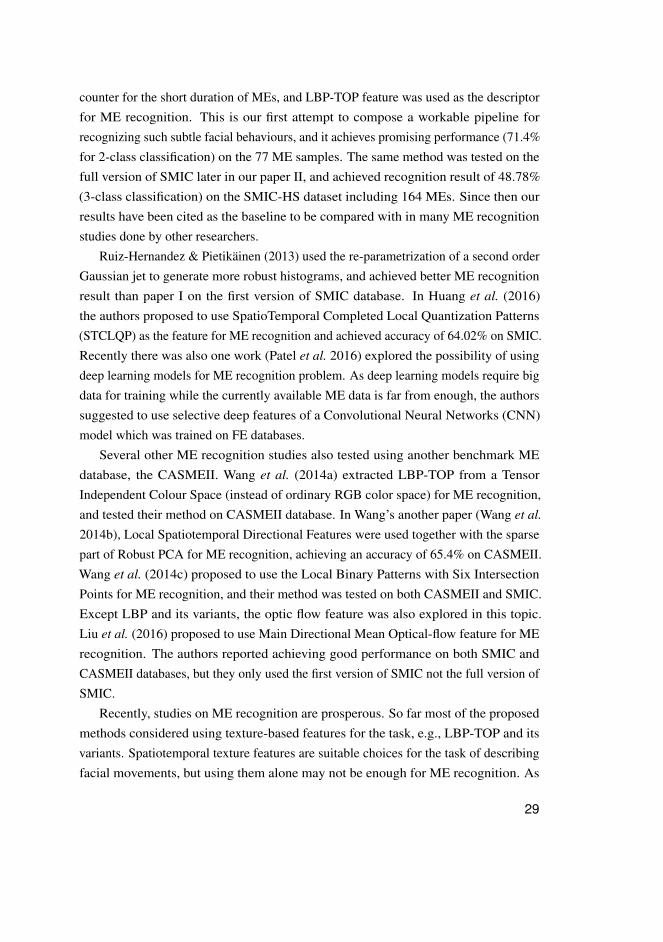
counter for the short duration of MEs, and LBP-TOP feature was used as the descriptorfor ME recognition. This is our first attempt to compose a workable pipeline forrecognizing such subtle facial behaviours, and it achieves promising performance (71.4%for 2-class classification) on the 77 ME samples. The same method was tested on thefull version of SMIC later in our paper II, and achieved recognition result of 48.78%(3-class classification) on the SMIC-HS dataset including 164 MEs. Since then ourresults have been cited as the baseline to be compared with in many ME recognitionstudies done by other researchers.
Ruiz-Hernandez & Pietikäinen (2013) used the re-parametrization of a second orderGaussian jet to generate more robust histograms, and achieved better ME recognitionresult than paper I on the first version of SMIC database. In Huang et al. (2016)the authors proposed to use SpatioTemporal Completed Local Quantization Patterns(STCLQP) as the feature for ME recognition and achieved accuracy of 64.02% on SMIC.Recently there was also one work (Patel et al. 2016) explored the possibility of usingdeep learning models for ME recognition problem. As deep learning models require bigdata for training while the currently available ME data is far from enough, the authorssuggested to use selective deep features of a Convolutional Neural Networks (CNN)model which was trained on FE databases.
Several other ME recognition studies also tested using another benchmark MEdatabase, the CASMEII. Wang et al. (2014a) extracted LBP-TOP from a TensorIndependent Colour Space (instead of ordinary RGB color space) for ME recognition,and tested their method on CASMEII database. In Wang’s another paper (Wang et al.
2014b), Local Spatiotemporal Directional Features were used together with the sparsepart of Robust PCA for ME recognition, achieving an accuracy of 65.4% on CASMEII.Wang et al. (2014c) proposed to use the Local Binary Patterns with Six IntersectionPoints for ME recognition, and their method was tested on both CASMEII and SMIC.Except LBP and its variants, the optic flow feature was also explored in this topic.Liu et al. (2016) proposed to use Main Directional Mean Optical-flow feature for MErecognition. The authors reported achieving good performance on both SMIC andCASMEII databases, but they only used the first version of SMIC not the full version ofSMIC.
Recently, studies on ME recognition are prosperous. So far most of the proposedmethods considered using texture-based features for the task, e.g., LBP-TOP and itsvariants. Spatiotemporal texture features are suitable choices for the task of describingfacial movements, but using them alone may not be enough for ME recognition. As
29
the existing study results showed, there is still much room for improvement in therecognition performance. Special approaches that could counter for the short durationand subtle intensity of MEs need to be found, and more robust frameworks and machinelearning methods need to be explored in the future. Our work about ME recognition isdescribed in Section 2.4 of the thesis. Results achieved using different features andapproaches are compared in details in order to construct a more robust framework forbetter ME recognition performance.
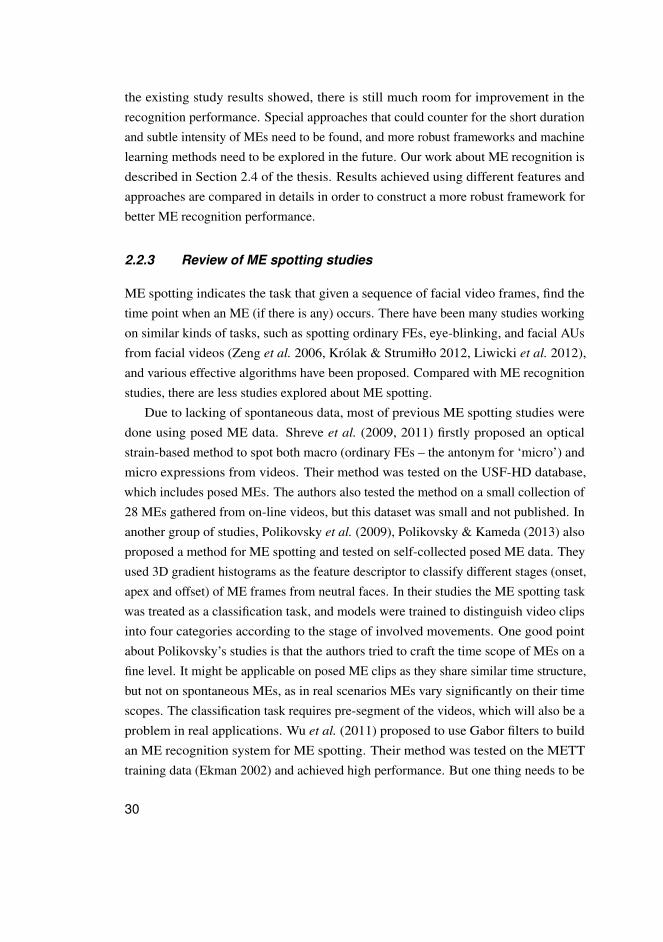
2.2.3 Review of ME spotting studies
ME spotting indicates the task that given a sequence of facial video frames, find thetime point when an ME (if there is any) occurs. There have been many studies workingon similar kinds of tasks, such as spotting ordinary FEs, eye-blinking, and facial AUsfrom facial videos (Zeng et al. 2006, Królak & Strumiłło 2012, Liwicki et al. 2012),and various effective algorithms have been proposed. Compared with ME recognitionstudies, there are less studies explored about ME spotting.
Due to lacking of spontaneous data, most of previous ME spotting studies weredone using posed ME data. Shreve et al. (2009, 2011) firstly proposed an opticalstrain-based method to spot both macro (ordinary FEs – the antonym for ‘micro’) andmicro expressions from videos. Their method was tested on the USF-HD database,which includes posed MEs. The authors also tested the method on a small collection of28 MEs gathered from on-line videos, but this dataset was small and not published. Inanother group of studies, Polikovsky et al. (2009), Polikovsky & Kameda (2013) alsoproposed a method for ME spotting and tested on self-collected posed ME data. Theyused 3D gradient histograms as the feature descriptor to classify different stages (onset,apex and offset) of ME frames from neutral faces. In their studies the ME spotting taskwas treated as a classification task, and models were trained to distinguish video clipsinto four categories according to the stage of involved movements. One good pointabout Polikovsky’s studies is that the authors tried to craft the time scope of MEs on afine level. It might be applicable on posed ME clips as they share similar time structure,but not on spontaneous MEs, as in real scenarios MEs vary significantly on their timescopes. The classification task requires pre-segment of the videos, which will also be aproblem in real applications. Wu et al. (2011) proposed to use Gabor filters to buildan ME recognition system for ME spotting. Their method was tested on the METTtraining data (Ekman 2002) and achieved high performance. But one thing needs to be
30
mentioned is that the METT training samples are fully synthetic clips made by insertingone emotional face image in the middle of a sequence of identical neutral face images.In these clips, the ‘onset’ and ‘offset’ of expressions are so sharp and abrupt, and thecontext frames are so clean that they can not represent the real ME spotting problem forcomputers at all.
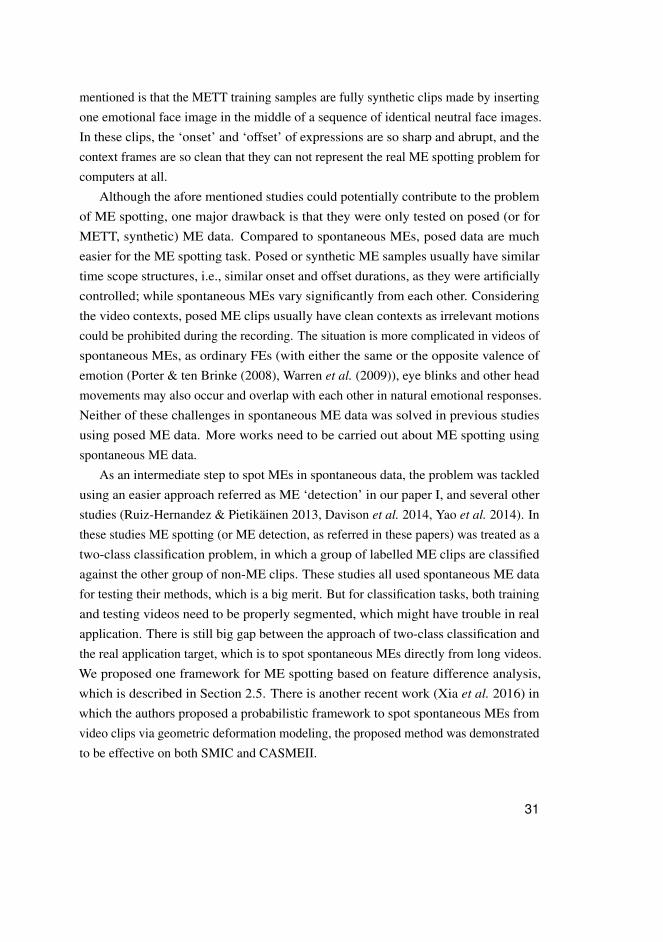
Although the afore mentioned studies could potentially contribute to the problemof ME spotting, one major drawback is that they were only tested on posed (or forMETT, synthetic) ME data. Compared to spontaneous MEs, posed data are mucheasier for the ME spotting task. Posed or synthetic ME samples usually have similartime scope structures, i.e., similar onset and offset durations, as they were artificiallycontrolled; while spontaneous MEs vary significantly from each other. Consideringthe video contexts, posed ME clips usually have clean contexts as irrelevant motionscould be prohibited during the recording. The situation is more complicated in videos ofspontaneous MEs, as ordinary FEs (with either the same or the opposite valence ofemotion (Porter & ten Brinke (2008), Warren et al. (2009)), eye blinks and other headmovements may also occur and overlap with each other in natural emotional responses.Neither of these challenges in spontaneous ME data was solved in previous studiesusing posed ME data. More works need to be carried out about ME spotting usingspontaneous ME data.
As an intermediate step to spot MEs in spontaneous data, the problem was tackledusing an easier approach referred as ME ‘detection’ in our paper I, and several otherstudies (Ruiz-Hernandez & Pietikäinen 2013, Davison et al. 2014, Yao et al. 2014). Inthese studies ME spotting (or ME detection, as referred in these papers) was treated as atwo-class classification problem, in which a group of labelled ME clips are classifiedagainst the other group of non-ME clips. These studies all used spontaneous ME datafor testing their methods, which is a big merit. But for classification tasks, both trainingand testing videos need to be properly segmented, which might have trouble in realapplication. There is still big gap between the approach of two-class classification andthe real application target, which is to spot spontaneous MEs directly from long videos.We proposed one framework for ME spotting based on feature difference analysis,which is described in Section 2.5. There is another recent work (Xia et al. 2016) inwhich the authors proposed a probabilistic framework to spot spontaneous MEs fromvideo clips via geometric deformation modeling, the proposed method was demonstratedto be effective on both SMIC and CASMEII.
31
2.3 Collecting spontaneous ME data
This section presents the approach for collecting the first spontaneous ME database, theSMIC.
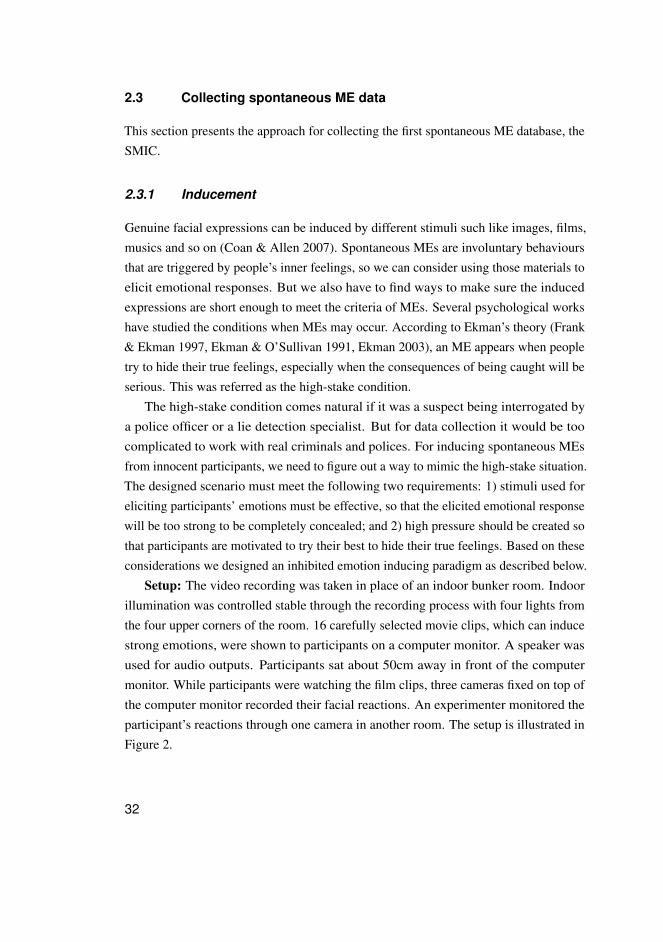
2.3.1 Inducement
Genuine facial expressions can be induced by different stimuli such like images, films,musics and so on (Coan & Allen 2007). Spontaneous MEs are involuntary behavioursthat are triggered by people’s inner feelings, so we can consider using those materials toelicit emotional responses. But we also have to find ways to make sure the inducedexpressions are short enough to meet the criteria of MEs. Several psychological workshave studied the conditions when MEs may occur. According to Ekman’s theory (Frank& Ekman 1997, Ekman & O’Sullivan 1991, Ekman 2003), an ME appears when peopletry to hide their true feelings, especially when the consequences of being caught will beserious. This was referred as the high-stake condition.
The high-stake condition comes natural if it was a suspect being interrogated bya police officer or a lie detection specialist. But for data collection it would be toocomplicated to work with real criminals and polices. For inducing spontaneous MEsfrom innocent participants, we need to figure out a way to mimic the high-stake situation.The designed scenario must meet the following two requirements: 1) stimuli used foreliciting participants’ emotions must be effective, so that the elicited emotional responsewill be too strong to be completely concealed; and 2) high pressure should be created sothat participants are motivated to try their best to hide their true feelings. Based on theseconsiderations we designed an inhibited emotion inducing paradigm as described below.
Setup: The video recording was taken in place of an indoor bunker room. Indoorillumination was controlled stable through the recording process with four lights fromthe four upper corners of the room. 16 carefully selected movie clips, which can inducestrong emotions, were shown to participants on a computer monitor. A speaker wasused for audio outputs. Participants sat about 50cm away in front of the computermonitor. While participants were watching the film clips, three cameras fixed on top ofthe computer monitor recorded their facial reactions. An experimenter monitored theparticipant’s reactions through one camera in another room. The setup is illustrated inFigure 2.
32
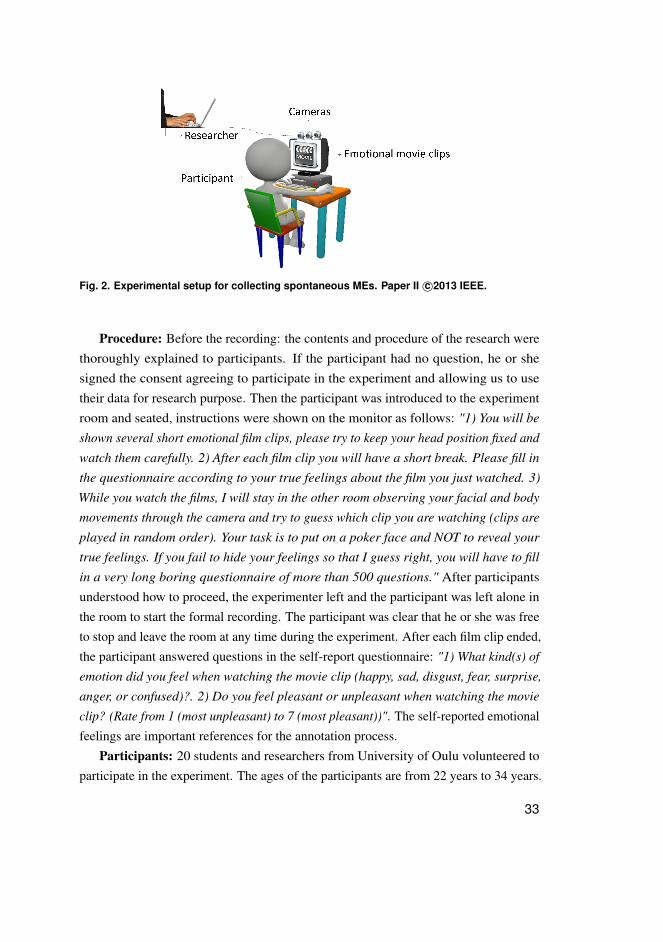
Fig. 2. Experimental setup for collecting spontaneous MEs. Paper II c©2013 IEEE.
Procedure: Before the recording: the contents and procedure of the research werethoroughly explained to participants. If the participant had no question, he or shesigned the consent agreeing to participate in the experiment and allowing us to usetheir data for research purpose. Then the participant was introduced to the experimentroom and seated, instructions were shown on the monitor as follows: "1) You will be
shown several short emotional film clips, please try to keep your head position fixed and
watch them carefully. 2) After each film clip you will have a short break. Please fill in
the questionnaire according to your true feelings about the film you just watched. 3)
While you watch the films, I will stay in the other room observing your facial and body
movements through the camera and try to guess which clip you are watching (clips are
played in random order). Your task is to put on a poker face and NOT to reveal your
true feelings. If you fail to hide your feelings so that I guess right, you will have to fill
in a very long boring questionnaire of more than 500 questions." After participantsunderstood how to proceed, the experimenter left and the participant was left alone inthe room to start the formal recording. The participant was clear that he or she was freeto stop and leave the room at any time during the experiment. After each film clip ended,the participant answered questions in the self-report questionnaire: "1) What kind(s) of
emotion did you feel when watching the movie clip (happy, sad, disgust, fear, surprise,
anger, or confused)?. 2) Do you feel pleasant or unpleasant when watching the movie
clip? (Rate from 1 (most unpleasant) to 7 (most pleasant))". The self-reported emotionalfeelings are important references for the annotation process.
Participants: 20 students and researchers from University of Oulu volunteered toparticipate in the experiment. The ages of the participants are from 22 years to 34 years.
33

Seven are females and 13 are males. Nine of them are Caucasians and 11 are Asians.Due to the fact that some film clips contain English dialogues, it was confirmed that all20 participants can understand English conversations.
Ethical issues: The data collection was operated within existing EU and nationalregulations, and followed the rules of the Finnish Advisory Board on Research Integrity.We followed the listed measures to make sure no violation of research ethics wouldhappen during or after the data collection:
1. Before testing on any participant, the whole experimental procedure and materialswere discussed with many researchers in the group, one of whom was also in theresearch ethic committee of the university.
2. All participants involved in the recording are volunteers.3. A consent agreement was prepared, which describes the experimental contents and
procedure. It also states how the recorded data will be used in future.4. The agreement was carefully explained to each volunteer, answers were given if any
question was asked. The experiment only starts after the volunteer fully understoodand signed the agreement.
5. Participants knew they were free to stop at any time during the procedure.6. Each participant’s opinion was consulted again after the experiment, in order to
re-confirm that everything was OK and the data can be included in the database.7. Data storage and sharing process ensure protection and confidentiality. All data are
stored on secure, password-protected servers. There are appropriate backups andfirewall protection. Access to the database is only granted after a license agreementis signed. The license agreement specifies that the usage should only for researchpurpose, and forbids data transfer of any form to a third party.
Stimuli selection: To select the most effective stimuli as the emotion inducers is one keyfactor for successive data collections. Literatures (Coan & Allen 2007) were reviewed tocompare different kinds of emotion inducing materials, e.g., images, musics, videos andinteractions. We finally decided to use short video clips as the stimuli for three reasons:1) Videos include both audio and visual information and are therefore more powerfulthan images and musics. 2) MEs are more likely to occur if strong emotions were elicitedcontinuously for a while (Wu et al. 2010), from this point of view videos are betterthan static images. 3) From the practical perspective of acquiring stable frontal facialvideos, participants watching movies are easier to control than an interactive scenarioin which multiple persons are involved. So videos are used as inducer for the current
34
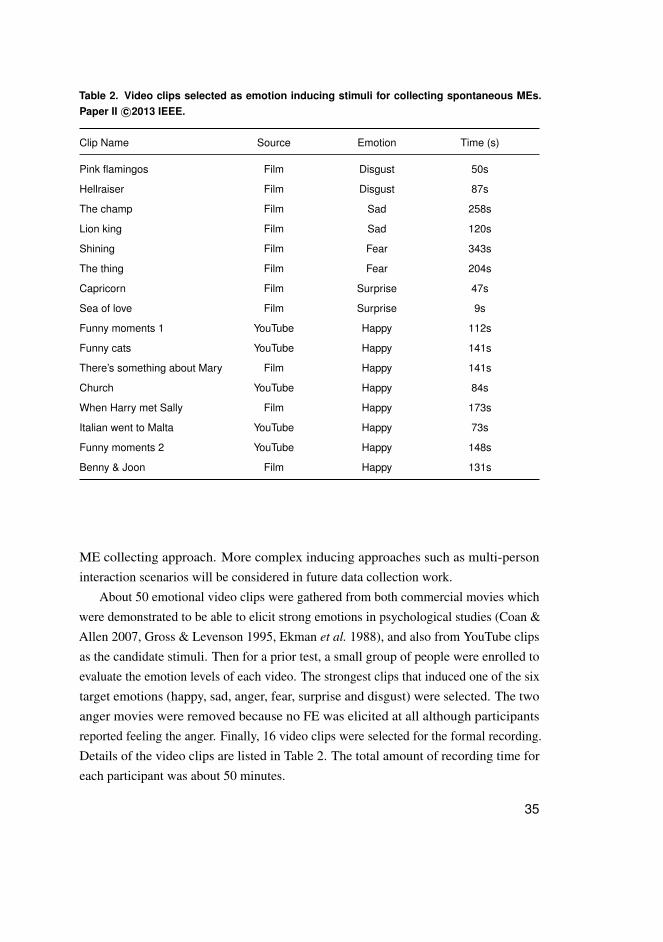
Table 2. Video clips selected as emotion inducing stimuli for collecting spontaneous MEs.Paper II c©2013 IEEE.
Clip Name Source Emotion Time (s)
Pink flamingos Film Disgust 50s
Hellraiser Film Disgust 87s
The champ Film Sad 258s
Lion king Film Sad 120s
Shining Film Fear 343s
The thing Film Fear 204s
Capricorn Film Surprise 47s
Sea of love Film Surprise 9s
Funny moments 1 YouTube Happy 112s
Funny cats YouTube Happy 141s
There’s something about Mary Film Happy 141s
Church YouTube Happy 84s
When Harry met Sally Film Happy 173s
Italian went to Malta YouTube Happy 73s
Funny moments 2 YouTube Happy 148s
Benny & Joon Film Happy 131s
ME collecting approach. More complex inducing approaches such as multi-personinteraction scenarios will be considered in future data collection work.
About 50 emotional video clips were gathered from both commercial movies whichwere demonstrated to be able to elicit strong emotions in psychological studies (Coan &Allen 2007, Gross & Levenson 1995, Ekman et al. 1988), and also from YouTube clipsas the candidate stimuli. Then for a prior test, a small group of people were enrolled toevaluate the emotion levels of each video. The strongest clips that induced one of the sixtarget emotions (happy, sad, anger, fear, surprise and disgust) were selected. The twoanger movies were removed because no FE was elicited at all although participantsreported feeling the anger. Finally, 16 video clips were selected for the formal recording.Details of the video clips are listed in Table 2. The total amount of recording time foreach participant was about 50 minutes.
35
2.3.2 Annotation
The recorded videos need to be segmented and labelled so that we can have ME samplesand corresponding labels for training and testing. The high speed videos were usedfor labelling as they have the best time resolution. Videos recorded by the other twocameras were synchronized and annotated afterwards.
First, frames from the onset to the offset of ME movements were segmented outfrom the original long videos. There is still a debate about the precise length limit ofMEs, here we took the advise of Yan et al. (2013a), Matsumoto & Hwang (2011) andset a looser cut-line of 1/2 second. The onset of an ME sequence indicates the firstframe of visible movement comparing to a previously neutral (or near-neutral) face,while the offset of an ME sequence ends at the last frame when any movement can befound comparing to the next frame. Notice that not all MEs end to a completely neutralface, some expressions might rise and then fall to a near-neutral state and are kept in thatstate for long time, which were also considered as the end or offset.
After that, all segmented clips were annotated with emotion labels. Two kinds ofreferences can be used as the evidence of emotion labelling, i.e., the contents of thefilm clips, and the participants’ self-reports. Although each film clip was selected forinducing one target emotion, it was found that participants might report different (evenopposite) feelings over one film stimuli. For some rare cases when participants reportedopposite feelings of the video contents (e.g., some participants reported feeling happyor amused while watching a horror movie clip), we used participants’ self-reports asthe criteria for ME labelling. Originally we assigned five emotion labels (i.e., happy,
sad, fear, disgust, surprise) according to the video contents. Later we merged the5-class labels to three categories of positive, surprise and negative. The original happy
composed the new positive category, while the negative was formed by merging threelabels of sad, fear and disgust. The reasons for merging the three negative emotionsare: firstly, participants reported more than one of the three emotions over one clip;secondly, the sample numbers of each of the three labels are too small and it will bebetter balanced if they were merged. The category of surprise was separated as it can beeither positive or negative according to specific situations.
For the validation of the data labelling, the annotation was first carried out bytwo annotators separately. Then the two annotators cross-checked with each other’slabellings, and only those labels that both annotators agreed on were kept in the finaldatabase.
36
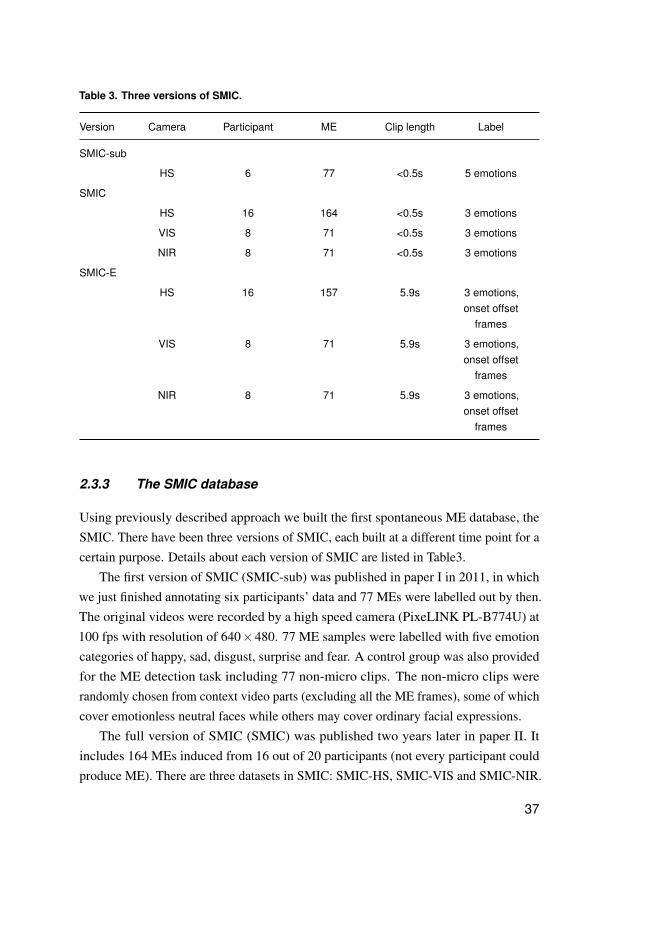
Table 3. Three versions of SMIC.
Version Camera Participant ME Clip length Label
SMIC-sub
HS 6 77 <0.5s 5 emotions
SMIC
HS 16 164 <0.5s 3 emotions
VIS 8 71 <0.5s 3 emotions
NIR 8 71 <0.5s 3 emotions
SMIC-E
HS 16 157 5.9s 3 emotions,onset offset
frames
VIS 8 71 5.9s 3 emotions,onset offset
frames
NIR 8 71 5.9s 3 emotions,onset offset
frames
2.3.3 The SMIC database
Using previously described approach we built the first spontaneous ME database, theSMIC. There have been three versions of SMIC, each built at a different time point for acertain purpose. Details about each version of SMIC are listed in Table3.
The first version of SMIC (SMIC-sub) was published in paper I in 2011, in whichwe just finished annotating six participants’ data and 77 MEs were labelled out by then.The original videos were recorded by a high speed camera (PixeLINK PL-B774U) at100 fps with resolution of 640×480. 77 ME samples were labelled with five emotioncategories of happy, sad, disgust, surprise and fear. A control group was also providedfor the ME detection task including 77 non-micro clips. The non-micro clips wererandomly chosen from context video parts (excluding all the ME frames), some of whichcover emotionless neutral faces while others may cover ordinary facial expressions.
The full version of SMIC (SMIC) was published two years later in paper II. Itincludes 164 MEs induced from 16 out of 20 participants (not every participant couldproduce ME). There are three datasets in SMIC: SMIC-HS, SMIC-VIS and SMIC-NIR.
37

The high speed camera (HS) was used for all the recording. For the recording ofthe latter ten participants, a normal speed color camera of visual range (VIS) and anear-infrared (NIR) camera were also added in the recording. Both cameras recorded at25 fps with resolution of 640×480. The VIS and NIR cameras were added for threeconsiderations: first, to improve the diversity of the database; second, to investigatewhether HS camera does have advantage over normal speed cameras for ME analysis;third, to study if some temporal interpolation method could work with ordinary speedcamera for tackling the problem of short duration. All MEs were labelled into threeemotional categories of positive, negative and surprise.
The two previous versions of SMIC only include labelled out ME clips from onset tooffset. For the need of ME spotting test, we later re-built an extended version of SMIC(SMIC-E) which include longer clips around time points when MEs occur. The SMIC-Ewas released in paper III. Clips in three datasets of SMIC were each re-segmentedinto longer sequences and denoted as SMIC-E-HS, SMIC-E-VIS and SMIC-E-NIRaccordingly. The SMIC-E-VIS and SMIC-E-NIR dataset each includes 71 long clips ofaverage duration of 5.9 seconds. The SMIC-E-HS dataset contains 157 long clips of anaverage length of 5.9 seconds. Four clips contain two MEs as they are located close toeach other. Three ME samples from the original SMIC-HS dataset were not includedhere because of original video data loss. The annotation of SMIC-E includes the onsetand offset frame numbers of each clip, and also the emotion labels (same as SMIC) ofthree categories.
2.4 ME recognition
This section introduces a framework for ME recognition. The purpose for each stepof the framework is explained, and then detailed process will be discussed togetherwith experimental results. In the last part the performance of the framework will becompared with other state-of-the-art methods.
2.4.1 A framework for ME recognition
One major goal for ME analysis is to construct an efficient and robust framework for theME recognition task. We have been exploring possible solutions for this problem eversince 2011. Several methods proposed in relevant studies have been tried for the aim ofprompting ME recognition. Until recently in our latest work (paper III) an advanced
38
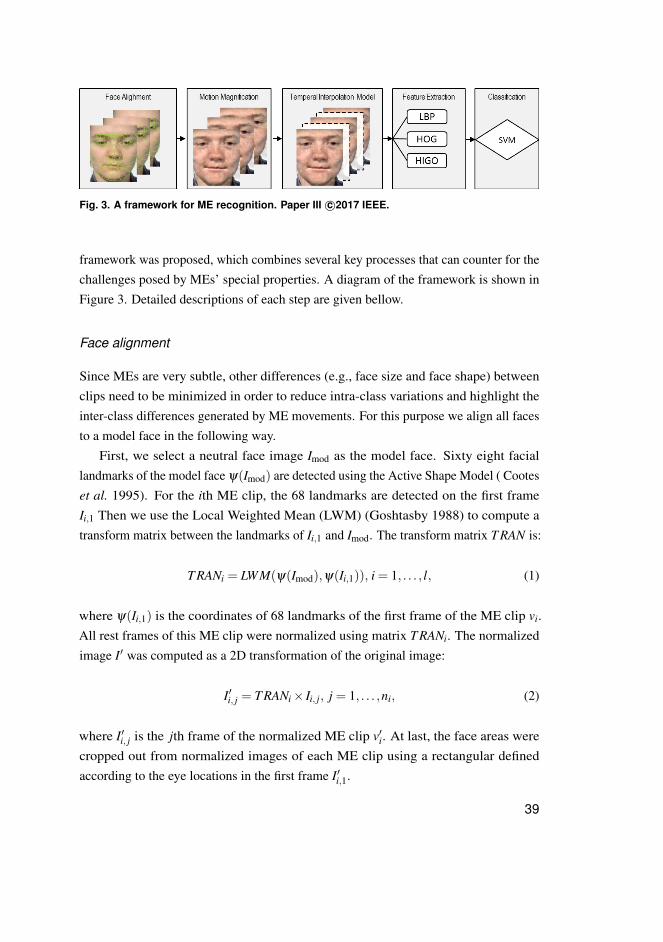
Fig. 3. A framework for ME recognition. Paper III c©2017 IEEE.
framework was proposed, which combines several key processes that can counter for thechallenges posed by MEs’ special properties. A diagram of the framework is shown inFigure 3. Detailed descriptions of each step are given bellow.
Face alignment
Since MEs are very subtle, other differences (e.g., face size and face shape) betweenclips need to be minimized in order to reduce intra-class variations and highlight theinter-class differences generated by ME movements. For this purpose we align all facesto a model face in the following way.
First, we select a neutral face image Imod as the model face. Sixty eight faciallandmarks of the model face ψ(Imod) are detected using the Active Shape Model ( Cooteset al. 1995). For the ith ME clip, the 68 landmarks are detected on the first frameIi,1 Then we use the Local Weighted Mean (LWM) (Goshtasby 1988) to compute atransform matrix between the landmarks of Ii,1 and Imod. The transform matrix T RAN is:
T RANi = LWM(ψ(Imod),ψ(Ii,1)), i = 1, . . . , l, (1)
where ψ(Ii,1) is the coordinates of 68 landmarks of the first frame of the ME clip vi.All rest frames of this ME clip were normalized using matrix T RANi. The normalizedimage I′ was computed as a 2D transformation of the original image:
I′i, j = T RANi× Ii, j, j = 1, . . . ,ni, (2)
where I′i, j is the jth frame of the normalized ME clip v′i. At last, the face areas werecropped out from normalized images of each ME clip using a rectangular definedaccording to the eye locations in the first frame I′i,1.
39
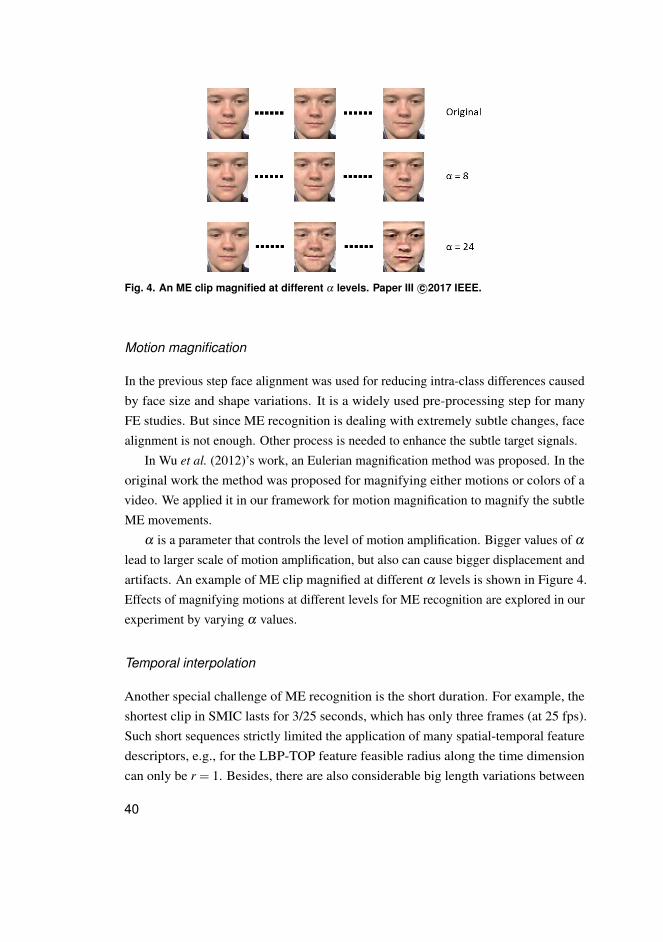
Fig. 4. An ME clip magnified at different α levels. Paper III c©2017 IEEE.
Motion magnification
In the previous step face alignment was used for reducing intra-class differences causedby face size and shape variations. It is a widely used pre-processing step for manyFE studies. But since ME recognition is dealing with extremely subtle changes, facealignment is not enough. Other process is needed to enhance the subtle target signals.
In Wu et al. (2012)’s work, an Eulerian magnification method was proposed. In theoriginal work the method was proposed for magnifying either motions or colors of avideo. We applied it in our framework for motion magnification to magnify the subtleME movements.
α is a parameter that controls the level of motion amplification. Bigger values of α
lead to larger scale of motion amplification, but also can cause bigger displacement andartifacts. An example of ME clip magnified at different α levels is shown in Figure 4.Effects of magnifying motions at different levels for ME recognition are explored in ourexperiment by varying α values.
Temporal interpolation
Another special challenge of ME recognition is the short duration. For example, theshortest clip in SMIC lasts for 3/25 seconds, which has only three frames (at 25 fps).Such short sequences strictly limited the application of many spatial-temporal featuredescriptors, e.g., for the LBP-TOP feature feasible radius along the time dimensioncan only be r = 1. Besides, there are also considerable big length variations between
40
ME clips. This also poses a challenge for some features that are sensitive to the framenumber.
In Zhou et al. (2011), a temporal interpolation model (TIM) was proposed, which inthe original paper was for the purpose of lip-reading. We employ the TIM method in ourME recognition framework to counter for the problem related with ME durations andframe number variances.
The TIM method relies on a path graph to characterize the structure of a sequence offrames. A sequence-specific mapping is learned to connect frames in the sequenceand a curve embedded in the path graph so that the sequence can be projected onto thelatter. The curve, which is a continuous and deterministic function of a single variablet in the range of [0,1], governs the temporal relations between the frames. Unseenframes occurring in the continuous process of an ME are also characterized by the curve.Therefore a sequence of frames after interpolation can be generated by controlling thevariable t at different time points accordingly.
With the TIM method we are able to change the frame sequences into any arbitrarylength, for either down-sampling or up-sampling. In the current framework, the TIMmethod was used to interpolate all ME clips (of one dataset) into one fixed length, e.g.,of 10, 20, or 40 frames. By unifying the clips length, we can solve both the problem ofshort duration, and the problem of varied sequence lengths. The purpose of the currentstep is for 1) allowing more options when selecting feature parameters, and 2) achievingmore stable performance with spatial-temporal feature descriptors. The problem of howto select the most suitable length for TIM interpolation is explored and discussed in theSection 2.4.2.
Feature extraction and classification
As mentioned in the literature review section, spatial-temporal descriptors are the majorstream in most of ME analysis studies. Three kinds of spatial-temporal features areconsidered here in the proposed ME recognition framework. Details of each feature arebriefly described below, and the comparison of their performance will be discussed withexperimental results in Section 2.4.2.
LBP on three orthogonal planes: The first feature is the local binary pattern onthree orthogonal planes (LBP-TOP), proposed by Zhao & Pietikäinen (2007). LBP-TOPis an extension of the original LBP for dynamic texture analysis in spatial-temporal
41
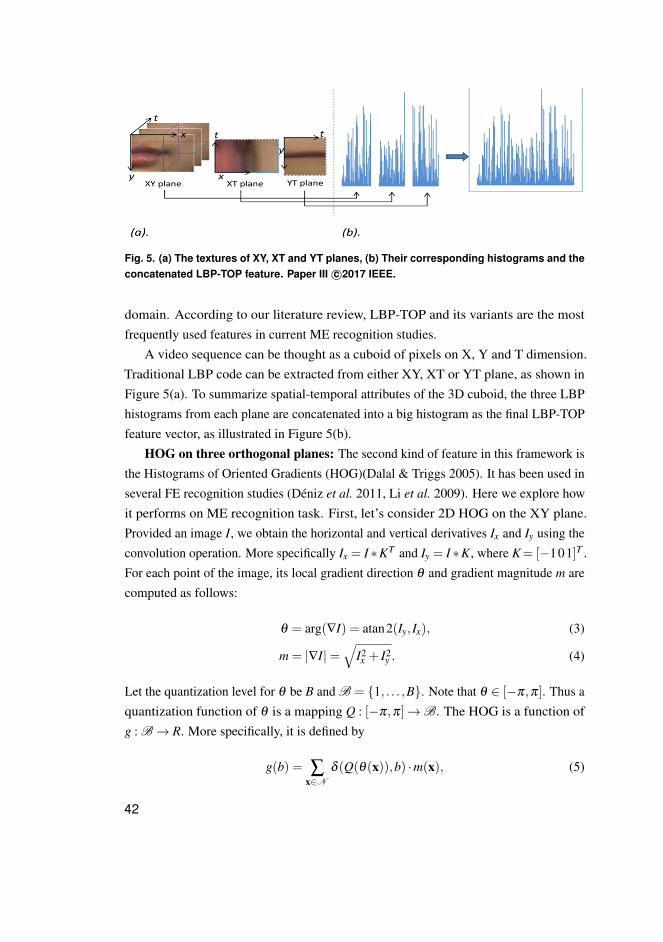
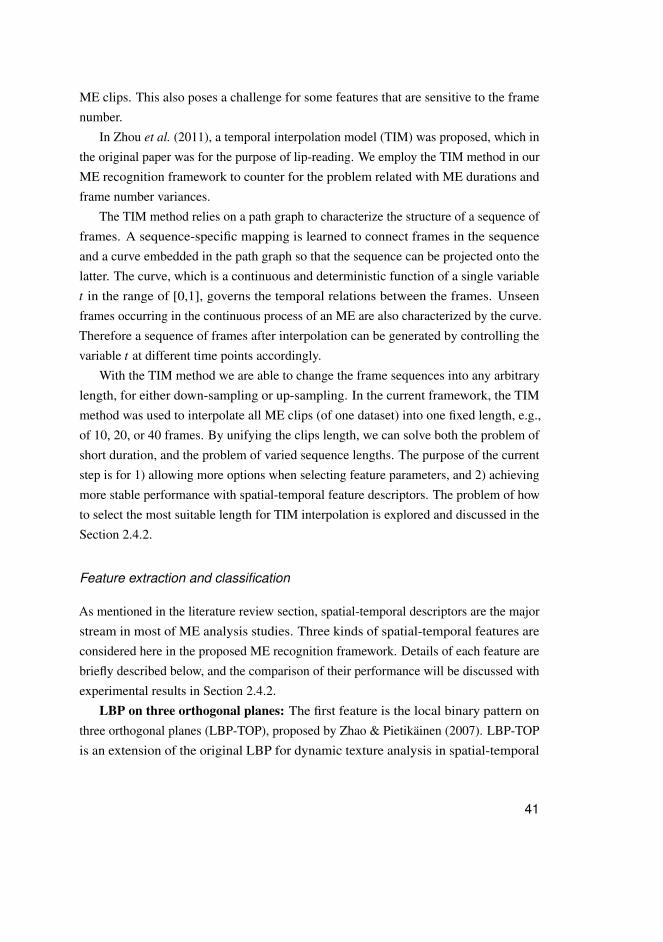
Fig. 5. (a) The textures of XY, XT and YT planes, (b) Their corresponding histograms and theconcatenated LBP-TOP feature. Paper III c©2017 IEEE.
domain. According to our literature review, LBP-TOP and its variants are the mostfrequently used features in current ME recognition studies.
A video sequence can be thought as a cuboid of pixels on X, Y and T dimension.Traditional LBP code can be extracted from either XY, XT or YT plane, as shown inFigure 5(a). To summarize spatial-temporal attributes of the 3D cuboid, the three LBPhistograms from each plane are concatenated into a big histogram as the final LBP-TOPfeature vector, as illustrated in Figure 5(b).
HOG on three orthogonal planes: The second kind of feature in this framework isthe Histograms of Oriented Gradients (HOG)(Dalal & Triggs 2005). It has been used inseveral FE recognition studies (Déniz et al. 2011, Li et al. 2009). Here we explore howit performs on ME recognition task. First, let’s consider 2D HOG on the XY plane.Provided an image I, we obtain the horizontal and vertical derivatives Ix and Iy using theconvolution operation. More specifically Ix = I ∗KT and Iy = I ∗K, where K= [−101]T .For each point of the image, its local gradient direction θ and gradient magnitude m arecomputed as follows:
θ = arg(∇I) = atan2(Iy, Ix), (3)
m = |∇I|=√
I2x + I2
y . (4)
Let the quantization level for θ be B and B = {1, . . . ,B}. Note that θ ∈ [−π,π]. Thus aquantization function of θ is a mapping Q : [−π,π]→B. The HOG is a function ofg : B→ R. More specifically, it is defined by
g(b) = ∑x∈N
δ (Q(θ(x)),b) ·m(x), (5)
42
where b ∈B and δ (i, j) is the Kronecker’s delta function as
δ (i, j) =
{1 if i = j
0 if i 6= j .(6)
HOG on the XT and YT planes can be computed the same way. Thus, HOG on threeorthogonal planes can be achieved the same way as we get LBP-TOP by concatenatinghistograms of the three planes.
For HOG, each pixel within the block or cuboid has a weighted vote for a quantizedorientation channel b according to the response found in the gradient computation.
HIGO on three orthogonal planes: The third feature descriptor employed inthe framework is the histogram of image gradient orientation (HIGO). HIGO is adegenerated variant of HOG: it uses ‘simple vote’ rather than ‘weighted vote’ whencounting the responses of the histogram bins. In detail, the function h for HIGO isdefined as:
h(b) = ∑x∈N
δ (Q(θ(x)),b), (7)
where b and δ have the same meaning as in Equation (5). HIGO is considered in theframework because it depresses the influence of illumination and contrast by ignoringthe magnitude of the first order derivatives. Previous finding (Zhang et al. 2009) showedthat the image gradient orientation θ(x) does not depend on the illuminant at pixel x.For recognizing spontaneous MEs recorded in authentic situations in which illuminationmight vary, HIGO is expected to have enhanced performance.
Combination of feature planes: The histograms for XY, XT and YT plane representdifferent information, and previous results indicate that using all three histograms doesnot always yield the best performance (Davison et al. 2014). In this framework we willconsider five combinations of histograms on the three planes. Take the LBP feature asan example, the five combinations are listed in Table 4. The feature plane combinationsfor the other two features (HOG and HIGO) are defined in the same way.
Classification: Although the selection of classifier is also important, it is notconsidered as the main target for the current research. To keep it well-controlled and putmore focus on previous steps of the framework, in all the following ME recognitionexperiments, we use a linear SVM (Chang & Lin 2011) as the classifier and use theleave-one-subject-out protocol for validation. For the tests on SMIC, ME samples areclassified into three categories; for the tests on CASMEII, ME samples are classifiedinto five categories.
43
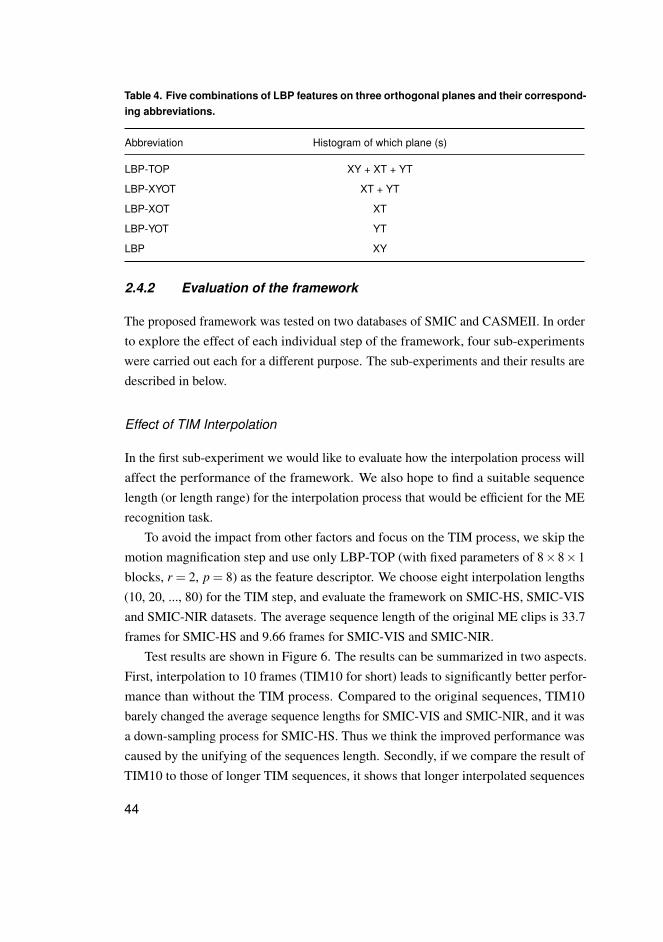
Table 4. Five combinations of LBP features on three orthogonal planes and their correspond-ing abbreviations.
Abbreviation Histogram of which plane (s)
LBP-TOP XY + XT + YT
LBP-XYOT XT + YT
LBP-XOT XT
LBP-YOT YT
LBP XY
2.4.2 Evaluation of the framework
The proposed framework was tested on two databases of SMIC and CASMEII. In orderto explore the effect of each individual step of the framework, four sub-experimentswere carried out each for a different purpose. The sub-experiments and their results aredescribed in below.
Effect of TIM Interpolation
In the first sub-experiment we would like to evaluate how the interpolation process willaffect the performance of the framework. We also hope to find a suitable sequencelength (or length range) for the interpolation process that would be efficient for the MErecognition task.
To avoid the impact from other factors and focus on the TIM process, we skip themotion magnification step and use only LBP-TOP (with fixed parameters of 8×8×1blocks, r = 2, p = 8) as the feature descriptor. We choose eight interpolation lengths(10, 20, ..., 80) for the TIM step, and evaluate the framework on SMIC-HS, SMIC-VISand SMIC-NIR datasets. The average sequence length of the original ME clips is 33.7frames for SMIC-HS and 9.66 frames for SMIC-VIS and SMIC-NIR.
Test results are shown in Figure 6. The results can be summarized in two aspects.First, interpolation to 10 frames (TIM10 for short) leads to significantly better perfor-mance than without the TIM process. Compared to the original sequences, TIM10barely changed the average sequence lengths for SMIC-VIS and SMIC-NIR, and it wasa down-sampling process for SMIC-HS. Thus we think the improved performance wascaused by the unifying of the sequences length. Secondly, if we compare the result ofTIM10 to those of longer TIM sequences, it shows that longer interpolated sequences
44
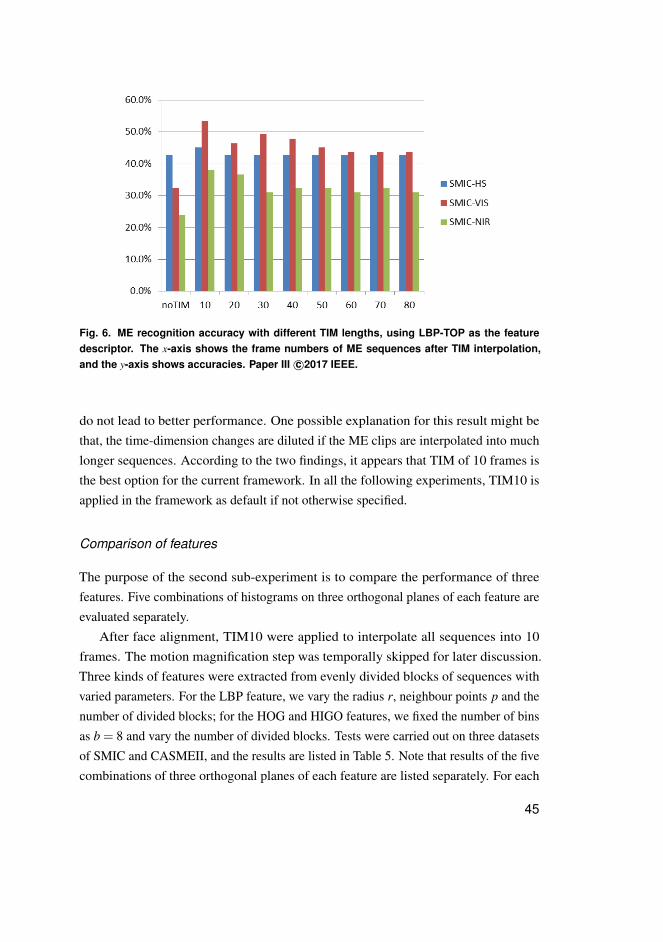
Fig. 6. ME recognition accuracy with different TIM lengths, using LBP-TOP as the featuredescriptor. The x-axis shows the frame numbers of ME sequences after TIM interpolation,and the y-axis shows accuracies. Paper III c©2017 IEEE.
do not lead to better performance. One possible explanation for this result might bethat, the time-dimension changes are diluted if the ME clips are interpolated into muchlonger sequences. According to the two findings, it appears that TIM of 10 frames isthe best option for the current framework. In all the following experiments, TIM10 isapplied in the framework as default if not otherwise specified.
Comparison of features
The purpose of the second sub-experiment is to compare the performance of threefeatures. Five combinations of histograms on three orthogonal planes of each feature areevaluated separately.
After face alignment, TIM10 were applied to interpolate all sequences into 10frames. The motion magnification step was temporally skipped for later discussion.Three kinds of features were extracted from evenly divided blocks of sequences withvaried parameters. For the LBP feature, we vary the radius r, neighbour points p and thenumber of divided blocks; for the HOG and HIGO features, we fixed the number of binsas b = 8 and vary the number of divided blocks. Tests were carried out on three datasetsof SMIC and CASMEII, and the results are listed in Table 5. Note that results of the fivecombinations of three orthogonal planes of each feature are listed separately. For each
45
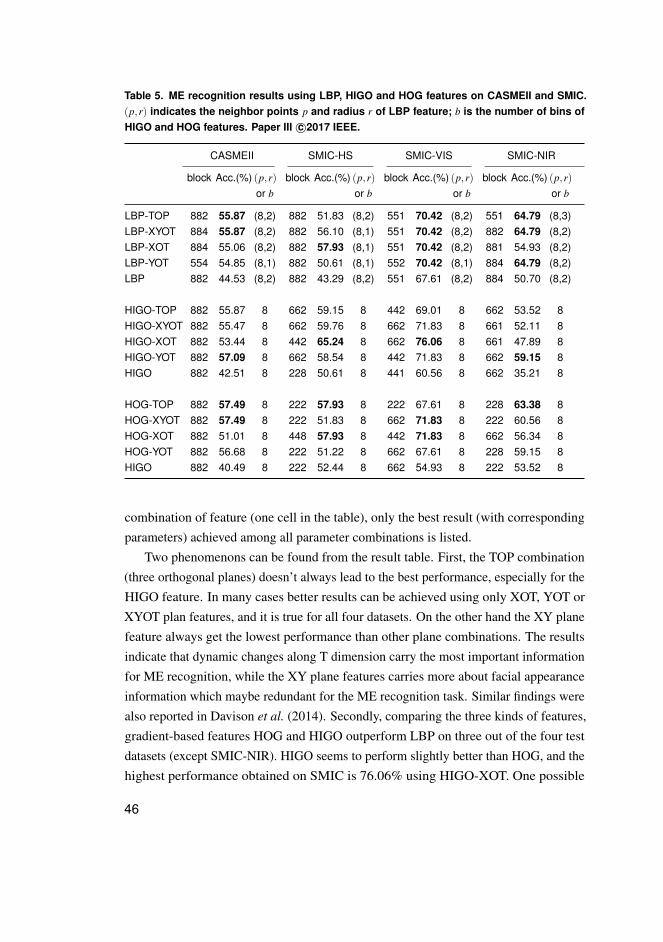
Table 5. ME recognition results using LBP, HIGO and HOG features on CASMEII and SMIC.(p,r) indicates the neighbor points p and radius r of LBP feature; b is the number of bins ofHIGO and HOG features. Paper III c©2017 IEEE.
CASMEII SMIC-HS SMIC-VIS SMIC-NIR
block Acc.(%) (p,r)or b
block Acc.(%) (p,r)or b
block Acc.(%) (p,r)or b
block Acc.(%) (p,r)or b
LBP-TOP 882 55.87 (8,2) 882 51.83 (8,2) 551 70.42 (8,2) 551 64.79 (8,3)LBP-XYOT 884 55.87 (8,2) 882 56.10 (8,1) 551 70.42 (8,2) 882 64.79 (8,2)LBP-XOT 884 55.06 (8,2) 882 57.93 (8,1) 551 70.42 (8,2) 881 54.93 (8,2)LBP-YOT 554 54.85 (8,1) 882 50.61 (8,1) 552 70.42 (8,1) 884 64.79 (8,2)LBP 882 44.53 (8,2) 882 43.29 (8,2) 551 67.61 (8,2) 884 50.70 (8,2)
HIGO-TOP 882 55.87 8 662 59.15 8 442 69.01 8 662 53.52 8HIGO-XYOT 882 55.47 8 662 59.76 8 662 71.83 8 661 52.11 8HIGO-XOT 882 53.44 8 442 65.24 8 662 76.06 8 661 47.89 8HIGO-YOT 882 57.09 8 662 58.54 8 442 71.83 8 662 59.15 8HIGO 882 42.51 8 228 50.61 8 441 60.56 8 662 35.21 8
HOG-TOP 882 57.49 8 222 57.93 8 222 67.61 8 228 63.38 8HOG-XYOT 882 57.49 8 222 51.83 8 662 71.83 8 222 60.56 8HOG-XOT 882 51.01 8 448 57.93 8 442 71.83 8 662 56.34 8HOG-YOT 882 56.68 8 222 51.22 8 662 67.61 8 228 59.15 8HIGO 882 40.49 8 222 52.44 8 662 54.93 8 222 53.52 8
combination of feature (one cell in the table), only the best result (with correspondingparameters) achieved among all parameter combinations is listed.
Two phenomenons can be found from the result table. First, the TOP combination(three orthogonal planes) doesn’t always lead to the best performance, especially for theHIGO feature. In many cases better results can be achieved using only XOT, YOT orXYOT plan features, and it is true for all four datasets. On the other hand the XY planefeature always get the lowest performance than other plane combinations. The resultsindicate that dynamic changes along T dimension carry the most important informationfor ME recognition, while the XY plane features carries more about facial appearanceinformation which maybe redundant for the ME recognition task. Similar findings werealso reported in Davison et al. (2014). Secondly, comparing the three kinds of features,gradient-based features HOG and HIGO outperform LBP on three out of the four testdatasets (except SMIC-NIR). HIGO seems to perform slightly better than HOG, and thehighest performance obtained on SMIC is 76.06% using HIGO-XOT. One possible
46
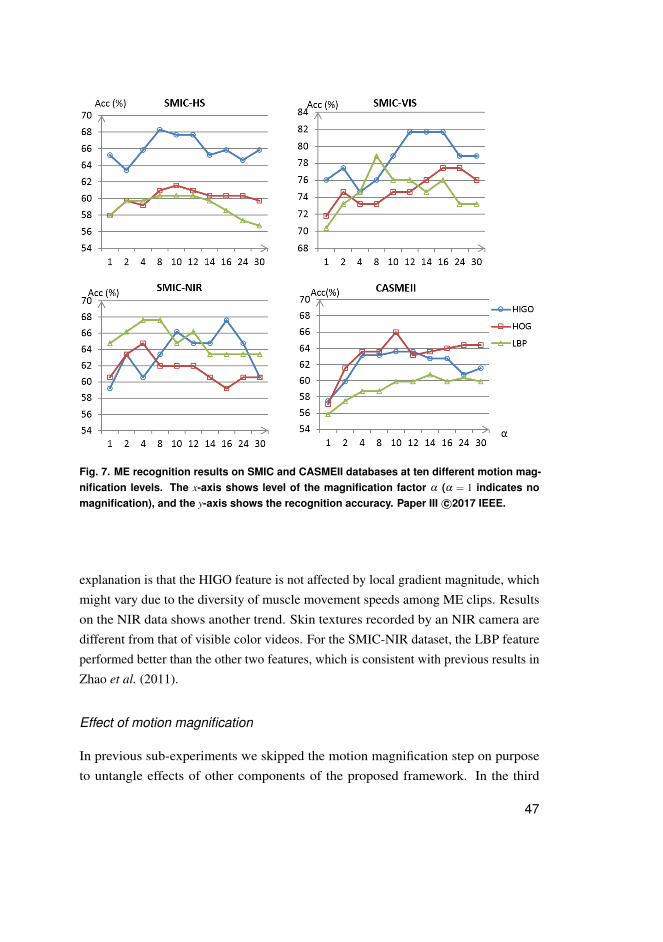
Fig. 7. ME recognition results on SMIC and CASMEII databases at ten different motion mag-nification levels. The x-axis shows level of the magnification factor α (α = 1 indicates nomagnification), and the y-axis shows the recognition accuracy. Paper III c©2017 IEEE.
explanation is that the HIGO feature is not affected by local gradient magnitude, whichmight vary due to the diversity of muscle movement speeds among ME clips. Resultson the NIR data shows another trend. Skin textures recorded by an NIR camera aredifferent from that of visible color videos. For the SMIC-NIR dataset, the LBP featureperformed better than the other two features, which is consistent with previous results inZhao et al. (2011).
Effect of motion magnification
In previous sub-experiments we skipped the motion magnification step on purposeto untangle effects of other components of the proposed framework. In the third
47

sub-experiment we targeted on the step of motion magnification. Our hypothesis is thatit can further improve the performance of the framework on ME recognition task.
All steps of the proposed framework are applied for this sub-experiments. Afterface alignment, motion magnification is applied on each clip at ten levels with α =
1,2,4,8,10,12,16,20,24 and 30 in order to explore the effect of different magnificationlevels. Then all clips are interpolated into length of 10 frames (TIM10). The featureextraction step is the same as described in the second sub-experiment. Test results onthree datasets of SMIC and CASMEII are shown in Figure 7.
We draw one curve for each feature on every testing dataset. We discuss about theresults from two aspects. First, with the motion magnification process the proposedframework achieve better performance if compared with no magnification (α = 1), andthis is consistent for all three features on all four testing datasets. This finding provedour hypothesis that motion magnification method does facilitate the ME recognition task.Secondly, the level of improvement fluctuates with the change of α levels, and higher α
level doesn’t necessarily lead to increased accuracy. According to the result curves, thebest performance for each feature is generally achieved with α values in the range of[8,16]. This finding is consistent with our expectation. As Figure 4 shows, too low α
values might not be enough to reveal the subtle changes, while too high α values maycause artifacts that will degrade the video quality. The most suitable α range might beslightly different for each dataset depending on the image resolution of the videos.
Comparison to the state of the art
In this section we summarize the best results of the three features either with or withoutthe magnification process. The results are listed in Table 6 and compared with severalresults achieved in other studies. To our best knowledge, SMIC and CASMEII are thetwo most popular databases currently available for spontaneous ME recognition. Thelisted results in Table 6 summarize the state-of-the-art leading progress on the study ofspontaneous ME recognition.
From Table 6 it can be seen that, the best results of our proposed framework areachieved using the HIGO feature with the motion magnification step. It achieved thebest accuracy of 81.69% on SMIC-VIS dataset. This results show that the HIGO featurehas more advantage than the other two features, and the motion magnification process isone effective approach for solving the ME recognition problem.
48
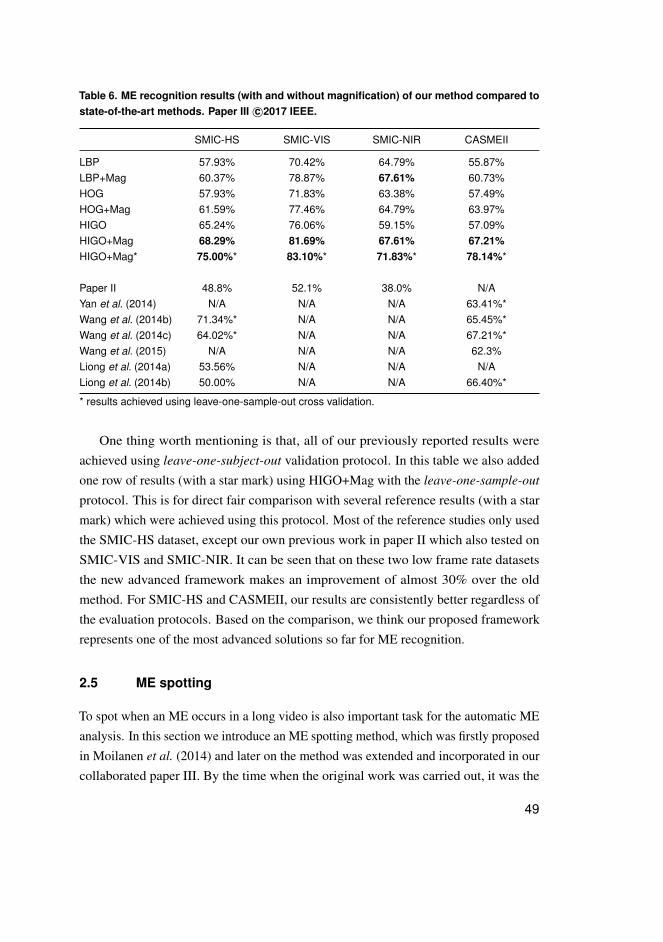
Table 6. ME recognition results (with and without magnification) of our method compared tostate-of-the-art methods. Paper III c©2017 IEEE.
SMIC-HS SMIC-VIS SMIC-NIR CASMEII
LBP 57.93% 70.42% 64.79% 55.87%LBP+Mag 60.37% 78.87% 67.61% 60.73%HOG 57.93% 71.83% 63.38% 57.49%HOG+Mag 61.59% 77.46% 64.79% 63.97%HIGO 65.24% 76.06% 59.15% 57.09%HIGO+Mag 68.29% 81.69% 67.61% 67.21%HIGO+Mag* 75.00%* 83.10%* 71.83%* 78.14%*
Paper II 48.8% 52.1% 38.0% N/AYan et al. (2014) N/A N/A N/A 63.41%*Wang et al. (2014b) 71.34%* N/A N/A 65.45%*Wang et al. (2014c) 64.02%* N/A N/A 67.21%*Wang et al. (2015) N/A N/A N/A 62.3%Liong et al. (2014a) 53.56% N/A N/A N/ALiong et al. (2014b) 50.00% N/A N/A 66.40%*
* results achieved using leave-one-sample-out cross validation.
One thing worth mentioning is that, all of our previously reported results wereachieved using leave-one-subject-out validation protocol. In this table we also addedone row of results (with a star mark) using HIGO+Mag with the leave-one-sample-out
protocol. This is for direct fair comparison with several reference results (with a starmark) which were achieved using this protocol. Most of the reference studies only usedthe SMIC-HS dataset, except our own previous work in paper II which also tested onSMIC-VIS and SMIC-NIR. It can be seen that on these two low frame rate datasetsthe new advanced framework makes an improvement of almost 30% over the oldmethod. For SMIC-HS and CASMEII, our results are consistently better regardless ofthe evaluation protocols. Based on the comparison, we think our proposed frameworkrepresents one of the most advanced solutions so far for ME recognition.
2.5 ME spotting
To spot when an ME occurs in a long video is also important task for the automatic MEanalysis. In this section we introduce an ME spotting method, which was firstly proposedin Moilanen et al. (2014) and later on the method was extended and incorporated in ourcollaborated paper III. By the time when the original work was carried out, it was the
49

Fig. 8. Work flow diagram for the proposed ME spotting method. Paper III c©2017 IEEE.
first study to propose a method for spotting spontaneous ME from long video contents.We first describe the proposed method, and then report the experiment results tested onSMIC-E and CASMEII databases.
2.5.1 A method for ME spotting
In order to spot the occurrence of an ME from other video contents, we propose amethod based on Feature Difference (FD) analysis. The main framework of the methodincludes four steps as shown in Figure 8. Detailed descriptions of each step are givenbelow.
Facial points tracking and block division
In the first step, we first detect two inner eye corners and the nose base point on thefirst frame of an input video, and then track the three feature points through the wholevideo using the Kanade-Lucas-Tormasi method (Tomasi & Kanade 1991). The problemof face rotations and face size variations are corrected by fixing locations of the threetracked feature points. Since we want to capture the subtle movements that may occurat different local areas (e.g., eye brows or mouth corners) of the face, the face area isdivided into 6× 6 equal-sized blocks. In order to allocate the same facial area intothe corresponding blocks through the whole video, the block structure is also fixedaccording to the three tracked feature points, as shown in Figure 9.
Feature extraction
In the second step, two appearance based features are used as descriptors for evaluation.The first one is LBP, which has been demonstrated to be effective for face recognitionand ME recognition tasks (Ahonen et al. 2006). In the current framework, we firstcalculate normalized LBP histogram for each block, and then concatenate all histogramsto get the LBP feature for the current frame. The second feature is the Histogram of
50
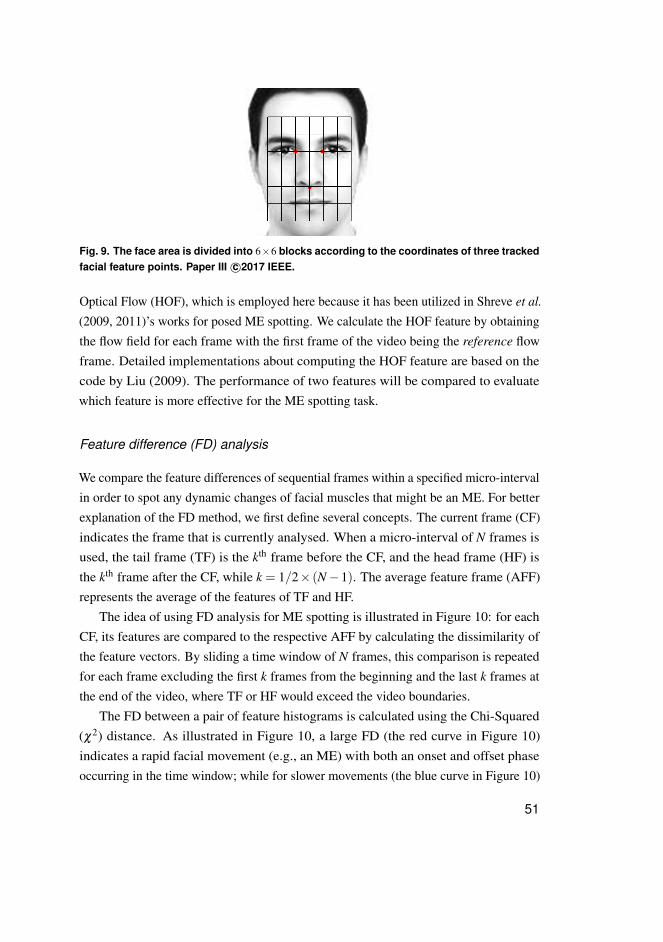
Fig. 9. The face area is divided into 6×6 blocks according to the coordinates of three trackedfacial feature points. Paper III c©2017 IEEE.
Optical Flow (HOF), which is employed here because it has been utilized in Shreve et al.
(2009, 2011)’s works for posed ME spotting. We calculate the HOF feature by obtainingthe flow field for each frame with the first frame of the video being the reference flowframe. Detailed implementations about computing the HOF feature are based on thecode by Liu (2009). The performance of two features will be compared to evaluatewhich feature is more effective for the ME spotting task.
Feature difference (FD) analysis
We compare the feature differences of sequential frames within a specified micro-intervalin order to spot any dynamic changes of facial muscles that might be an ME. For betterexplanation of the FD method, we first define several concepts. The current frame (CF)indicates the frame that is currently analysed. When a micro-interval of N frames isused, the tail frame (TF) is the kth frame before the CF, and the head frame (HF) isthe kth frame after the CF, while k = 1/2× (N−1). The average feature frame (AFF)represents the average of the features of TF and HF.
The idea of using FD analysis for ME spotting is illustrated in Figure 10: for eachCF, its features are compared to the respective AFF by calculating the dissimilarity ofthe feature vectors. By sliding a time window of N frames, this comparison is repeatedfor each frame excluding the first k frames from the beginning and the last k frames atthe end of the video, where TF or HF would exceed the video boundaries.
The FD between a pair of feature histograms is calculated using the Chi-Squared(χ2) distance. As illustrated in Figure 10, a large FD (the red curve in Figure 10)indicates a rapid facial movement (e.g., an ME) with both an onset and offset phaseoccurring in the time window; while for slower movements (the blue curve in Figure 10)
51
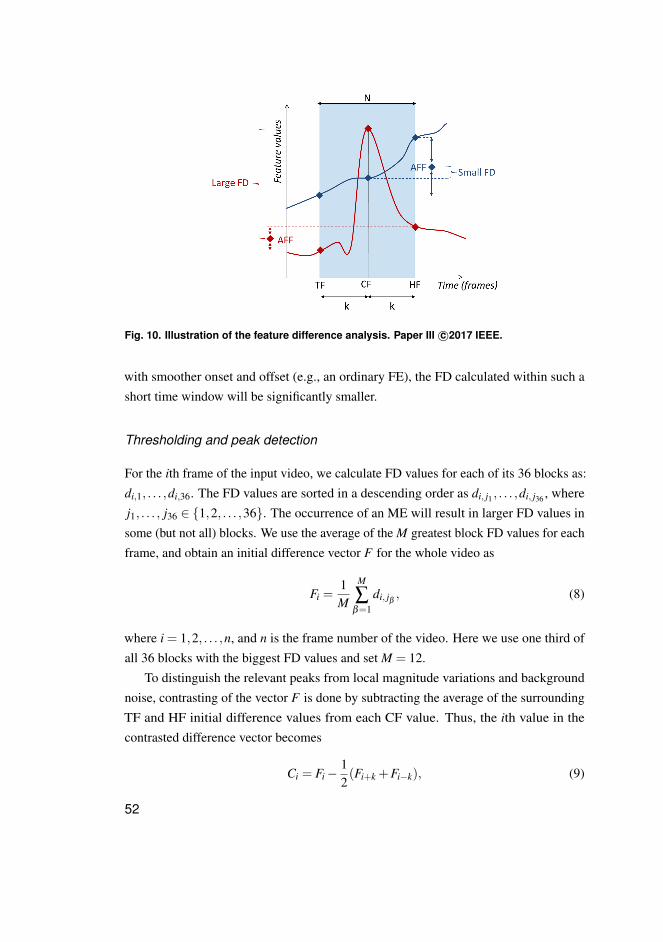
Fig. 10. Illustration of the feature difference analysis. Paper III c©2017 IEEE.
with smoother onset and offset (e.g., an ordinary FE), the FD calculated within such ashort time window will be significantly smaller.
Thresholding and peak detection
For the ith frame of the input video, we calculate FD values for each of its 36 blocks as:di,1, . . . ,di,36. The FD values are sorted in a descending order as di, j1 , . . . ,di, j36 , wherej1, . . . , j36 ∈ {1,2, . . . ,36}. The occurrence of an ME will result in larger FD values insome (but not all) blocks. We use the average of the M greatest block FD values for eachframe, and obtain an initial difference vector F for the whole video as
Fi =1M
M
∑β=1
di, jβ , (8)
where i = 1,2, . . . ,n, and n is the frame number of the video. Here we use one third ofall 36 blocks with the biggest FD values and set M = 12.
To distinguish the relevant peaks from local magnitude variations and backgroundnoise, contrasting of the vector F is done by subtracting the average of the surroundingTF and HF initial difference values from each CF value. Thus, the ith value in thecontrasted difference vector becomes
Ci = Fi−12(Fi+k +Fi−k), (9)
52
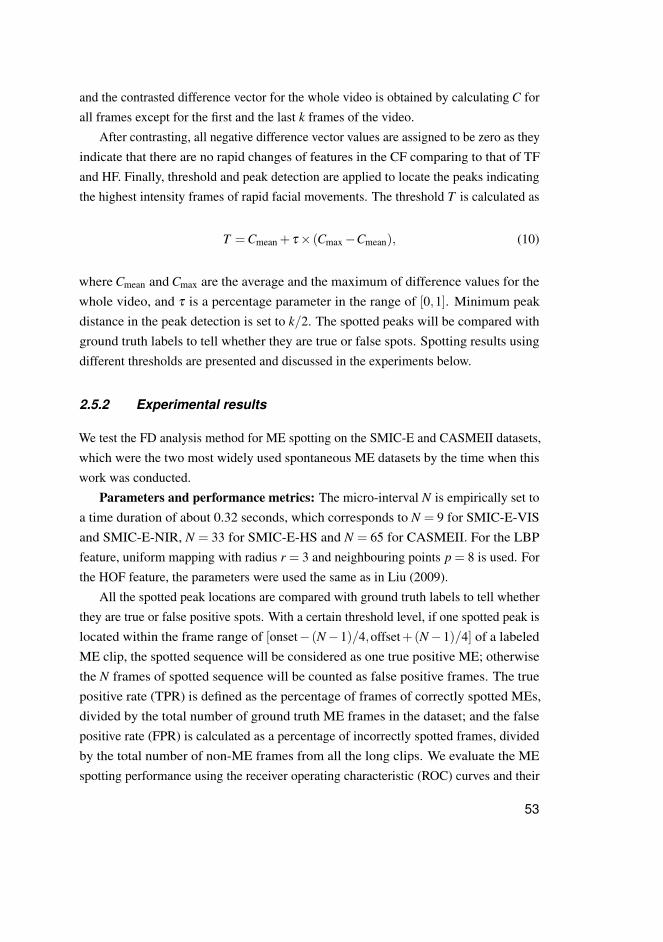
and the contrasted difference vector for the whole video is obtained by calculating C forall frames except for the first and the last k frames of the video.
After contrasting, all negative difference vector values are assigned to be zero as theyindicate that there are no rapid changes of features in the CF comparing to that of TFand HF. Finally, threshold and peak detection are applied to locate the peaks indicatingthe highest intensity frames of rapid facial movements. The threshold T is calculated as
T =Cmean + τ× (Cmax−Cmean), (10)
where Cmean and Cmax are the average and the maximum of difference values for thewhole video, and τ is a percentage parameter in the range of [0,1]. Minimum peakdistance in the peak detection is set to k/2. The spotted peaks will be compared withground truth labels to tell whether they are true or false spots. Spotting results usingdifferent thresholds are presented and discussed in the experiments below.
2.5.2 Experimental results
We test the FD analysis method for ME spotting on the SMIC-E and CASMEII datasets,which were the two most widely used spontaneous ME datasets by the time when thiswork was conducted.
Parameters and performance metrics: The micro-interval N is empirically set toa time duration of about 0.32 seconds, which corresponds to N = 9 for SMIC-E-VISand SMIC-E-NIR, N = 33 for SMIC-E-HS and N = 65 for CASMEII. For the LBPfeature, uniform mapping with radius r = 3 and neighbouring points p = 8 is used. Forthe HOF feature, the parameters were used the same as in Liu (2009).
All the spotted peak locations are compared with ground truth labels to tell whetherthey are true or false positive spots. With a certain threshold level, if one spotted peak islocated within the frame range of [onset− (N−1)/4,offset+(N−1)/4] of a labeledME clip, the spotted sequence will be considered as one true positive ME; otherwisethe N frames of spotted sequence will be counted as false positive frames. The truepositive rate (TPR) is defined as the percentage of frames of correctly spotted MEs,divided by the total number of ground truth ME frames in the dataset; and the falsepositive rate (FPR) is calculated as a percentage of incorrectly spotted frames, dividedby the total number of non-ME frames from all the long clips. We evaluate the MEspotting performance using the receiver operating characteristic (ROC) curves and their
53
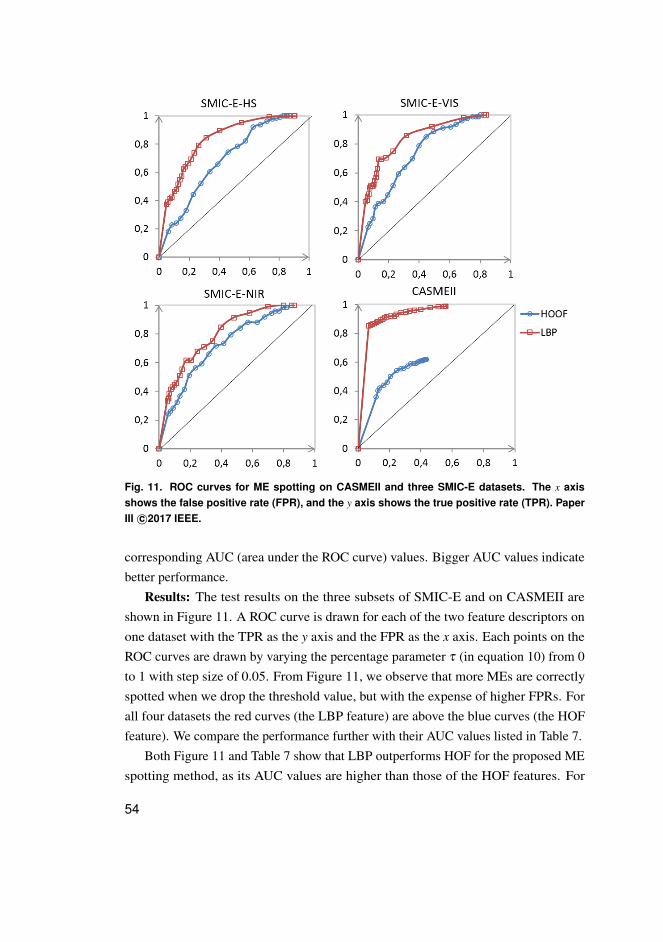
Fig. 11. ROC curves for ME spotting on CASMEII and three SMIC-E datasets. The x axisshows the false positive rate (FPR), and the y axis shows the true positive rate (TPR). PaperIII c©2017 IEEE.
corresponding AUC (area under the ROC curve) values. Bigger AUC values indicatebetter performance.
Results: The test results on the three subsets of SMIC-E and on CASMEII areshown in Figure 11. A ROC curve is drawn for each of the two feature descriptors onone dataset with the TPR as the y axis and the FPR as the x axis. Each points on theROC curves are drawn by varying the percentage parameter τ (in equation 10) from 0to 1 with step size of 0.05. From Figure 11, we observe that more MEs are correctlyspotted when we drop the threshold value, but with the expense of higher FPRs. Forall four datasets the red curves (the LBP feature) are above the blue curves (the HOFfeature). We compare the performance further with their AUC values listed in Table 7.
Both Figure 11 and Table 7 show that LBP outperforms HOF for the proposed MEspotting method, as its AUC values are higher than those of the HOF features. For
54
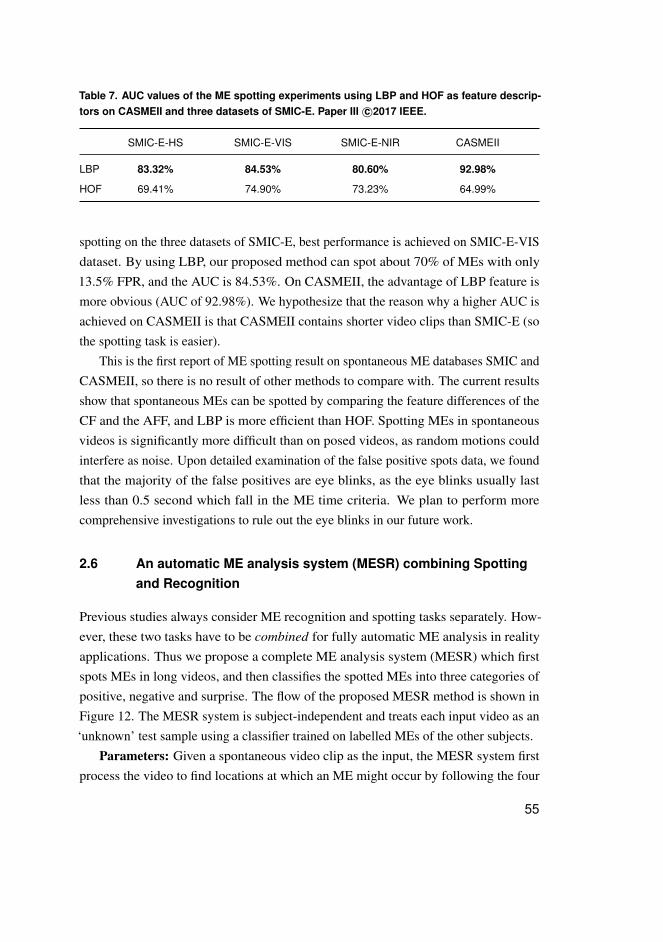
Table 7. AUC values of the ME spotting experiments using LBP and HOF as feature descrip-tors on CASMEII and three datasets of SMIC-E. Paper III c©2017 IEEE.
SMIC-E-HS SMIC-E-VIS SMIC-E-NIR CASMEII
LBP 83.32% 84.53% 80.60% 92.98%
HOF 69.41% 74.90% 73.23% 64.99%
spotting on the three datasets of SMIC-E, best performance is achieved on SMIC-E-VISdataset. By using LBP, our proposed method can spot about 70% of MEs with only13.5% FPR, and the AUC is 84.53%. On CASMEII, the advantage of LBP feature ismore obvious (AUC of 92.98%). We hypothesize that the reason why a higher AUC isachieved on CASMEII is that CASMEII contains shorter video clips than SMIC-E (sothe spotting task is easier).
This is the first report of ME spotting result on spontaneous ME databases SMIC andCASMEII, so there is no result of other methods to compare with. The current resultsshow that spontaneous MEs can be spotted by comparing the feature differences of theCF and the AFF, and LBP is more efficient than HOF. Spotting MEs in spontaneousvideos is significantly more difficult than on posed videos, as random motions couldinterfere as noise. Upon detailed examination of the false positive spots data, we foundthat the majority of the false positives are eye blinks, as the eye blinks usually lastless than 0.5 second which fall in the ME time criteria. We plan to perform morecomprehensive investigations to rule out the eye blinks in our future work.
2.6 An automatic ME analysis system (MESR) combining Spottingand Recognition
Previous studies always consider ME recognition and spotting tasks separately. How-ever, these two tasks have to be combined for fully automatic ME analysis in realityapplications. Thus we propose a complete ME analysis system (MESR) which firstspots MEs in long videos, and then classifies the spotted MEs into three categories ofpositive, negative and surprise. The flow of the proposed MESR method is shown inFigure 12. The MESR system is subject-independent and treats each input video as an‘unknown’ test sample using a classifier trained on labelled MEs of the other subjects.
Parameters: Given a spontaneous video clip as the input, the MESR system firstprocess the video to find locations at which an ME might occur by following the four
55
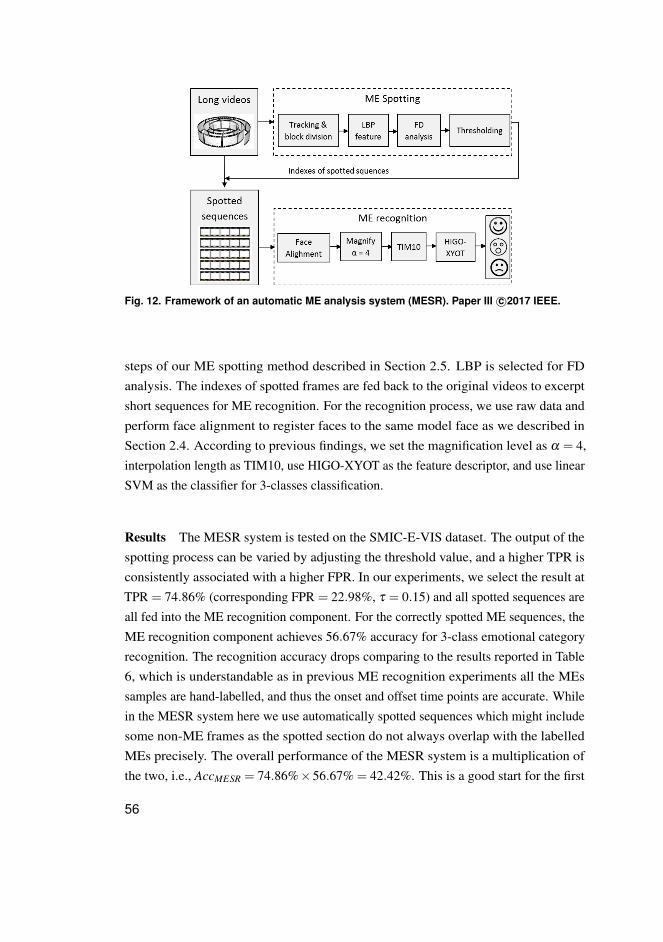
Fig. 12. Framework of an automatic ME analysis system (MESR). Paper III c©2017 IEEE.
steps of our ME spotting method described in Section 2.5. LBP is selected for FDanalysis. The indexes of spotted frames are fed back to the original videos to excerptshort sequences for ME recognition. For the recognition process, we use raw data andperform face alignment to register faces to the same model face as we described inSection 2.4. According to previous findings, we set the magnification level as α = 4,interpolation length as TIM10, use HIGO-XYOT as the feature descriptor, and use linearSVM as the classifier for 3-classes classification.
Results The MESR system is tested on the SMIC-E-VIS dataset. The output of thespotting process can be varied by adjusting the threshold value, and a higher TPR isconsistently associated with a higher FPR. In our experiments, we select the result atTPR = 74.86% (corresponding FPR = 22.98%, τ = 0.15) and all spotted sequences areall fed into the ME recognition component. For the correctly spotted ME sequences, theME recognition component achieves 56.67% accuracy for 3-class emotional categoryrecognition. The recognition accuracy drops comparing to the results reported in Table6, which is understandable as in previous ME recognition experiments all the MEssamples are hand-labelled, and thus the onset and offset time points are accurate. Whilein the MESR system here we use automatically spotted sequences which might includesome non-ME frames as the spotted section do not always overlap with the labelledMEs precisely. The overall performance of the MESR system is a multiplication ofthe two, i.e., AccMESR = 74.86%×56.67% = 42.42%. This is a good start for the first
56

exploration of a combined ME spotting and recognition system, which will be furtherrefined in our future work.
2.7 Conclusion
This Chapter focuses on the studies of ME analysis. We first reviewed the state-of-the-artprogress about ME studies, including psychological studies about the concept andphenomenon of the ME, the challenges of collecting ME data, earlier studies using posedMEs, and also more recent studies of automatic ME spotting and recognition usingspontaneous ME datasets. Then four parts of works about spontaneous ME analysisdone by us were introduced, including 1) the collection of the first spontaneous MEdatabase SMIC; 2) a framework for ME recognition; 3) an ME spotting method usingfeature difference analysis; and 4) an automatic ME analysis system (MESR) for firstlyspotting and then the recognition of MEs.
The topic of ME analysis concerns facial movements at a very fine level. It is at anearly stage by now, but it is attracting more attentions and developing rapidly. Newdatabases are emerging, and new methods have been proposed with better performanceboth for ME recognition and for ME spotting. In future computers might be able tosense people’s hidden feelings better than us with the ability to accurately spot andrecognize MEs. We were the first few researchers that devoted to this topic. The maincontributions of our exploratory works are 1) to break the ground and attract moreresearchers to the topic of ME; 2) to provide data as a benchmark for future studies;and 3) to propose basic framework and possible solutions for countering ME-specificchallenges (e.g., the short duration and the intensity of movements) that may inspirefuture work. I plan to continue research on ME analysis in future, and detailed plans isdescribed in Section 4.
57

58

3 Heart rate measurement from face and itsapplication for face anti-spoofing
3.1 Introduction
Heart rate (HR) is one of the most important vital signs for medical diagnostics and dailyhealth monitoring. Besides the health domain, the HR, together with other physiologicalsignals such as respiration rate and blood pressure, are also important indicator ofpeople’s psychological status, as they can be affected by feeling, emotion and stress.Traditional techniques and devices for measuring these physiological signals are mainlybased on body-attached sensors, which require the measured person to be presentedand the sensors need to be attached. Some attached sensors may cause discomfortespecially for long-time monitoring. For example, the Electrocardiography (ECG),which is commonly used to acquire the heart beat signals, needs to attach electrodesensors on patient’s chest or arms, which makes it inconvenient for users to operate bythemselves at home.
HR signal analysis is one conventional topic in biomedical research area, but isseldom under concerns of computer scientists. Computer vision is mostly known foranalysing explicit characteristics such as shapes, textures and movements, while implicitbio-signals such as the HR was considered ‘out of range’ if without the help of specialoptical equipment. However, a few years ago there were studies (Poh et al. 2010,Verkruysse et al. 2008) reporting that cardiac pulse information can be captured withordinary color cameras. These works inspired the author to explore the possibility tomeasure HR from facial videos remotely.
If we can realize reliable HR measurement using only one ordinary color camera,it might impact and change our future life in many ways, as nowadays the camerasare available almost everywhere. Remote HR measurement from facial videos maybe applied for different purposes: 1) For remote health care: if HR can be remotelymeasured accurate enough in the future, people might be able to get remote medicalexaminations at home, or use simple camera devices for long-term heath monitoring. 2)For affective computing: physiological states like the changes of HR are inextricablylinked with people’s emotions, thus could be integrated with facial expression analysis tobuild multi-modal emotion recognition systems. 3) For human behaviour analysis: aside
59
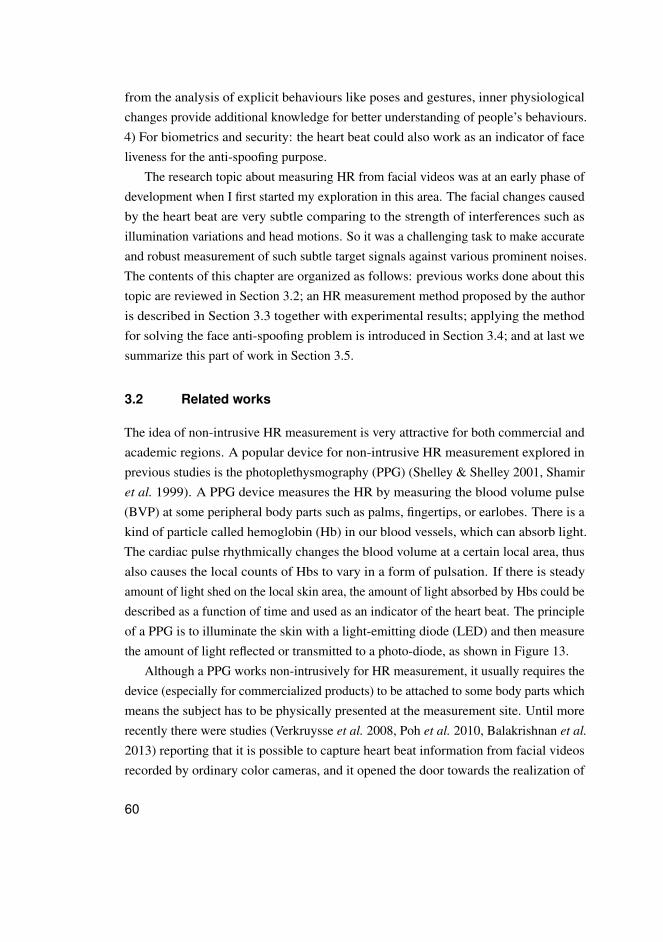
from the analysis of explicit behaviours like poses and gestures, inner physiologicalchanges provide additional knowledge for better understanding of people’s behaviours.4) For biometrics and security: the heart beat could also work as an indicator of faceliveness for the anti-spoofing purpose.
The research topic about measuring HR from facial videos was at an early phase ofdevelopment when I first started my exploration in this area. The facial changes causedby the heart beat are very subtle comparing to the strength of interferences such asillumination variations and head motions. So it was a challenging task to make accurateand robust measurement of such subtle target signals against various prominent noises.The contents of this chapter are organized as follows: previous works done about thistopic are reviewed in Section 3.2; an HR measurement method proposed by the authoris described in Section 3.3 together with experimental results; applying the methodfor solving the face anti-spoofing problem is introduced in Section 3.4; and at last wesummarize this part of work in Section 3.5.
3.2 Related works
The idea of non-intrusive HR measurement is very attractive for both commercial andacademic regions. A popular device for non-intrusive HR measurement explored inprevious studies is the photoplethysmography (PPG) (Shelley & Shelley 2001, Shamiret al. 1999). A PPG device measures the HR by measuring the blood volume pulse(BVP) at some peripheral body parts such as palms, fingertips, or earlobes. There is akind of particle called hemoglobin (Hb) in our blood vessels, which can absorb light.The cardiac pulse rhythmically changes the blood volume at a certain local area, thusalso causes the local counts of Hbs to vary in a form of pulsation. If there is steadyamount of light shed on the local skin area, the amount of light absorbed by Hbs could bedescribed as a function of time and used as an indicator of the heart beat. The principleof a PPG is to illuminate the skin with a light-emitting diode (LED) and then measurethe amount of light reflected or transmitted to a photo-diode, as shown in Figure 13.
Although a PPG works non-intrusively for HR measurement, it usually requires thedevice (especially for commercialized products) to be attached to some body parts whichmeans the subject has to be physically presented at the measurement site. Until morerecently there were studies (Verkruysse et al. 2008, Poh et al. 2010, Balakrishnan et al.
2013) reporting that it is possible to capture heart beat information from facial videosrecorded by ordinary color cameras, and it opened the door towards the realization of
60
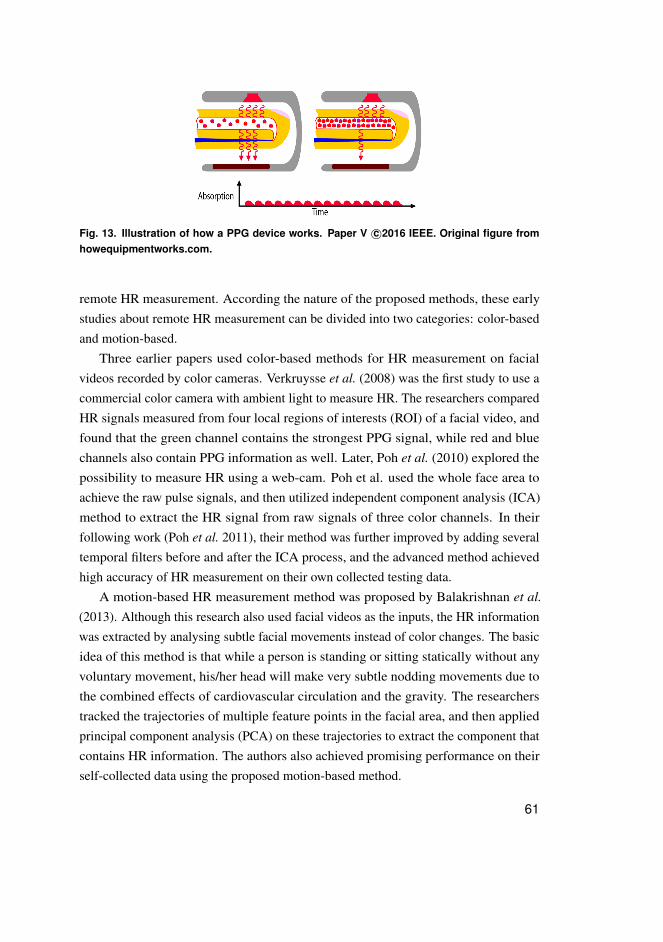
Fig. 13. Illustration of how a PPG device works. Paper V c©2016 IEEE. Original figure fromhowequipmentworks.com.
remote HR measurement. According the nature of the proposed methods, these earlystudies about remote HR measurement can be divided into two categories: color-basedand motion-based.
Three earlier papers used color-based methods for HR measurement on facialvideos recorded by color cameras. Verkruysse et al. (2008) was the first study to use acommercial color camera with ambient light to measure HR. The researchers comparedHR signals measured from four local regions of interests (ROI) of a facial video, andfound that the green channel contains the strongest PPG signal, while red and bluechannels also contain PPG information as well. Later, Poh et al. (2010) explored thepossibility to measure HR using a web-cam. Poh et al. used the whole face area toachieve the raw pulse signals, and then utilized independent component analysis (ICA)method to extract the HR signal from raw signals of three color channels. In theirfollowing work (Poh et al. 2011), their method was further improved by adding severaltemporal filters before and after the ICA process, and the advanced method achievedhigh accuracy of HR measurement on their own collected testing data.
A motion-based HR measurement method was proposed by Balakrishnan et al.
(2013). Although this research also used facial videos as the inputs, the HR informationwas extracted by analysing subtle facial movements instead of color changes. The basicidea of this method is that while a person is standing or sitting statically without anyvoluntary movement, his/her head will make very subtle nodding movements due tothe combined effects of cardiovascular circulation and the gravity. The researcherstracked the trajectories of multiple feature points in the facial area, and then appliedprincipal component analysis (PCA) on these trajectories to extract the component thatcontains HR information. The authors also achieved promising performance on theirself-collected data using the proposed motion-based method.
61
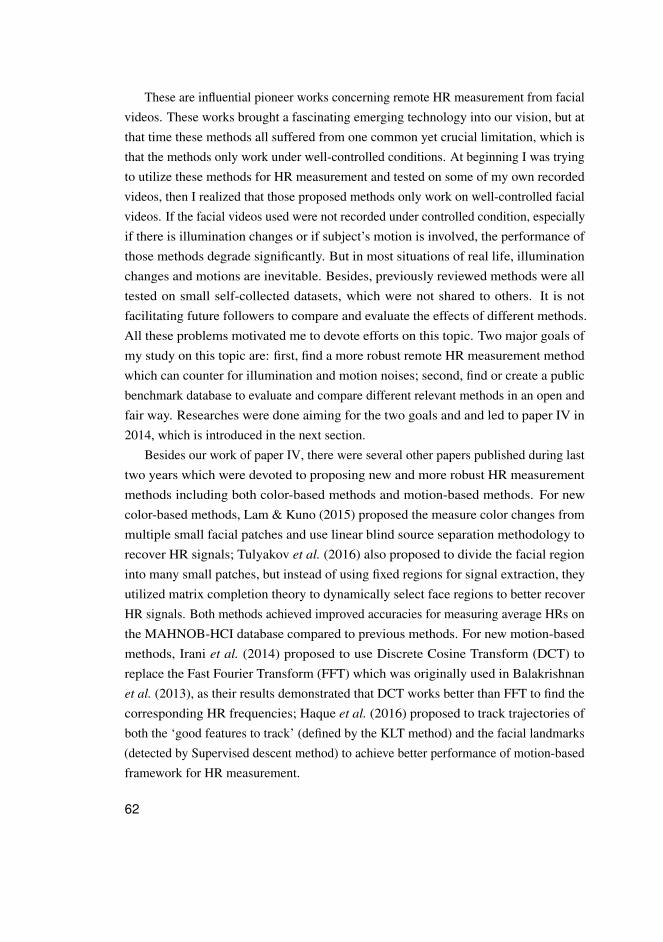
These are influential pioneer works concerning remote HR measurement from facialvideos. These works brought a fascinating emerging technology into our vision, but atthat time these methods all suffered from one common yet crucial limitation, which isthat the methods only work under well-controlled conditions. At beginning I was tryingto utilize these methods for HR measurement and tested on some of my own recordedvideos, then I realized that those proposed methods only work on well-controlled facialvideos. If the facial videos used were not recorded under controlled condition, especiallyif there is illumination changes or if subject’s motion is involved, the performance ofthose methods degrade significantly. But in most situations of real life, illuminationchanges and motions are inevitable. Besides, previously reviewed methods were alltested on small self-collected datasets, which were not shared to others. It is notfacilitating future followers to compare and evaluate the effects of different methods.All these problems motivated me to devote efforts on this topic. Two major goals ofmy study on this topic are: first, find a more robust remote HR measurement methodwhich can counter for illumination and motion noises; second, find or create a publicbenchmark database to evaluate and compare different relevant methods in an open andfair way. Researches were done aiming for the two goals and and led to paper IV in2014, which is introduced in the next section.
Besides our work of paper IV, there were several other papers published during lasttwo years which were devoted to proposing new and more robust HR measurementmethods including both color-based methods and motion-based methods. For newcolor-based methods, Lam & Kuno (2015) proposed the measure color changes frommultiple small facial patches and use linear blind source separation methodology torecover HR signals; Tulyakov et al. (2016) also proposed to divide the facial regioninto many small patches, but instead of using fixed regions for signal extraction, theyutilized matrix completion theory to dynamically select face regions to better recoverHR signals. Both methods achieved improved accuracies for measuring average HRs onthe MAHNOB-HCI database compared to previous methods. For new motion-basedmethods, Irani et al. (2014) proposed to use Discrete Cosine Transform (DCT) toreplace the Fast Fourier Transform (FFT) which was originally used in Balakrishnanet al. (2013), as their results demonstrated that DCT works better than FFT to find thecorresponding HR frequencies; Haque et al. (2016) proposed to track trajectories ofboth the ‘good features to track’ (defined by the KLT method) and the facial landmarks(detected by Supervised descent method) to achieve better performance of motion-basedframework for HR measurement.
62
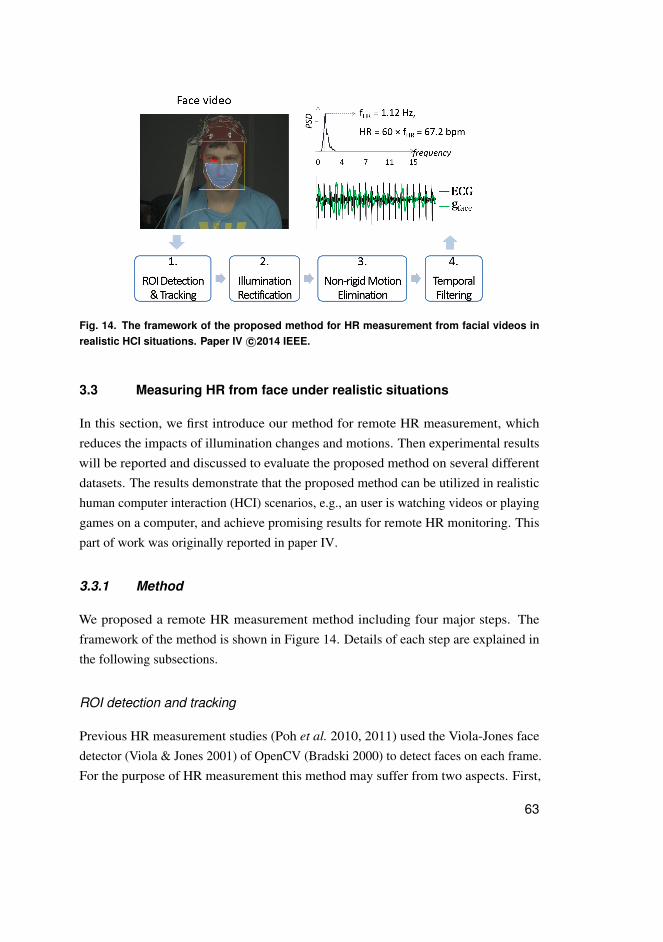
Fig. 14. The framework of the proposed method for HR measurement from facial videos inrealistic HCI situations. Paper IV c©2014 IEEE.
3.3 Measuring HR from face under realistic situations
In this section, we first introduce our method for remote HR measurement, whichreduces the impacts of illumination changes and motions. Then experimental resultswill be reported and discussed to evaluate the proposed method on several differentdatasets. The results demonstrate that the proposed method can be utilized in realistichuman computer interaction (HCI) scenarios, e.g., an user is watching videos or playinggames on a computer, and achieve promising results for remote HR monitoring. Thispart of work was originally reported in paper IV.
3.3.1 Method
We proposed a remote HR measurement method including four major steps. Theframework of the method is shown in Figure 14. Details of each step are explained inthe following subsections.
ROI detection and tracking
Previous HR measurement studies (Poh et al. 2010, 2011) used the Viola-Jones facedetector (Viola & Jones 2001) of OpenCV (Bradski 2000) to detect faces on each frame.For the purpose of HR measurement this method may suffer from two aspects. First,
63
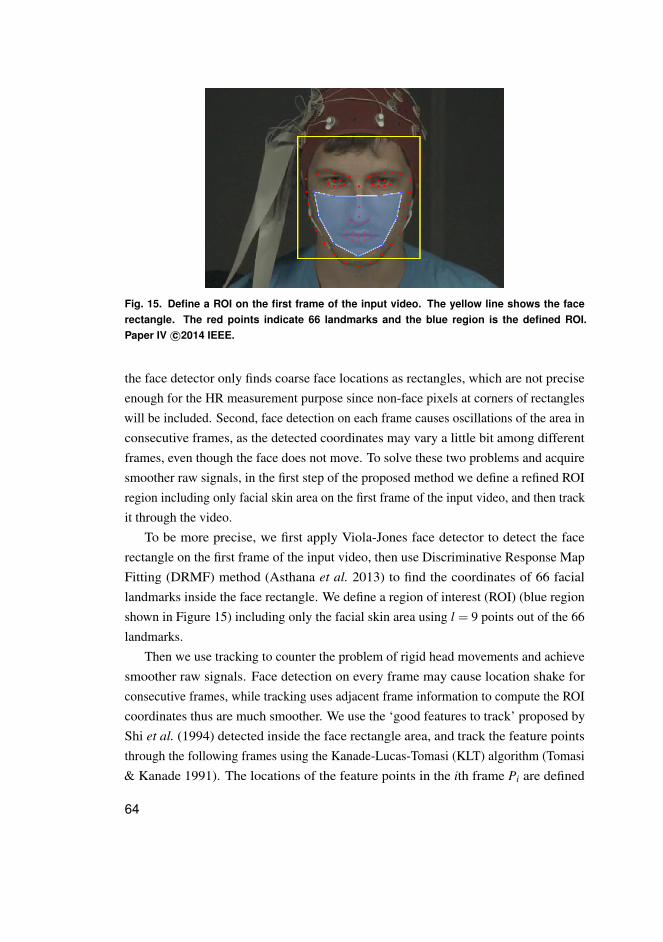
Fig. 15. Define a ROI on the first frame of the input video. The yellow line shows the facerectangle. The red points indicate 66 landmarks and the blue region is the defined ROI.Paper IV c©2014 IEEE.
the face detector only finds coarse face locations as rectangles, which are not preciseenough for the HR measurement purpose since non-face pixels at corners of rectangleswill be included. Second, face detection on each frame causes oscillations of the area inconsecutive frames, as the detected coordinates may vary a little bit among differentframes, even though the face does not move. To solve these two problems and acquiresmoother raw signals, in the first step of the proposed method we define a refined ROIregion including only facial skin area on the first frame of the input video, and then trackit through the video.
To be more precise, we first apply Viola-Jones face detector to detect the facerectangle on the first frame of the input video, then use Discriminative Response MapFitting (DRMF) method (Asthana et al. 2013) to find the coordinates of 66 faciallandmarks inside the face rectangle. We define a region of interest (ROI) (blue regionshown in Figure 15) including only the facial skin area using l = 9 points out of the 66landmarks.
Then we use tracking to counter the problem of rigid head movements and achievesmoother raw signals. Face detection on every frame may cause location shake forconsecutive frames, while tracking uses adjacent frame information to compute the ROIcoordinates thus are much smoother. We use the ‘good features to track’ proposed byShi et al. (1994) detected inside the face rectangle area, and track the feature pointsthrough the following frames using the Kanade-Lucas-Tomasi (KLT) algorithm (Tomasi& Kanade 1991). The locations of the feature points in the ith frame Pi are defined
64
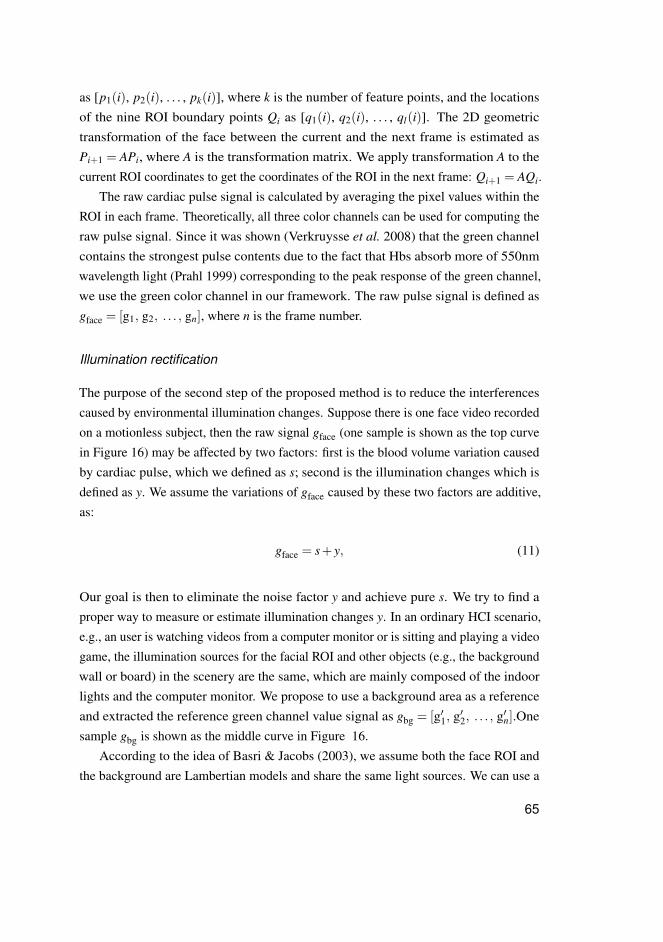
as [p1(i), p2(i), . . . , pk(i)], where k is the number of feature points, and the locationsof the nine ROI boundary points Qi as [q1(i), q2(i), . . . , ql(i)]. The 2D geometrictransformation of the face between the current and the next frame is estimated asPi+1 = APi, where A is the transformation matrix. We apply transformation A to thecurrent ROI coordinates to get the coordinates of the ROI in the next frame: Qi+1 = AQi.
The raw cardiac pulse signal is calculated by averaging the pixel values within theROI in each frame. Theoretically, all three color channels can be used for computing theraw pulse signal. Since it was shown (Verkruysse et al. 2008) that the green channelcontains the strongest pulse contents due to the fact that Hbs absorb more of 550nmwavelength light (Prahl 1999) corresponding to the peak response of the green channel,we use the green color channel in our framework. The raw pulse signal is defined asgface = [g1, g2, . . . , gn], where n is the frame number.
Illumination rectification
The purpose of the second step of the proposed method is to reduce the interferencescaused by environmental illumination changes. Suppose there is one face video recordedon a motionless subject, then the raw signal gface (one sample is shown as the top curvein Figure 16) may be affected by two factors: first is the blood volume variation causedby cardiac pulse, which we defined as s; second is the illumination changes which isdefined as y. We assume the variations of gface caused by these two factors are additive,as:
gface = s+ y, (11)
Our goal is then to eliminate the noise factor y and achieve pure s. We try to find aproper way to measure or estimate illumination changes y. In an ordinary HCI scenario,e.g., an user is watching videos from a computer monitor or is sitting and playing a videogame, the illumination sources for the facial ROI and other objects (e.g., the backgroundwall or board) in the scenery are the same, which are mainly composed of the indoorlights and the computer monitor. We propose to use a background area as a referenceand extracted the reference green channel value signal as gbg = [g′1, g′2, . . . , g′n].Onesample gbg is shown as the middle curve in Figure 16.
According to the idea of Basri & Jacobs (2003), we assume both the face ROI andthe background are Lambertian models and share the same light sources. We can use a
65

Fig. 16. Use NLMS filter to reduce noise caused by illumination variations. Top curve: a rawpulse signal of ROI. Middle curve: the corresponding green value signal of an backgroundarea. Bottom curve: the filtered signal, of which the illumination variations are reduced andthe pulses become more visible. Paper IV c©2014 IEEE.
linear function to estimate the correlation of y and gbg:
y≈ hgbg. (12)
We can utilize (12) and define the illumination rectified pulse signal gIR as
gIR = gface−hgbg, (13)
which according to (11) becomes
gIR = s+(y−hgbg). (14)
Now the goal is to find the optimal h to minimize the error, which is the part of (y−hgbg)
in (14).The optimal h can be found iteratively by using Normalized Least Mean Square
(NLMS) adaptive filter (Simon 2002), which is a variant of the Least Mean Square(LMS) adaptive filter (Haykin & Widrow 2003). It is shown that the LMS filter canefficiently reduce motion artifacts in some PPG studies (Cennini et al. 2010, Chan &Zhang 2002).
Let’s assume at each time point j, h( j) is the currently estimated filter weight. TheLMS filter starts from an initial h(0) and updates it after each step with a stepsize µ as
h( j+1) = h( j)+µgIR( j)gbg( j), (15)
until h( j) converges to the optimum weight that minimize (y−hgbg) (or the input signalreaches the end).
66

A problem with the LMS filter is that it is sensitive to the scaling of input signals,which can be solved by normalizing the power of the input signals (Simon 2002):
h( j+1) = h( j)+µgIR( j)gbg( j)
gHbg( j)gbg( j)
, (16)
where gHbg( j) is the Hermitian transpose of gbg( j), and the normalizing quantity
gHbg( j)gbg( j) is the input energy.
For achieving the reference signal gbg, we use the Distance Regularized Level SetEvolution (DRLSE) method (Li et al. 2010) to segment the background region of thevideo. With gface and gbg as known variables, we can use (16) to obtain the optimal h,which then can be used in equation (13) to obtain the illumination rectified signal gIR.One sample of gIR is shown as the bottom curve in Figure 16, from which it can be seenthat the illumination variations are significantly reduced after NLMS filtering, and thepulses become more visible. The optimal h value may vary for different input videos,since the distances from the lighting source to the face and the background may changeand the reflectivity of subjects’ skin also varies.
Motion elimination
In the third step of the proposed method framework, we try to reduce the noises causedby non-rigid facial movements such like talking or facial expressions, which may occurnow and then in HCI scenarios. The tracking process in the first step cannot solve theinterference of non-rigid movements within the ROI region which may cause suddenshape changes or shadowing that lead to dramatic fluctuations in the gIR signal. Onesample of such case is shown as the top curve in Figure 17. The face is neutral in phase1; and the subject smiles in phase 2 which leads to quick and dramatic fluctuations of thesignal; then the face reaches to a comparatively stable state in phase 3. Noisy segmentssuch as in phase 2 will end up as big sharp peaks even after all the filtering process andcontaminate the final reconstructed heart beat signal.
For the purpose of estimating average HR of a time span (e.g., 30 seconds), it isreasonable to eliminate noisy sections like in phase 2, and use the rest sections to achievemore reliable HR estimation. We found it very difficult to reconstruct the signal sectionsthat were contaminated by sudden non-rigid movements, so we took one step back andpropose to eliminate the short noisy sections for the current framework. We dividethe gIR into m segments of the same length gIR = [s1,s2, . . . ,sm], each segment s is asignal of length n
m . The standard deviation (SD) of each segment (see the middle part of
67
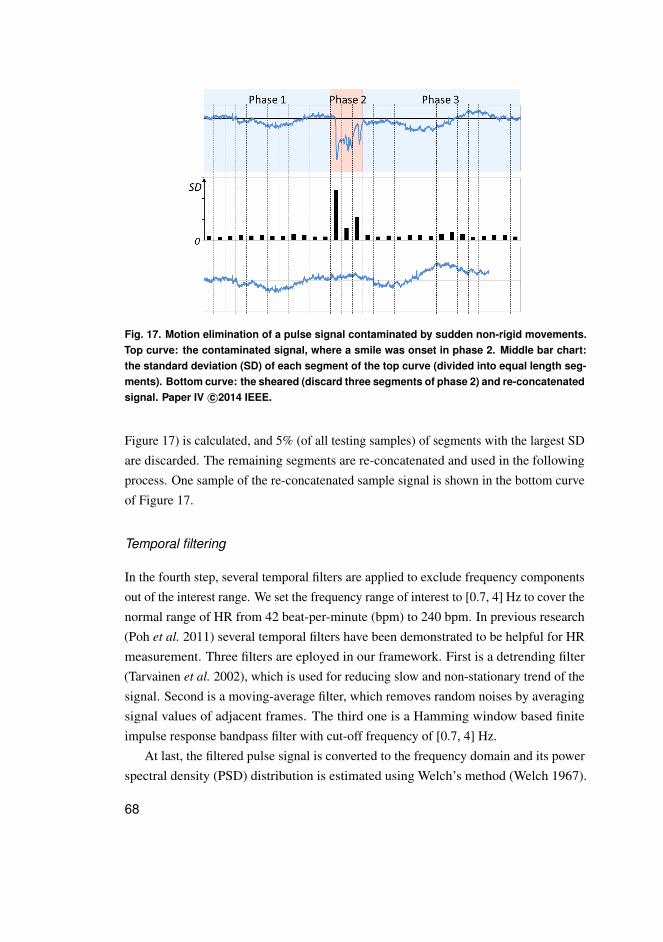
Fig. 17. Motion elimination of a pulse signal contaminated by sudden non-rigid movements.Top curve: the contaminated signal, where a smile was onset in phase 2. Middle bar chart:the standard deviation (SD) of each segment of the top curve (divided into equal length seg-ments). Bottom curve: the sheared (discard three segments of phase 2) and re-concatenatedsignal. Paper IV c©2014 IEEE.
Figure 17) is calculated, and 5% (of all testing samples) of segments with the largest SDare discarded. The remaining segments are re-concatenated and used in the followingprocess. One sample of the re-concatenated sample signal is shown in the bottom curveof Figure 17.
Temporal filtering
In the fourth step, several temporal filters are applied to exclude frequency componentsout of the interest range. We set the frequency range of interest to [0.7, 4] Hz to cover thenormal range of HR from 42 beat-per-minute (bpm) to 240 bpm. In previous research(Poh et al. 2011) several temporal filters have been demonstrated to be helpful for HRmeasurement. Three filters are eployed in our framework. First is a detrending filter(Tarvainen et al. 2002), which is used for reducing slow and non-stationary trend of thesignal. Second is a moving-average filter, which removes random noises by averagingsignal values of adjacent frames. The third one is a Hamming window based finiteimpulse response bandpass filter with cut-off frequency of [0.7, 4] Hz.
At last, the filtered pulse signal is converted to the frequency domain and its powerspectral density (PSD) distribution is estimated using Welch’s method (Welch 1967).
68
The frequency corresponds to the peak power response within range of [0.7, 4] Hz isselected as the HR frequency fHR. The average HR measured from the input video iscomputed as HRvideo = 60 fHR bpm. This part of process is shown at top-right region ofFigure 14.
3.3.2 Experimental results
We carried out experiments on three different datasets to evaluate our proposed methodand compare with other methods. The first dataset VideoHR is an easy level datasetcontaining videos recorded under well controlled conditions. The second datasetMAHNOB-HCI is more challenging which contains videos recorded under realistic HCIscenarios. Our hypothesis is that all methods will perform well on the easy VideoHRdataset; while for the challenging MAHNOB data which involves more interferencefactors our proposed method will outperform other previous methods. At last we testedour proposed method for monitoring HR while a user is playing video games.
Experiment 1: VideoHR dataset
In this experiment we collected a simple level dataset ‘VideoHR’ under controlledcondition. We re-implemented four previously proposed methods and tested themtogether with our method on the VideoHR dataset. The purposes of this experiment are:1) to demonstrate that we correctly re-implemented other four methods; and 2) to provethe first half of our hypothesis that all methods (four others and ours) could performwell on well-controlled video data.
VideoHR Dataset: We used the built-in frontal iSight camera of an IPAD to recordvideos in a lab with two fluorescent lamps as the illumination sources. All videos wererecorded in 24-bit RGB color format at 30 frames per second (fps) with resolution of640×480 and saved in MOV format. A Polar S810 HR monitor system (Gamelin et al.
2006) was used to record the ground truth HR. Ten subjects (two females and eightmales) aged from 24 to 38 years were enrolled. During the recording, subjects wereasked to sit still on a chair and try to avoid any movement. The IPAD was fixed on atripod at about 35 cm from the subject’s face. Each subject was recorded for about40 seconds, and 30 seconds (frame 301 to 1200) video of each subject is used for thetesting.
69
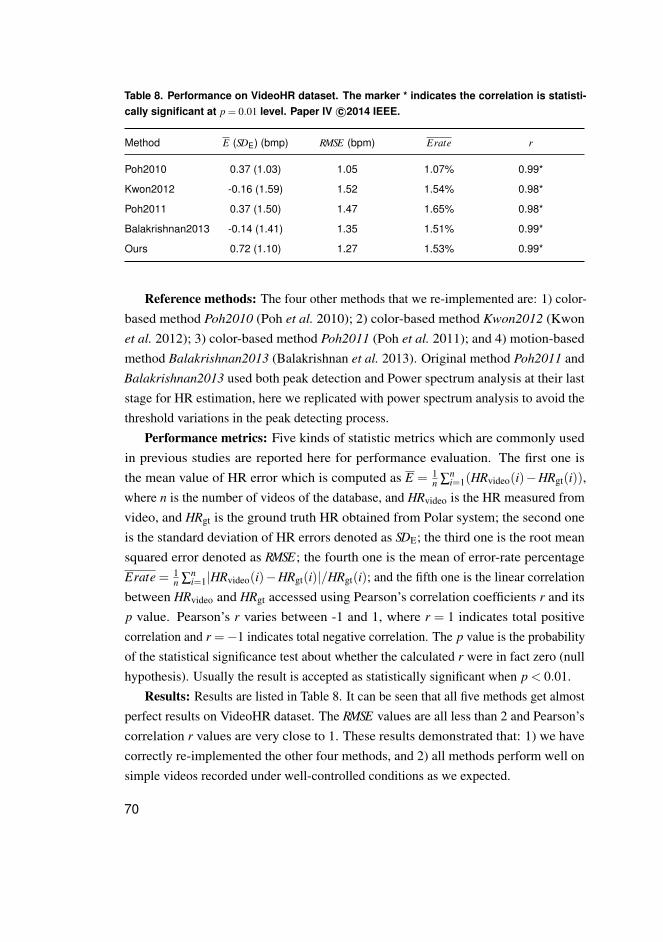
Table 8. Performance on VideoHR dataset. The marker * indicates the correlation is statisti-cally significant at p = 0.01 level. Paper IV c©2014 IEEE.
Method E (SDE) (bmp) RMSE (bpm) Erate r
Poh2010 0.37 (1.03) 1.05 1.07% 0.99*
Kwon2012 -0.16 (1.59) 1.52 1.54% 0.98*
Poh2011 0.37 (1.50) 1.47 1.65% 0.98*
Balakrishnan2013 -0.14 (1.41) 1.35 1.51% 0.99*
Ours 0.72 (1.10) 1.27 1.53% 0.99*
Reference methods: The four other methods that we re-implemented are: 1) color-based method Poh2010 (Poh et al. 2010); 2) color-based method Kwon2012 (Kwonet al. 2012); 3) color-based method Poh2011 (Poh et al. 2011); and 4) motion-basedmethod Balakrishnan2013 (Balakrishnan et al. 2013). Original method Poh2011 andBalakrishnan2013 used both peak detection and Power spectrum analysis at their laststage for HR estimation, here we replicated with power spectrum analysis to avoid thethreshold variations in the peak detecting process.
Performance metrics: Five kinds of statistic metrics which are commonly usedin previous studies are reported here for performance evaluation. The first one isthe mean value of HR error which is computed as E = 1
n ∑ni=1(HRvideo(i)−HRgt(i)),
where n is the number of videos of the database, and HRvideo is the HR measured fromvideo, and HRgt is the ground truth HR obtained from Polar system; the second oneis the standard deviation of HR errors denoted as SDE; the third one is the root meansquared error denoted as RMSE; the fourth one is the mean of error-rate percentageErate = 1
n ∑ni=1|HRvideo(i)−HRgt(i)|/HRgt(i); and the fifth one is the linear correlation
between HRvideo and HRgt accessed using Pearson’s correlation coefficients r and itsp value. Pearson’s r varies between -1 and 1, where r = 1 indicates total positivecorrelation and r =−1 indicates total negative correlation. The p value is the probabilityof the statistical significance test about whether the calculated r were in fact zero (nullhypothesis). Usually the result is accepted as statistically significant when p < 0.01.
Results: Results are listed in Table 8. It can be seen that all five methods get almostperfect results on VideoHR dataset. The RMSE values are all less than 2 and Pearson’scorrelation r values are very close to 1. These results demonstrated that: 1) we havecorrectly re-implemented the other four methods, and 2) all methods perform well onsimple videos recorded under well-controlled conditions as we expected.
70
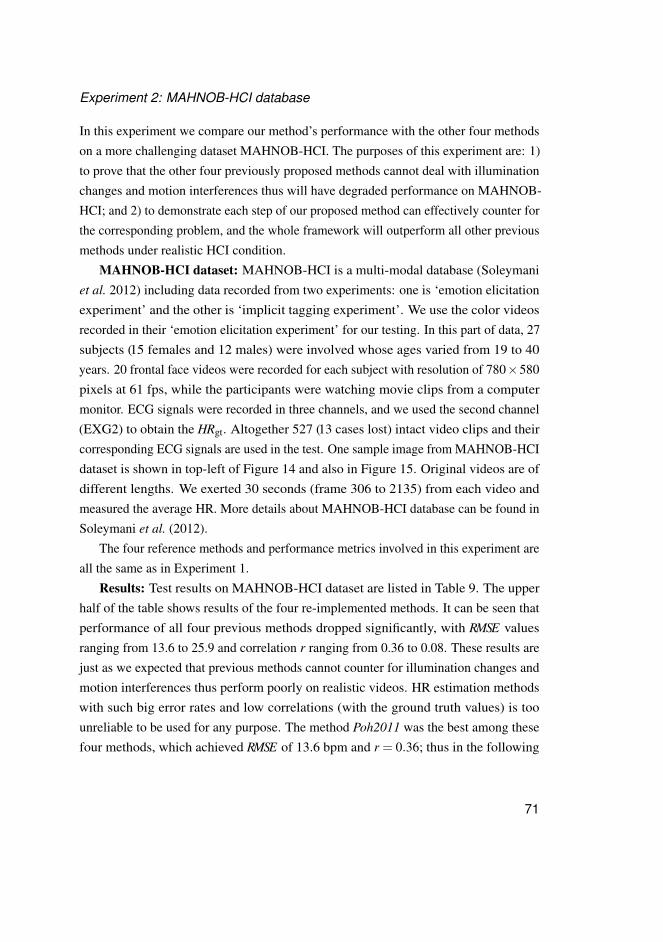
Experiment 2: MAHNOB-HCI database
In this experiment we compare our method’s performance with the other four methodson a more challenging dataset MAHNOB-HCI. The purposes of this experiment are: 1)to prove that the other four previously proposed methods cannot deal with illuminationchanges and motion interferences thus will have degraded performance on MAHNOB-HCI; and 2) to demonstrate each step of our proposed method can effectively counter forthe corresponding problem, and the whole framework will outperform all other previousmethods under realistic HCI condition.
MAHNOB-HCI dataset: MAHNOB-HCI is a multi-modal database (Soleymaniet al. 2012) including data recorded from two experiments: one is ‘emotion elicitationexperiment’ and the other is ‘implicit tagging experiment’. We use the color videosrecorded in their ‘emotion elicitation experiment’ for our testing. In this part of data, 27subjects (15 females and 12 males) were involved whose ages varied from 19 to 40years. 20 frontal face videos were recorded for each subject with resolution of 780×580pixels at 61 fps, while the participants were watching movie clips from a computermonitor. ECG signals were recorded in three channels, and we used the second channel(EXG2) to obtain the HRgt. Altogether 527 (13 cases lost) intact video clips and theircorresponding ECG signals are used in the test. One sample image from MAHNOB-HCIdataset is shown in top-left of Figure 14 and also in Figure 15. Original videos are ofdifferent lengths. We exerted 30 seconds (frame 306 to 2135) from each video andmeasured the average HR. More details about MAHNOB-HCI database can be found inSoleymani et al. (2012).
The four reference methods and performance metrics involved in this experiment areall the same as in Experiment 1.
Results: Test results on MAHNOB-HCI dataset are listed in Table 9. The upperhalf of the table shows results of the four re-implemented methods. It can be seen thatperformance of all four previous methods dropped significantly, with RMSE valuesranging from 13.6 to 25.9 and correlation r ranging from 0.36 to 0.08. These results arejust as we expected that previous methods cannot counter for illumination changes andmotion interferences thus perform poorly on realistic videos. HR estimation methodswith such big error rates and low correlations (with the ground truth values) is toounreliable to be used for any purpose. The method Poh2011 was the best among thesefour methods, which achieved RMSE of 13.6 bpm and r = 0.36; thus in the following
71
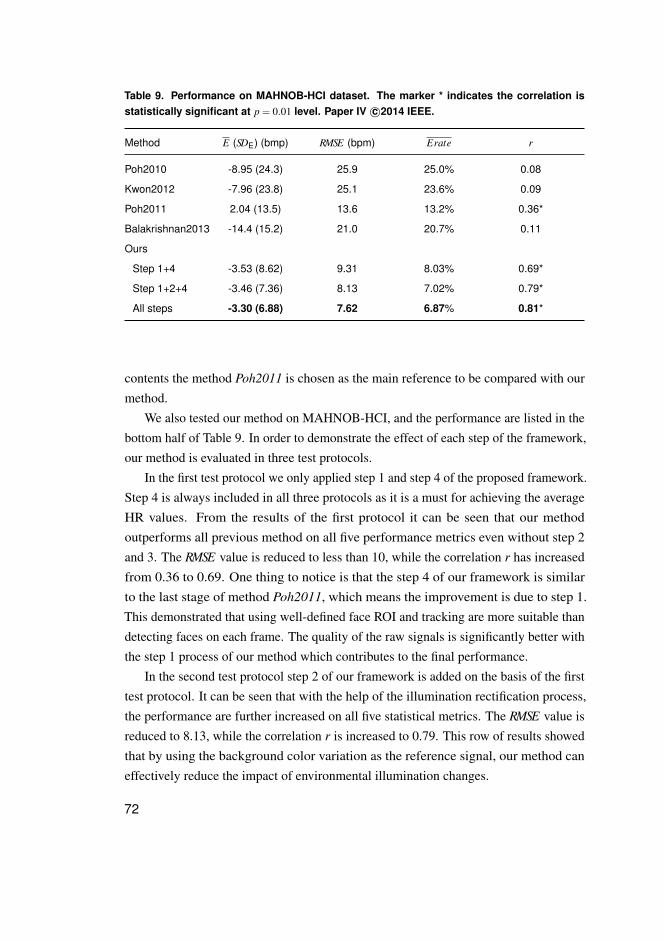
Table 9. Performance on MAHNOB-HCI dataset. The marker * indicates the correlation isstatistically significant at p = 0.01 level. Paper IV c©2014 IEEE.
Method E (SDE) (bmp) RMSE (bpm) Erate r
Poh2010 -8.95 (24.3) 25.9 25.0% 0.08
Kwon2012 -7.96 (23.8) 25.1 23.6% 0.09
Poh2011 2.04 (13.5) 13.6 13.2% 0.36*
Balakrishnan2013 -14.4 (15.2) 21.0 20.7% 0.11
Ours
Step 1+4 -3.53 (8.62) 9.31 8.03% 0.69*
Step 1+2+4 -3.46 (7.36) 8.13 7.02% 0.79*
All steps -3.30 (6.88) 7.62 6.87% 0.81*
contents the method Poh2011 is chosen as the main reference to be compared with ourmethod.
We also tested our method on MAHNOB-HCI, and the performance are listed in thebottom half of Table 9. In order to demonstrate the effect of each step of the framework,our method is evaluated in three test protocols.
In the first test protocol we only applied step 1 and step 4 of the proposed framework.Step 4 is always included in all three protocols as it is a must for achieving the averageHR values. From the results of the first protocol it can be seen that our methodoutperforms all previous method on all five performance metrics even without step 2and 3. The RMSE value is reduced to less than 10, while the correlation r has increasedfrom 0.36 to 0.69. One thing to notice is that the step 4 of our framework is similarto the last stage of method Poh2011, which means the improvement is due to step 1.This demonstrated that using well-defined face ROI and tracking are more suitable thandetecting faces on each frame. The quality of the raw signals is significantly better withthe step 1 process of our method which contributes to the final performance.
In the second test protocol step 2 of our framework is added on the basis of the firsttest protocol. It can be seen that with the help of the illumination rectification process,the performance are further increased on all five statistical metrics. The RMSE value isreduced to 8.13, while the correlation r is increased to 0.79. This row of results showedthat by using the background color variation as the reference signal, our method caneffectively reduce the impact of environmental illumination changes.
72
Fig. 18. The scatter plot comparing the HRvideo measured by our method with the groundtruth HRgt from ECG. Paper IV c©2014 IEEE.
In the third test protocol all steps of our framework are applied to evaluate thefinal performance of the whole framework. From Table 9 we can see that step 3 ofmotion elimination further improves the accuracy, and our full framework achievesRMSE of 7.62 and correlation r = 0.81 on the MAHNOB-HCI dataset, which is a bigimprovement comparing to other reference methods. The current process of step 3worked well on MAHNOB-HCI videos, which mostly contain sparse abrupt facialmovements, and the results have demonstrated so. The motion elimination approachmight remove too much data if the video contains continues non-rigid movements (e.g.,talking). For the more challenging cases it would be better to find ways to reconstructthe contaminated signals, which will be the explored in our future work.
To better illustrate how well our method works, we plot each pair of HRtextvideo andHRtextgt values (of each video) as a scatter plot in Figure 18. From Figure 18 we can seethat, on a wide range of HR from 46 bpm to 103 bpm good HR estimations are made inmost cases. There are some outlier points falling far from the correlation line whichindicate poor estimations. Some poorly estimated cases are caused by big angle (over 60degrees) head rotations, which caused errors in the ROI tracking process. For applicationscenarios like detecting the vital signs of an emergency situation, HR measurement witherror less than 5 bpm is likely to be acceptable (Poh et al. 2010). In order to checkhow many cases are well estimated, we also compare the distributions of HRerror of ourmethod with Poh2011 method. As shown in Figure 19, 403 cases (76.5%) are measuredwith errors of less than 5 bpm by our framework, while for method Poh2011 the numberis only 296 (56.2%).
73
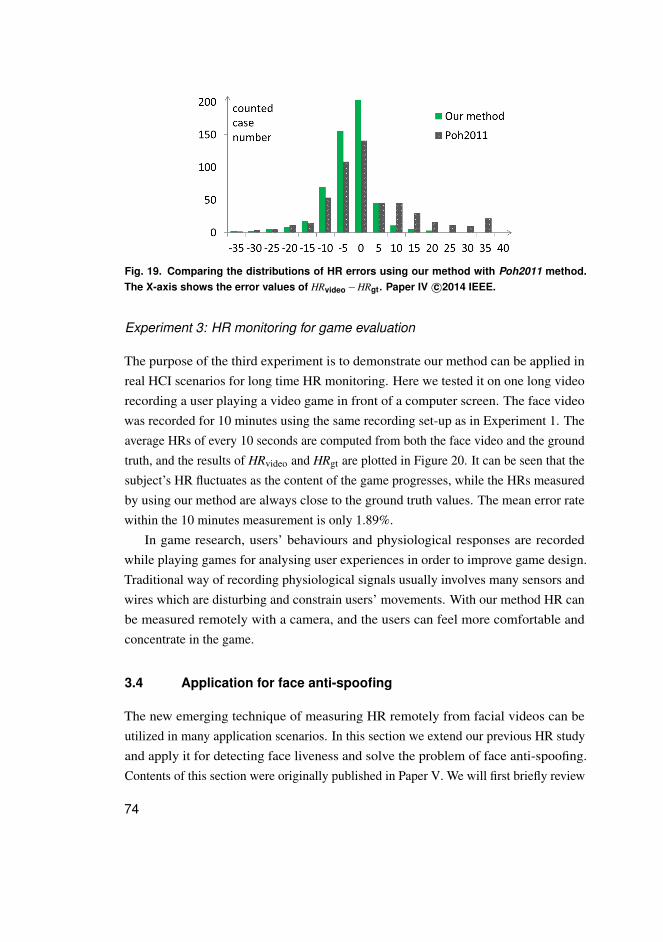
Fig. 19. Comparing the distributions of HR errors using our method with Poh2011 method.The X-axis shows the error values of HRvideo−HRgt. Paper IV c©2014 IEEE.
Experiment 3: HR monitoring for game evaluation
The purpose of the third experiment is to demonstrate our method can be applied inreal HCI scenarios for long time HR monitoring. Here we tested it on one long videorecording a user playing a video game in front of a computer screen. The face videowas recorded for 10 minutes using the same recording set-up as in Experiment 1. Theaverage HRs of every 10 seconds are computed from both the face video and the groundtruth, and the results of HRvideo and HRgt are plotted in Figure 20. It can be seen that thesubject’s HR fluctuates as the content of the game progresses, while the HRs measuredby using our method are always close to the ground truth values. The mean error ratewithin the 10 minutes measurement is only 1.89%.
In game research, users’ behaviours and physiological responses are recordedwhile playing games for analysing user experiences in order to improve game design.Traditional way of recording physiological signals usually involves many sensors andwires which are disturbing and constrain users’ movements. With our method HR canbe measured remotely with a camera, and the users can feel more comfortable andconcentrate in the game.
3.4 Application for face anti-spoofing
The new emerging technique of measuring HR remotely from facial videos can beutilized in many application scenarios. In this section we extend our previous HR studyand apply it for detecting face liveness and solve the problem of face anti-spoofing.Contents of this section were originally published in Paper V. We will first briefly review
74
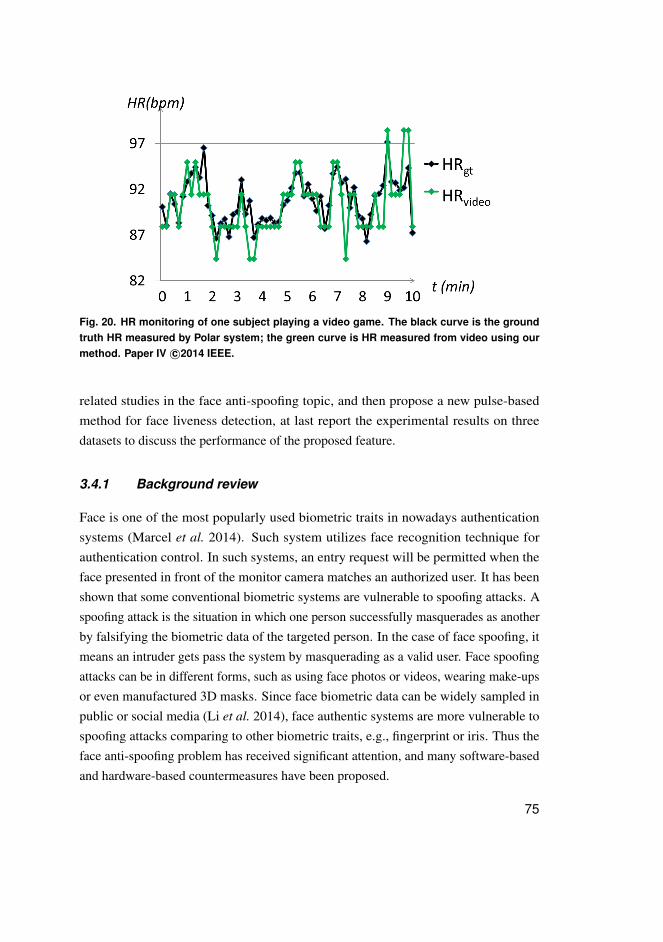
Fig. 20. HR monitoring of one subject playing a video game. The black curve is the groundtruth HR measured by Polar system; the green curve is HR measured from video using ourmethod. Paper IV c©2014 IEEE.
related studies in the face anti-spoofing topic, and then propose a new pulse-basedmethod for face liveness detection, at last report the experimental results on threedatasets to discuss the performance of the proposed feature.
3.4.1 Background review
Face is one of the most popularly used biometric traits in nowadays authenticationsystems (Marcel et al. 2014). Such system utilizes face recognition technique forauthentication control. In such systems, an entry request will be permitted when theface presented in front of the monitor camera matches an authorized user. It has beenshown that some conventional biometric systems are vulnerable to spoofing attacks. Aspoofing attack is the situation in which one person successfully masquerades as anotherby falsifying the biometric data of the targeted person. In the case of face spoofing, itmeans an intruder gets pass the system by masquerading as a valid user. Face spoofingattacks can be in different forms, such as using face photos or videos, wearing make-upsor even manufactured 3D masks. Since face biometric data can be widely sampled inpublic or social media (Li et al. 2014), face authentic systems are more vulnerable tospoofing attacks comparing to other biometric traits, e.g., fingerprint or iris. Thus theface anti-spoofing problem has received significant attention, and many software-basedand hardware-based countermeasures have been proposed.
75
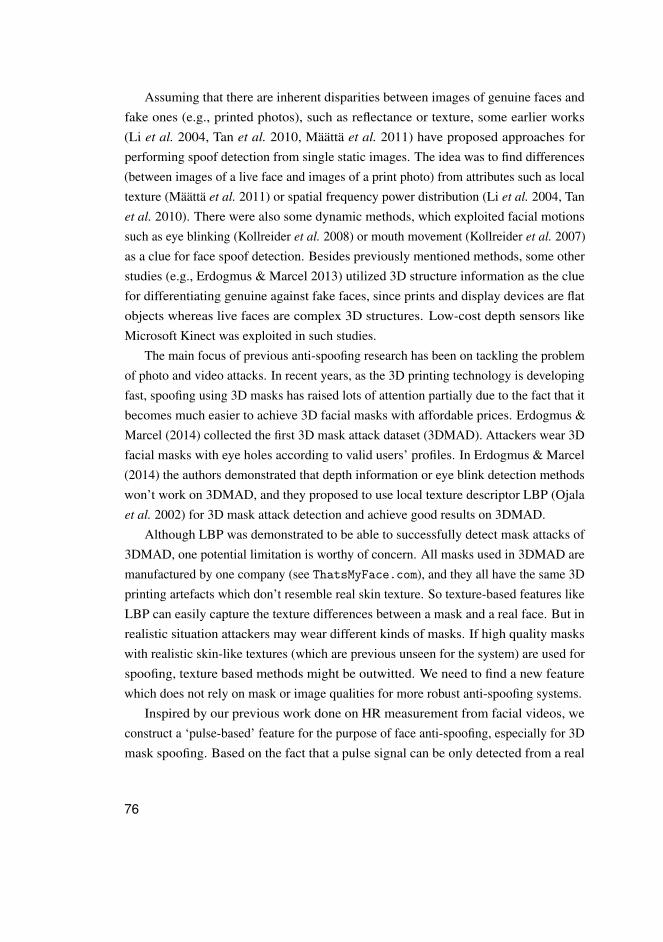
Assuming that there are inherent disparities between images of genuine faces andfake ones (e.g., printed photos), such as reflectance or texture, some earlier works(Li et al. 2004, Tan et al. 2010, Määttä et al. 2011) have proposed approaches forperforming spoof detection from single static images. The idea was to find differences(between images of a live face and images of a print photo) from attributes such as localtexture (Määttä et al. 2011) or spatial frequency power distribution (Li et al. 2004, Tanet al. 2010). There were also some dynamic methods, which exploited facial motionssuch as eye blinking (Kollreider et al. 2008) or mouth movement (Kollreider et al. 2007)as a clue for face spoof detection. Besides previously mentioned methods, some otherstudies (e.g., Erdogmus & Marcel 2013) utilized 3D structure information as the cluefor differentiating genuine against fake faces, since prints and display devices are flatobjects whereas live faces are complex 3D structures. Low-cost depth sensors likeMicrosoft Kinect was exploited in such studies.
The main focus of previous anti-spoofing research has been on tackling the problemof photo and video attacks. In recent years, as the 3D printing technology is developingfast, spoofing using 3D masks has raised lots of attention partially due to the fact that itbecomes much easier to achieve 3D facial masks with affordable prices. Erdogmus &Marcel (2014) collected the first 3D mask attack dataset (3DMAD). Attackers wear 3Dfacial masks with eye holes according to valid users’ profiles. In Erdogmus & Marcel(2014) the authors demonstrated that depth information or eye blink detection methodswon’t work on 3DMAD, and they proposed to use local texture descriptor LBP (Ojalaet al. 2002) for 3D mask attack detection and achieve good results on 3DMAD.
Although LBP was demonstrated to be able to successfully detect mask attacks of3DMAD, one potential limitation is worthy of concern. All masks used in 3DMAD aremanufactured by one company (see ThatsMyFace.com), and they all have the same 3Dprinting artefacts which don’t resemble real skin texture. So texture-based features likeLBP can easily capture the texture differences between a mask and a real face. But inrealistic situation attackers may wear different kinds of masks. If high quality maskswith realistic skin-like textures (which are previous unseen for the system) are used forspoofing, texture based methods might be outwitted. We need to find a new featurewhich does not rely on mask or image qualities for more robust anti-spoofing systems.
Inspired by our previous work done on HR measurement from facial videos, weconstruct a ‘pulse-based’ feature for the purpose of face anti-spoofing, especially for 3Dmask spoofing. Based on the fact that a pulse signal can be only detected from a real
76
Fig. 21. Framework of the proposed pulse-based method for face anti-spoofing. Note thatin part c only one PSD of green channel is shown for the illustration purpose, the other twoPSD curves of red and blue channels are computed the same way to produce the featurevector. Paper V c©2016 IEEE.
living face, but not from any mask material (or print photo), we expect the pulse-basedfeature could be a generalized countermeasure to detect mask and print attacks.
3.4.2 A Pulse-based method for face anti-spoofing
In this subsection we explain how we built the pulse-base feature for the purpose of faceliveness detection. The whole framework of the proposed pulse-based face anti-spoofingframework is shown in Figure 21.
The first few steps of the framework (until achieving the power spectrum distribution,part c of Figure 21) are the same as described in Section 3.3.1. First we detect the faceon the first frame of the input video, and define an ROI and track through the videoto achieve raw R, G, B signals, as shown in Figure 21 (b). The details of this part ofprocess are as described in the step 1 of Section 3.3.1. After that, several temporal filtersare applied on the raw R, G and B signals to remove irrelevant noise frequencies, andthe signals are transferred into frequency domain to compute their PSD curves. Thedetails of this part of process are as described in the step 4 of Section 3.3.1. Step 2(illumination rectification) and Step 3 (motion elimination) of the HR measurementframework are skipped here, as we found the videos in the current spoofing datasetsdon’t involve significant illumination changes or motions. These omitted steps can beeasily added back if there is more challenging video data in future.
The key element of the anti-spoofing framework is to construct an effective featurevector, which is able to discriminate fake faces from genuine live faces. Let’s first have alook of the PSD curves of a real access video and of a mask attack video. In Figure 22,the left curve shows a typical PSD pattern of a real access video. Since the tracked ROIcovers live facial skin area, there will be a dominant peak (maybe also with its secondand third harmonic peaks) in the PSD curve corresponding to the pulse frequency. Onthe other side, the right curve in Figure 22 shows a typical PSD pattern of a mask attack
77
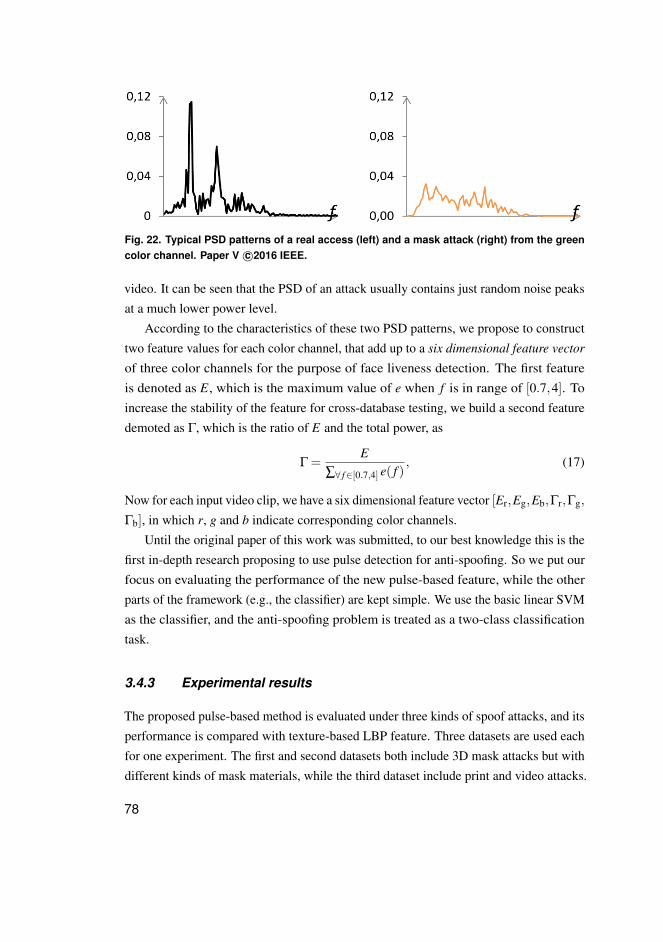
Fig. 22. Typical PSD patterns of a real access (left) and a mask attack (right) from the greencolor channel. Paper V c©2016 IEEE.
video. It can be seen that the PSD of an attack usually contains just random noise peaksat a much lower power level.
According to the characteristics of these two PSD patterns, we propose to constructtwo feature values for each color channel, that add up to a six dimensional feature vector
of three color channels for the purpose of face liveness detection. The first featureis denoted as E, which is the maximum value of e when f is in range of [0.7,4]. Toincrease the stability of the feature for cross-database testing, we build a second featuredemoted as Γ, which is the ratio of E and the total power, as
Γ =E
∑∀ f∈[0.7,4] e( f ), (17)
Now for each input video clip, we have a six dimensional feature vector [Er,Eg,Eb,Γr,Γg,
Γb], in which r, g and b indicate corresponding color channels.Until the original paper of this work was submitted, to our best knowledge this is the
first in-depth research proposing to use pulse detection for anti-spoofing. So we put ourfocus on evaluating the performance of the new pulse-based feature, while the otherparts of the framework (e.g., the classifier) are kept simple. We use the basic linear SVMas the classifier, and the anti-spoofing problem is treated as a two-class classificationtask.
3.4.3 Experimental results
The proposed pulse-based method is evaluated under three kinds of spoof attacks, and itsperformance is compared with texture-based LBP feature. Three datasets are used eachfor one experiment. The first and second datasets both include 3D mask attacks but withdifferent kinds of mask materials, while the third dataset include print and video attacks.
78
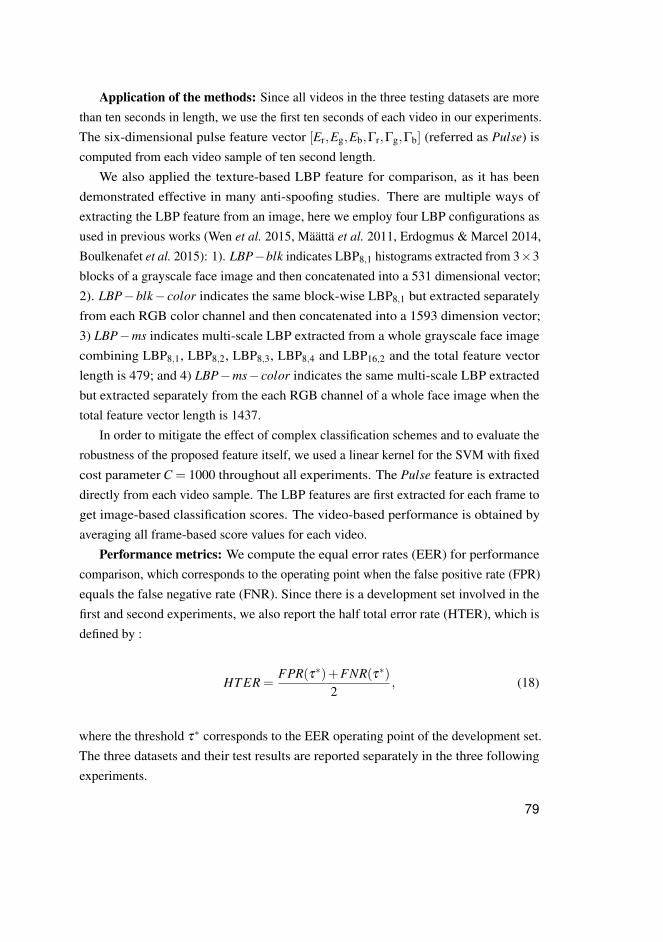
Application of the methods: Since all videos in the three testing datasets are morethan ten seconds in length, we use the first ten seconds of each video in our experiments.The six-dimensional pulse feature vector [Er,Eg,Eb,Γr,Γg,Γb] (referred as Pulse) iscomputed from each video sample of ten second length.
We also applied the texture-based LBP feature for comparison, as it has beendemonstrated effective in many anti-spoofing studies. There are multiple ways ofextracting the LBP feature from an image, here we employ four LBP configurations asused in previous works (Wen et al. 2015, Määttä et al. 2011, Erdogmus & Marcel 2014,Boulkenafet et al. 2015): 1). LBP−blk indicates LBP8,1 histograms extracted from 3×3blocks of a grayscale face image and then concatenated into a 531 dimensional vector;2). LBP−blk− color indicates the same block-wise LBP8,1 but extracted separatelyfrom each RGB color channel and then concatenated into a 1593 dimension vector;3) LBP−ms indicates multi-scale LBP extracted from a whole grayscale face imagecombining LBP8,1, LBP8,2, LBP8,3, LBP8,4 and LBP16,2 and the total feature vectorlength is 479; and 4) LBP−ms− color indicates the same multi-scale LBP extractedbut extracted separately from the each RGB channel of a whole face image when thetotal feature vector length is 1437.
In order to mitigate the effect of complex classification schemes and to evaluate therobustness of the proposed feature itself, we used a linear kernel for the SVM with fixedcost parameter C = 1000 throughout all experiments. The Pulse feature is extracteddirectly from each video sample. The LBP features are first extracted for each frame toget image-based classification scores. The video-based performance is obtained byaveraging all frame-based score values for each video.
Performance metrics: We compute the equal error rates (EER) for performancecomparison, which corresponds to the operating point when the false positive rate (FPR)equals the false negative rate (FNR). Since there is a development set involved in thefirst and second experiments, we also report the half total error rate (HTER), which isdefined by :
HT ER =FPR(τ∗)+FNR(τ∗)
2, (18)
where the threshold τ∗ corresponds to the EER operating point of the development set.The three datasets and their test results are reported separately in the three followingexperiments.
79
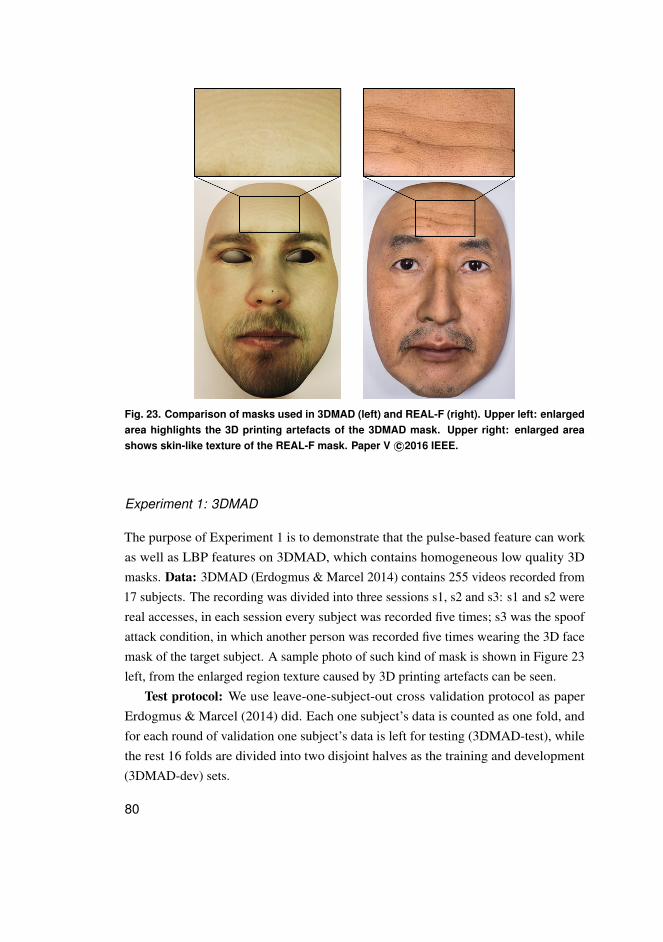
Fig. 23. Comparison of masks used in 3DMAD (left) and REAL-F (right). Upper left: enlargedarea highlights the 3D printing artefacts of the 3DMAD mask. Upper right: enlarged areashows skin-like texture of the REAL-F mask. Paper V c©2016 IEEE.
Experiment 1: 3DMAD
The purpose of Experiment 1 is to demonstrate that the pulse-based feature can workas well as LBP features on 3DMAD, which contains homogeneous low quality 3Dmasks. Data: 3DMAD (Erdogmus & Marcel 2014) contains 255 videos recorded from17 subjects. The recording was divided into three sessions s1, s2 and s3: s1 and s2 werereal accesses, in each session every subject was recorded five times; s3 was the spoofattack condition, in which another person was recorded five times wearing the 3D facemask of the target subject. A sample photo of such kind of mask is shown in Figure 23left, from the enlarged region texture caused by 3D printing artefacts can be seen.
Test protocol: We use leave-one-subject-out cross validation protocol as paperErdogmus & Marcel (2014) did. Each one subject’s data is counted as one fold, andfor each round of validation one subject’s data is left for testing (3DMAD-test), whilethe rest 16 folds are divided into two disjoint halves as the training and development(3DMAD-dev) sets.
80

Table 10. Results on 3DMAD dataset. Paper V c©2016 IEEE.
Method 3DMAD-dev 3DMAD-test
EER HTER EER
Pulse 2.31% 7.94% 4.71%LBP-blk 0% 0% 0%LBP-blk-color 0% 0% 0%LBP-ms 0% 0% 0%LBP-ms-color 0% 0% 0%
Results: Results are listed in Table 10. It can be seen that the Pulse feature workedwell on 3DMAD with an HTER of less than 8% on the test set. Thus, the pulse detectionmethod is effective in differentiating 3D mask attacks from real access attempts eventhough only a feature of only six dimensions and a linear classifier are utilized. On theother hand, the four LBP configurations all achieved perfect results on the 3DMAD.However, this can be explained by the obvious 3D printing artefacts that the LBPdescriptions can easily capture because both training and testing were performed onvideos recorded in the same acquisition conditions using the same kind of mask. Ifmasks made from different materials were used for attacking, we expect the performanceof the texture-based feature will drop.
Experiment 2: High quality REAL-F Mask dataset
The purpose of Experiment 2 is to demonstrate that the pulse-based method is able todetect also unseen type of mask attack, while the texture-based LBP features fail togeneralize beyond the training and development data.
Data: As manufacturing techniques improve, it becomes easier to achieve highquality 3D masks. At the time when this work was conducted there was no other 3D maskdatabase available. So we bought two high quality 3D masks (http://real-f.jp)and used them to collect a small dataset called REAL-F dataset. One sample image ofthe REAL-F mask is shown in Figure 23 right, with a forehead area enlarged to highlightits skin-like texture. The REAL-F dataset contains 24 videos each lasts ten seconds,12 videos are real accesses recorded from two subjects, and the other 12 videos areattack videos recorded using the two REAL-F masks. All videos were recorded using aLogitech C920 webcam at 30fps with resolution of 1280×760.
81
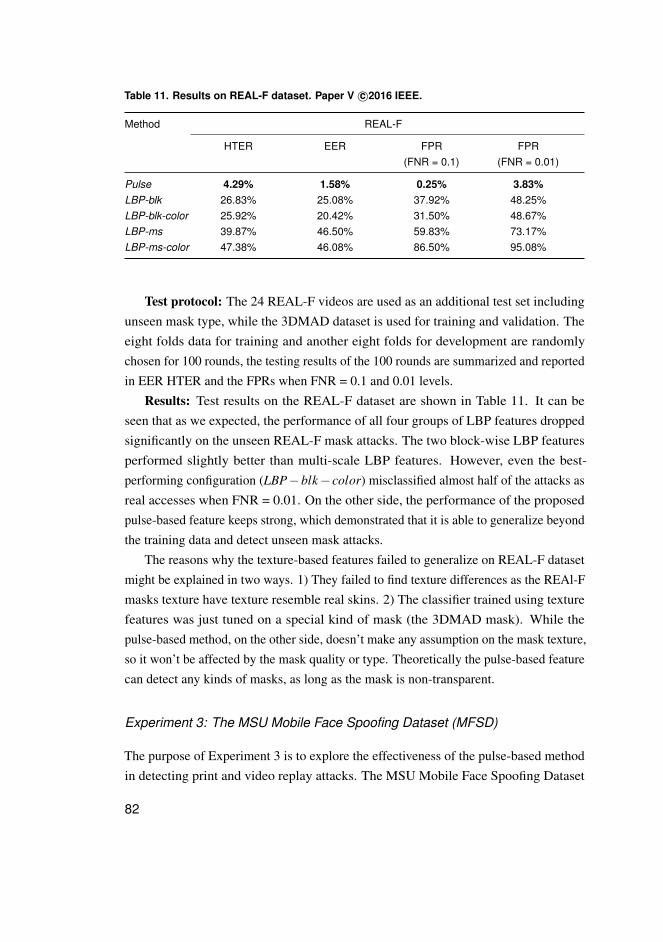
Table 11. Results on REAL-F dataset. Paper V c©2016 IEEE.
Method REAL-F
HTER EER FPR(FNR = 0.1)
FPR(FNR = 0.01)
Pulse 4.29% 1.58% 0.25% 3.83%LBP-blk 26.83% 25.08% 37.92% 48.25%LBP-blk-color 25.92% 20.42% 31.50% 48.67%LBP-ms 39.87% 46.50% 59.83% 73.17%LBP-ms-color 47.38% 46.08% 86.50% 95.08%
Test protocol: The 24 REAL-F videos are used as an additional test set includingunseen mask type, while the 3DMAD dataset is used for training and validation. Theeight folds data for training and another eight folds for development are randomlychosen for 100 rounds, the testing results of the 100 rounds are summarized and reportedin EER HTER and the FPRs when FNR = 0.1 and 0.01 levels.
Results: Test results on the REAL-F dataset are shown in Table 11. It can beseen that as we expected, the performance of all four groups of LBP features droppedsignificantly on the unseen REAL-F mask attacks. The two block-wise LBP featuresperformed slightly better than multi-scale LBP features. However, even the best-performing configuration (LBP−blk− color) misclassified almost half of the attacks asreal accesses when FNR = 0.01. On the other side, the performance of the proposedpulse-based feature keeps strong, which demonstrated that it is able to generalize beyondthe training data and detect unseen mask attacks.
The reasons why the texture-based features failed to generalize on REAL-F datasetmight be explained in two ways. 1) They failed to find texture differences as the REAl-Fmasks texture have texture resemble real skins. 2) The classifier trained using texturefeatures was just tuned on a special kind of mask (the 3DMAD mask). While thepulse-based method, on the other side, doesn’t make any assumption on the mask texture,so it won’t be affected by the mask quality or type. Theoretically the pulse-based featurecan detect any kinds of masks, as long as the mask is non-transparent.
Experiment 3: The MSU Mobile Face Spoofing Dataset (MFSD)
The purpose of Experiment 3 is to explore the effectiveness of the pulse-based methodin detecting print and video replay attacks. The MSU Mobile Face Spoofing Dataset
82
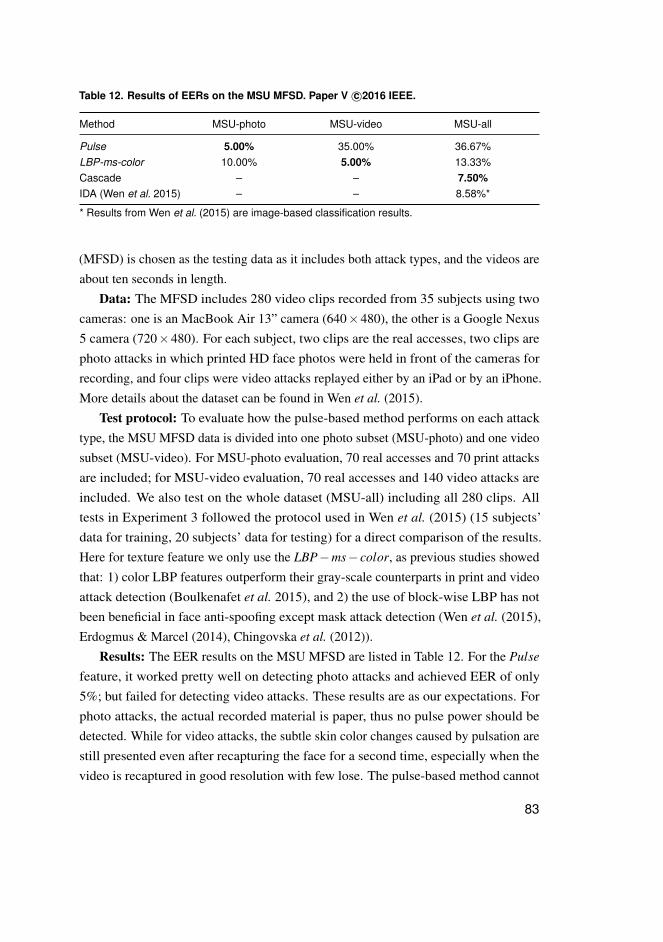
Table 12. Results of EERs on the MSU MFSD. Paper V c©2016 IEEE.
Method MSU-photo MSU-video MSU-all
Pulse 5.00% 35.00% 36.67%LBP-ms-color 10.00% 5.00% 13.33%Cascade – – 7.50%IDA (Wen et al. 2015) – – 8.58%*
* Results from Wen et al. (2015) are image-based classification results.
(MFSD) is chosen as the testing data as it includes both attack types, and the videos areabout ten seconds in length.
Data: The MFSD includes 280 video clips recorded from 35 subjects using twocameras: one is an MacBook Air 13” camera (640×480), the other is a Google Nexus5 camera (720×480). For each subject, two clips are the real accesses, two clips arephoto attacks in which printed HD face photos were held in front of the cameras forrecording, and four clips were video attacks replayed either by an iPad or by an iPhone.More details about the dataset can be found in Wen et al. (2015).
Test protocol: To evaluate how the pulse-based method performs on each attacktype, the MSU MFSD data is divided into one photo subset (MSU-photo) and one videosubset (MSU-video). For MSU-photo evaluation, 70 real accesses and 70 print attacksare included; for MSU-video evaluation, 70 real accesses and 140 video attacks areincluded. We also test on the whole dataset (MSU-all) including all 280 clips. Alltests in Experiment 3 followed the protocol used in Wen et al. (2015) (15 subjects’data for training, 20 subjects’ data for testing) for a direct comparison of the results.Here for texture feature we only use the LBP−ms− color, as previous studies showedthat: 1) color LBP features outperform their gray-scale counterparts in print and videoattack detection (Boulkenafet et al. 2015), and 2) the use of block-wise LBP has notbeen beneficial in face anti-spoofing except mask attack detection (Wen et al. (2015),Erdogmus & Marcel (2014), Chingovska et al. (2012)).
Results: The EER results on the MSU MFSD are listed in Table 12. For the Pulse
feature, it worked pretty well on detecting photo attacks and achieved EER of only5%; but failed for detecting video attacks. These results are as our expectations. Forphoto attacks, the actual recorded material is paper, thus no pulse power should bedetected. While for video attacks, the subtle skin color changes caused by pulsation arestill presented even after recapturing the face for a second time, especially when thevideo is recaptured in good resolution with few lose. The pulse-based method cannot
83
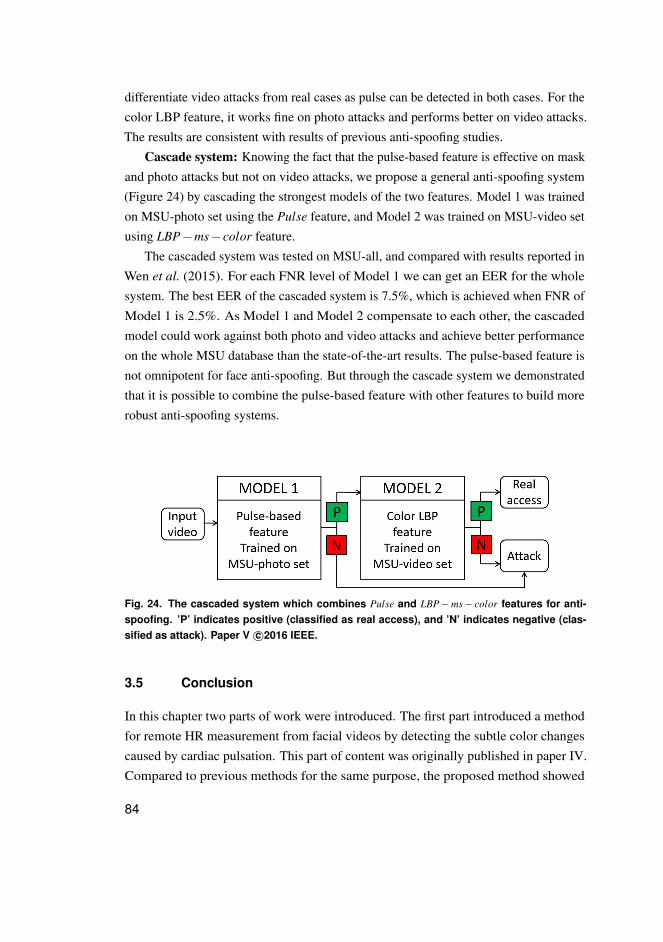
differentiate video attacks from real cases as pulse can be detected in both cases. For thecolor LBP feature, it works fine on photo attacks and performs better on video attacks.The results are consistent with results of previous anti-spoofing studies.
Cascade system: Knowing the fact that the pulse-based feature is effective on maskand photo attacks but not on video attacks, we propose a general anti-spoofing system(Figure 24) by cascading the strongest models of the two features. Model 1 was trainedon MSU-photo set using the Pulse feature, and Model 2 was trained on MSU-video setusing LBP−ms− color feature.
The cascaded system was tested on MSU-all, and compared with results reported inWen et al. (2015). For each FNR level of Model 1 we can get an EER for the wholesystem. The best EER of the cascaded system is 7.5%, which is achieved when FNR ofModel 1 is 2.5%. As Model 1 and Model 2 compensate to each other, the cascadedmodel could work against both photo and video attacks and achieve better performanceon the whole MSU database than the state-of-the-art results. The pulse-based feature isnot omnipotent for face anti-spoofing. But through the cascade system we demonstratedthat it is possible to combine the pulse-based feature with other features to build morerobust anti-spoofing systems.
Fig. 24. The cascaded system which combines Pulse and LBP−ms− color features for anti-spoofing. ’P’ indicates positive (classified as real access), and ’N’ indicates negative (clas-sified as attack). Paper V c©2016 IEEE.
3.5 Conclusion
In this chapter two parts of work were introduced. The first part introduced a methodfor remote HR measurement from facial videos by detecting the subtle color changescaused by cardiac pulsation. This part of content was originally published in paper IV.Compared to previous methods for the same purpose, the proposed method showed
84
advantage on facial videos containing illumination changes and head motions, as threespecially designed steps were added to counter these noises.
Our proposed method achieved an error rate of 7% on MAHNOB-HCI videos,which is much smaller comparing to the error rates of previous methods. There is stillbig space for improvement of this new topic, and new methods are emerging in last twoyears. Lam & Kuno (2015) and Tulyakov et al. (2016) both proposed methods achievedbetter performance on MAHNOB-HCI than ours; Haque et al. (2016) also tested theirmethod against more challenging condition with large head motions.
The second part of the chapter introduced a work of utilizing the HR measurementmethod for face liveness detection, which was originally published in paper V. The testresults showed that the pulse feature can be used to build a generalized face anti-spoofingsolution, which are more robust than traditional texture features against unseen typesof mask attacks. We also showed that the pulse feature can be combined with texturefeatures to build a cascade system for detecting multiple types of attacks.
Most previous computer vision studies (of visible light) focus on shapes, movements,or textures of the surface, while the HR studies seem to go deeper under the skin. Thepossibility to detect people’s physiological changes using only cameras might open thegate to new applications in future. HR analysis from face will be one main focus in myfuture work, including both the improvement of the method and the exploration of newapplications. More detailed plans are discussed in Section 4.
85

86
4 Summary
Human faces convey rich and important sources of information in people’s socialinteractions. Being able to achieve lots of information (e.g., identity, gender, age andexpression.) just by a glance of one face image, human beings are natural ‘face experts’,but there are special subtle facial information that cannot be perceived with naked eyes.One kind of such subtle facial information is the micro-expression, which is a fast andinvoluntary expression that occurs when people try to hide their true feelings. Anotherkind of such subtle information is the heart rate, which reveals itself as very subtle skincolor changes. This thesis presents works of using computer vision methodologies toanalyse the two kinds of subtle information from facial videos.
4.1 Contributions
The contributions of the thesis are from two major aspects, which each corresponds toone objective of my PhD study.
The first aspect of contribution is about automatic ME analysis. The ME can help toreveal people’s hidden feelings thus can be used as an important clue for lie detection.The phenomenon of ME has been studied by psychologists for several decades, but onlycame into the view for computer vision research until 2009 when it became popularthrough TV series. The first obstacle of conducting ME analysis research was the lackof spontaneous ME data. Some previous studies used posed ME clips, but spontaneousMEs are involuntary behaviors which are different from posed ones.
In 2011 we proposed to use an inhibited emotion inducing paradigm to build the firstspontaneous ME dataset, the SMIC, in paper I. We also proposed the first frameworkusing TIM interpolation together with LBP-TOP as the feature descriptor for spontaneousME recognition. There were only limited samples in the first version of SMIC, whichwas later expanded into the full version of SMIC including 164 spontaneous MEselicited from 16 participants. The SMIC database was shared online for research usage.The approach for inducing and annotating of the SMIC was explained in details in paperII in order to provide useful information for future ME data collection.
The SMIC database has drawn interests from other researchers. More ME databaseswere emerging and more methods were prosed for ME analysis since then. In our recentwork of paper III, both ME spotting and ME recognition problems were addressed.
87

An ME spotting method was proposed based on feature difference analysis, whichwas demonstrated to be effective on spotting spontaneous MEs from long videos.An advanced ME recognition framework was also proposed, which employs motionmagnification process to counter the subtleness of MEs. Many important factors(e.g., feature type, feature dimension, and interpolation length) of the framework werethoroughly explored in order to rationalize the ME recognition process for betterperformance. Results showed that the proposed ME recognition framework outperformsother state-of-the-art methods on both SMIC and CASMEII databases. Our work inpaper III was reported by MIT Technology Review soon after a preliminary version ofthe paper was put online, and it was also broadcast by several other media from UK,Canada and China later.
The second aspect of contribution of the thesis is about HR measurement fromfacial videos. The reason why my work turned to HR measurement was that I camecrossed a method which could measure HR from color facial videos, when I was tryingto combine physiological signals (e.g., the HR) together with appearance traits (e.g., theME) to build a multi-modal system for affective status analysis. The method turnedout to be not robust enough to be applied on my video data, as the clips contain facialmovements and illumination changes.
Efforts were devoted to build a more robust method, so that HR can be measuredfrom more challenging videos with facial movements. In paper IV a method frameworkwas proposed which involves three steps for countering the problem of rigid motions,illumination changes, and non-rigid motions accordingly. Compared with previouslyproposed HR measurement methods, the new framework showed its advantage of HRmeasurement under more challenging conditions such like during movie watching andvideo game playing.
The remote HR measurement method can be utilized in different application fields.Work in paper V of utilizing the HR measurement method for face liveness detectionis also presented in the thesis. Based to the fact that the pulse (HR) signal can onlybe detected from live facial skins but not from any mask materials or printed facephotos, a pulse-based feature was constructed from the PSD curve of the facial videos.Experimental results demonstrated that the pulse-based method can successfully detect3D mask attacks. While texture-based features fail to generalize beyond training data,the pulse-based feature does not depend on mask types and is able to be generalizedfor detecting unseen high quality mask attacks. The method also works well fordetecting print attacks, but not suitable for video attack detection if used alone. We also
88

demonstrated the pulse-based feature can be combined with other features to build acomplementary system for detecting multiple types of spoofing attacks.
4.2 Limitations and future work
The two topics about ME and HR studies are both at their beginning stages withgood prospect of future development. I plan to continue research on both topics aftergraduation, and detailed plans are listed below.
4.2.1 ME analysis
The current ME studies can be continued and improved from four aspects in future work.First, about the ME database: more spontaneous ME data are still needed in order todevelop more sophisticate computational models. Compared to ordinary FE databases,the size of current ME databases are not big enough. Future collection of ME data canbe improved from three ways: the first is to increase the sample size; the second is toinvolve AU labelling; the third is to include depth information to build 3D ME models.A large 3D ME database is now under construction with collaboration of a group of UKresearchers.
Second, about ME spotting: the framework using feature difference analysis for MEspotting described in Section 2.5 was the first method proposed for spotting MEs fromspontaneous long videos. One challenge of the current spotting framework is that thereare other brief but non-emotional movements (e.g., eye blinks) that need to be ruled outfrom MEs. In future, more refined spotting method will be developed on the AU level,so that non-emotional brief movements can be ruled out to reduce the false positive rate.Besides, future ME spotting method will also try to target at providing more precisetemporal information of the ME including the onset, apex and offset frames.
Third, about ME recognition: the latest method proposed in paper III showedadvantage over previous methods by employing one extra step to magnify the subtlemotions. Other video processing methods will be explored and added to the framework,if they are demonstrated to be helpful for the ME recognition task. More sophisticatemachine learning models will be studied including deep learning models. It is alsoplanned to use 3D information for ME recognition when the new 3D ME database isfinished.
89
Fourth, about integrated ME spotting and recognition systems: after progresses aremade for both ME recognition methods and ME spotting methods, it is also planned tobuild advanced integrated systems for more accurate ME spotting and recognition.
4.2.2 HR measurement
Future study about HR measurement is planned in three directions.The first direction is to develop methods for more accurate and precise HR measure-
ment under controlled conditions. Current methods mostly measure the average HR of acertain length of video with an error rate of about 5%. This level of HR estimationcould be helpful for applications like face anti-spoofing and emotion status analysis,but are not good enough for applications like clinical diagnosis. In future we hopeto build better method to further increase the measurement accuracy, and it would bemore valuable if each individual heart beat can be precisely detected so that detailedcardiac information such as the HRV could be analyzed from the face. Assuming thatthe subject keeps in a stable sitting or standing position, if the remote HR measurementmethod can reach comparable accuracy as the traditional instruments like the BVP, wecan expect the new technique to be used in more application areas.
The second direction is to develop more robust measurement method that can workunder challenging situations, such as when dramatic movements are involved or inoutdoor environments. New methods involving the use of machine learning models,especially deep learning models will be considered.
The third direction is about applications. For the application in face anti-spoofing,the current proposed method can be improved by presenting the PSD curves using moresophisticated features. We will explore methods such as the Hidden Markov Model(HMM) or wavelet to develop more stable pulse-based features for anti-spoofing purpose.Other applications will also be explored, e.g., emotional status analysis and lie detection.If advanced HE measurement method is developed in future which can be accurateenough, we also consider to apply it for telemedicine or health-care monitoring at home.
4.2.3 Combining ME and HR for affective status analysis
Besides continuing research on each of the two topics, another valuable researchdirection is to combine them to build a multimodal system for affective status analysisusing only videos as the input. Literature review results showed that it might be possible
90

to extract other physiological information such as the respiration rate (RR) and bloodpressure (BP) from facial videos. So the plan is to combine ME with all physiologicalsignals (HR, RR and BP) that can be achieved from the face for emotional status analysis.The idea maybe especially suitable for detecting covered emotional changes with noobvious expressions shown on the face.
91

92
References
Ahonen T, Hadid A & Pietikäinen M (2006) Face description with local binary patterns:Application to face recognition. IEEE transactions on pattern analysis and machine intelligence28(12): 2037–2041.
Asthana A, Zafeiriou S, Cheng S & Pantic M (2013) Robust discriminative response map fittingwith constrained local models. Proc. Proceedings of the IEEE Conference on ComputerVision and Pattern Recognition, 3444–3451.
Balakrishnan G, Durand F & Guttag J (2013) Detecting pulse from head motions in video.Proc. Proceedings of the IEEE Conference on Computer Vision and Pattern Recognition,3430–3437.
Bartlett M, Littlewort G, Frank M, Lainscsek C, Fasel I & Movellan J (2006) Automatic recognitionof facial actions in spontaneous expressions. Journal of Multimedia 1(6): 22–35.
Basri R & Jacobs DW (2003) Lambertian reflectance and linear subspaces. IEEE transactions onpattern analysis and machine intelligence 25(2): 218–233.
Boulkenafet Z, Komulainen J & Hadid A (2015) Face anti-spoofing based on color textureanalysis. Proc. Image Processing (ICIP), 2015 IEEE International Conference on, 2636–2640.
Bradski G (2000) The OpenCV Library. Dr. Dobb’s Journal of Software Tools .Cennini G, Arguel J, Aksit K & van Leest A (2010) Heart rate monitoring via remote photo-
plethysmography with motion artifacts reduction. Optics Express 18(5): 4867–4875.Chan K & Zhang Y (2002) Adaptive reduction of motion artifact from photoplethysmographic
recordings using a variable step-size lms filter. Proc. Proceedings of IEEE on Sensors.Chang CC & Lin CJ (2011) Libsvm: a library for support vector machines. ACM Transactions on
Intelligent Systems and Technology (TIST) 2(3): 27.Chingovska I, Anjos A & Marcel S (2012) On the effectiveness of local binary patterns in face
anti-spoofing. Proc. International Conference of the Biometrics Special Interest Group(BIOSIG), 1–7.
Coan J & Allen J (2007) Handbook of Emotion Elicitation and Assessment. Oxford UniversityPress, USA.
Cootes TF, Taylor CJ, Cooper DH & Graham J (1995) Active shape models-their training andapplication. Computer vision and image understanding 61(1): 38–59.
Dalal N & Triggs B (2005) Histograms of oriented gradients for human detection. Proc. ComputerVision and Pattern Recognition, 2005. CVPR 2005. IEEE Computer Society Conference on,IEEE, 1: 886–893.
Davison AK, Lansley C, Costen N, Tan K & Yap MH (2016) Samm: A spontaneous micro-facialmovement dataset. IEEE Transactions on Affective Computing .
Davison AK, Yap MH, Costen N, Tan K, Lansley C & Leightley D (2014) Micro-facial movements:an investigation on spatio-temporal descriptors. Proc. European Conference on ComputerVision, Springer, 111–123.
Déniz O, Bueno G, Salido J & De la Torre F (2011) Face recognition using histograms of orientedgradients. Pattern Recognition Letters 32(12): 1598–1603.
Ekman P (2002) Microexpression training tool (METT). San Francisco: University of California .Ekman P (2003) Darwin, deception, and facial expression. Annals of the New York Academy of
Sciences 1000(1): 205–221.
93

Ekman P (2007) Emotions Revealed: Recognizing Faces and Feelings to Improve Communicationand Emotional Life. Macmillan.
Ekman P (2009) Lie catching and microexpressions. chapter 7, 118–133. Oxford University Press.Ekman P & Friesen W (1978) Facial Action Coding System: A Technique for the Measurement of
Facial Movement. Consulting Psychologists Press, Palo Alto, CA.Ekman P, Friesen W & O’Sullivan M (1988) Smiles when lying. Journal of Personality and Social
Psychology 54(3): 414.Ekman P & Friesen WV (1969) Nonverbal leakage and clues to deception. Psychiatry 32(1):
88–106.Ekman P & O’Sullivan M (1991) Who can catch a liar? American Psychologist 46(9): 913.Ekman P, Sullivan M & Frank M (1999) A few can catch a liar. Psychological Science 10(3):
263–266.Erdogmus N & Marcel S (2013) Spoofing attacks to 2d face recognition systems with 3d masks.
Proc. International Conference of the Biometrics Special Interest Group (BIOSIG).Erdogmus N & Marcel S (2014) Spoofing face recognition with 3d masks. Information Forensics
and Security, IEEE Transactions on 9(7): 1084–1097.Frank M & Ekman P (1997) The ability to detect deceit generalizes across different types of
high-stake lies. Journal of Personality and Social Psychology 72(6): 1429.Frank M, Herbasz M, Sinuk K, Keller A & Nolan C (2009) I see how you feel: Training
laypeople and professionals to recognize fleeting emotions. Proc. The Annual Meeting of theInternational Communication Association.
Gamelin FX, Berthoin S & Bosquet L (2006) Validity of the polar s810 heart rate monitor tomeasure rr intervals at rest. Medicine and Science in Sports and Exercise .
Goshtasby A (1988) Image registration by local approximation methods. Image and VisionComputing 6(4): 255–261.
Gross J & Levenson R (1995) Emotion elicitation using films. Cognition & Emotion 9(1): 87–108.Haggard E & Isaacs K (1966) Micromomentary facial expressions as indicators of ego mechanisms
in psychotherapy. Methods of research in psychotherapy. New York: Appleton-Century-Crofts154–165.
Haque MA, Irani R, Nasrollahi K & Moeslund TB (2016) Heartbeat rate measurement from facialvideo. IEEE Intelligent Systems 31(3): 40–48.
Haykin S & Widrow B (2003) Least-mean-square Adaptive Filters, volume 31. John Wiley &Sons.
Huang X, Zhao G, Hong X, Zheng W & Pietikäinen M (2016) Spontaneous facial micro-expressionanalysis using spatiotemporal completed local quantized patterns. Neurocomputing 175, PartA: 564 – 578.
Irani R, Nasrollahi K & Moeslund TB (2014) Improved pulse detection from head motionsusing dct. Proc. Computer Vision Theory and Applications (VISAPP), 2014 InternationalConference on, IEEE, 3: 118–124.
Kamachi M, Lyons M & Gyoba J (1998) The japanese female facial expression (JAFFE) database.Kanade T, Cohn JF & Tian Y (2000) Comprehensive database for facial expression analysis. Proc.
Automatic Face and Gesture Recognition, 2000. Proceedings. Fourth IEEE InternationalConference on, IEEE, 46–53.
Kollreider K, Fronthaler H & Bigun J (2008) Verifying liveness by multiple experts in facebiometrics. Proc. Computer Vision and Pattern Recognition Workshops, 2008. CVPRW’08.IEEE Computer Society Conference on, IEEE, 1–6.
94

Kollreider K, Fronthaler H, Faraj MI & Bigun J (2007) Real-time face detection and motionanalysis with application in “liveness” assessment. IEEE Transactions on InformationForensics and Security 2(3): 548–558.
Królak A & Strumiłło P (2012) Eye-blink detection system for human–computer interaction.Universal Access in the Information Society 11(4): 409–419.
Kwon S, Kim H & Park KS (2012) Validation of heart rate extraction using video imaging on abuilt-in camera system of a smartphone. Proc. Engineering in Medicine and Biology Society(EMBC), 2012 Annual International Conference of the IEEE, IEEE, 2174–2177.
Lam A & Kuno Y (2015) Robust heart rate measurement from video using select random patches.Proc. Proceedings of the IEEE International Conference on Computer Vision, 3640–3648.
Li C, Xu C, Gui C & Fox MD (2010) Distance regularized level set evolution and its applicationto image segmentation. IEEE Trans. on Image Processing .
Li J, Wang Y, Tan T & Jain AK (2004) Live face detection based on the analysis of fourier spectra.Proc. Defense and Security, International Society for Optics and Photonics, 296–303.
Li Y, Xu K, Yan Q, Li Y & Deng RH (2014) Understanding osn-based facial disclosure againstface authentication systems. Proc. Proceedings of the 9th ACM Symposium on Information,Computer and Communications Security, ACM, New York, NY, USA, 413–424.
Li Z, Imai Ji & Kaneko M (2009) Facial-component-based bag of words and phog descriptor forfacial expression recognition. Proc. Systems, Man and Cybernetics, 2009. SMC 2009. IEEEInternational Conference on, IEEE, 1353–1358.
Liong ST, Phan RCW, See J, Oh YH & Wong K (2014a) Optical strain based recognition of subtleemotions. Proc. Intelligent Signal Processing and Communication Systems (ISPACS), 2014International Symposium on, IEEE, 180–184.
Liong ST, See J, Phan RCW, Le Ngo AC, Oh YH & Wong K (2014b) Subtle expression recognitionusing optical strain weighted features. Proc. Asian Conference on Computer Vision, Springer,644–657.
Liu C (2009) Beyond pixels: exploring new representations and applications for motion analysis.Ph.D. thesis, Massachusetts Institute of Technology.
Liu YJ, Zhang JK, Yan WJ, Wang SJ, Zhao G & Fu X (2016) A main directional mean opticalflow feature for spontaneous micro-expression recognition. IEEE Transactions on AffectiveComputing 7(4): 299–310.
Liwicki S, Zafeiriou S & Pantic M (2012) Incremental slow feature analysis with indefinitekernel for online temporal video segmentation. Proc. Asian Conference on Computer Vision,Springer, 162–176.
Määttä J, Hadid A & Pietikäinen M (2011) Face spoofing detection from single images usingmicro-texture analysis. Proc. Biometrics (IJCB), 2011 international joint conference on,IEEE, 1–7.
Marcel S, Nixon MS & Li SZ (2014) Handbook of Biometric Anti-Spoofing. Springer.Matsumoto D & Hwang H (2011) Evidence for training the ability to read microexpressions of
emotion. Motivation and Emotion 1–11.Moilanen A, Zhao G & Pietikäinen M (2014) Spotting rapid facial movements from videos using
appearance-based feature difference analysis. Proc. Pattern Recognition (ICPR), 2014 22ndInternational Conference on, IEEE, 1722–1727.
Ojala T, Pietikäinen M & Mäenpää T (2002) Multiresolution gray-scale and rotation invarianttexture classification with local binary patterns. IEEE Transactions on pattern analysis andmachine intelligence 24(7): 971–987.
95

Pantic M, Valstar M, Rademaker R & Maat L (2005) Web-based database for facial expressionanalysis. Proc. Multimedia and Expo, 2005. ICME 2005. IEEE International Conference on,IEEE, 5–pp.
Patel D, Hong X & Zhao G (2016) Selective deep features for micro-expression recognition. Proc.Pattern Recognition (ICPR), 2016 23rd International Conference on, IEEE, 2258–2263.
Poh MZ, McDuff DJ & Picard RW (2010) Non-contact, automated cardiac pulse measurementsusing video imaging and blind source separation. Optics Express .
Poh MZ, McDuff DJ & Picard RW (2011) Advancements in noncontact, multiparameterphysiological measurements using a webcam. IEEE Trans. on Biomedical Engineering .
Polikovsky S & Kameda Y (2013) Facial micro-expression detection in high-speed video basedon facial action coding system (FACS). IEICE Transactions on Information and Systems96(1): 81–92.
Polikovsky S, Kameda Y & Ohta Y (2009) Facial micro-expressions recognition using high speedcamera and 3d-gradient descriptor. Proc. Crime Detection and Prevention (ICDP 2009), 3rdInternational Conference on, IET, 1–6.
Porter S & ten Brinke L (2008) Reading between the lies identifying concealed and falsifiedemotions in universal facial expressions. Psychological Science 19(5): 508–514.
Prahl S (1999) Optical absorption of hemoglobin. http://omlc.ogi.edu/spectra/hemoglobin/.
Ruiz-Hernandez JA & Pietikäinen M (2013) Encoding local binary patterns using the re-parametrization of the second order gaussian jet. Proc. Automatic Face and GestureRecognition (FG), 2013 10th IEEE International Conference and Workshops on, IEEE, 1–6.
Shamir M, Eidelman L, Floman Y, Kaplan L & Pizov R (1999) Pulse oximetry plethysmographicwaveform during changes in blood volume. British Journal of Anaesthesia 82(2): 178–181.
Shelley K & Shelley S (2001) Pulse oximeter waveform: photoelectric plethysmography. ClinicalMonitoring, Carol Lake, R. Hines, and C. Blitt, Eds.: WB Saunders Company 420–428.
Shi J et al. (1994) Good features to track. Proc. Computer Vision and Pattern Recognition, 1994.Proceedings CVPR’94., 1994 IEEE Computer Society Conference on, IEEE, 593–600.
Shreve M, Godavarthy S, Goldgof D & Sarkar S (2011) Macro-and micro-expression spotting inlong videos using spatio-temporal strain. Proc. Automatic Face & Gesture Recognition andWorkshops (FG 2011), 2011 IEEE International Conference on, IEEE, 51–56.
Shreve M, Godavarthy S, Manohar V, Goldgof D & Sarkar S (2009) Towards macro-and micro-expression spotting in video using strain patterns. Proc. Applications of Computer Vision(WACV), 2009 Workshop on, IEEE, 1–6.
Simon H (2002) Adaptive Filter Theory. Prentice Hall.Soleymani M, Lichtenauer J, Pun T & Pantic M (2012) A multimodal database for affect
recognition and implicit tagging. IEEE Transactions on Affective Computing 3(1): 42–55.Tan X, Li Y, Liu J & Jiang L (2010) Face liveness detection from a single image with sparse low
rank bilinear discriminative model. Computer Vision–ECCV 2010 504–517.Tarvainen MP, Ranta-Aho PO & Karjalainen PA (2002) An advanced detrending method with
application to hrv analysis. IEEE Transactions on Biomedical Engineering 49(2): 172–175.Tomasi C & Kanade T (1991) Detection and Tracking of Point Features. School of Computer
Science, Carnegie Mellon Univ. Pittsburgh.Tulyakov S, Alameda-Pineda X, Ricci E, Yin L, Cohn JF & Sebe N (2016) Self-adaptive
matrix completion for heart rate estimation from face videos under realistic conditions.Proc. Proceedings of the IEEE Conference on Computer Vision and Pattern Recognition,
96

2396–2404.Verkruysse W, Svaasand LO & Nelson JS (2008) Remote plethysmographic imaging using
ambient light. Optics Express .Viola P & Jones M (2001) Rapid object detection using a boosted cascade of simple features.
Proc. Computer Vision and Pattern Recognition, CVPR 2001. Proceedings of the 2001 IEEEComputer Society Conference on, IEEE, 1: I–I.
Wang SJ, Yan WJ, Li X, Zhao G & Fu X (2014a) Micro-expression recognition using dynamictextures on tensor independent color space. Proc. Pattern Recognition (ICPR), 2014 22ndInternational Conference on, IEEE, 4678–4683.
Wang SJ, Yan WJ, Li X, Zhao G, Zhou CG, Fu X, Yang M & Tao J (2015) Micro-expressionrecognition using color spaces. IEEE Transactions on Image Processing 24(12): 6034–6047.
Wang SJ, Yan WJ, Zhao G, Fu X & Zhou CG (2014b) Micro-expression recognition using robustprincipal component analysis and local spatiotemporal directional features. Proc. Workshopat the European Conference on Computer Vision, Springer, 325–338.
Wang Y, See J, Phan RCW & Oh YH (2014c) Lbp with six intersection points: Reducingredundant information in lbp-top for micro-expression recognition. Proc. Asian Conferenceon Computer Vision, Springer, 525–537.
Warren G, Schertler E & Bull P (2009) Detecting deception from emotional and unemotional cues.Journal of Nonverbal Behavior 33(1): 59–69.
Welch P (1967) The use of fast fourier transform for the estimation of power spectra: a methodbased on time averaging over short, modified periodograms. IEEE Transactions on audio andelectroacoustics 15(2): 70–73.
Wen D, Han H & Jain A (2015) Face spoof detection with image distortion analysis. InformationForensics and Security, IEEE Transactions on 10(4): 746–761.
Wu HY, Rubinstein M, Shih E, Guttag J, Durand F & Freeman W (2012) Eulerian videomagnification for revealing subtle changes in the world .
Wu Q, Shen X & Fu X (2010) Micro-expression and its applications. Advances in PsychologicalScience 18(9): 1359–1368.
Wu Q, Shen X & Fu X (2011) The machine knows what you are hiding: an automatic micro-expression recognition system. Affective Computing and Intelligent Interaction 152–162.
Xia Z, Feng X, Peng J, Peng X & Zhao G (2016) Spontaneous micro-expression spotting viageometric deformation modeling. Computer Vision and Image Understanding 147: 87 – 94.
Yan WJ, Li X, Wang SJ, Zhao G, Liu YJ, Chen YH & Fu X (2014) CASME II: An improvedspontaneous micro-expression database and the baseline evaluation. PloS one 9(1): e86041.
Yan WJ, Wu Q, Liang J, Chen YH & Fu X (2013a) How fast are the leaked facial expressions:The duration of micro-expressions. Journal of Nonverbal Behavior 37(4): 217–230.
Yan WJ, Wu Q, Liu YJ, Wang SJ & Fu X (2013b) Casme database: A dataset of spontaneousmicro-expressions collected from neutralized faces. Proc. Automatic Face and GestureRecognition (FG), 2013 10th IEEE International Conference and Workshops on, IEEE, 1–7.
Yao S, He N, Zhang H & Yoshie O (2014) Micro-expression recognition by feature points tracking.Proc. Communications (COMM), 2014 10th International Conference on, IEEE, 1–4.
Zeng Z, Fu Y, Roisman GI, Wen Z, Hu Y & Huang TS (2006) Spontaneous emotional facialexpression detection. Journal of Multimedia 1(5): 1–8.
Zeng Z, Pantic M, Roisman GI & Huang TS (2009) A survey of affect recognition methods:Audio, visual, and spontaneous expressions. IEEE Transactions on Pattern Analysis andMachine Intelligence 31(1): 39–58.
97

Zhang T, Tang YY, Fang B, Shang Z & Liu X (2009) Face recognition under varying illuminationusing gradientfaces. IEEE Transactions on Image Processing 18(11): 2599–2606.
Zhao G, Huang X, Taini M, Li SZ & Pietikäinen M (2011) Facial expression recognition fromnear-infrared videos. Image and Vision Computing 29(9): 607–619.
Zhao G & Pietikäinen M (2007) Dynamic texture recognition using local binary patterns withan application to facial expressions. IEEE transactions on pattern analysis and machineintelligence 29(6).
Zhou Z, Zhao G & Pietikäinen M (2011) Towards a practical lipreading system. Proc. ComputerVision and Pattern Recognition (CVPR), 2011 IEEE Conference on, IEEE, 137–144.
98
Original publications
I Pfister T, Li X, Zhao G & Pietikäinen M (2011) Recognising spontaneous facial micro-expressions. IEEE International Conference on Computer Vision (ICCV), 2011, 1449-1456.
II Li X, Pfister T, Huang X, Zhao G & Pietikäinen M (2013) A spontaneous micro-expressiondatabase: Inducement, collection and baseline. 10th IEEE International Conference andWorkshops on Automatic Face and Gesture Recognition (FG), 2013: 1-6.
III Li X, Hong X, Moilanen A, Huang X, Pfister T, Zhao G, & Pietikäinen M (2017) Towardsreading hidden emotions: A comparative study of spontaneous micro-expression spottingand recognition methods. IEEE Transactions on Affective Computing (In press, availableonline).
IV Li X, Chen J, Zhao G, & Pietikäinen (2014) Remote heart rate measurement from facevideos under realistic situations. Proceedings of the IEEE Conference on Computer Visionand Pattern Recognition (CVPR) 2014: 4264-4271.
V Li X, Komulainen J, Zhao G, Yuen PC & Pietikäinen M (2016) Generalized face anti-spoofing by detecting pulse from face videos. 23rd International Conference on PatternRecognition (ICPR) 2016: 4244-4249.
Reprinted with permission from IEEE.
Original publications are not included in the electronic version of the dissertation.
99

100
A C T A U N I V E R S I T A T I S O U L U E N S I S
Book orders:Granum: Virtual book storehttp://granum.uta.fi/granum/
S E R I E S C T E C H N I C A
604. Luoto, Petri (2017) Co-primary multi-operator resource sharing for small cellnetworks
605. Yrjölä, Seppo (2017) Analysis of technology and business antecedents forspectrum sharing in mobile broadband networks
606. Suikkanen, Essi (2017) Detection algorithms and ASIC designs for MIMO–OFDMdownlink receivers
607. Niemelä, Ville (2017) Evaluations and analysis of IR-UWB receivers for personalmedical communications
608. Keränen, Anni (2017) Water treatment by quaternized lignocellulose
609. Jutila, Mirjami (2017) Adaptive traffic management in heterogeneouscommunication networks
610. Shahmarichatghieh, Marzieh (2017) Product development sourcing strategies overtechnology life cycle in high-tech industry
611. Ylitalo, Pekka (2017) Value creation metrics in systematic idea generation
612. Hietajärvi, Anna-Maija (2017) Capabilities for managing project alliances
613. Kangas, Maria (2017) Stability analysis of new paradigms in wireless networks
614. Roivainen, Antti (2017) Three-dimensional geometry-based radio channel model :parametrization and validation at 10 GHz
615. Chen, Mei-Yu (2017) Ultra-low sintering temperature glass ceramic compositionsbased on bismuth-zinc borosilicate glass
616. Yliniemi, Juho (2017) Alkali activation-granulation of fluidized bed combustion flyashes
617. Iljana, Mikko (2017) Iron ore pellet properties under simulated blast furnaceconditions : investigation on reducibility, swelling and softening
618. Jokinen, Karoliina (2017) Color tuning of organic light emitting devices
619. Schuss, Christian (2017) Measurement techniques and results aiding the design ofphotovoltaic energy harvesting systems
620. Mämmelä, Olli (2017) Algorithms for efficient and energy-aware networkresource management in autonomous communications systems
621. Matilainen, Matti (2017) Embedded computer vision methods for human activityrecognition
C622etukansi.kesken.fm Page 2 Thursday, August 24, 2017 11:59 AM
UNIVERSITY OF OULU P .O. Box 8000 F I -90014 UNIVERSITY OF OULU FINLAND
A C T A U N I V E R S I T A T I S O U L U E N S I S
University Lecturer Tuomo Glumoff
University Lecturer Santeri Palviainen
Postdoctoral research fellow Sanna Taskila
Professor Olli Vuolteenaho
University Lecturer Veli-Matti Ulvinen
Planning Director Pertti Tikkanen
Professor Jari Juga
University Lecturer Anu Soikkeli
Professor Olli Vuolteenaho
Publications Editor Kirsti Nurkkala
ISBN 978-952-62-1637-9 (Paperback)ISBN 978-952-62-1638-6 (PDF)ISSN 0355-3213 (Print)ISSN 1796-2226 (Online)
U N I V E R S I TAT I S O U L U E N S I SACTAC
TECHNICA
U N I V E R S I TAT I S O U L U E N S I SACTAC
TECHNICA
OULU 2017
C 622
Xiaobai Li
READING SUBTLE INFORMATION FROM HUMAN FACES
UNIVERSITY OF OULU GRADUATE SCHOOL;UNIVERSITY OF OULU,FACULTY OF INFORMATION TECHNOLOGY AND ELECTRICAL ENGINEERING;INFOTECH OULU
C 622
AC
TAX
iaobai LiC622etukansi.kesken.fm Page 1 Thursday, August 24, 2017 11:59 AM