Embed Size (px)
Citation preview
2/43
Outline
Wafer failure pattern classification
Singing voice separation and audio melody extraction
Wafer Failure Pattern Classification
張智星 (Roger Jang)
台灣大學 資工系
4/43
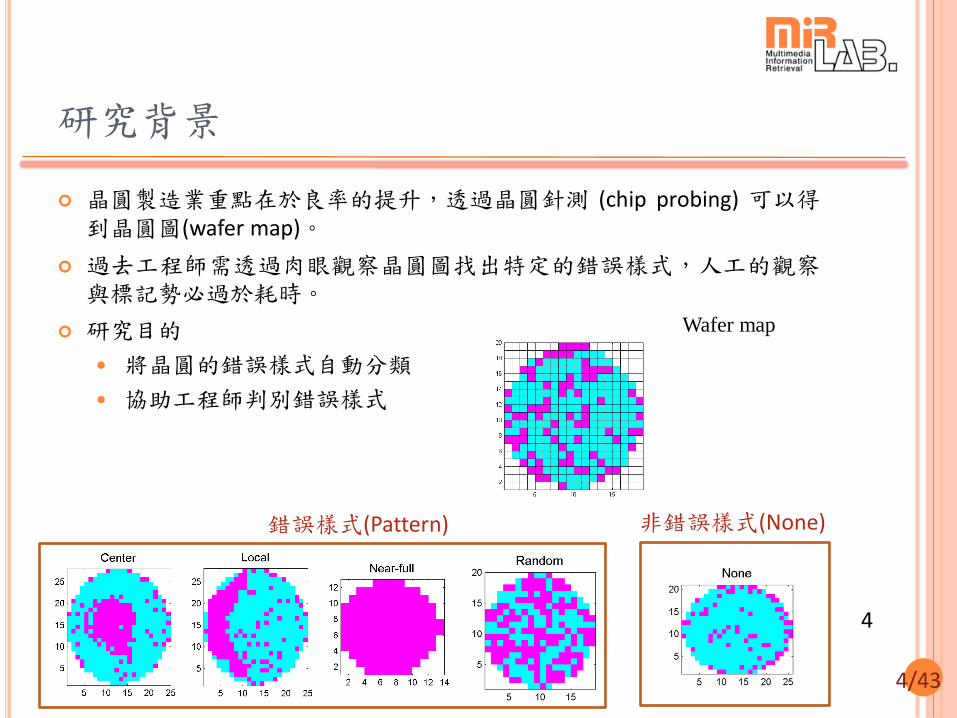
研究背景
晶圓製造業重點在於良率的提升,透過晶圓針測 (chip probing) 可以得到晶圓圖(wafer map)。
過去工程師需透過肉眼觀察晶圓圖找出特定的錯誤樣式,人工的觀察與標記勢必過於耗時。
研究目的
將晶圓的錯誤樣式自動分類
協助工程師判別錯誤樣式
4
Wafer map
錯誤樣式(Pattern) 非錯誤樣式(None)
5/43
Typical Failure Patterns for Small-die Wafers
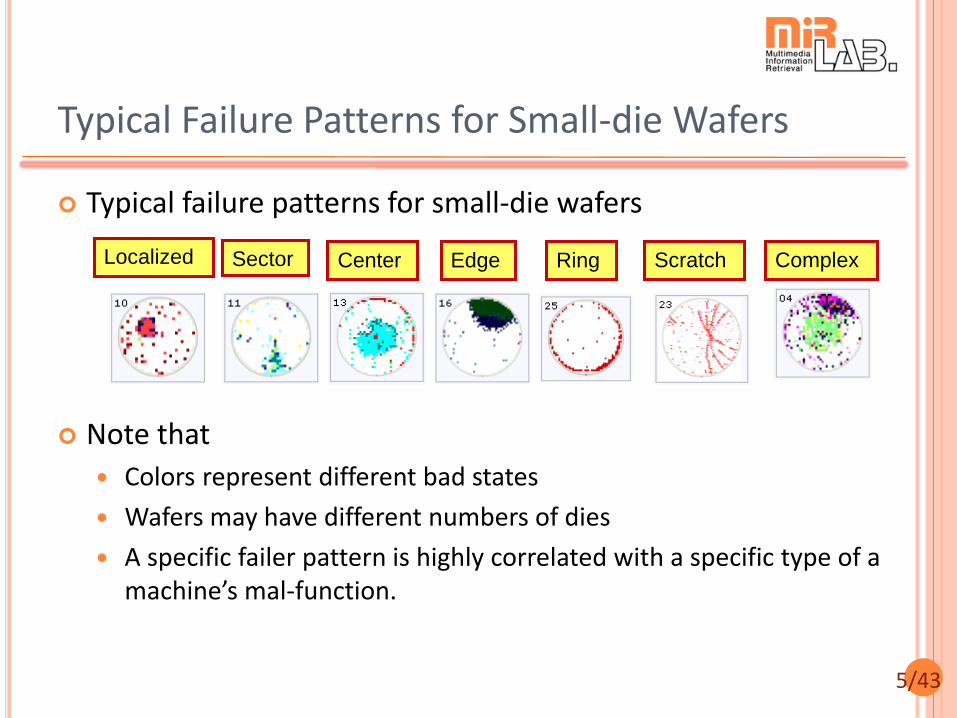
Typical failure patterns for small-die wafers
Note that
Colors represent different bad states
Wafers may have different numbers of dies
A specific failer pattern is highly correlated with a specific type of a machine’s mal-function.
Localized
Field related
+Donut
Center Edge Ring Scratch Complex
Field related
+Edge
Sector
6/43
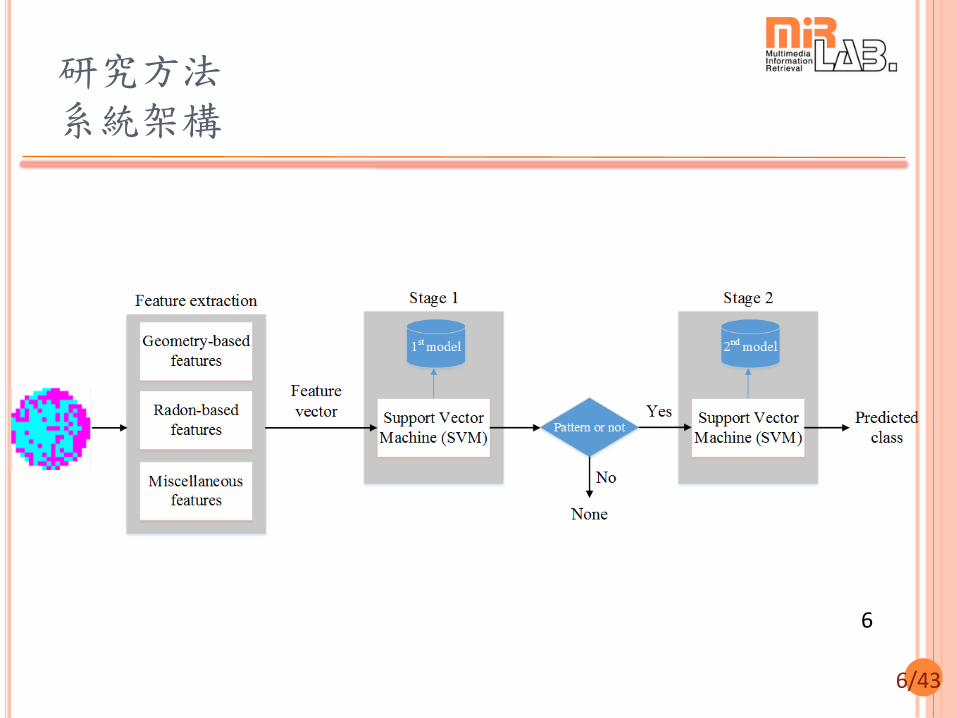
研究方法 系統架構
6
7/43
Features
Features are the most important and valuable asset of a classification system!
Our features
Regions’ features
Geometry
Statistics
Lines and curves (Hough transform)
Radon transform
Others: Histogram of 2×2 binary patterns and number of corners
7
8/43
研究方法 幾何特徵 (1/3)
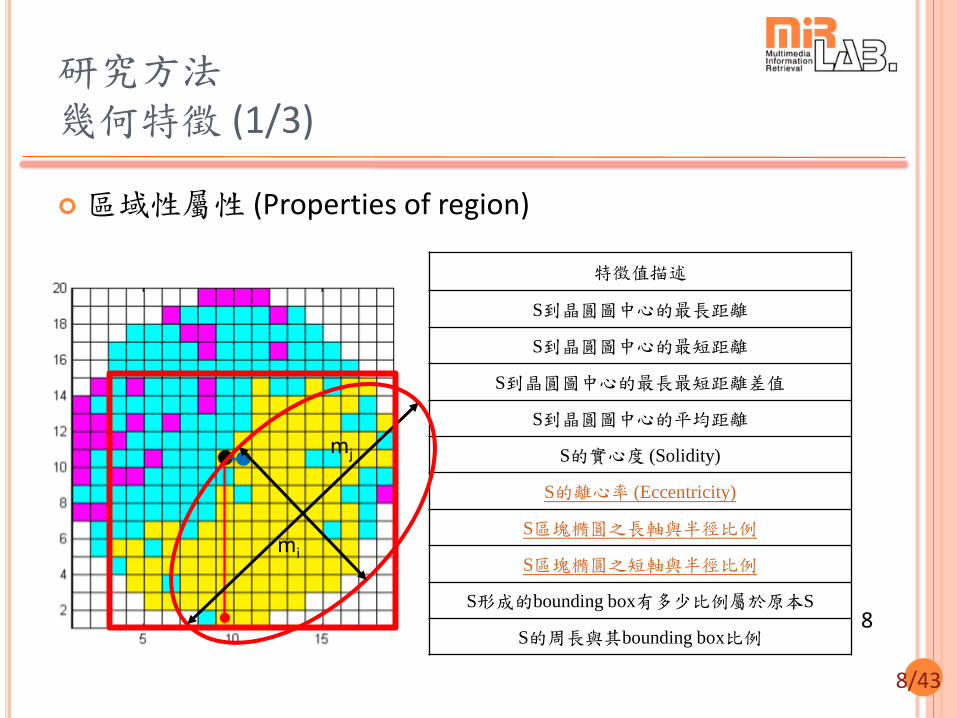
區域性屬性 (Properties of region)
8
特徵值描述
S到晶圓圖中心的最長距離
S到晶圓圖中心的最短距離
S到晶圓圖中心的最長最短距離差值
S到晶圓圖中心的平均距離
S的實心度 (Solidity)
S的離心率 (Eccentricity)
S區塊橢圓之長軸與半徑比例
S區塊橢圓之短軸與半徑比例
S形成的bounding box有多少比例屬於原本S
S的周長與其bounding box比例
mj
mi
9/43
研究方法 幾何特徵 (2/3)
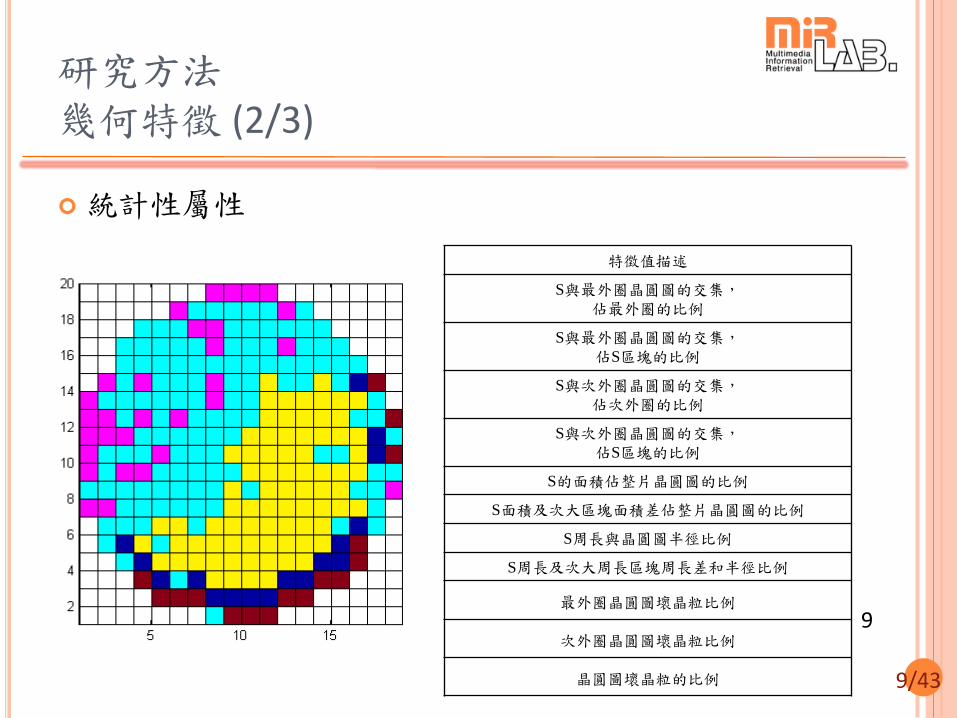
統計性屬性
9
特徵值描述
S與最外圈晶圓圖的交集,
佔最外圈的比例
S與最外圈晶圓圖的交集,
佔S區塊的比例
S與次外圈晶圓圖的交集,
佔次外圈的比例
S與次外圈晶圓圖的交集,
佔S區塊的比例
S的面積佔整片晶圓圖的比例
S面積及次大區塊面積差佔整片晶圓圖的比例
S周長與晶圓圖半徑比例
S周長及次大周長區塊周長差和半徑比例
最外圈晶圓圖壞晶粒比例
次外圈晶圓圖壞晶粒比例
晶圓圖壞晶粒的比例
10/43
研究方法 幾何特徵 (3/3)
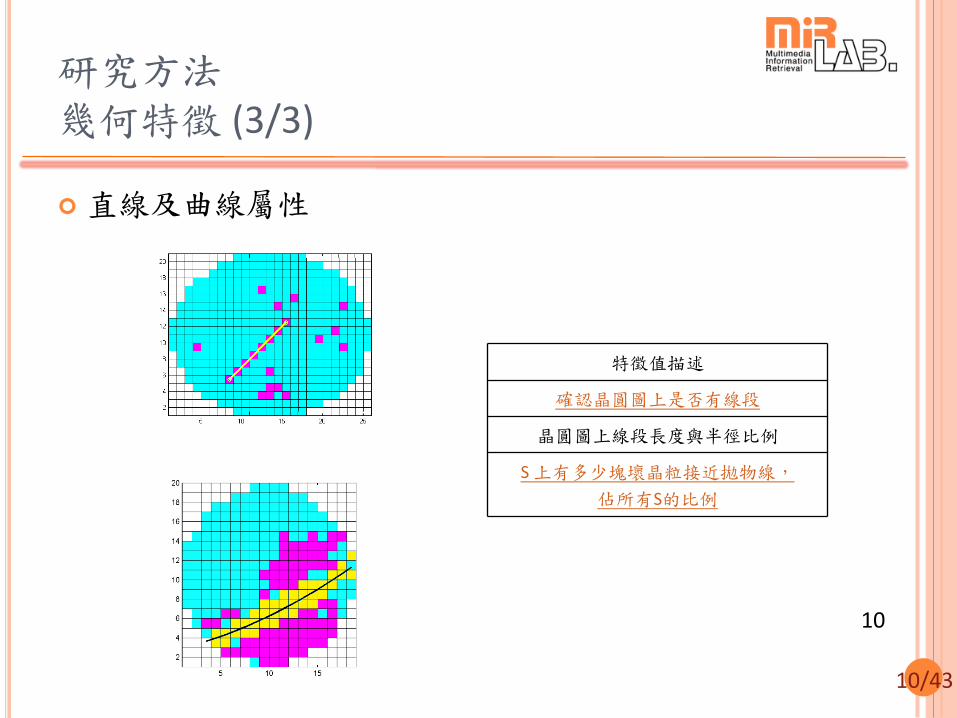
直線及曲線屬性
10
特徵值描述
確認晶圓圖上是否有線段
晶圓圖上線段長度與半徑比例
S 上有多少塊壞晶粒接近拋物線,
佔所有S的比例
11/43
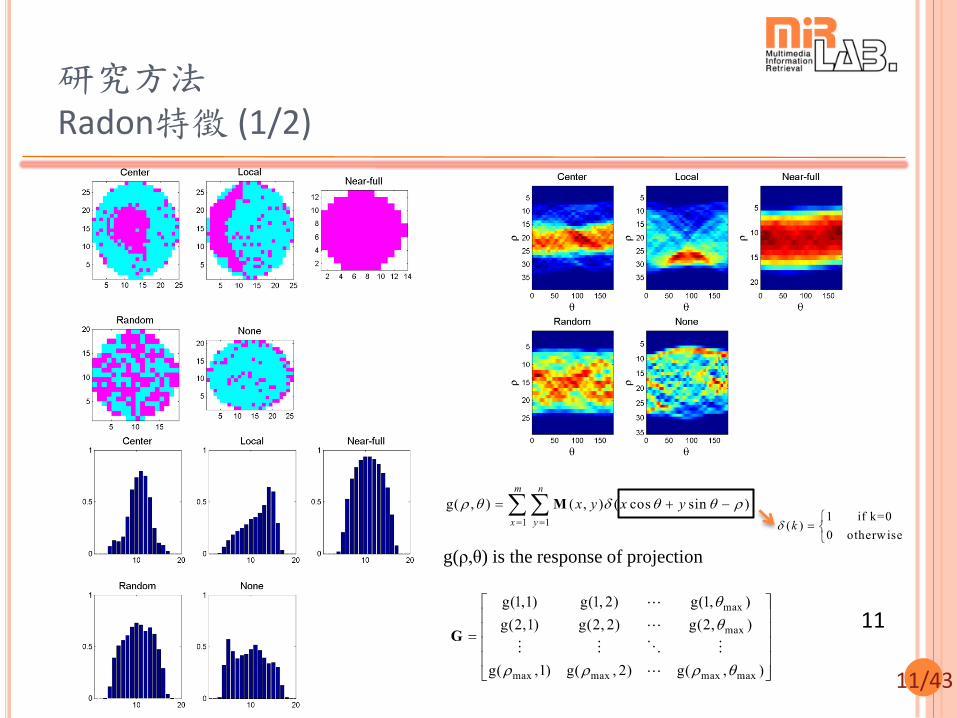
研究方法 Radon特徵 (1/2)
11
g(ρ,θ) is the response of projection
12/43
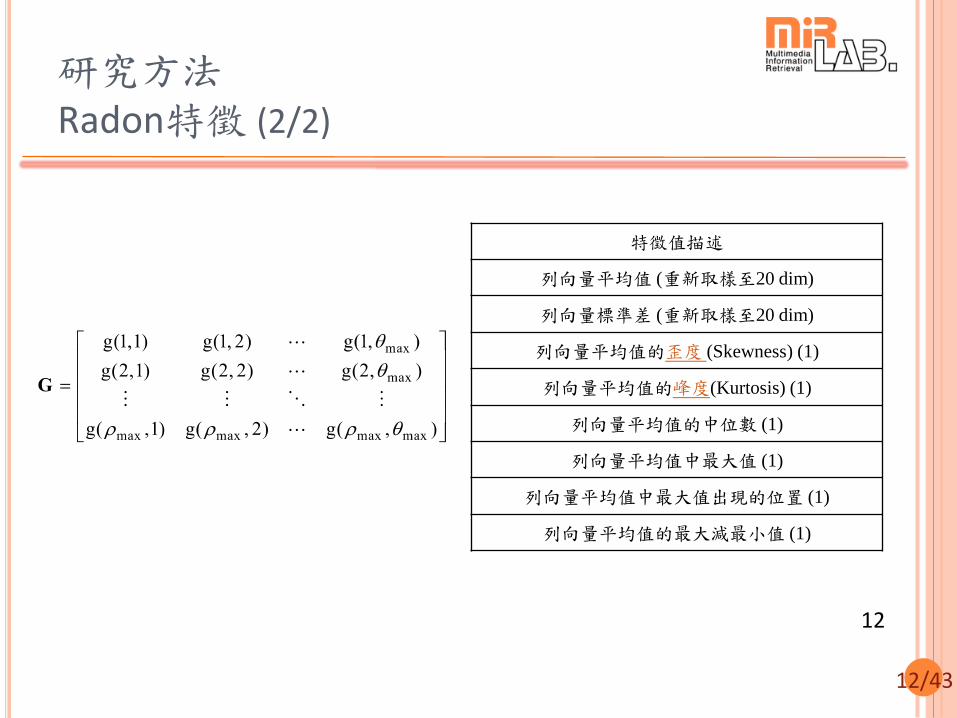
研究方法 Radon特徵 (2/2)
12
特徵值描述
列向量平均值 (重新取樣至20 dim)
列向量標準差 (重新取樣至20 dim)
列向量平均值的歪度 (Skewness) (1)
列向量平均值的峰度(Kurtosis) (1)
列向量平均值的中位數 (1)
列向量平均值中最大值 (1)
列向量平均值中最大值出現的位置 (1)
列向量平均值的最大減最小值 (1)
13/43
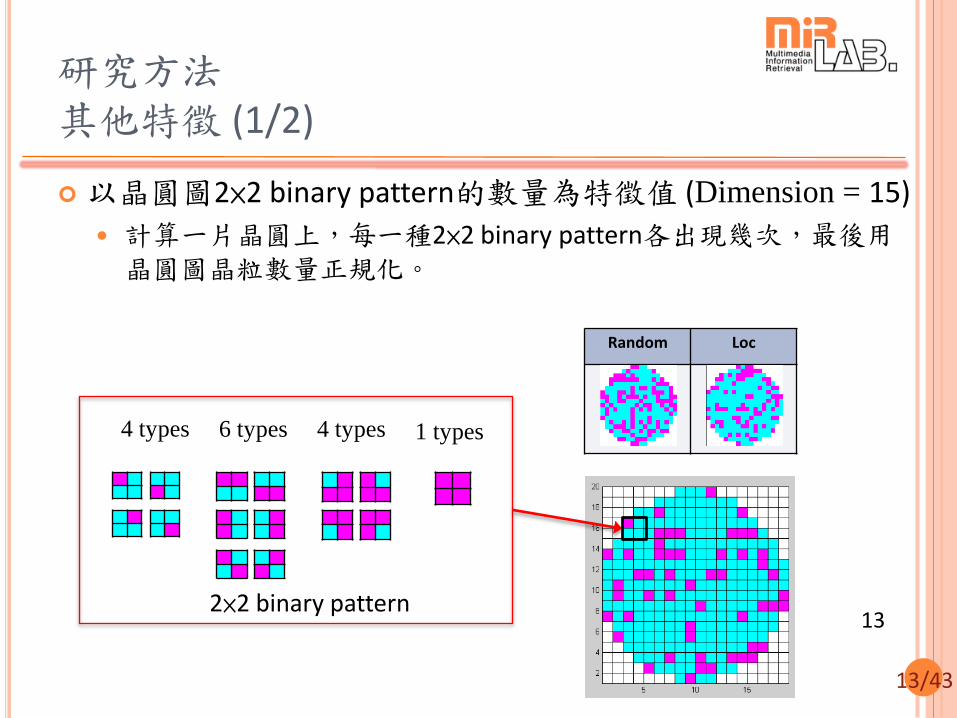
6 types 4 types 4 types 1 types
2×2 binary pattern
研究方法 其他特徵 (1/2)
以晶圓圖2×2 binary pattern的數量為特徵值 (Dimension = 15)
計算一片晶圓上,每一種2×2 binary pattern各出現幾次,最後用晶圓圖晶粒數量正規化。
13
Random Loc
14/43
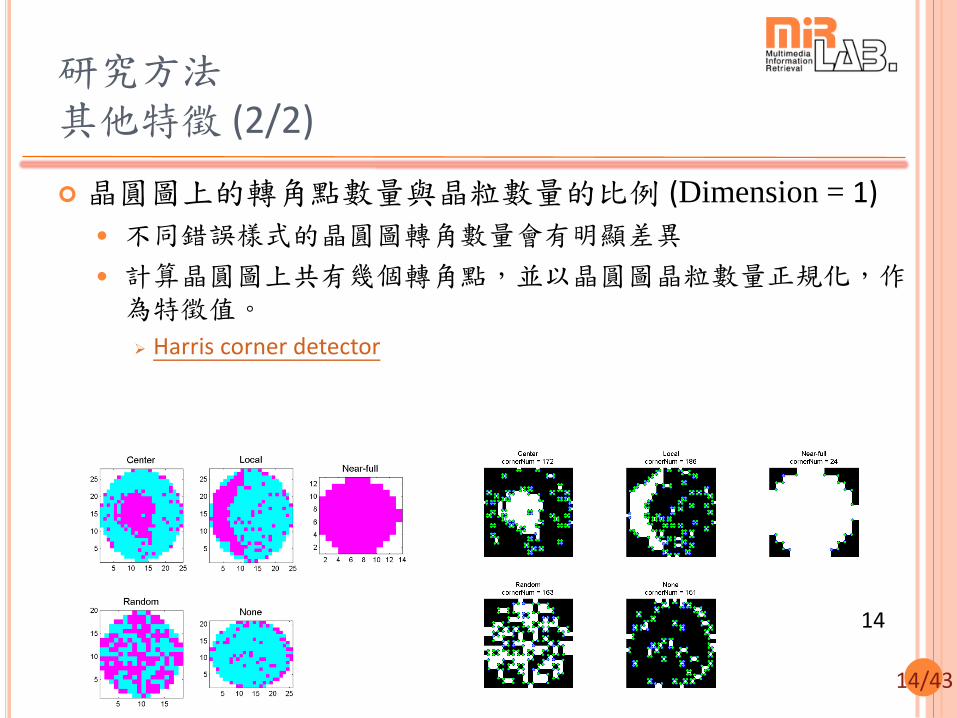
研究方法 其他特徵 (2/2)
晶圓圖上的轉角點數量與晶粒數量的比例 (Dimension = 1)
不同錯誤樣式的晶圓圖轉角數量會有明顯差異
計算晶圓圖上共有幾個轉角點,並以晶圓圖晶粒數量正規化,作為特徵值。
Harris corner detector
14
15/43
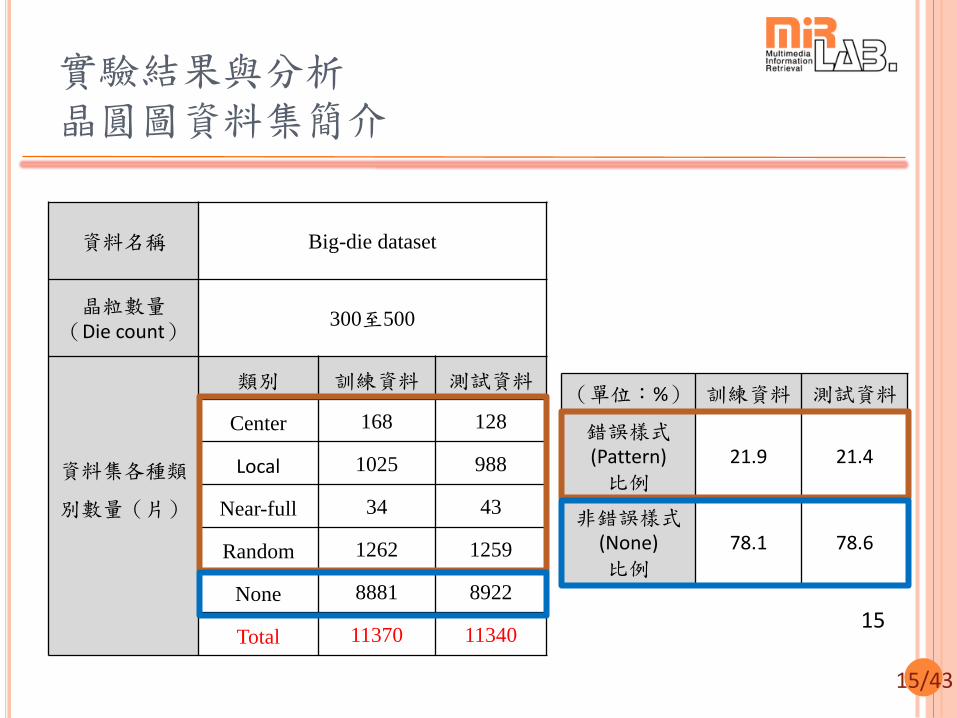
實驗結果與分析 晶圓圖資料集簡介
資料名稱 Big-die dataset
晶粒數量 (Die count)
300至500
資料集各種類
別數量(片)
類別 訓練資料 測試資料
Center 168 128
Local 1025 988
Near-full 34 43
Random 1262 1259
None 8881 8922
Total 11370 11340 15
(單位:%) 訓練資料 測試資料
錯誤樣式(Pattern) 比例
21.9 21.4
非錯誤樣式(None) 比例
78.1 78.6
16/43
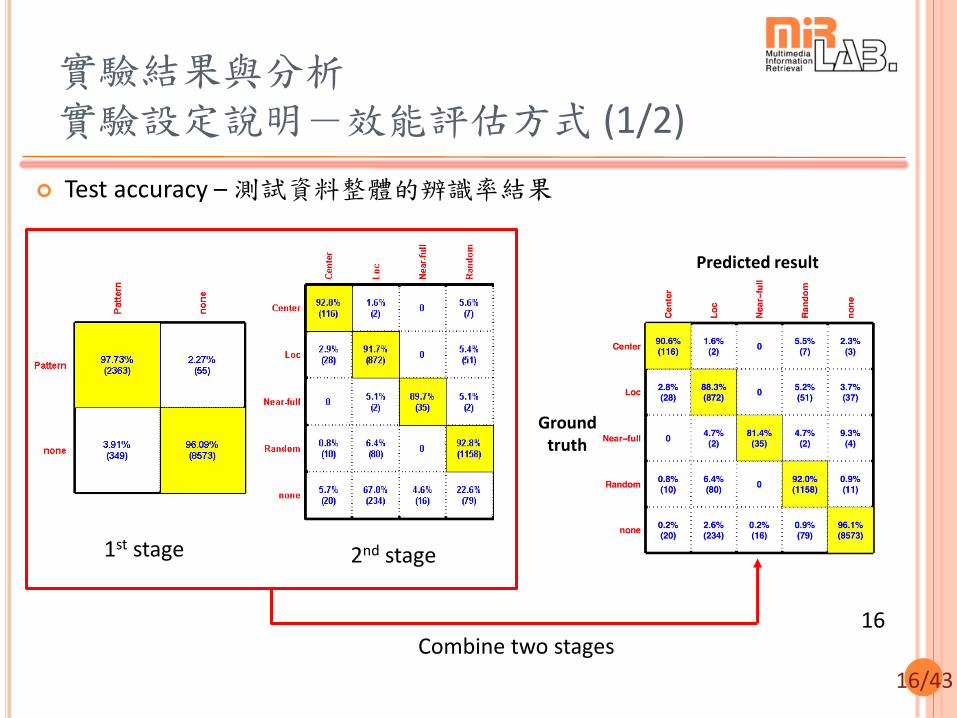
實驗結果與分析 實驗設定說明-效能評估方式 (1/2)
Test accuracy – 測試資料整體的辨識率結果
16
Ground truth
Predicted result
1st stage 2nd stage
Combine two stages
17/43
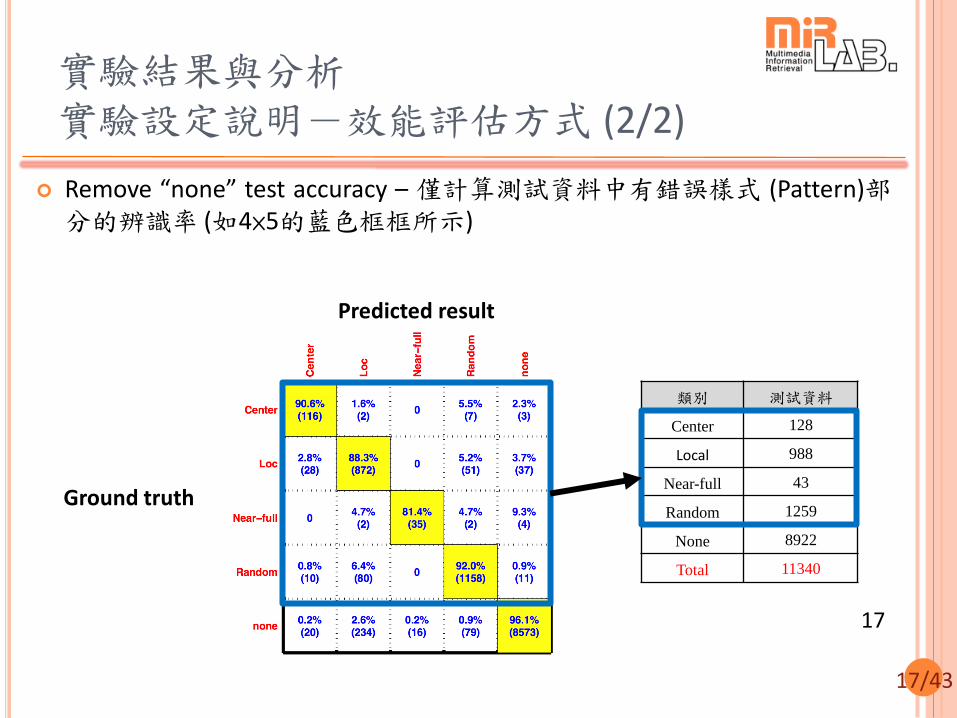
實驗結果與分析 實驗設定說明-效能評估方式 (2/2)
Remove “none” test accuracy – 僅計算測試資料中有錯誤樣式 (Pattern)部分的辨識率 (如4×5的藍色框框所示)
17
Ground truth
Predicted result
類別 測試資料
Center 128
Local 988
Near-full 43
Random 1259
None 8922
Total 11340
18/43
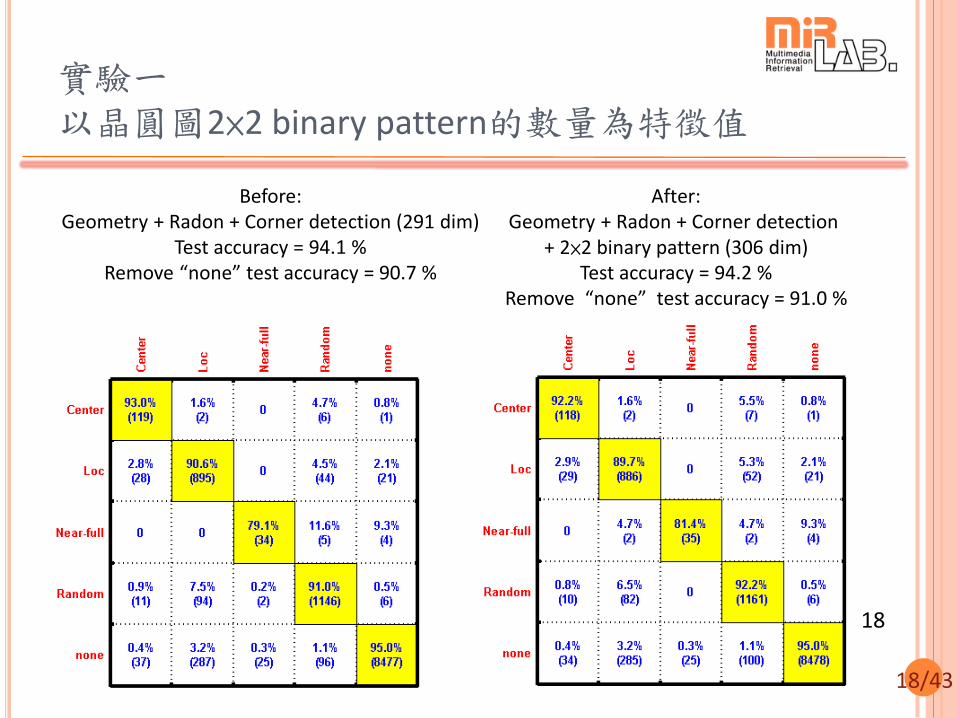
實驗一 以晶圓圖2×2 binary pattern的數量為特徵值
18
After: Geometry + Radon + Corner detection
+ 2×2 binary pattern (306 dim) Test accuracy = 94.2 %
Remove “none” test accuracy = 91.0 %
Before: Geometry + Radon + Corner detection (291 dim)
Test accuracy = 94.1 % Remove “none” test accuracy = 90.7 %
19/43
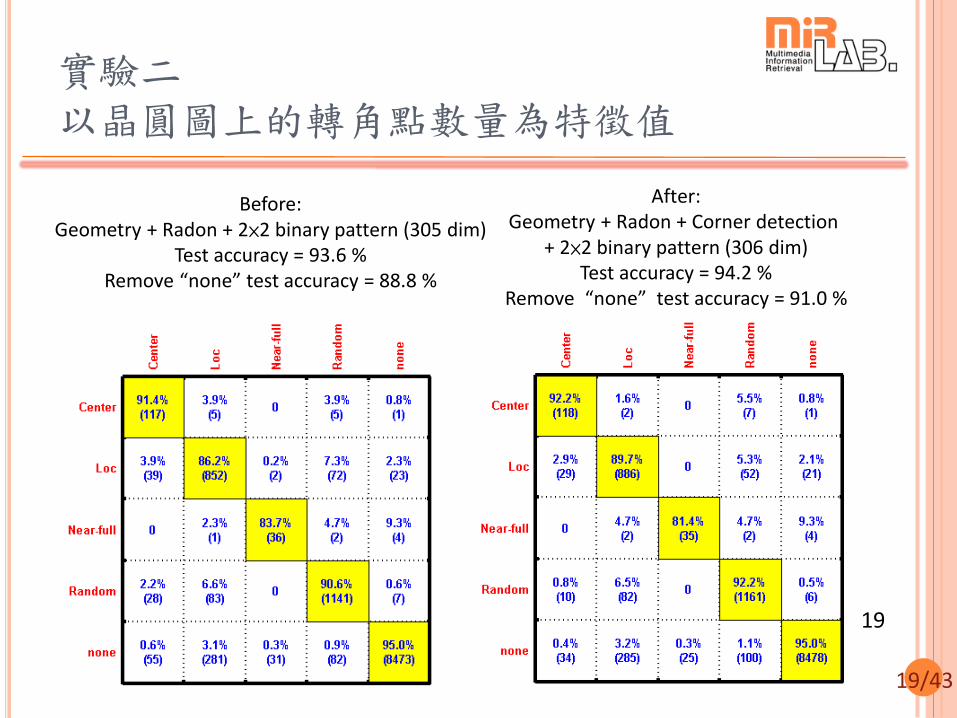
實驗二 以晶圓圖上的轉角點數量為特徵值
19
After: Geometry + Radon + Corner detection
+ 2×2 binary pattern (306 dim) Test accuracy = 94.2 %
Remove “none” test accuracy = 91.0 %
Before: Geometry + Radon + 2×2 binary pattern (305 dim)
Test accuracy = 93.6 % Remove “none” test accuracy = 88.8 %
20/43
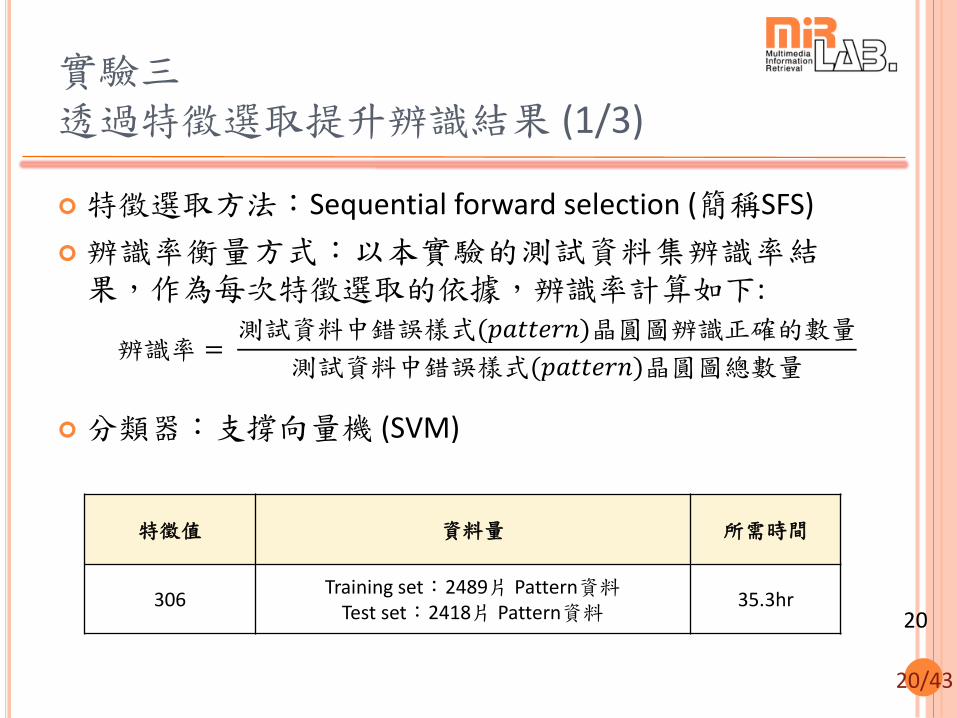
特徵選取方法:Sequential forward selection (簡稱SFS)
辨識率衡量方式:以本實驗的測試資料集辨識率結果,作為每次特徵選取的依據,辨識率計算如下:
分類器:支撐向量機 (SVM)
實驗三 透過特徵選取提升辨識結果 (1/3)
20
特徵值 資料量 所需時間
306 Training set:2489片 Pattern資料
Test set:2418片 Pattern資料 35.3hr
辨識率 = 測試資料中錯誤樣式(𝑝𝑎𝑡𝑡𝑒𝑟𝑛)晶圓圖辨識正確的數量
測試資料中錯誤樣式(𝑝𝑎𝑡𝑡𝑒𝑟𝑛)晶圓圖總數量
21/43
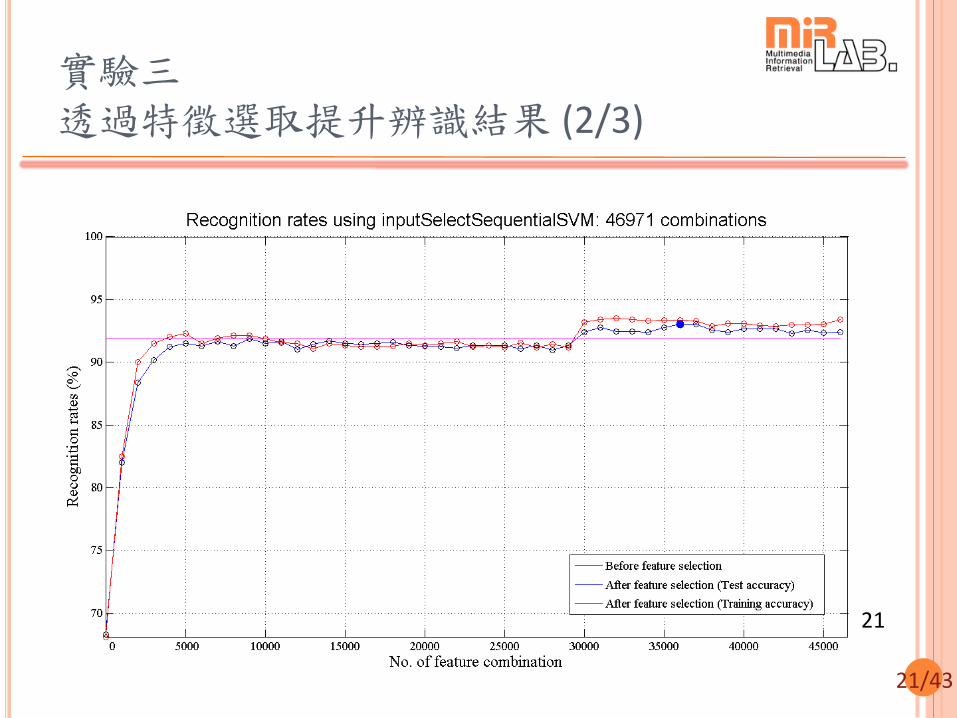
實驗三 透過特徵選取提升辨識結果 (2/3)
21
22/43
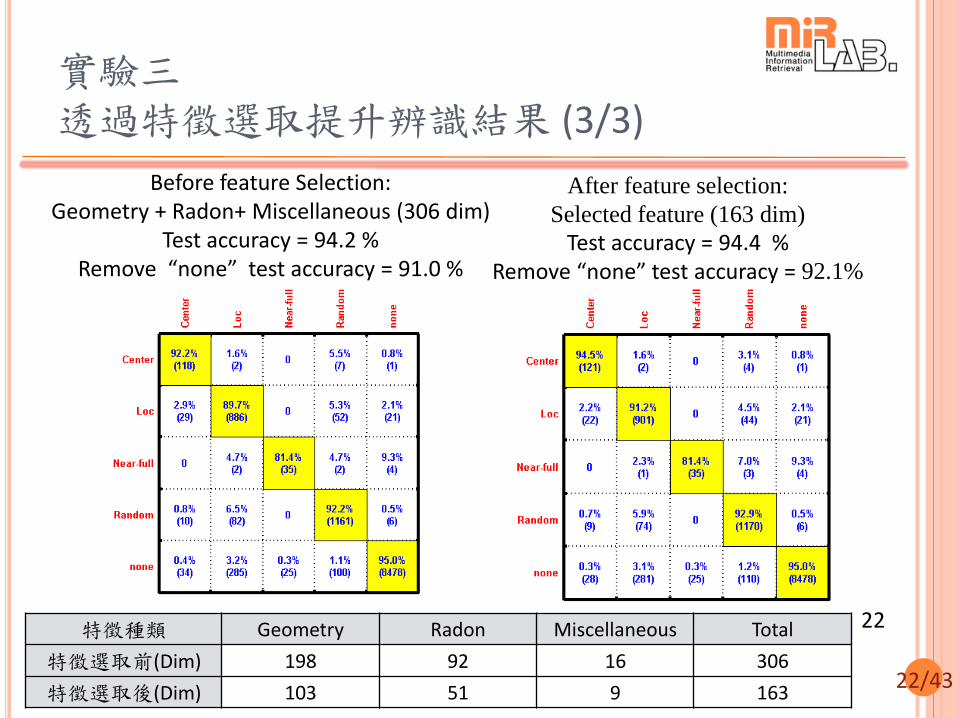
實驗三 透過特徵選取提升辨識結果 (3/3)
22
Before feature Selection: Geometry + Radon+ Miscellaneous (306 dim)
Test accuracy = 94.2 % Remove “none” test accuracy = 91.0 %
After feature selection:
Selected feature (163 dim)
Test accuracy = 94.4 %
Remove “none” test accuracy = 92.1%
特徵種類 Geometry Radon Miscellaneous Total
特徵選取前(Dim) 198 92 16 306
特徵選取後(Dim) 103 51 9 163
23/43
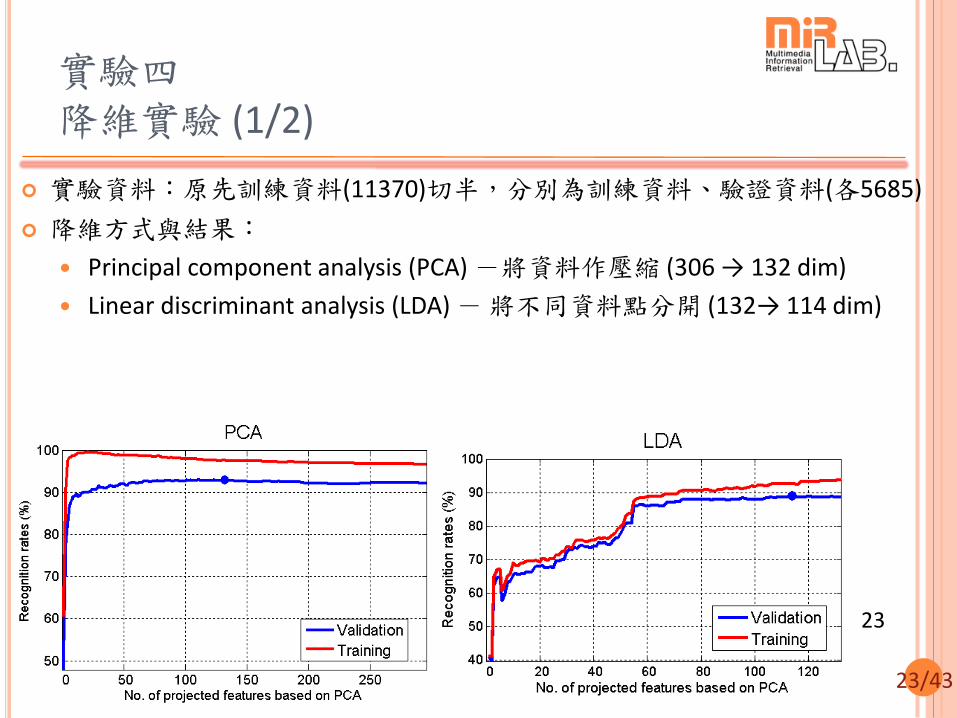
實驗四 降維實驗 (1/2)
實驗資料:原先訓練資料(11370)切半,分別為訓練資料、驗證資料(各5685)
降維方式與結果:
Principal component analysis (PCA) -將資料作壓縮 (306 → 132 dim)
Linear discriminant analysis (LDA) - 將不同資料點分開 (132→ 114 dim)
23
24/43
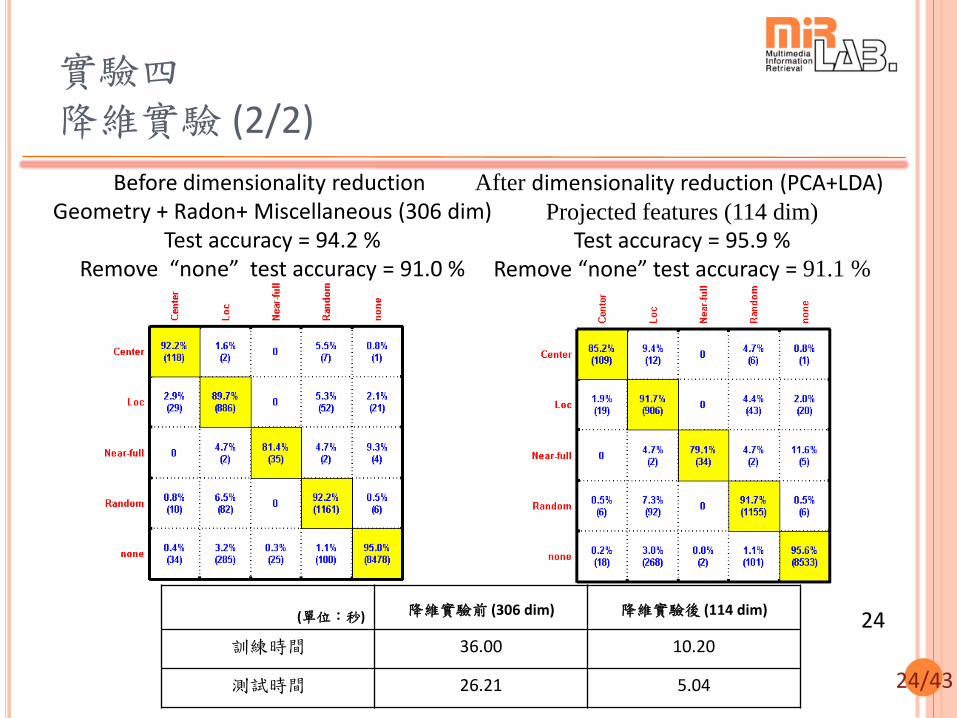
實驗四 降維實驗 (2/2)
24
After dimensionality reduction (PCA+LDA) Projected features (114 dim)
Test accuracy = 95.9 %
Remove “none” test accuracy = 91.1 %
Before dimensionality reduction Geometry + Radon+ Miscellaneous (306 dim)
Test accuracy = 94.2 % Remove “none” test accuracy = 91.0 %
(單位:秒) 降維實驗前 (306 dim) 降維實驗後 (114 dim)
訓練時間 36.00 10.20
測試時間 26.21 5.04
25/43
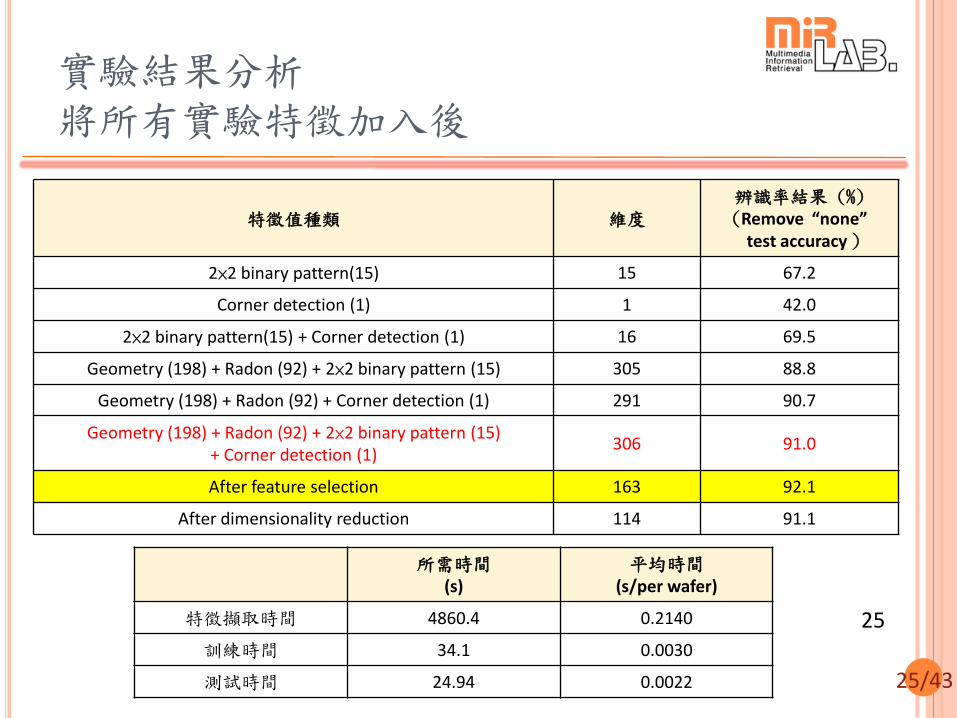
實驗結果分析 將所有實驗特徵加入後
25
特徵值種類 維度 辨識率結果 (%) (Remove “none” test accuracy )
2×2 binary pattern(15) 15 67.2
Corner detection (1) 1 42.0
2×2 binary pattern(15) + Corner detection (1) 16 69.5
Geometry (198) + Radon (92) + 2×2 binary pattern (15) 305 88.8
Geometry (198) + Radon (92) + Corner detection (1) 291 90.7
Geometry (198) + Radon (92) + 2×2 binary pattern (15) + Corner detection (1)
306 91.0
After feature selection 163 92.1
After dimensionality reduction 114 91.1
所需時間 (s)
平均時間 (s/per wafer)
特徵擷取時間 4860.4 0.2140
訓練時間 34.1 0.0030
測試時間 24.94 0.0022
26/43
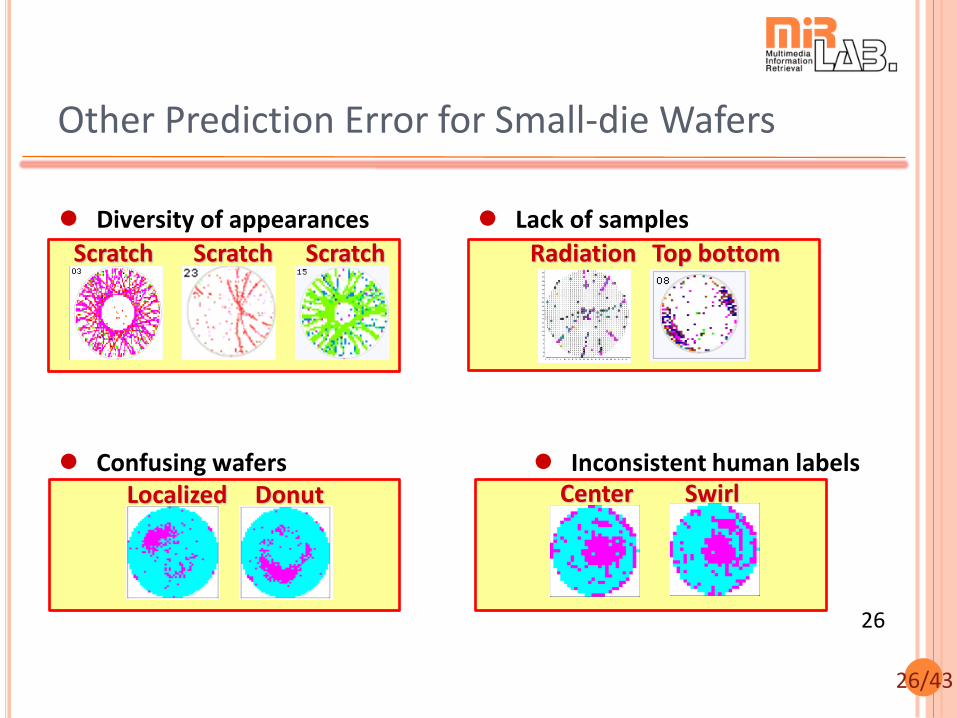
Other Prediction Error for Small-die Wafers
26
Localized Donut
Scratch Scratch Scratch
Center Swirl
Radiation Top bottom
Diversity of appearances
Confusing wafers
Lack of samples
Inconsistent human labels
27/43
本研究對TSMC的實際效益
以台積電為例,2013年第一季生產的晶圓高達388萬片,平均每日製造的晶圓約為4.3萬片,人工觀察晶圓圖勢必過於耗時。我們的系統也相當有效率,以一台個人電腦的運算能力而言 ,只需約1.4個小時即可處理一日的產能。
經過專家評估,假設本系統每天將替工程師節省一小時工時,假設平均每天有100個工程師使用 ,則一年約250個工作天即可省下25000小時,每年創造的經濟效益約100萬美元。
目前此項技術已經在台積電上線(計畫的上線率低於10%),各廠生產的晶圓都會透過本系統來進行檢查,證明了本系統的有效性與可靠性。
27
28/43
Current Status
獲得「2014 IPPR技術創新暨產業應用獎」優等獎
論文發表
Ming-Ju Wu, Jyh-Shing Roger Jang, and Jui-Long Chen, "Wafer Map Failure Pattern Recognition and Similarity Ranking for Large-scale Datasets", IEEE Trans. on Semiconductor Manufacturing, 2015.
晶圓錯誤樣式辨識的設計與改進 (Design And Improvement of Wafer Failure Pattern Recognition) , 林坤優,清華大學碩士論文,2014.
Singing Voice Separation and Pitch Extraction from Monaural Polyphonic
Audio Music Via DNN and Adaptive Pitch Tracking
張智星 Multimedia Information Retrieval Lab
Dept. of CSIE, National Taiwan University
30/43
Introduction
Singing voice separation (SVS) Extract singing voice from polyphonic audio music
Applications
Singing identification
Lyrics recognition & alignment
Singing assistance for karaoke
Audio melody extraction (AME) Extract major pitch from polyphonic audio music
Applications
Cover song identification
Database construction for query by singing/humming
Singing scoring
Proposed approaches DNN for SVS, adaptive-UPDUDP for AME
31/43
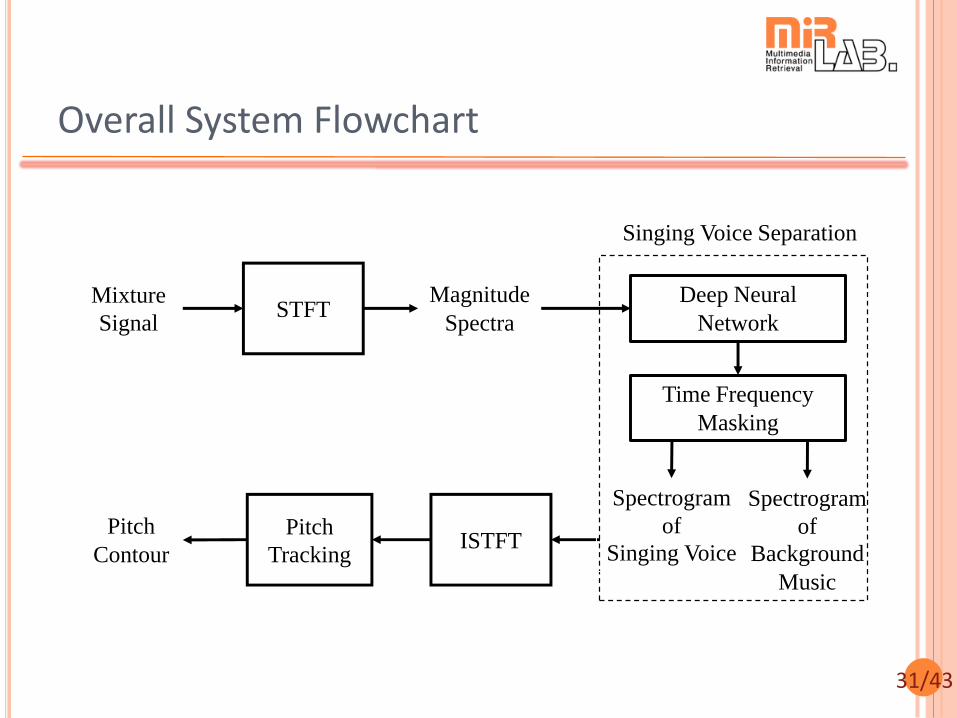
Overall System Flowchart
Mixture
Signal
Magnitude
Spectra
Deep Neural
Network
Time Frequency
Masking
Spectrogram
of
Background
Music
Pitch
Contour
Singing Voice Separation
STFT
ISTFTPitch
Tracking
Spectrogram
of
Singing Voice
32/43
Steps in Singing Voice Separation
Convert music into spectrogram Short-time Fourier transform (STFT)
Mixture, voice, background music (b.g.m.)
Deep neural network (DNN) Nonlinear mapping from mixture spect. to vocal and b.g.m.
spect.
Activation function : Sigmoid
Objective function : Square error
Gradient Optimization : RMSProp
Dropout rate : 0.5
GPU used : true
Convert voice spectrogram into music Inverse short-time Fourier transform (ISTFT)
33/43
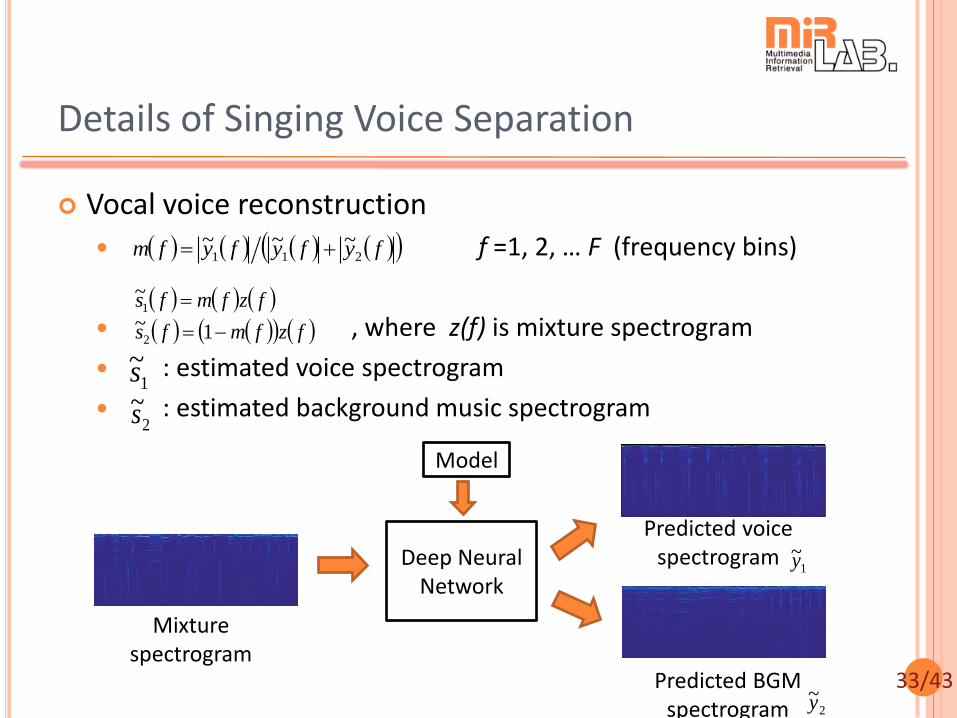
Vocal voice reconstruction
f =1, 2, … F (frequency bins)
, where z(f) is mixture spectrogram
: estimated voice spectrogram
: estimated background music spectrogram
Details of Singing Voice Separation
Deep Neural Network
Mixture spectrogram
Predicted BGM spectrogram
Predicted voice spectrogram
fyfyfyfm 211~~~
fzfmfs
fzfmfs
1~
~
2
1
1~s
2~s
Model
1~y
2~y
34/43
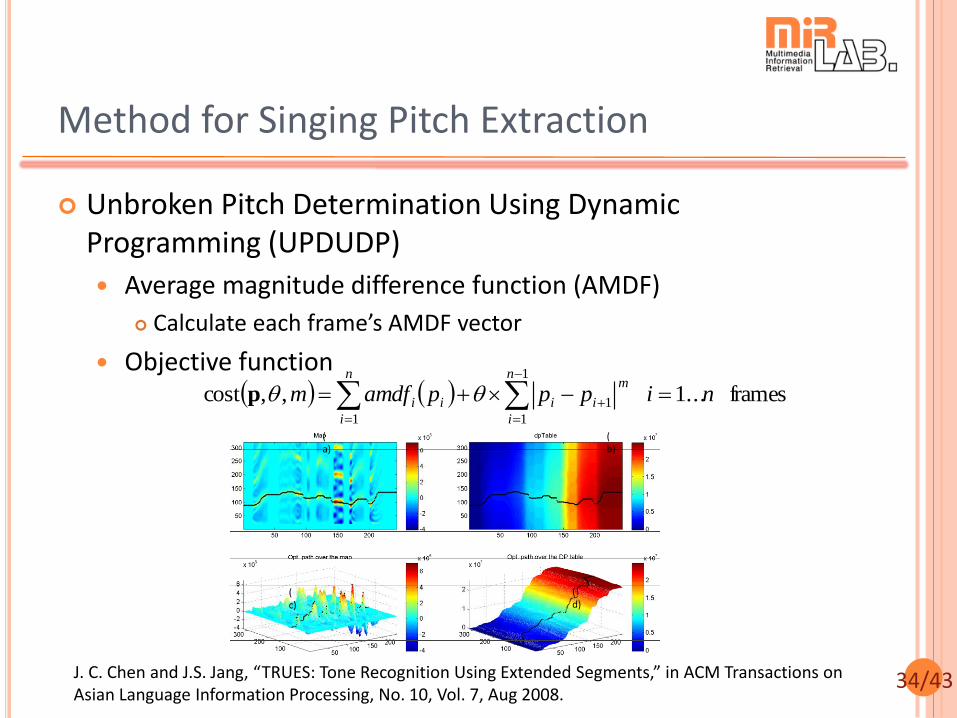
Unbroken Pitch Determination Using Dynamic Programming (UPDUDP)
Average magnitude difference function (AMDF)
Calculate each frame’s AMDF vector
Objective function
Method for Singing Pitch Extraction
J. C. Chen and J.S. Jang, “TRUES: Tone Recognition Using Extended Segments,” in ACM Transactions on Asian Language Information Processing, No. 10, Vol. 7, Aug 2008.
frames ...1 ,,cost1
1
1
1 nipppamdfmn
i
n
i
m
iiii
p
(a)
(b)
(c)
(d)
35/43
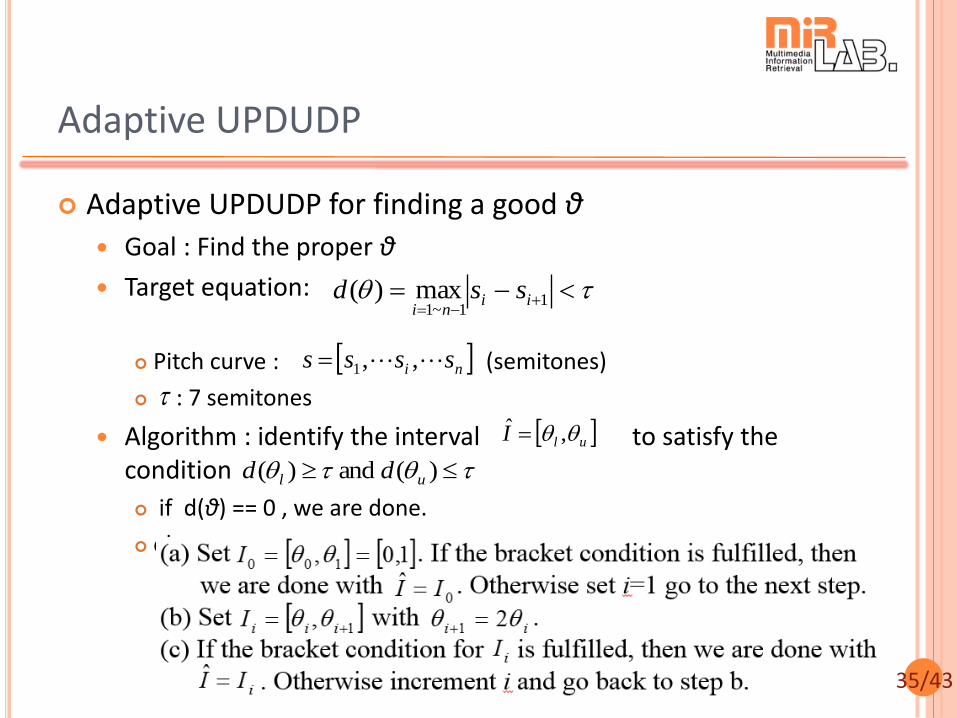
Adaptive UPDUDP for finding a good θ
Goal : Find the proper θ
Target equation:
Pitch curve : (semitones)
: 7 semitones
Algorithm : identify the interval to satisfy the condition
if d(θ) == 0 , we are done.
else
Adaptive UPDUDP
11~1
max)( iini
ssd
ni ssss ,,1
ulI ,ˆ
)( and )( ul dd
36/43
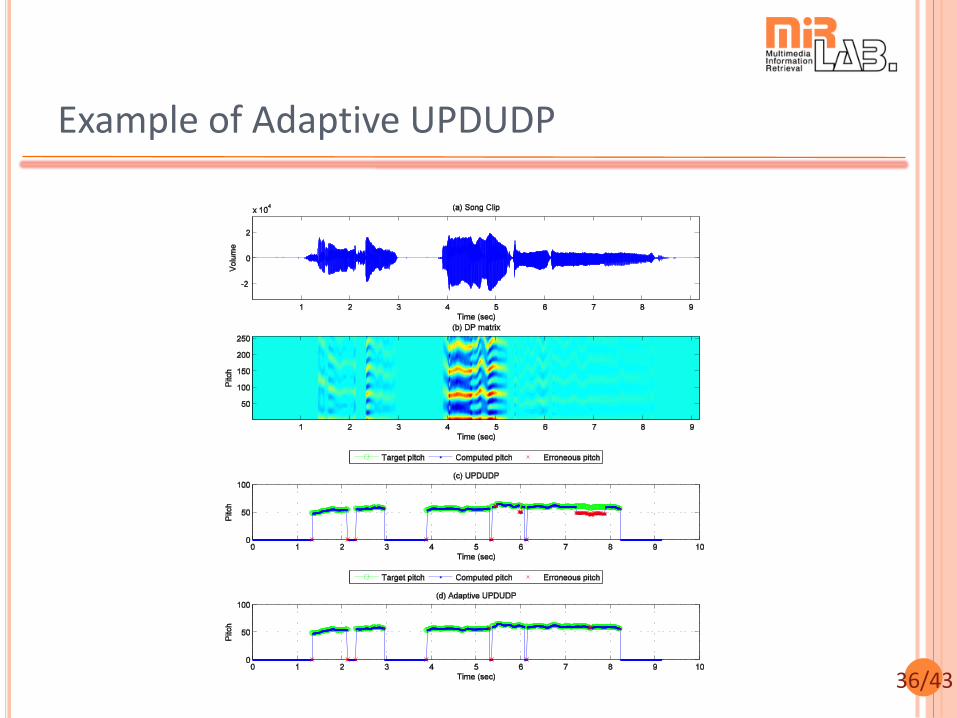
Example of Adaptive UPDUDP
37/43
Corpora for Experiments
MIR-1K dataset 1000 song clips
Durations : 4-13 secs
Sample rate : 16K Hz
110 Chinese popular karaoke songs
Sung by male and female amateurs
iKala dataset 252 song clips (public set)
Durations : 30 secs
Sample rate : 44.1K Hz
Sung by male and female professionals
38/43
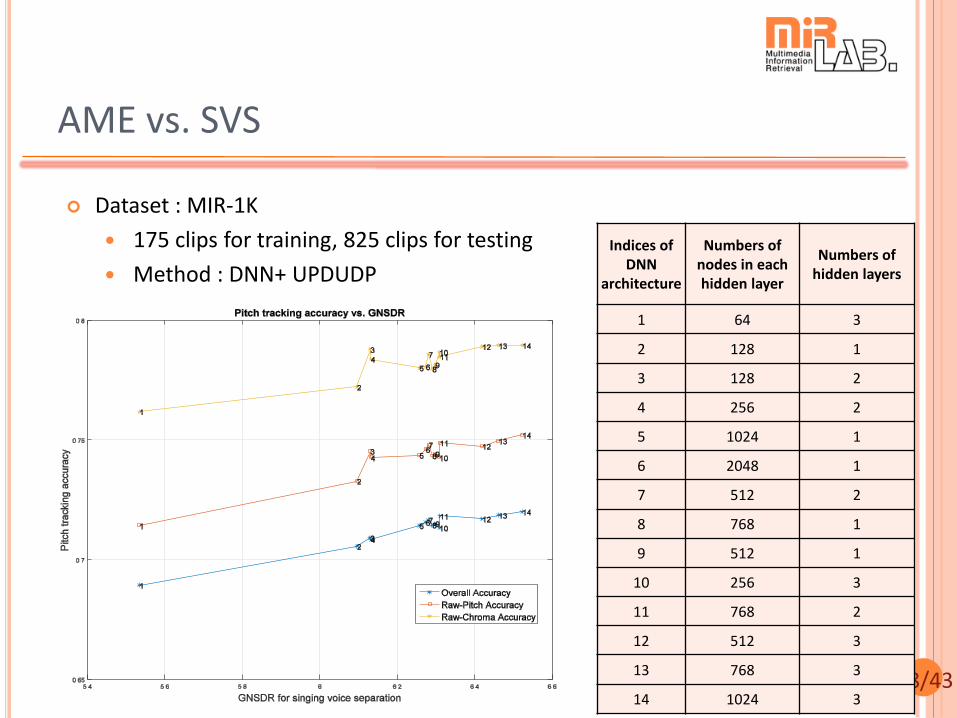
AME vs. SVS
Dataset : MIR-1K
175 clips for training, 825 clips for testing
Method : DNN+ UPDUDP
Indices of DNN
architecture
Numbers of nodes in each hidden layer
Numbers of hidden layers
1 64 3
2 128 1
3 128 2
4 256 2
5 1024 1
6 2048 1
7 512 2
8 768 1
9 512 1
10 256 3
11 768 2
12 512 3
13 768 3
14 1024 3
39/43
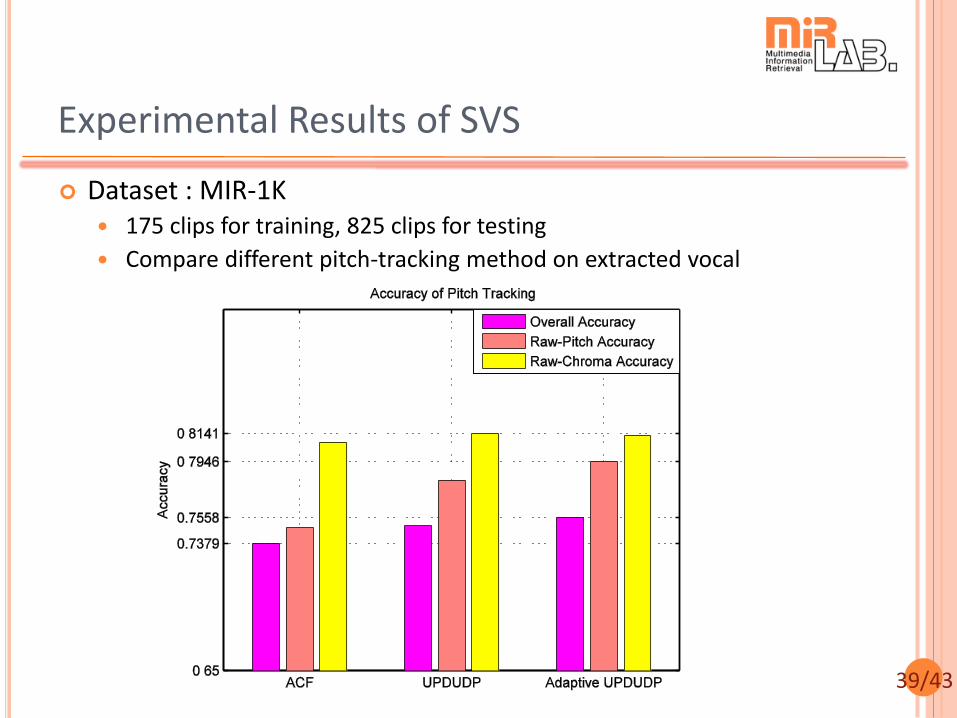
Experimental Results of SVS
Dataset : MIR-1K 175 clips for training, 825 clips for testing
Compare different pitch-tracking method on extracted vocal
40/43
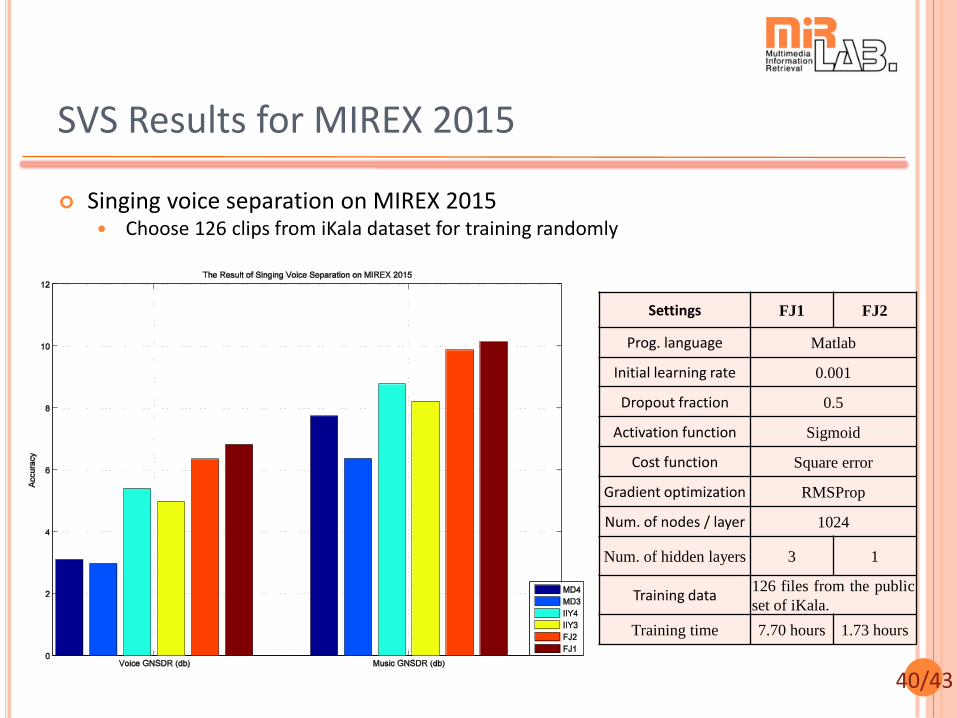
SVS Results for MIREX 2015
Singing voice separation on MIREX 2015 Choose 126 clips from iKala dataset for training randomly
Settings FJ1 FJ2
Prog. language Matlab
Initial learning rate 0.001
Dropout fraction 0.5
Activation function Sigmoid
Cost function Square error
Gradient optimization RMSProp
Num. of nodes / layer 1024
Num. of hidden layers 3 1
Training data 126 files from the public
set of iKala.
Training time 7.70 hours 1.73 hours
41/43
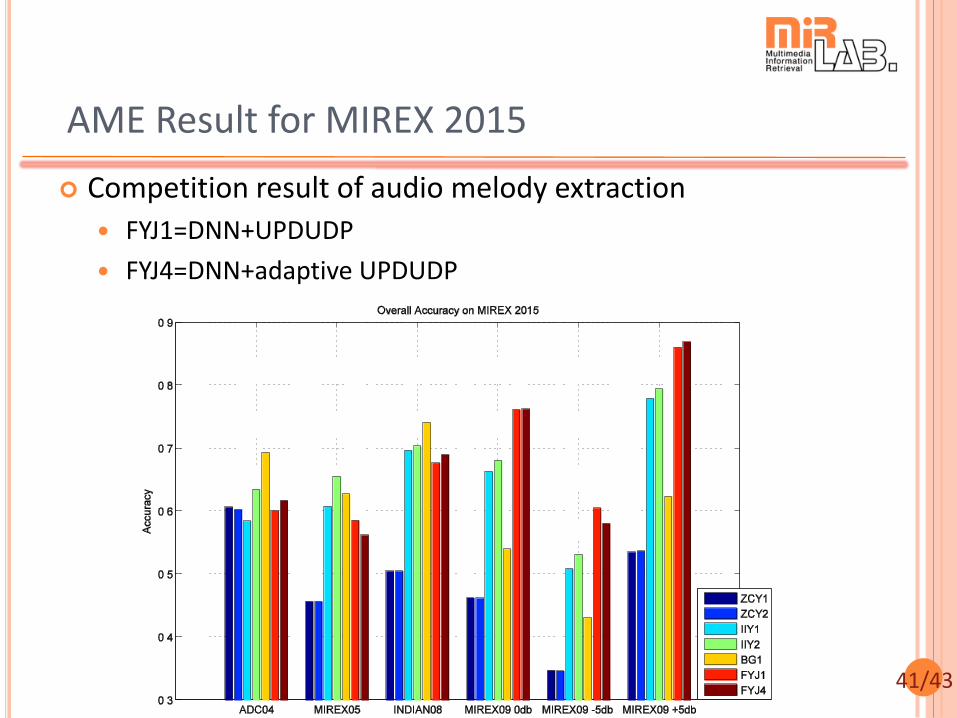
AME Result for MIREX 2015
Competition result of audio melody extraction
FYJ1=DNN+UPDUDP
FYJ4=DNN+adaptive UPDUDP
42/43
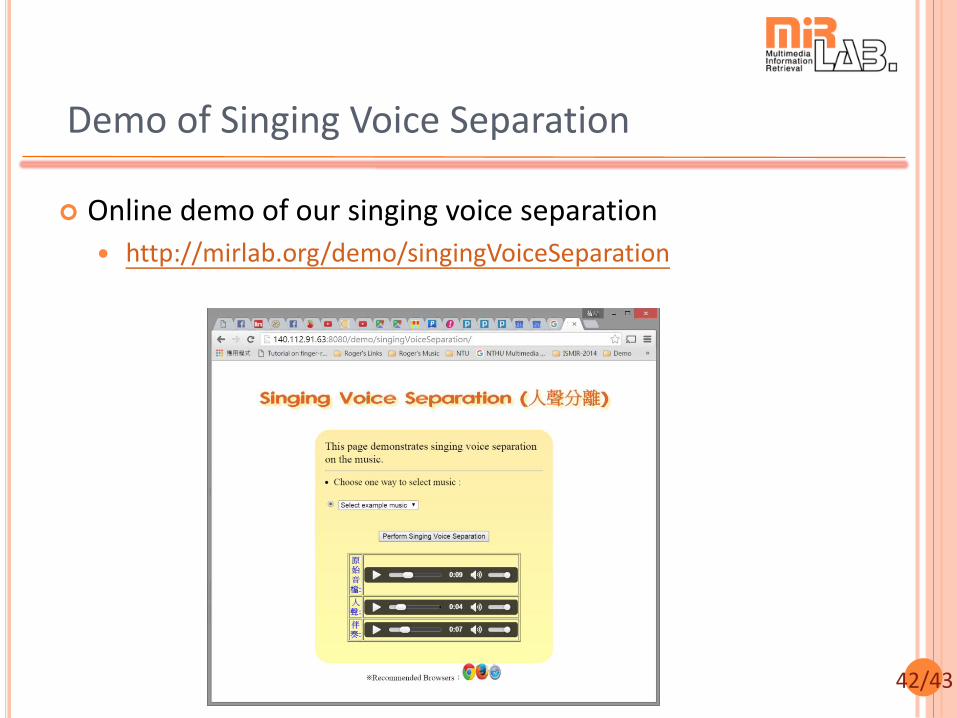
Demo of Singing Voice Separation
Online demo of our singing voice separation
http://mirlab.org/demo/singingVoiceSeparation
43/43
Conclusions
Data science is on the rise!
Big data, machine learning, data mining…
Thanks go to …
TSMC
Terasoft