Embed Size (px)
Citation preview

8/3/2019 Canada Imf
http://slidepdf.com/reader/full/canada-imf 1/54
©2011 International Monetary Fund
IMF Country Report No. 11/364
CANADA2011 ARTICLE IV CONSULTATION
Under Article IV of the IMF’s Articles of Agreement, the IMF holds bilateral discussions with
members, usually every year. In the context of the 2011 Article IV consultation with Canada,
the following documents have been released and are included in this package:
Staff Report for the 2011 Article IV consultation, prepared by a staff team of the IMF,
following discussions that ended on October 24, 2011, with the officials of Canada on
economic developments and policies. Based on information available at the time of these
discussions, the staff report was completed on November 23, 2011. The views expressed inthe staff report are those of the staff team and do not necessarily reflect the views of the
Executive Board of the IMF.
Informational Annex
Staff Statement of December 13, 2011
Public Information Notice (PIN) summarizing the views of the Executive Board as
expressed during its December 19, 2011 discussion of the staff report that concluded the
Article IV consultation.
The document listed below has been or will be separately released.
Selected Issues Paper
The policy of publication of staff reports and other documents allows for the deletion of
market-sensitive information.
Copies of this report are available to the public from
International Monetary Fund Publication Services
700 19th Street, N.W. Washington, D.C. 20431Telephone: (202) 623-7430 Telefax: (202) 623-7201
E-mail: [email protected] Internet: http://www.imf.org
Price: $18.00 a copy
International Monetary Fund
Washington, D.C.
December 2011
8/3/2019 Canada Imf
http://slidepdf.com/reader/full/canada-imf 2/54
pr
CANADA
STAFF REPORT FOR THE 2011 ARTICLE IV CONSULTATION
KEY ISSUES
Context. With the recovery well advanced, policies have gradually moved to a
tightening stance. The pace of the policy tightening must be balanced, with a need to
sustain economic growth under possibly significant external headwinds.
Monetary policy. The supportive monetary policy stance remains appropriate given anegative output gap, well-anchored inflationary expectations, the ongoing fiscal
consolidation, and a challenging global environment. The monetary authority has some
room to adjust policies in response to a deterioration in the outlook or renewed
turbulence in international markets.
Fiscal policy. The authorities have appropriately shifted toward fiscal consolidation.
The federal government is leading the initial fiscal effort, and regional governments are
expected to follow suit. Canada has room to respond flexibly to changes in the
economic outlook, including by allowing full operation of automatic fiscal stabilizers
should the recovery falter. A temporary stimulus could also be considered in a major
downside scenario.
Managing elevated household debt and housing prices. The authorities are closely
monitoring the housing market and have adopted macro-prudential measures to curb
mortgage growth; however, additional measures may be needed in the event of further
sustained increases in household debt and house prices, currently at historically high
levels.
Financial Sector. The Canadian banking sector is in a solid position and has weatheredwell the recent volatility in international financial markets. External headwinds pose the
main risk to the financial system, especially if they were to lead to a protracted period
of high unemployment. The authorities have appropriate instruments to quickly
provide liquidity in response to distress in global markets.
ovember 23, 2011
8/3/2019 Canada Imf
http://slidepdf.com/reader/full/canada-imf 3/54
2011 ARTICLE IV REPORT CANADA
2 INTERNATIONAL MONETARY FUND
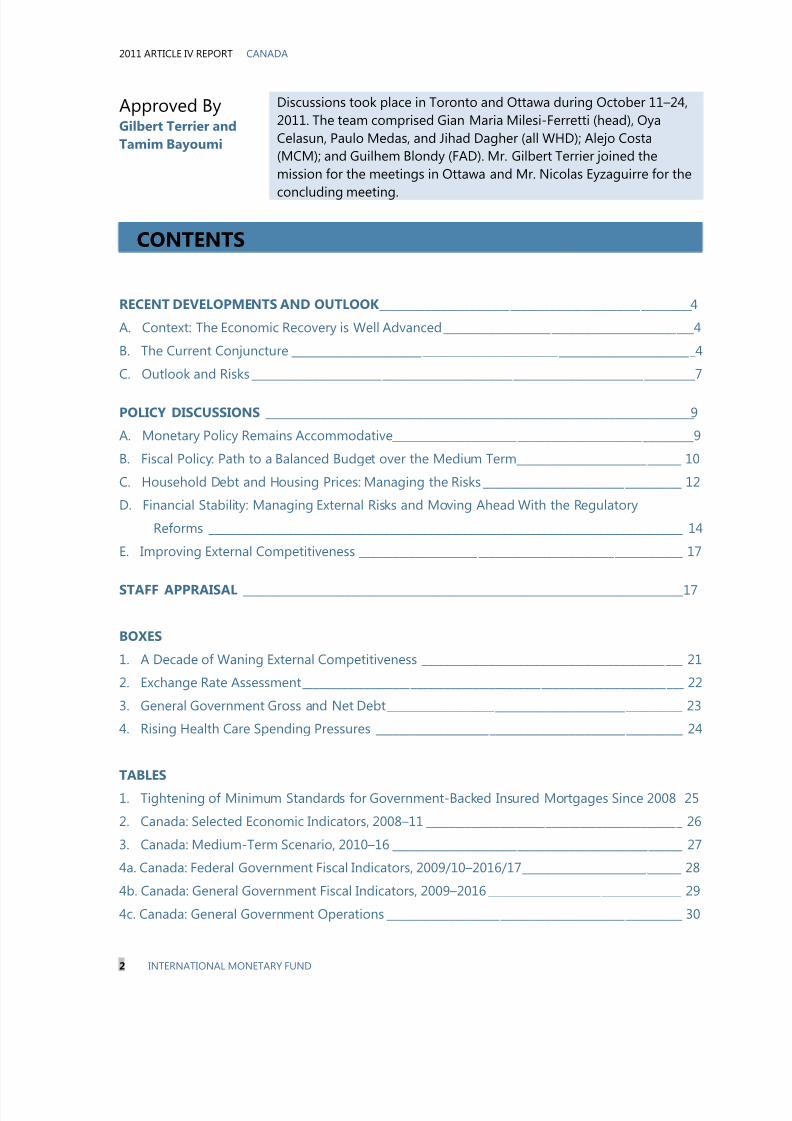
Approved ByGilbert Terrier and
Tamim Bayoumi
Discussions took place in Toronto and Ottawa during October 11–24,
2011. The team comprised Gian Maria Milesi-Ferretti (head), Oya
Celasun, Paulo Medas, and Jihad Dagher (all WHD); Alejo Costa
(MCM); and Guilhem Blondy (FAD). Mr. Gilbert Terrier joined the
mission for the meetings in Ottawa and Mr. Nicolas Eyzaguirre for the
concluding meeting.
CONTENTS
RECENT DEVELOPMENTS AND OUTLOOK _______________________________________________________4 A. Context: The Economic Recovery is Well Advanced ____________________________________________4 B. The Current Conjuncture _______________________________________________________________________4 C. Outlook and Risks ______________________________________________________________________________7 POLICY DISCUSSIONS ____________________________________________________________________________9 A. Monetary Policy Remains Accommodative _____________________________________________________9 B. Fiscal Policy: Path to a Balanced Budget over the Medium Term _____________________________ 10 C. Household Debt and Housing Prices: Managing the Risks ___________________________________ 12 D. Financial Stability: Managing External Risks and Moving Ahead With the Regulatory
Reforms ____________________________________________________________________________________ 14 E. Improving External Competitiveness _________________________________________________________ 17 STAFF APPRAISAL ______________________________________________________________________________ 17 BOXES
1. A Decade of Waning External Competitiveness ______________________________________________ 21
2. Exchange Rate Assessment ___________________________________________________________________ 22
3. General Government Gross and Net Debt ____________________________________________________ 23
4. Rising Health Care Spending Pressures ______________________________________________________ 24
TABLES
1. Tightening of Minimum Standards for Government-Backed Insured Mortgages Since 2008 25 2. Canada: Selected Economic Indicators, 2008–11 _____________________________________________ 26 3. Canada: Medium-Term Scenario, 2010–16 ___________________________________________________ 27 4a. Canada: Federal Government Fiscal Indicators, 2009/10–2016/17 ____________________________ 28 4b. Canada: General Government Fiscal Indicators, 2009–2016 __________________________________ 29 4c. Canada: General Government Operations ____________________________________________________ 30
8/3/2019 Canada Imf
http://slidepdf.com/reader/full/canada-imf 4/54
CANADA 2011 ARTICLE IV REPORT
INTERNATIONAL MONETARY FUND 3
5. Canada: Balance of Payments 2008–16 _______________________________________________________ 31 6. Canada: Indicators of External and Financial Vulnerability ____________________________________ 32 FIGURES
1. The State of Canada’s Recovery ______________________________________________________________ 33 2. Canada’s Housing Boom _____________________________________________________________________ 33 3. The Labor Market is Gradually Recovering ___________________________________________________ 35 4. External Developments _______________________________________________________________________ 36 5. Monetary Policy Remains Accommodative ___________________________________________________ 37 6. Financial Markets Continued to Face Bouts of Volatility, but Credit Conditions Remain
Favorable ___________________________________________________________________________________ 38 7. High Household Indebtedness is a Key Domestic Vulnerability ______________________________ 39 8. Fiscal Policy: The Plan to Balance _____________________________________________________________ 40
8/3/2019 Canada Imf
http://slidepdf.com/reader/full/canada-imf 5/54
2011 ARTICLE IV REPORT CANADA
4 INTERNATIONAL MONETARY FUND
RECENT DEVELOPMENTS AND OUTLOOK
A. Context: The Economic
Recovery is Well Advanced1. The Canadian economy recovered
strongly in 2010, thanks to a decisive policy
response, a resilient financial sector, and
high commodity prices. The economy
expanded well above its potential rate in 2010,
and GDP returned to pre-crisis levels in
Q3 2010 (Figure 1). Unemployment has
declined from its 2009 peak, reflecting rising
public and private employment, but is still
above 2008 levels. Both monetary and fiscal
policies have remained accommodative,
reflecting in large measure the effective
response to the crisis.
2. A key challenge facing Canada will
be to set the appropriate policy mix going
forward, at a time of high uncertainty andsignificant external headwinds. Given the
advanced stage of the recovery, a still-large
budget deficit, and the need to address long-
term fiscal challenges, fiscal policy has moved
toward a tightening stance. At the same time,
faced with an uncertain external environment
and extraordinarily low levels of U.S. interest
rates likely for a prolonged time, monetary
policy is expected to remain accommodative. A
key challenge is how to calibrate the policy
response should external conditions
deteriorate further, taking a toll on the outlook
for Canada. At the same time, the policy toolkit
may need to include macro-prudential
measures, since further sustained increases in
household debt and house prices would
increase risks to macroeconomic stability.
B. The Current Conjuncture
3. Economic growth is cooling off in
2011, reflecting an adverse external
environment and more subdued domesticdemand. After a strong first quarter, the
expansion stalled in Q2 2011, partly due to
transient factors (Japan’s earthquake and other
factors hampering energy exports) and a
weaker external environment. Domestic
demand remained the driver of growth, but at
a more moderate pace given a slowdown in
government spending and private
consumption. Business investment, on the
other hand, continued to boom, reflecting low
funding costs, cheaper imports of capital
goods, and elevated commodity prices.
4. After surging in 2010, growth in
private consumption and residential
construction has moderated, reflecting
slower growth in household incomes and
consumer credit as well as tighter mortgage
rules. Resilient household credit helped
sustain private consumption and the
construction sector during the crisis. However,
it also led to an increase in household debt to
record levels—now standing at close to
8/3/2019 Canada Imf
http://slidepdf.com/reader/full/canada-imf 6/54
CANADA 2011 ARTICLE IV REPORT
INTERNATIONAL MONETARY FUND 5
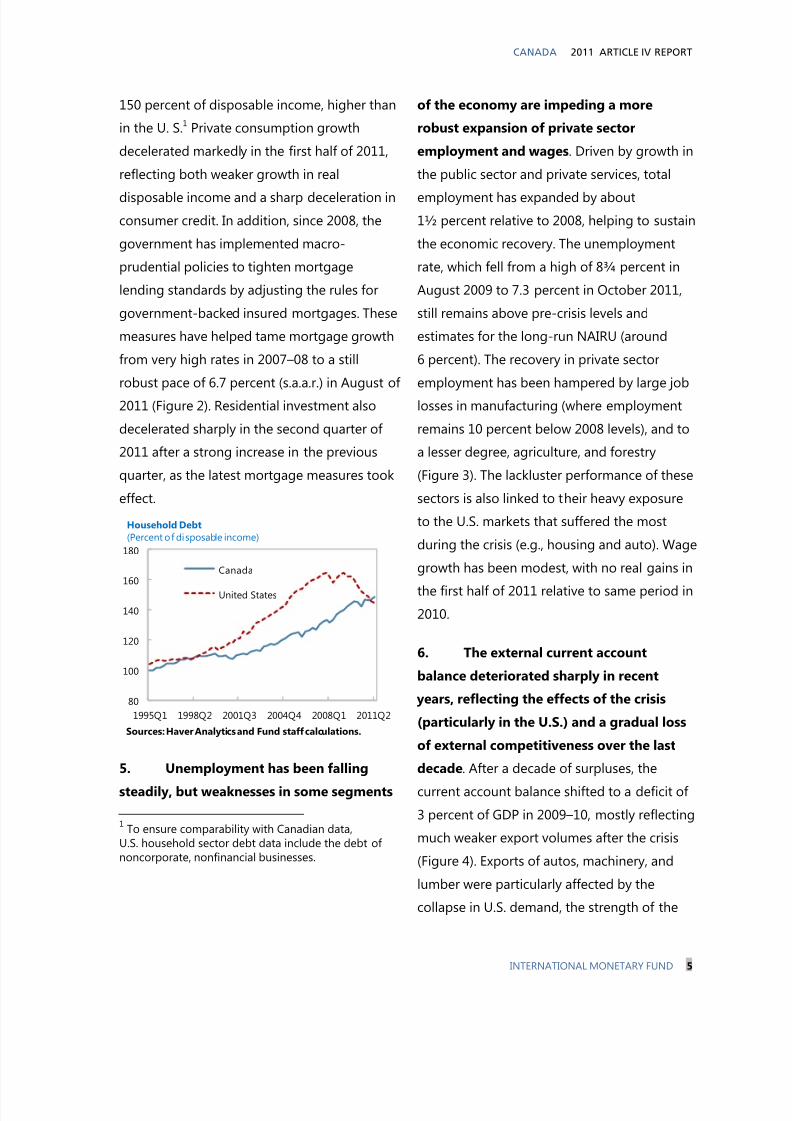
150 percent of disposable income, higher than
in the U. S.1 Private consumption growth
decelerated markedly in the first half of 2011,
reflecting both weaker growth in real
disposable income and a sharp deceleration in
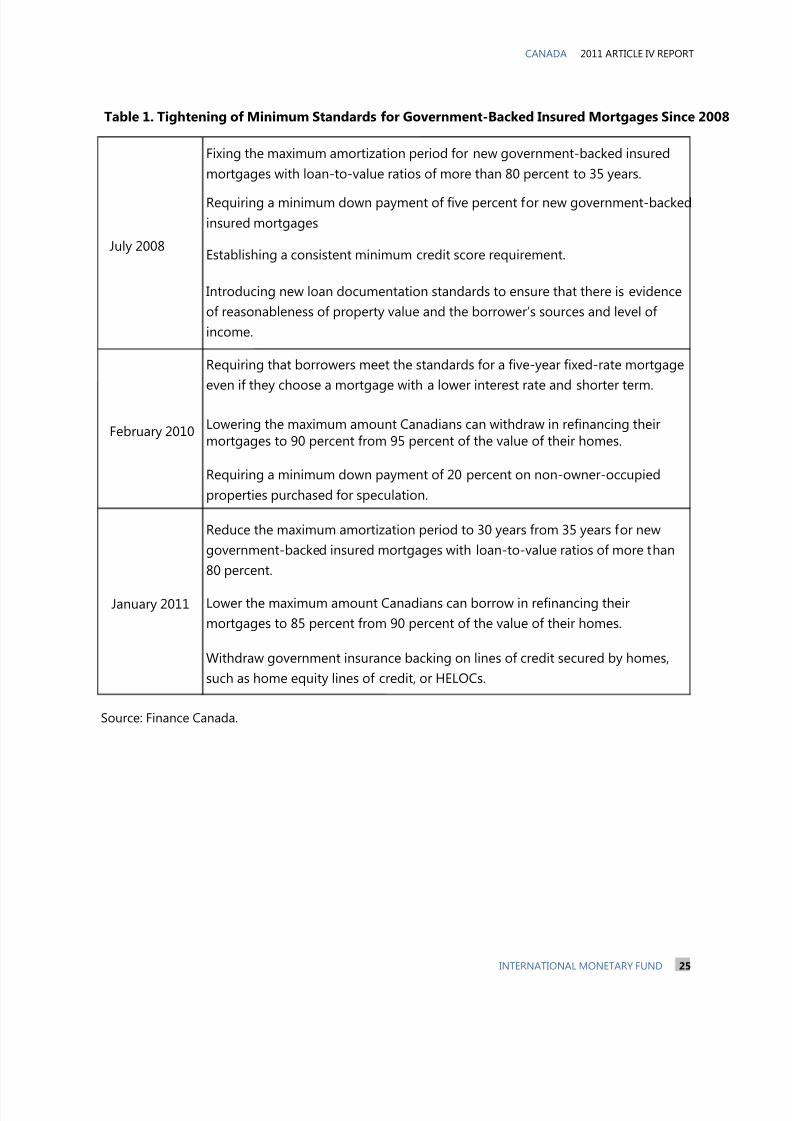
consumer credit. In addition, since 2008, the
government has implemented macro-
prudential policies to tighten mortgage
lending standards by adjusting the rules for
government-backed insured mortgages. These
measures have helped tame mortgage growth
from very high rates in 2007–08 to a still
robust pace of 6.7 percent (s.a.a.r.) in August of
2011 (Figure 2). Residential investment also
decelerated sharply in the second quarter of
2011 after a strong increase in the previous
quarter, as the latest mortgage measures took
effect.
5. Unemployment has been falling
steadily, but weaknesses in some segments
1To ensure comparability with Canadian data,
U.S. household sector debt data include the debt of noncorporate, nonfinancial businesses.
of the economy are impeding a more
robust expansion of private sector
employment and wages. Driven by growth in
the public sector and private services, total
employment has expanded by about
1½ percent relative to 2008, helping to sustain
the economic recovery. The unemployment
rate, which fell from a high of 8¾ percent in
August 2009 to 7.3 percent in October 2011,
still remains above pre-crisis levels and
estimates for the long-run NAIRU (around
6 percent). The recovery in private sector
employment has been hampered by large job
losses in manufacturing (where employment
remains 10 percent below 2008 levels), and to
a lesser degree, agriculture, and forestry
(Figure 3). The lackluster performance of these
sectors is also linked to their heavy exposure
to the U.S. markets that suffered the most
during the crisis (e.g., housing and auto). Wage
growth has been modest, with no real gains in
the first half of 2011 relative to same period in
2010.
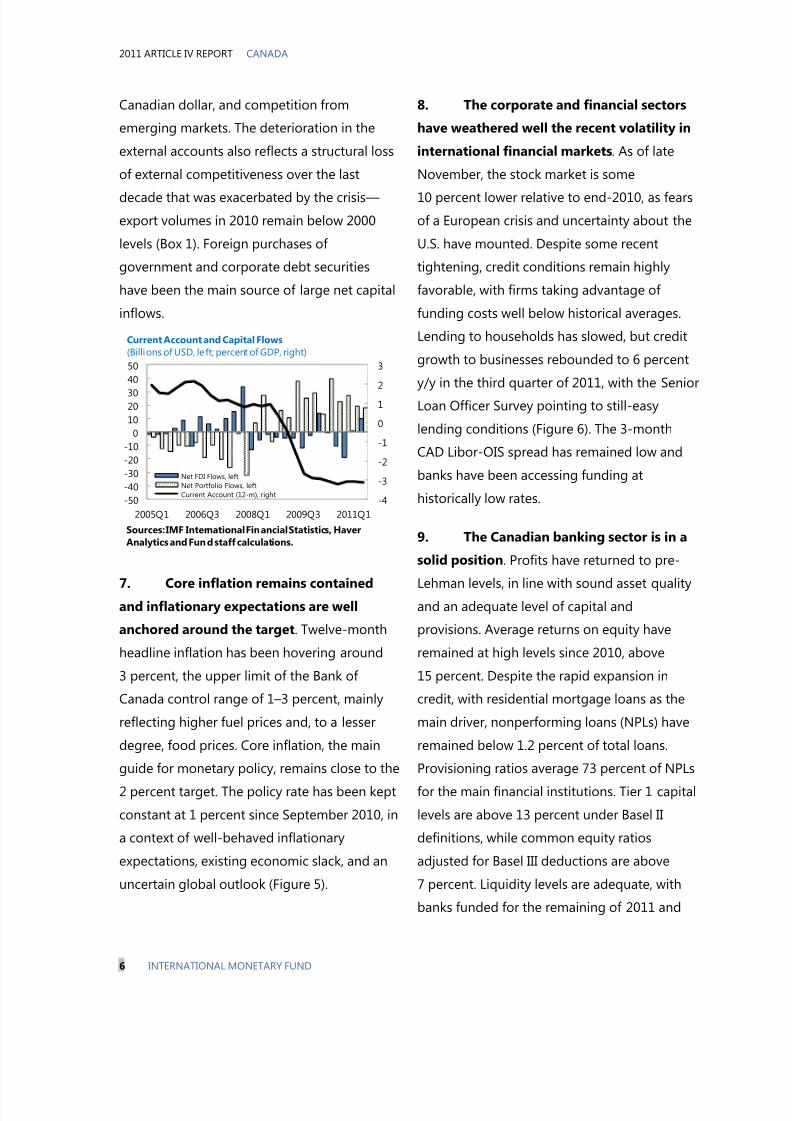
6. The external current account
balance deteriorated sharply in recent
years, reflecting the effects of the crisis
(particularly in the U.S.) and a gradual loss
of external competitiveness over the last
decade. After a decade of surpluses, the
current account balance shifted to a deficit of
3 percent of GDP in 2009–10, mostly reflecting
much weaker export volumes after the crisis
(Figure 4). Exports of autos, machinery, and
lumber were particularly affected by the
collapse in U.S. demand, the strength of the
80
100
120
140
160
180
1995Q1 1998Q2 2001Q3 2004Q4 2008Q1 2011Q2
Canada
United States
Household Debt
(Percent of disposable income)
Sources: Haver Analytics and Fund staff calculations.
8/3/2019 Canada Imf
http://slidepdf.com/reader/full/canada-imf 7/54
2011 ARTICLE IV REPORT CANADA
6 INTERNATIONAL MONETARY FUND
Canadian dollar, and competition from
emerging markets. The deterioration in the
external accounts also reflects a structural loss
of external competitiveness over the last
decade that was exacerbated by the crisis—
export volumes in 2010 remain below 2000
levels (Box 1). Foreign purchases of
government and corporate debt securities
have been the main source of large net capital
inflows.
7. Core inflation remains containedand inflationary expectations are well
anchored around the target. Twelve-month
headline inflation has been hovering around
3 percent, the upper limit of the Bank of
Canada control range of 1–3 percent, mainly
reflecting higher fuel prices and, to a lesser
degree, food prices. Core inflation, the main
guide for monetary policy, remains close to the
2 percent target. The policy rate has been kept
constant at 1 percent since September 2010, in
a context of well-behaved inflationary
expectations, existing economic slack, and an
uncertain global outlook (Figure 5).
8. The corporate and financial sectors
have weathered well the recent volatility in
international financial markets. As of late
November, the stock market is some
10 percent lower relative to end-2010, as fears
of a European crisis and uncertainty about the
U.S. have mounted. Despite some recent
tightening, credit conditions remain highly
favorable, with firms taking advantage of
funding costs well below historical averages.
Lending to households has slowed, but credit
growth to businesses rebounded to 6 percent
y/y in the third quarter of 2011, with the Senior
Loan Officer Survey pointing to still-easy
lending conditions (Figure 6). The 3-month
CAD Libor-OIS spread has remained low and
banks have been accessing funding at
historically low rates.
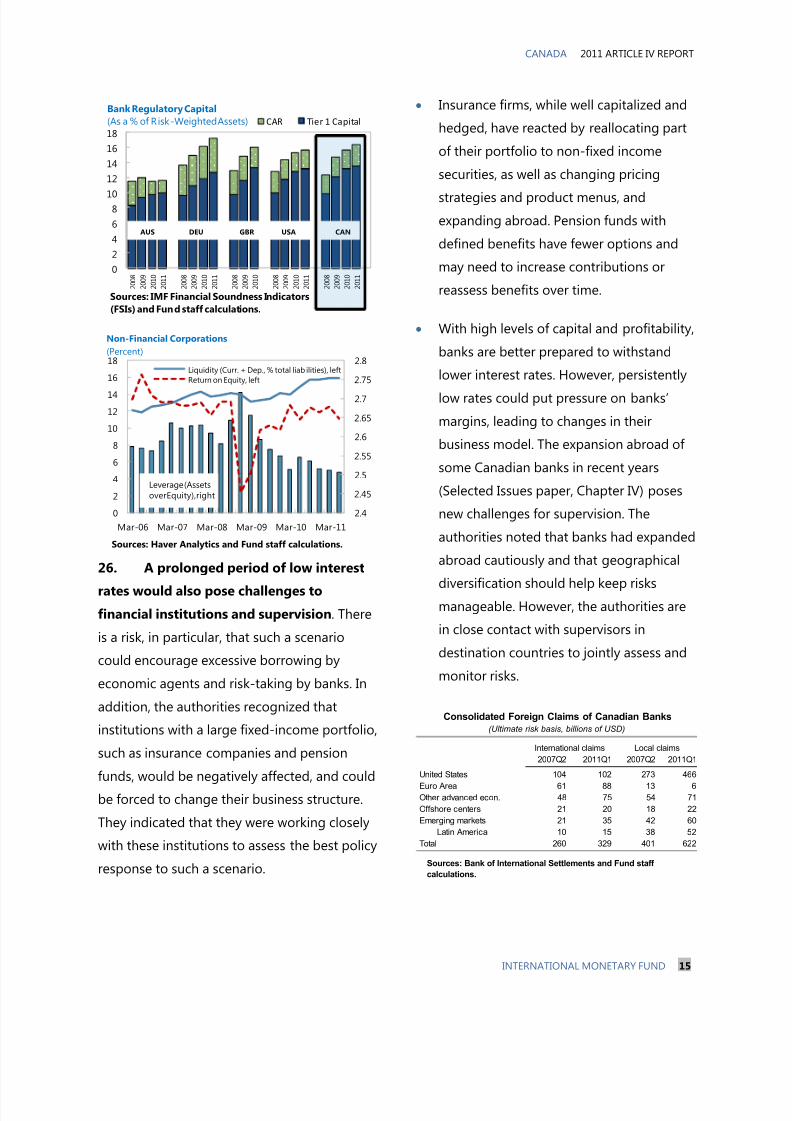
9. The Canadian banking sector is in a
solid position. Profits have returned to pre-
Lehman levels, in line with sound asset qualityand an adequate level of capital and
provisions. Average returns on equity have
remained at high levels since 2010, above
15 percent. Despite the rapid expansion in
credit, with residential mortgage loans as the
main driver, nonperforming loans (NPLs) have
remained below 1.2 percent of total loans.
Provisioning ratios average 73 percent of NPLs
for the main financial institutions. Tier 1 capital
levels are above 13 percent under Basel II
definitions, while common equity ratios
adjusted for Basel III deductions are above
7 percent. Liquidity levels are adequate, with
banks funded for the remaining of 2011 and
-4
-3
-2
-1
0
1
2
3
-50
-40
-30
-20
-10
0
10
2030
40
50
2005Q1 2006Q3 2008Q1 2009Q3 2011Q1
Net FDI Flows, left
Net Portfolio Flows, left
Current Account (12-m), right
Current Account and Capital Flows
(Billions of USD, le ft; percent of GDP, right)
Sources: IMF International Financial Statistics, Haver
Analytics and Fund staff calculations.
8/3/2019 Canada Imf
http://slidepdf.com/reader/full/canada-imf 8/54
CANADA 2011 ARTICLE IV REPORT
INTERNATIONAL MONETARY FUND 7
most of 2012. The market for covered bonds is
developing rapidly, with total issuance by
Canadian financial institutions reaching
C$40 billion by 2011.
C. Outlook and Risks
10. The economy is expected to grow at
a moderate pace over the next quarters,
with easy financial conditions and still-high
commodity prices supporting domestic
demand. Recent indicators point to a rebound
in the second half of this year, as some of the
transitory factors that led to a contraction inQ2 dissipate. However, the outlook remains
uncertain. Consumer confidence is at the
lowest levels in two years and business
sentiment is less positive than earlier in 2011.
Staff projects growth to decelerate to around
2 percent on average in 2011 and 2012,
constrained by weak external demand and
ongoing fiscal adjustment. Private demand will
remain the driving force behind growth, with
investment expected to play a key role. Several
large projects in the energy and mining sector
are in the pipeline and firms are expected to
take advantage of very favorable funding
conditions and cheaper imports of capital
goods (due to a strong Canadian dollar).
11. With weaker terms of trade, the
current account deficit is projected to
deteriorate to 3¾ percent of GDP in 2012.
With foreign demand remaining lackluster in
the near term and weaker oil prices and terms
of trade, the current account deficit is
projected to remain around 3½ percent of
GDP over the 2011–13 period. The recovery in
the U.S. economy is expected to lead to a
stronger trade balance over time, but
rebalancing would be eased by a weaker
Canadian dollar, which staff assesses to be on
the strong side of medium-term fundamentals
(Box 2). This would help offset slower growth
of domestic demand needed to raise domestic
savings, as the envisioned fiscal consolidation
is implemented.
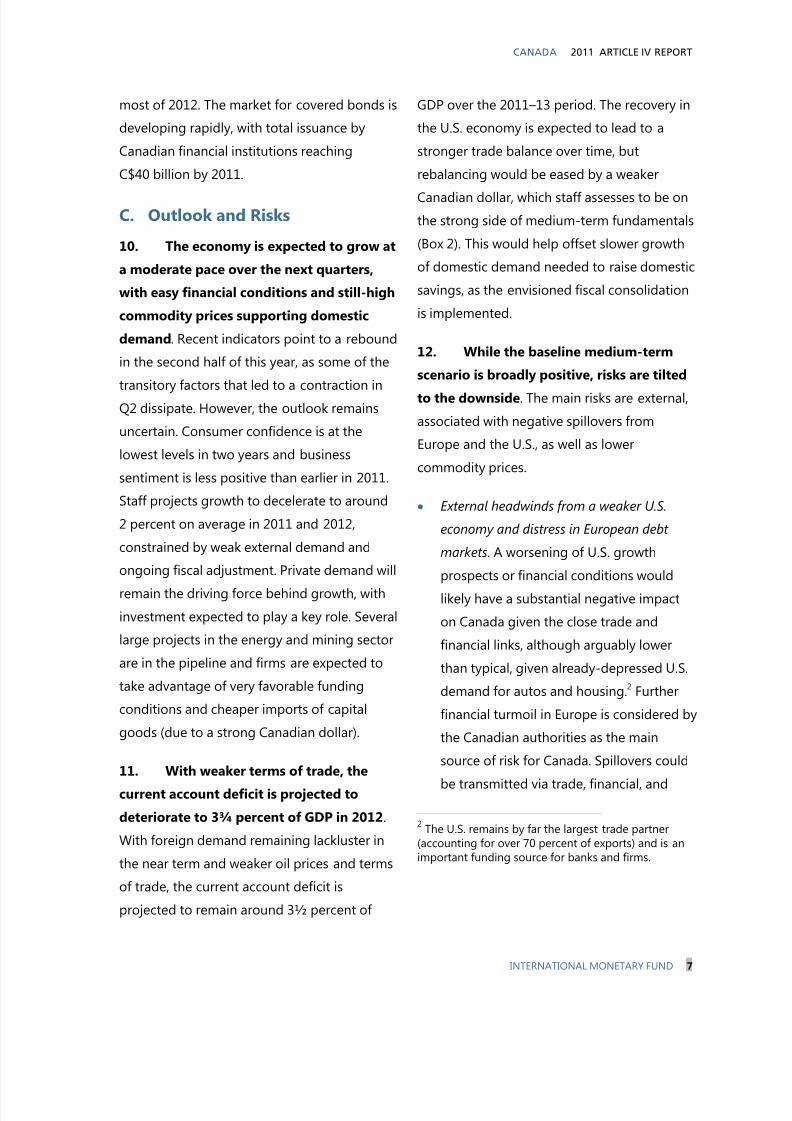
12. While the baseline medium-term
scenario is broadly positive, risks are tilted
to the downside. The main risks are external,
associated with negative spillovers from
Europe and the U.S., as well as lower
commodity prices.
External headwinds from a weaker U.S.
economy and distress in European debt
markets. A worsening of U.S. growth
prospects or financial conditions would
likely have a substantial negative impact
on Canada given the close trade and
financial links, although arguably lower
than typical, given already-depressed U.S.
demand for autos and housing.2 Further
financial turmoil in Europe is considered by
the Canadian authorities as the main
source of risk for Canada. Spillovers could
be transmitted via trade, financial, and
2The U.S. remains by far the largest trade partner
(accounting for over 70 percent of exports) and is animportant funding source for banks and firms.
8/3/2019 Canada Imf
http://slidepdf.com/reader/full/canada-imf 9/54
2011 ARTICLE IV REPORT CANADA
8 INTERNATIONAL MONETARY FUND
confidence channels. While direct trade
and financial linkages are relatively
modest, indirect spillovers could be
significant, operating through a decline in
equity prices, falling consumer and
business confidence, and higher funding
costs and lower liquidity for banks leading
to tighter financial conditions.
Lower commodity prices. These could result
from weaker activity in Europe and/or the
United States, but also from a slowdown in
emerging markets, especially in China. A
large deterioration in the terms of trade in
a context of weak global demand would
imply a widening in the current account
deficit3 and would affect Western
provinces—where house prices, investment
in commodity projects, and fiscal revenue
linked to commodities are particularly
high—most severely. However, the impact
of a decline in commodity prices on theeconomy and the external accounts would
likely be cushioned by a depreciating
currency, as the Canadian dollar has
historically been strongly correlated with
commodity prices.
On the upside, a successful resolution of
Europe’s sovereign debt crisis and quicker
resumption of solid growth in the U.S.
3The 2011 current account evaluated at the 2005
terms of trade would show a deficit of 5¾ percent of GDP.
would likely lead to a rebound in Canadian
exports and boost consumer and business
confidence.
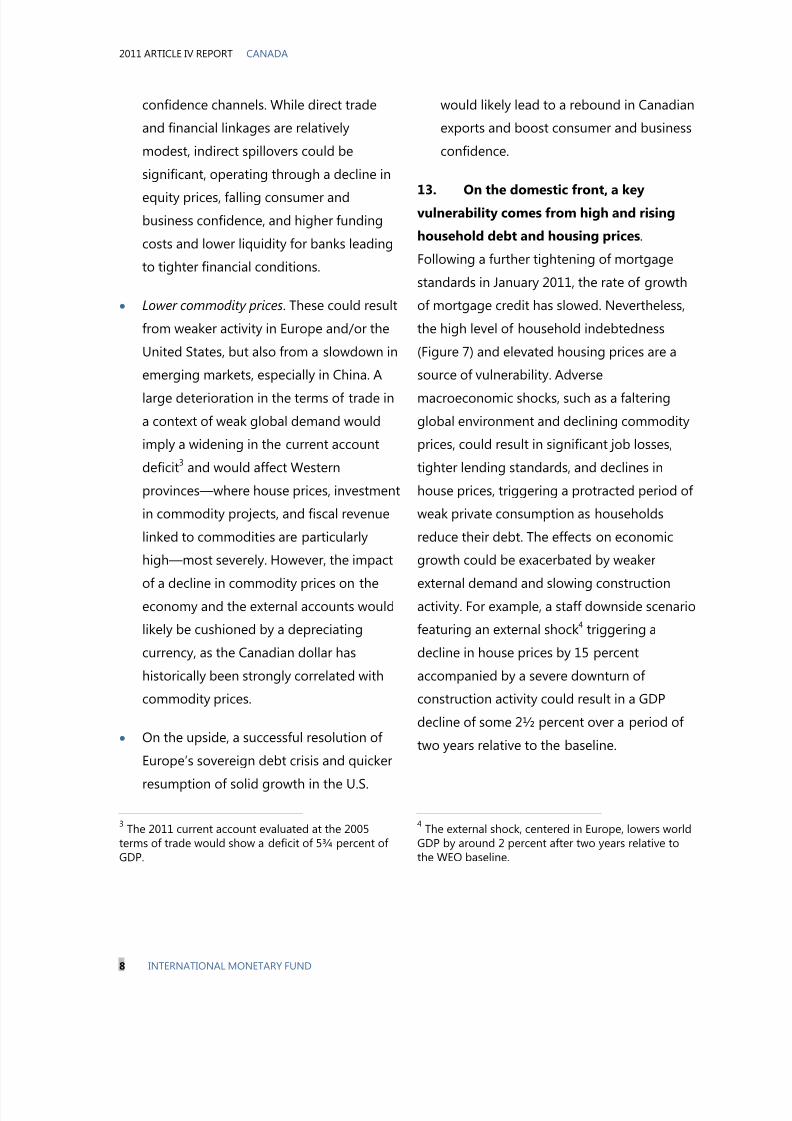
13. On the domestic front, a keyvulnerability comes from high and rising
household debt and housing prices.
Following a further tightening of mortgage
standards in January 2011, the rate of growth
of mortgage credit has slowed. Nevertheless,
the high level of household indebtedness
(Figure 7) and elevated housing prices are a
source of vulnerability. Adverse
macroeconomic shocks, such as a faltering
global environment and declining commodity
prices, could result in significant job losses,
tighter lending standards, and declines in
house prices, triggering a protracted period of
weak private consumption as households
reduce their debt. The effects on economic
growth could be exacerbated by weaker
external demand and slowing constructionactivity. For example, a staff downside scenario
featuring an external shock4 triggering a
decline in house prices by 15 percent
accompanied by a severe downturn of
construction activity could result in a GDP
decline of some 2½ percent over a period of
two years relative to the baseline.
4The external shock, centered in Europe, lowers world
GDP by around 2 percent after two years relative tothe WEO baseline.
8/3/2019 Canada Imf
http://slidepdf.com/reader/full/canada-imf 10/54
CANADA 2011 ARTICLE IV REPORT
INTERNATIONAL MONETARY FUND 9
POLICY DISCUSSIONS
Discussions centered on the challenges to
manage the transition to a neutral
macroeconomic policy stance in an unsettled external environment, while pressing ahead
with the reforms needed to address long-term
fiscal challenges; the potential risks posed by
elevated household debt in the context of
buoyant house prices and an uncertain
economic outlook; and how to move forward
with the domestic and international reform
agenda for financial regulation and supervision.
A. Monetary Policy Remains
Accommodative
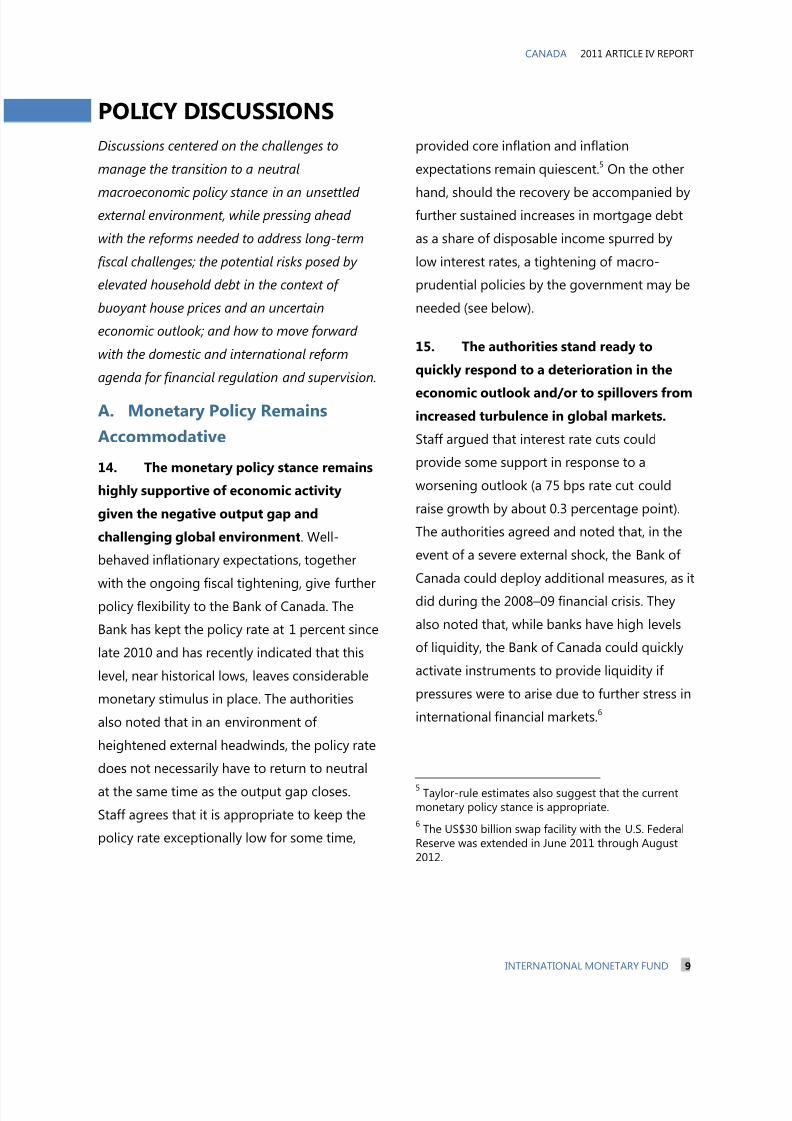
14. The monetary policy stance remains
highly supportive of economic activity
given the negative output gap and
challenging global environment. Well-
behaved inflationary expectations, together
with the ongoing fiscal tightening, give furtherpolicy flexibility to the Bank of Canada. The
Bank has kept the policy rate at 1 percent since
late 2010 and has recently indicated that this
level, near historical lows, leaves considerable
monetary stimulus in place. The authorities
also noted that in an environment of
heightened external headwinds, the policy rate
does not necessarily have to return to neutral
at the same time as the output gap closes.
Staff agrees that it is appropriate to keep the
policy rate exceptionally low for some time,
provided core inflation and inflation
expectations remain quiescent.5 On the other
hand, should the recovery be accompanied byfurther sustained increases in mortgage debt
as a share of disposable income spurred by
low interest rates, a tightening of macro-
prudential policies by the government may be
needed (see below).
15. The authorities stand ready to
quickly respond to a deterioration in the
economic outlook and/or to spillovers from
increased turbulence in global markets.
Staff argued that interest rate cuts could
provide some support in response to a
worsening outlook (a 75 bps rate cut could
raise growth by about 0.3 percentage point).
The authorities agreed and noted that, in the
event of a severe external shock, the Bank of
Canada could deploy additional measures, as it
did during the 2008–09 financial crisis. They
also noted that, while banks have high levels
of liquidity, the Bank of Canada could quickly
activate instruments to provide liquidity if
pressures were to arise due to further stress in
international financial markets.6
5 Taylor-rule estimates also suggest that the currentmonetary policy stance is appropriate.
6The US$30 billion swap facility with the U.S. Federal
Reserve was extended in June 2011 through August2012.
8/3/2019 Canada Imf
http://slidepdf.com/reader/full/canada-imf 11/54
2011 ARTICLE IV REPORT CANADA
10 INTERNATIONAL MONETARY FUND
16. The authorities noted that the
inflation targeting regime has served the
Canadian economy well, with the crisis
highlighting the need to react flexibly in
the face of risks to economic and financial
stability. The Government and the Bank of
Canada have just agreed to renew the inflation
targeting framework (“Inflation-Control
Target”) for a further five-year period. In the
discussions, the authorities stressed the
importance of a credible and flexible approach,
noting that monetary policy may in
exceptional circumstances be used to support
financial stability, including by varying the
horizon over which inflation is expected to
return to the target. Staff welcomed the
renewal of the inflation-control target and
agreed with the authorities’ emphasis on a
flexible approach that takes into account the
evolution of risks to the outlook and financial
stability.
B. Fiscal Policy: Path to a Balanced
Budget over the Medium Term
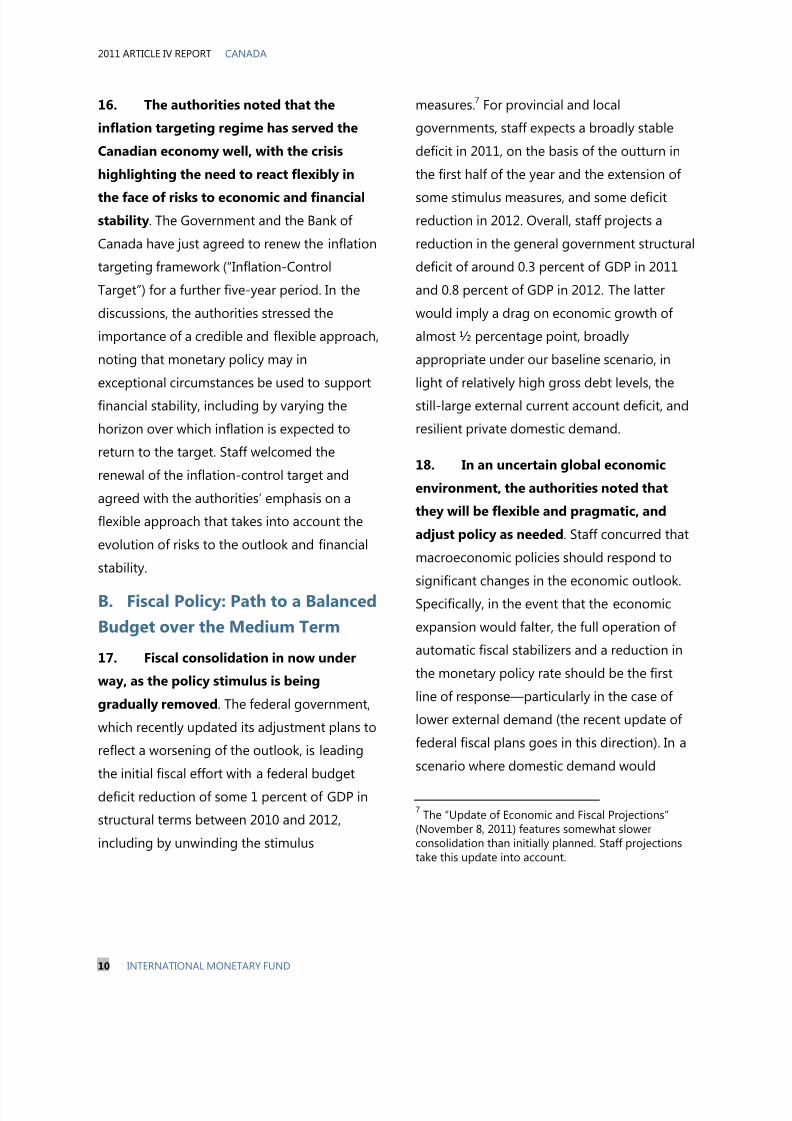
17. Fiscal consolidation in now under
way, as the policy stimulus is being
gradually removed. The federal government,
which recently updated its adjustment plans to
reflect a worsening of the outlook, is leading
the initial fiscal effort with a federal budget
deficit reduction of some 1 percent of GDP in
structural terms between 2010 and 2012,
including by unwinding the stimulus
measures.7 For provincial and local
governments, staff expects a broadly stable
deficit in 2011, on the basis of the outturn in
the first half of the year and the extension of
some stimulus measures, and some deficit
reduction in 2012. Overall, staff projects a
reduction in the general government structural
deficit of around 0.3 percent of GDP in 2011
and 0.8 percent of GDP in 2012. The latter
would imply a drag on economic growth of
almost ½ percentage point, broadly
appropriate under our baseline scenario, in
light of relatively high gross debt levels, the
still-large external current account deficit, and
resilient private domestic demand.
18. In an uncertain global economic
environment, the authorities noted that
they will be flexible and pragmatic, and
adjust policy as needed. Staff concurred that
macroeconomic policies should respond to
significant changes in the economic outlook.
Specifically, in the event that the economic
expansion would falter, the full operation of
automatic fiscal stabilizers and a reduction in
the monetary policy rate should be the first
line of response—particularly in the case of
lower external demand (the recent update of
federal fiscal plans goes in this direction). In a
scenario where domestic demand would
7The “Update of Economic and Fiscal Projections”
(November 8, 2011) features somewhat slowerconsolidation than initially planned. Staff projectionstake this update into account.
8/3/2019 Canada Imf
http://slidepdf.com/reader/full/canada-imf 12/54
CANADA 2011 ARTICLE IV REPORT
INTERNATIONAL MONETARY FUND 11
weaken significantly, there is some space to
further loosen the fiscal stance, and temporary
stimulus would be appropriate in a major
downside scenario. The authorities and staff
agreed that any temporary stimulus program,
if needed, should not derail efforts to identify
the fiscal savings required to achieve the
medium-term fiscal consolidation goals.
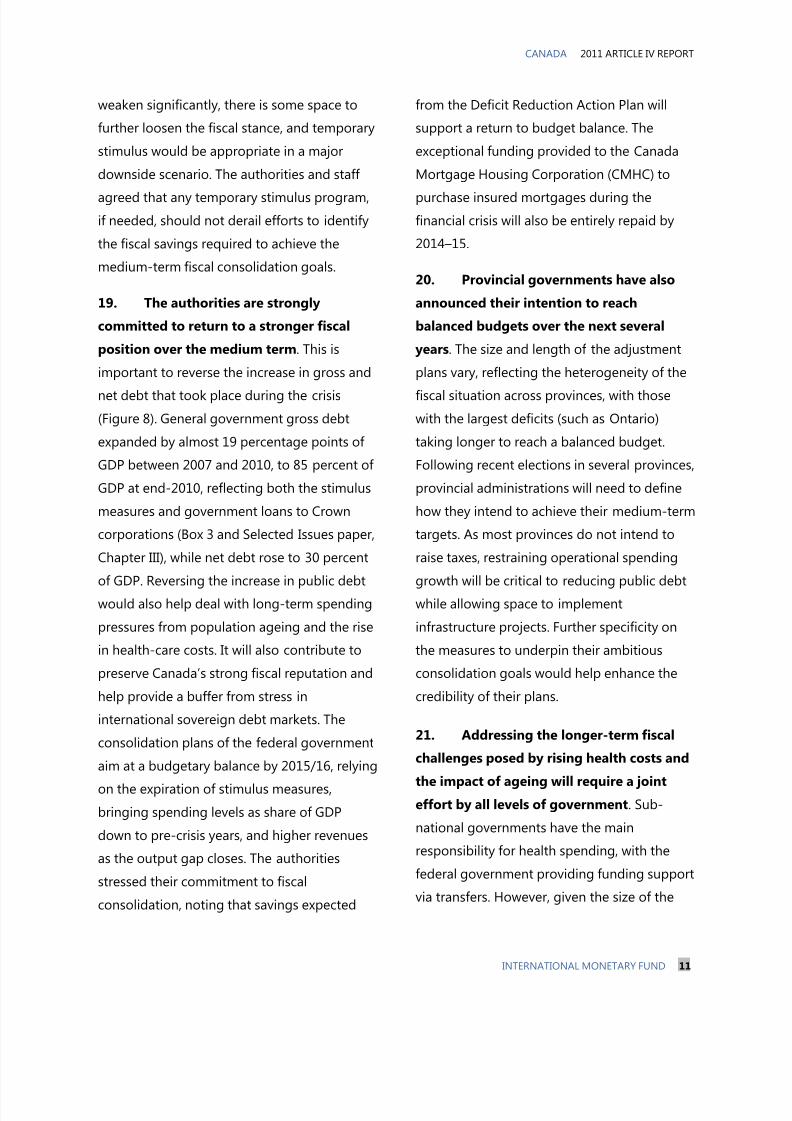
19. The authorities are strongly
committed to return to a stronger fiscal
position over the medium term. This is
important to reverse the increase in gross and
net debt that took place during the crisis
(Figure 8). General government gross debt
expanded by almost 19 percentage points of
GDP between 2007 and 2010, to 85 percent of
GDP at end-2010, reflecting both the stimulus
measures and government loans to Crown
corporations (Box 3 and Selected Issues paper,
Chapter III), while net debt rose to 30 percent
of GDP. Reversing the increase in public debt
would also help deal with long-term spending
pressures from population ageing and the rise
in health-care costs. It will also contribute to
preserve Canada’s strong fiscal reputation and
help provide a buffer from stress in
international sovereign debt markets. The
consolidation plans of the federal government
aim at a budgetary balance by 2015/16, relying
on the expiration of stimulus measures,
bringing spending levels as share of GDP
down to pre-crisis years, and higher revenues
as the output gap closes. The authorities
stressed their commitment to fiscal
consolidation, noting that savings expected
from the Deficit Reduction Action Plan will
support a return to budget balance. The
exceptional funding provided to the Canada
Mortgage Housing Corporation (CMHC) to
purchase insured mortgages during the
financial crisis will also be entirely repaid by
2014–15.
20. Provincial governments have also
announced their intention to reach
balanced budgets over the next several
years. The size and length of the adjustment
plans vary, reflecting the heterogeneity of the
fiscal situation across provinces, with those
with the largest deficits (such as Ontario)
taking longer to reach a balanced budget.
Following recent elections in several provinces,
provincial administrations will need to define
how they intend to achieve their medium-term
targets. As most provinces do not intend to
raise taxes, restraining operational spending
growth will be critical to reducing public debt
while allowing space to implement
infrastructure projects. Further specificity on
the measures to underpin their ambitious
consolidation goals would help enhance the
credibility of their plans.
21. Addressing the longer-term fiscal
challenges posed by rising health costs and
the impact of ageing will require a jointeffort by all levels of government. Sub-
national governments have the main
responsibility for health spending, with the
federal government providing funding support
via transfers. However, given the size of the
8/3/2019 Canada Imf
http://slidepdf.com/reader/full/canada-imf 13/54
2011 ARTICLE IV REPORT CANADA
12 INTERNATIONAL MONETARY FUND
challenges posed by rising health costs and
the impact of ageing population, it will be
critical to step up coordinated efforts between
the federal and regional governments. Staff
noted that the review of federal government
transfers to the provinces, which must be
completed by 2014/15, would provide an
opportunity to make progress on this front,
and that regular and comprehensive fiscal
sustainability reporting covering all levels of
government would help build consensus
around the need for reforms. In this respect,
staff welcomed the recent fiscal sustainability
studies prepared by the Parliamentary Budget
Office (PBO), alerting to the significant fiscal
challenges that Canada would face over the
longer term (Box 4).
C. Household Debt and Housing
Prices: Managing the Risks
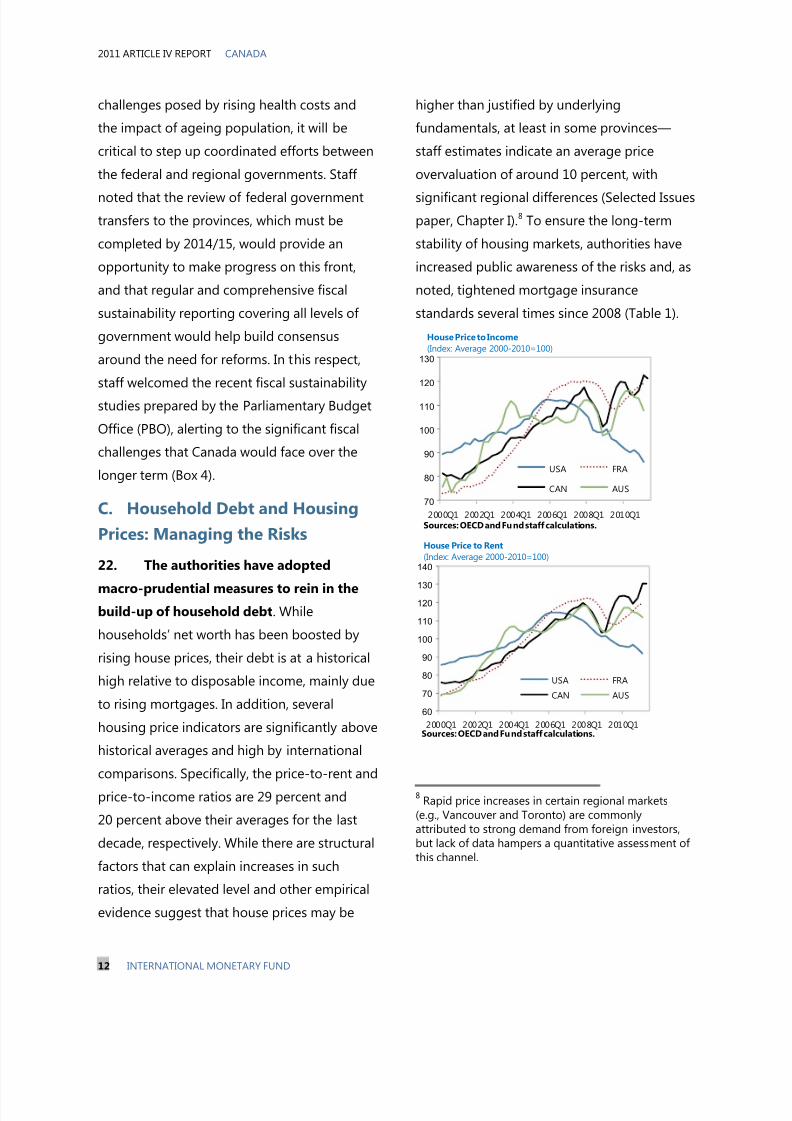
22. The authorities have adopted
macro-prudential measures to rein in thebuild-up of household debt. While
households’ net worth has been boosted by
rising house prices, their debt is at a historical
high relative to disposable income, mainly due
to rising mortgages. In addition, several
housing price indicators are significantly above
historical averages and high by international
comparisons. Specifically, the price-to-rent and
price-to-income ratios are 29 percent and
20 percent above their averages for the last
decade, respectively. While there are structural
factors that can explain increases in such
ratios, their elevated level and other empirical
evidence suggest that house prices may be
higher than justified by underlying
fundamentals, at least in some provinces—
staff estimates indicate an average price
overvaluation of around 10 percent, with
significant regional differences (Selected Issues
paper, Chapter I).8 To ensure the long-term
stability of housing markets, authorities have
increased public awareness of the risks and, as
noted, tightened mortgage insurance
standards several times since 2008 (Table 1).
8Rapid price increases in certain regional markets
(e.g., Vancouver and Toronto) are commonlyattributed to strong demand from foreign investors,but lack of data hampers a quantitative assessment of this channel.
70
80
90
100
110
120
130
2000Q1 2002Q1 2004Q1 2006Q1 2008Q1 2010Q1
USA FRA
CAN AUS
House Price to Income
(Index: Average 2000-2010=100)
Sources: OECD and Fund staff calculations.
60
70
80
90
100
110
120
130
140
2000Q1 2002Q1 2004Q1 2006Q1 2008Q1 2010Q1
USA FRA
CAN AUS
House Price to Rent
(Index: Average 2000-2010=100)
Sources: OECD and Fund staff calculations.
8/3/2019 Canada Imf
http://slidepdf.com/reader/full/canada-imf 14/54
CANADA 2011 ARTICLE IV REPORT
INTERNATIONAL MONETARY FUND 13
Those measures, together with rising
uncertainty because of global financial market
turmoil, have led to some reduction in the
pace of mortgage credit growth.
23. The authorities and staff discussed
the scope for further macro-prudential
measures should household debt and house
prices continue to rise much more rapidly
than disposable income. While structural
features of the Canadian market (high
household equity in housing, recourse loans,
prudent lending practices, tight financial
supervision) make a U.S.-style bust unlikely, a
correction in the housing market would weigh
on consumption and construction activity. Staff
estimates suggest that a 15 percent decline in
house prices would reduce the ratio of
household net worth to disposable income by
45 percentage points, and could trigger a
decline in private consumption by over
1½ percent (Selected Issues paper, Chapter I).The authorities noted that there was no
evidence of large mismatches between supply
and demand in the residential sector.
Nevertheless, they stressed that, should the
slowdown in the growth of mortgage debt
prove temporary, they would be ready to
consider additional measures. Staff and the
authorities agreed that the introduction of
such measures, if required, would need to be
well timed and appropriately balanced to
avoid pro-cyclical effects. Staff suggested that,
to minimize these risks, such measures could
include larger down-payment requirements for
new mortgages and requiring lower debt
service-to-income ratios. Staff also inquired
whether measures could target housing
markets in specific provinces where prices have
increased most rapidly. The authorities noted
that they were not considering regulations
differentiated across provinces. Continued
tight supervision of financial institutions would
also ensure conservative underwriting
standards and strict adherence to the existing
regulations.
24. In light of the Canada Mortgage and
Housing Corporation’s central role in the
growing housing sector, the authorities and
staff agreed it will be important to continue
to ensure that it has an appropriate
governance structure and supervision
framework . CMHC is the largest provider of
mortgage insurance in Canada, accounting for
more than two-thirds of the market. As a
Crown corporation, it benefits from explicit
government backing (Selected Issues paper,Chapter II). Stress tests conducted by CMHC
suggest that its insurance business is well
positioned to weather severe economic
scenarios, with the most significant risks
stemming from protracted episodes of high
unemployment. Staff estimates also suggest
that in a downside scenario with housing
market distress such as the one sketched in
¶13 losses to government net worth arising
from higher CMHC insurance outlays would be
relatively modest, with the deterioration in
fiscal accounts arising primarily from the
worsened macroeconomic situation in that
scenario. However, since CMHC is now one of
8/3/2019 Canada Imf
http://slidepdf.com/reader/full/canada-imf 15/54
2011 ARTICLE IV REPORT CANADA
14 INTERNATIONAL MONETARY FUND
the largest financial institutions in Canada and
the key backstop to the housing market it
would be useful to undertake a review aimed
at ensuring that CMHC has a modern and
effective governance structure and supervision,
and assessing the scope for further
strengthening its risk management.
D. Financial Stability: Managing
External Risks and Moving Ahead
With the Regulatory Reforms
25. The Canadian banking system was
able to withstand the international crisis
well, and the authorities have continued to
monitor risks closely. They stressed that
banks are well capitalized and have prudent
management; nevertheless they remain
vigilant, given the high external and domestic
risks.
The authorities noted that while direct
exposures of Canadian banks to Europe
are estimated to be limited, further
financial turmoil in the region could affect
the Canadian financial system through
higher funding costs, a re-pricing of assets,
and lower liquidity. In this context, the
authorities and staff agreed on the
importance of banks having appropriate
liquidity buffers, which have increasedrecently. Liquidity shortages could be
alleviated by prompt and coordinated
policy action, including central bank
assistance, as during 2008–09.
Stress-testing scenarios developed by the
authorities indicate the financial system
would face manageable losses under
adverse scenarios, including a significant
deterioration in households’ ability to
service debt—in part reflecting the large
share of mortgages insured by CMHC and
private insurers. Stress tests also suggest
that only a protracted period of high
unemployment (around 10 percent or
higher) would lead to significant losses in
the financial sector. At the same time, the
authorities recognized that elevated
household indebtedness does carry new
policy challenges, as households are more
vulnerable to an adverse shock.
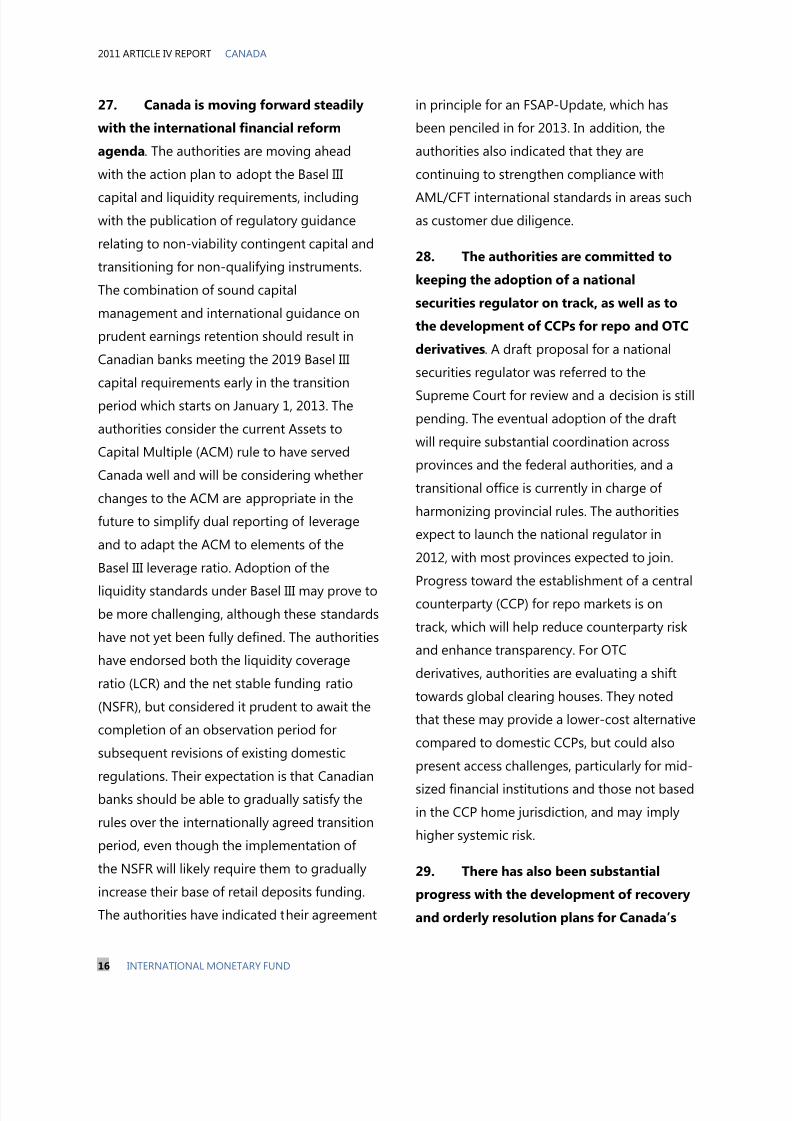
When assessing resilience, the authorities
also noted that, while corporate credit has
accelerated in recent quarters, firms have
relatively low leverage and banks are not
heavily exposed to the sectors that werehit the hardest by the crisis (e.g., auto).
8/3/2019 Canada Imf
http://slidepdf.com/reader/full/canada-imf 16/54
CANADA 2011 ARTICLE IV REPORT
INTERNATIONAL MONETARY FUND 15
26. A prolonged period of low interest
rates would also pose challenges to
financial institutions and supervision. There
is a risk, in particular, that such a scenario
could encourage excessive borrowing by
economic agents and risk-taking by banks. In
addition, the authorities recognized that
institutions with a large fixed-income portfolio,
such as insurance companies and pension
funds, would be negatively affected, and could
be forced to change their business structure.
They indicated that they were working closely
with these institutions to assess the best policy
response to such a scenario.
Insurance firms, while well capitalized and
hedged, have reacted by reallocating part
of their portfolio to non-fixed income
securities, as well as changing pricing
strategies and product menus, and
expanding abroad. Pension funds with
defined benefits have fewer options and
may need to increase contributions or
reassess benefits over time.
With high levels of capital and profitability,
banks are better prepared to withstand
lower interest rates. However, persistently
low rates could put pressure on banks’
margins, leading to changes in their
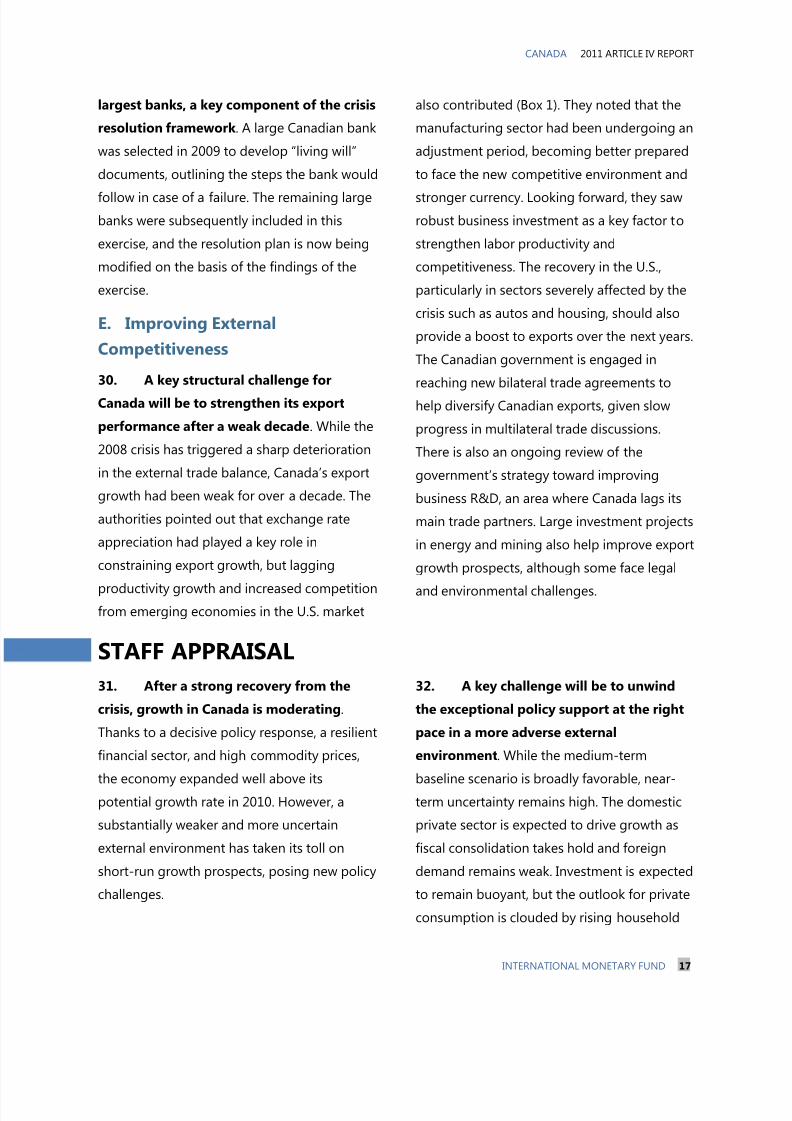
business model. The expansion abroad of
some Canadian banks in recent years
(Selected Issues paper, Chapter IV) poses
new challenges for supervision. The
authorities noted that banks had expanded
abroad cautiously and that geographical
diversification should help keep risksmanageable. However, the authorities are
in close contact with supervisors in
destination countries to jointly assess and
monitor risks.
0
2
4
6
810
12
14
16
18
2 0 0 8
2 0 0 9
2 0 1 0
2 0 1 1
2 0 0 8
2 0 0 9
2 0 1 0
2 0 1 1
2 0 0 8
2 0 0 9
2 0 1 0
2 0 0 8
2 0 0 9
2 0 1 0
2 0 1 1
2 0 0 8
2 0 0 9
2 0 1 0
2 0 1 1
CAR Tier 1 Capital
AUS DEU GBR USA CAN
Sources: IMF Financial Soundness Indicators
(FSIs) and Fund staff calculations.
Bank Regulatory Capital
(As a % of Risk-Weighted Assets)
2.4
2.45
2.5
2.55
2.6
2.65
2.7
2.75
2.8
0
2
4
6
8
10
12
14
16
18
Mar-06 Mar-07 Mar-08 Mar-09 Mar-10 Mar-11
Liquidity (Curr. + Dep., % total liab ilities), leftReturn on Equity, left
Sources: Haver Analytics and Fund staff calculations.
Non-Financial Corporations
(Percent)
Leverage (Assetsover Equity),right
2007Q2 2011Q1 2007Q2 2011Q1
United States 104 102 273 466
Euro Area 61 88 13 6Other advanced econ. 48 75 54 71
Offshore centers 21 20 18 22
Emerging markets 21 35 42 60
Latin America 10 15 38 52
Total 260 329 401 622
Local claims
Consolidated Foreign Claims of Canadian Banks
International claims
(Ultimate risk basis, billions of USD)
Sources: Bank of International Settlements and Fund staff
calculations.
8/3/2019 Canada Imf
http://slidepdf.com/reader/full/canada-imf 17/54
2011 ARTICLE IV REPORT CANADA
16 INTERNATIONAL MONETARY FUND
27. Canada is moving forward steadily
with the international financial reform
agenda. The authorities are moving ahead
with the action plan to adopt the Basel III
capital and liquidity requirements, including
with the publication of regulatory guidance
relating to non-viability contingent capital and
transitioning for non-qualifying instruments.
The combination of sound capital
management and international guidance on
prudent earnings retention should result in
Canadian banks meeting the 2019 Basel III
capital requirements early in the transition
period which starts on January 1, 2013. The
authorities consider the current Assets to
Capital Multiple (ACM) rule to have served
Canada well and will be considering whether
changes to the ACM are appropriate in the
future to simplify dual reporting of leverage
and to adapt the ACM to elements of the
Basel III leverage ratio. Adoption of the
liquidity standards under Basel III may prove to
be more challenging, although these standards
have not yet been fully defined. The authorities
have endorsed both the liquidity coverage
ratio (LCR) and the net stable funding ratio
(NSFR), but considered it prudent to await the
completion of an observation period for
subsequent revisions of existing domestic
regulations. Their expectation is that Canadian
banks should be able to gradually satisfy the
rules over the internationally agreed transition
period, even though the implementation of
the NSFR will likely require them to gradually
increase their base of retail deposits funding.
The authorities have indicated their agreement
in principle for an FSAP-Update, which has
been penciled in for 2013. In addition, the
authorities also indicated that they are
continuing to strengthen compliance with
AML/CFT international standards in areas such
as customer due diligence. 28. The authorities are committed to
keeping the adoption of a national
securities regulator on track, as well as to
the development of CCPs for repo and OTC
derivatives. A draft proposal for a national
securities regulator was referred to the
Supreme Court for review and a decision is still
pending. The eventual adoption of the draft
will require substantial coordination across
provinces and the federal authorities, and a
transitional office is currently in charge of
harmonizing provincial rules. The authorities
expect to launch the national regulator in
2012, with most provinces expected to join.
Progress toward the establishment of a central
counterparty (CCP) for repo markets is on
track, which will help reduce counterparty risk
and enhance transparency. For OTC
derivatives, authorities are evaluating a shift
towards global clearing houses. They noted
that these may provide a lower-cost alternative
compared to domestic CCPs, but could also
present access challenges, particularly for mid-
sized financial institutions and those not based
in the CCP home jurisdiction, and may imply
higher systemic risk.
29. There has also been substantial
progress with the development of recovery
and orderly resolution plans for Canada’s
8/3/2019 Canada Imf
http://slidepdf.com/reader/full/canada-imf 18/54
CANADA 2011 ARTICLE IV REPORT
INTERNATIONAL MONETARY FUND 17
largest banks, a key component of the crisis
resolution framework . A large Canadian bank
was selected in 2009 to develop “living will”
documents, outlining the steps the bank would
follow in case of a failure. The remaining large
banks were subsequently included in this
exercise, and the resolution plan is now being
modified on the basis of the findings of the
exercise.
E. Improving External
Competitiveness
30. A key structural challenge for
Canada will be to strengthen its export
performance after a weak decade. While the
2008 crisis has triggered a sharp deterioration
in the external trade balance, Canada’s export
growth had been weak for over a decade. The
authorities pointed out that exchange rate
appreciation had played a key role in
constraining export growth, but lagging
productivity growth and increased competitionfrom emerging economies in the U.S. market
also contributed (Box 1). They noted that the
manufacturing sector had been undergoing an
adjustment period, becoming better prepared
to face the new competitive environment and
stronger currency. Looking forward, they saw
robust business investment as a key factor to
strengthen labor productivity and
competitiveness. The recovery in the U.S.,
particularly in sectors severely affected by the
crisis such as autos and housing, should also
provide a boost to exports over the next years.
The Canadian government is engaged in
reaching new bilateral trade agreements to
help diversify Canadian exports, given slow
progress in multilateral trade discussions.
There is also an ongoing review of the
government’s strategy toward improving
business R&D, an area where Canada lags its
main trade partners. Large investment projects
in energy and mining also help improve export
growth prospects, although some face legal
and environmental challenges.
STAFF APPRAISAL
31. After a strong recovery from the
crisis, growth in Canada is moderating.
Thanks to a decisive policy response, a resilient
financial sector, and high commodity prices,
the economy expanded well above itspotential growth rate in 2010. However, a
substantially weaker and more uncertain
external environment has taken its toll on
short-run growth prospects, posing new policy
challenges.
32. A key challenge will be to unwind
the exceptional policy support at the right
pace in a more adverse external
environment. While the medium-term
baseline scenario is broadly favorable, near-term uncertainty remains high. The domestic
private sector is expected to drive growth as
fiscal consolidation takes hold and foreign
demand remains weak. Investment is expected
to remain buoyant, but the outlook for private
consumption is clouded by rising household
8/3/2019 Canada Imf
http://slidepdf.com/reader/full/canada-imf 19/54
2011 ARTICLE IV REPORT CANADA
18 INTERNATIONAL MONETARY FUND
indebtedness and fragile consumer
confidence. Important downside risks remain,
including external headwinds from financial
market turmoil in Europe; a weaker U.S.
economy; and lower commodity prices under a
scenario of weaker global activity. The
domestic impact of significant adverse external
shocks could be amplified by elevated
household debt and house prices.
33. With modest core inflation, well-
anchored inflation expectations, and
ongoing economic slack, an accommodative
monetary policy stance will likely remain
appropriate for some time. There is some
space for further monetary easing if the
economy were to weaken, and the Bank of
Canada is prepared to quickly respond to
liquidity strains in a scenario of heightened
international financial turbulence by
redeploying the tools it successfully used
during the crisis. Staff also welcomes therenewal of the inflation-targeting framework,
whose flexible implementation has served the
Canadian economy well.
34. Fiscal policy is appropriately shifting
toward consolidation in the aftermath of
the effective stimulus program. The federal
government is leading the initial fiscal effort,
as spending is gradually being brought to pre-crisis levels as a share of GDP. It will also be
important for provincial governments to move
ahead with their own fiscal consolidation
efforts, given their large share of public
spending and fiscal deficit. Overall, the
projected reduction in the general government
structural deficit in 2012 is appropriate under
our baseline scenario of resilient domestic
demand and a somewhat higher external
current account deficit.
35. Macroeconomic policies have room
to adjust in response to significant changes
in the economic outlook . Full operation of
automatic fiscal stabilizers and a reduction in
the monetary policy rate should be the first
line of response if the recovery were to falter.
In particular, should the outlook for domestic
demand weaken materially, there is some
space to loosen the fiscal stance relative to
plans, and a temporary stimulus would be
appropriate in a major downside scenario,
while maintaining the medium-term
consolidation plans.
36. Staff supports the authorities’
objective of returning to a stronger fiscal
position in the medium term. This is
necessary to put gross and net public debt on
a declining path relative to GDP, thus placing
public finances on a stronger footing to deal
with the long-term spending pressures from
population ageing and rising health-care costs.
As the provinces’ consolidation plans rely
heavily on expenditure restraint for broad
programs, further specificity on the measuresto underpin these ambitious goals would
enhance the transparency and credibility of
their plans.
37. The federal government and the
provinces will also need to undertake a

8/3/2019 Canada Imf
http://slidepdf.com/reader/full/canada-imf 20/54
CANADA 2011 ARTICLE IV REPORT
INTERNATIONAL MONETARY FUND 19
concerted effort to deal with the longer-
term fiscal challenges posed by rising
health costs in an ageing society. The review
of transfers of the federal government to the
provinces, which must be completed by
2014/15, would provide an opportunity in this
regard. Regular and comprehensive fiscal
sustainability reporting covering all levels of
government would also help build consensus
around the need for reforms. The recent long-
term fiscal sustainability studies prepared by
the PBO are an important first step forward.
38. The authorities have appropriately
adopted macro-prudential measures to
curb the build-up of mortgage debt.
Household debt is at an historical high relative
to disposable income, and various indicators
suggest that house prices in some regions are
above levels consistent with economic
fundamentals. To ensure the long-term
stability of housing markets, the authoritieshave increased public awareness of the risks
and tightened mortgage insurance standards
which, together with rising uncertainty because
of global financial market turmoil, have slowed
mortgage credit growth.
39. However, additional macro-
prudential measures may be needed in the
event of further sustained increases inhousehold debt and house prices. In an
environment of very low interest rates, there is
a risk that household debt will continue to rise
faster than personal disposable income. In
such a scenario, further macro-prudential
measures may be needed to prevent a more
disruptive adjustment in the future, with due
consideration to the overall cyclical position. It
will also be important to continue with tight
supervision of financial institutions to ensure
conservative underwriting standards and strict
adherence to regulations.
40. It would be useful to undertake a
review of CMHC to assess the scope for
modernizing its governance structure and
supervision, given its key role as housing
sector backstop. CMHC plays a key role in the
residential mortgage sector by being the main
provider of mortgage insurance and by
implementing public policy in this area. CMHC
is now one of the largest financial institutions
in Canada and the largest federal Crown
enterprise. Given elevated house prices and
household debt and the potential fiscal risks
associated with its balance sheet in a stress
scenario, a review of CMHC’s governancestructure and supervision would be very timely.
41. With the Canadian banking sector
well supervised and in a solid position to
manage risks, the authorities stand ready to
quickly respond to spillovers from
increased turbulence in international
markets. Banks are well capitalized and the
authorities maintain high prudential standardsand tight supervision. The authorities’ stress
tests also indicate banks are well prepared to
manage most adverse scenarios, given their
high level of capital. A sharp and prolonged
increase in unemployment would represent

8/3/2019 Canada Imf
http://slidepdf.com/reader/full/canada-imf 21/54
2011 ARTICLE IV REPORT CANADA
20 INTERNATIONAL MONETARY FUND
the main risk to the financial system. In the
event of increased international financial
turbulence, one of the sources for potential
stress to Canadian banks could be through
reduced access to wholesale funding,
underscoring the need for prudent liquidity
buffers. Canada’s institutional arrangements
are also supportive of an appropriately
coordinated response from the authorities if
necessary, as evidenced by their proactive
approach during the crisis.
42. At the same time, a scenario of low
interest rates for a prolonged period also
requires close monitoring of possible
negative effects on financial institutions
and excessive risk taking. Such a scenario
could encourage excessive borrowing by
economic agents and risk-taking by banks,
underscoring the need for continued close
supervision. The insurance sector and pension
funds would also face significant challenges if such an environment where to persist for a
prolonged period of time.
43. Canada is well placed to advance
with the financial reform agenda. The
Canadian authorities are committed to a swift
adoption of the Basel III capital and liquidity
requirements, and staff welcomes progress in
developing recovery and orderly resolution
plans for Canada’s largest banks, a key
element of the crisis resolution framework.
Progress towards the establishment of a
central counterparty for repo markets is on
track, as is progress in the area of OTC
derivatives, which will help reduce
counterparty risk and enhance transparency.
Staff also welcomes the government’s
intention to launch a national securities
regulator in 2012, which would be another tool
to further strengthen oversight and the
existing strong institutional financial stability
framework.
44. It is recommended that the next
consultation occur on the usual 12-monthcycle.
8/3/2019 Canada Imf
http://slidepdf.com/reader/full/canada-imf 22/54
CANADA 2011 ARTICLE IV REPORT
INTERNATIONAL MONETARY FUND 21
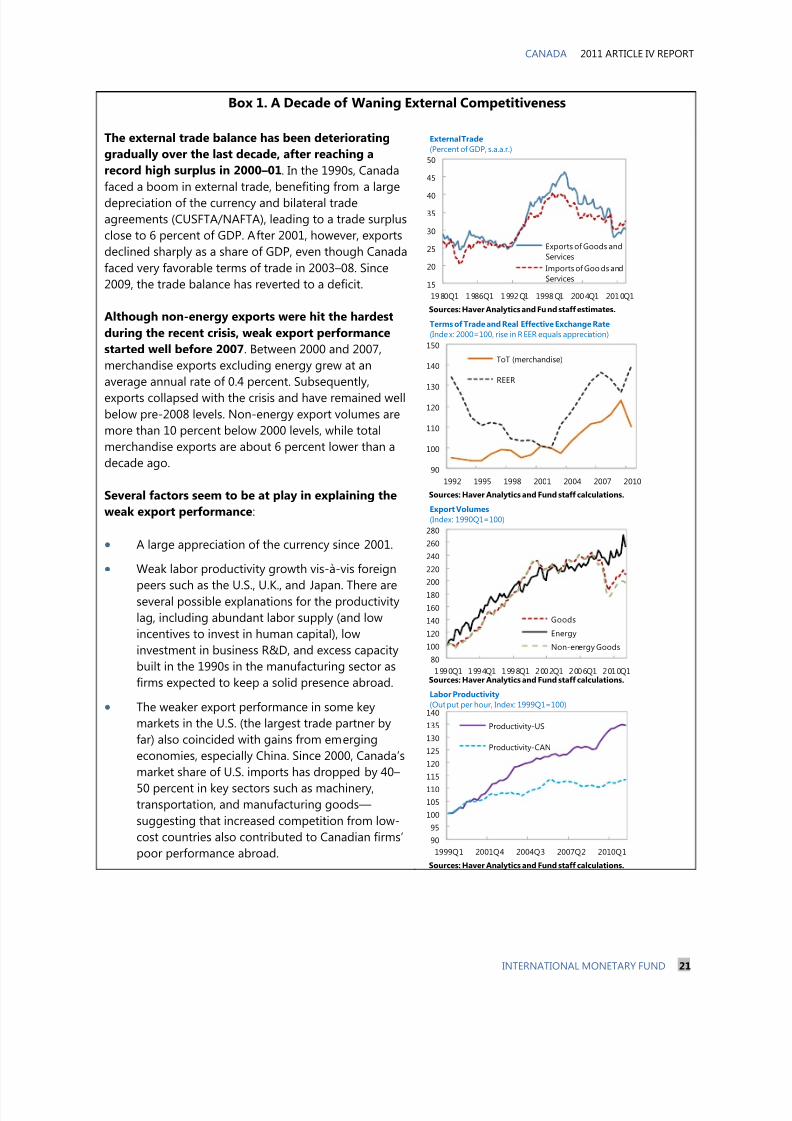
Box 1. A Decade of Waning External Competitiveness
The external trade balance has been deteriorating
gradually over the last decade, after reaching a
record high surplus in 2000–01. In the 1990s, Canada
faced a boom in external trade, benefiting from a large
depreciation of the currency and bilateral trade
agreements (CUSFTA/NAFTA), leading to a trade surplus
close to 6 percent of GDP. After 2001, however, exports
declined sharply as a share of GDP, even though Canada
faced very favorable terms of trade in 2003–08. Since
2009, the trade balance has reverted to a deficit.
Although non-energy exports were hit the hardest
during the recent crisis, weak export performance
started well before 2007. Between 2000 and 2007,
merchandise exports excluding energy grew at an
average annual rate of 0.4 percent. Subsequently,
exports collapsed with the crisis and have remained well
below pre-2008 levels. Non-energy export volumes are
more than 10 percent below 2000 levels, while total
merchandise exports are about 6 percent lower than a
decade ago.
Several factors seem to be at play in explaining the
weak export performance:
A large appreciation of the currency since 2001.
Weak labor productivity growth vis-à-vis foreign
peers such as the U.S., U.K., and Japan. There areseveral possible explanations for the productivity
lag, including abundant labor supply (and low
incentives to invest in human capital), low
investment in business R&D, and excess capacity
built in the 1990s in the manufacturing sector as
firms expected to keep a solid presence abroad.
The weaker export performance in some key
markets in the U.S. (the largest trade partner by
far) also coincided with gains from emerging
economies, especially China. Since 2000, Canada’s
market share of U.S. imports has dropped by 40–
50 percent in key sectors such as machinery,transportation, and manufacturing goods—
suggesting that increased competition from low-
cost countries also contributed to Canadian firms’
poor performance abroad.
15
20
25
30
35
40
45
50
1980Q1 1986Q1 1992Q1 1998Q1 2004Q1 2010Q1
Exports of Goods and
Services
Imports of Goo ds and
Services
External Trade
(Percent of GDP, s.a.a.r.)
Sources: Haver Analytics and Fund staff estimates.
90
100
110
120
130
140
150
1992 1995 1998 2001 2004 2007 2010
ToT (merchandise)
REER
Terms of Trade and Real Effective Exchange Rate
(Index: 2000=100, rise in REER equals appreciation)
Sources: Haver Analytics and Fund staff calculations.
80
100
120
140
160
180
200
220
240
260
280
1990Q1 1994Q1 1998Q1 2002Q1 2006Q1 2010Q1
Goods
Energy
Non-energy Goods
Export Volumes
(Index: 1990Q1=100)
Sources: Haver Analytics and Fund staff calculations.
90
95
100
105
110
115
120
125
130
135
140
1999Q1 2001Q4 2004Q3 2007Q2 2010Q1
Productivity-US
Productivity-CAN
Labor Productivity
(Output per hour, Index: 1999Q1=100)
Sources: Haver Analytics and Fund staff calculations.
8/3/2019 Canada Imf
http://slidepdf.com/reader/full/canada-imf 23/54
2011 ARTICLE IV REPORT CANADA
22 INTERNATIONAL MONETARY FUND
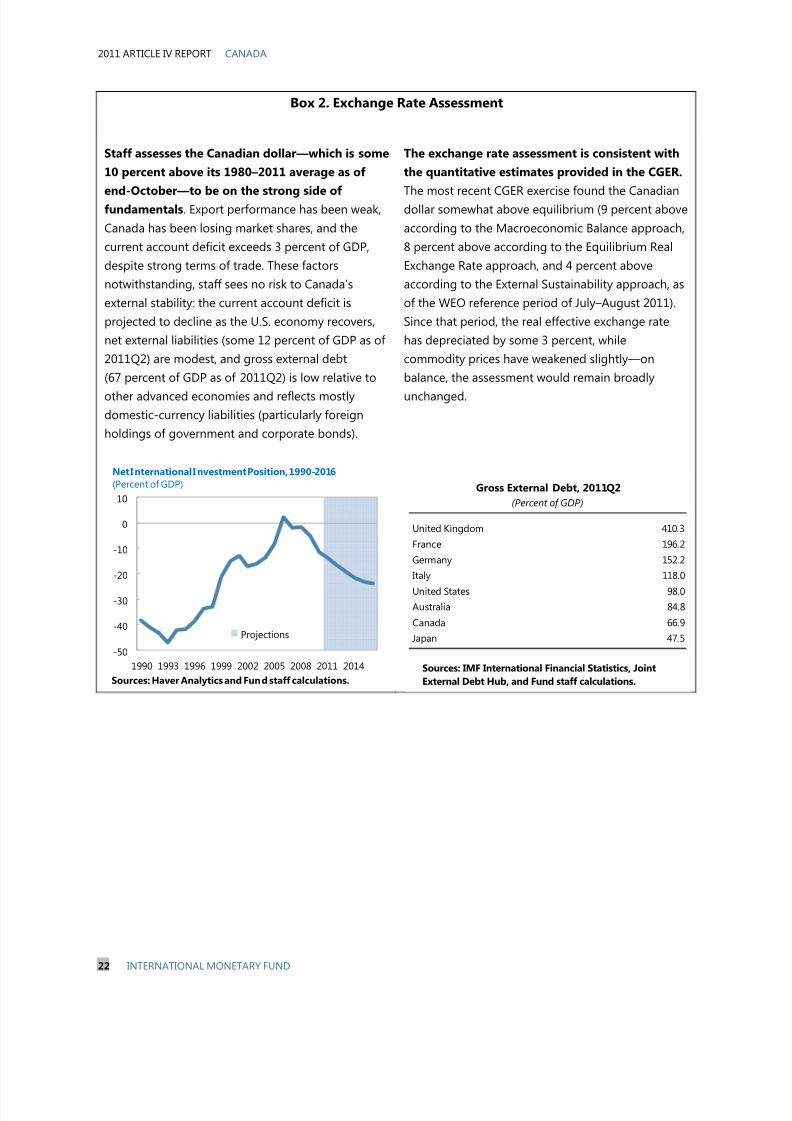
Box 2. Exchange Rate Assessment
Staff assesses the Canadian dollar—which is some
10 percent above its 1980–2011 average as of
end-October—to be on the strong side of fundamentals. Export performance has been weak,
Canada has been losing market shares, and the
current account deficit exceeds 3 percent of GDP,
despite strong terms of trade. These factors
notwithstanding, staff sees no risk to Canada’s
external stability: the current account deficit is
projected to decline as the U.S. economy recovers,
net external liabilities (some 12 percent of GDP as of
2011Q2) are modest, and gross external debt
(67 percent of GDP as of 2011Q2) is low relative to
other advanced economies and reflects mostly
domestic-currency liabilities (particularly foreign
holdings of government and corporate bonds).
The exchange rate assessment is consistent with
the quantitative estimates provided in the CGER.
The most recent CGER exercise found the Canadiandollar somewhat above equilibrium (9 percent above
according to the Macroeconomic Balance approach,
8 percent above according to the Equilibrium Real
Exchange Rate approach, and 4 percent above
according to the External Sustainability approach, as
of the WEO reference period of July–August 2011).
Since that period, the real effective exchange rate
has depreciated by some 3 percent, while
commodity prices have weakened slightly—on
balance, the assessment would remain broadly
unchanged.
-50
-40
-30
-20
-10
0
10
1990 1993 1996 1999 2002 2005 2008 2011 2014
Projections
Net International I nvestment Position, 1990-2016
(Percent of GDP)
Sources: Haver Analytics and Fund staff calculations.
United Kingdom 410.3
France 196.2
Germany 152.2
Italy 118.0
United States 98.0
Australia 84.8
Canada 66.9
Japan 47.5
Gross External Debt, 2011Q2
(Percent of GDP)
Sources: IMF International Financial Statistics, Joint
External Debt Hub, and Fund staff calculations.
8/3/2019 Canada Imf
http://slidepdf.com/reader/full/canada-imf 24/54
CANADA 2011 ARTICLE IV REPORT
INTERNATIONAL MONETARY FUND 23
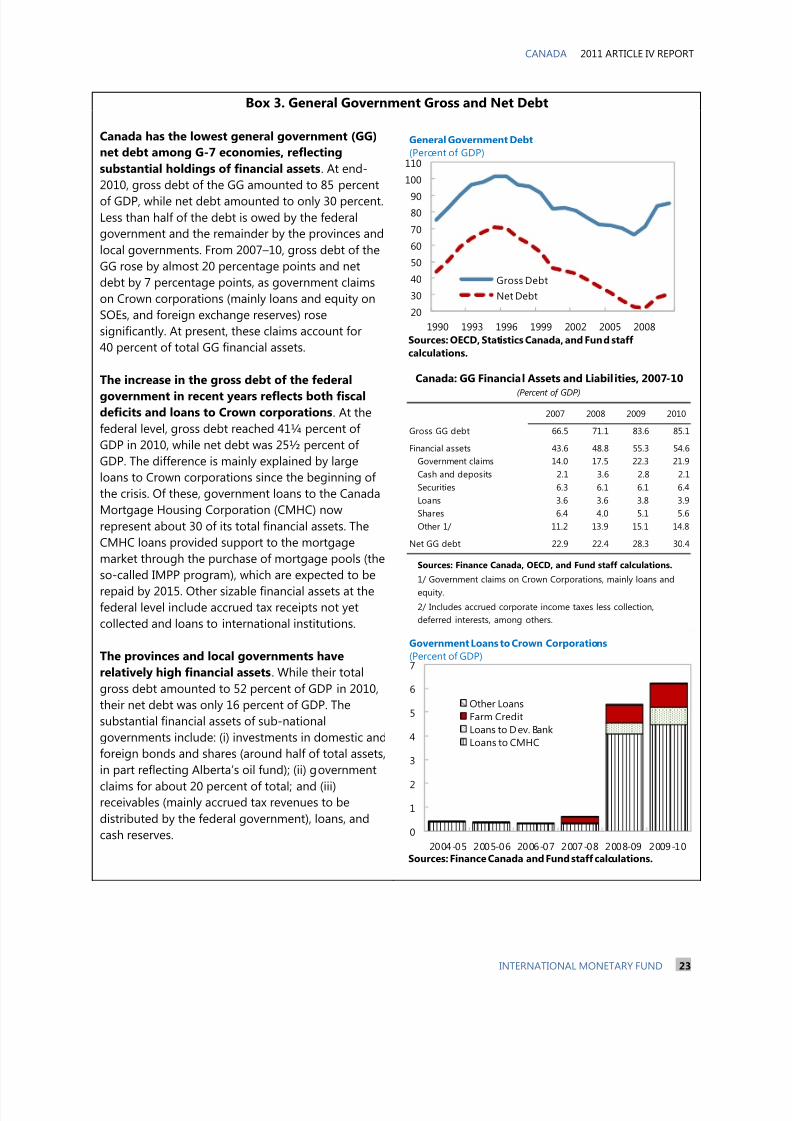
Box 3. General Government Gross and Net Debt
Canada has the lowest general government (GG)
net debt among G-7 economies, reflecting
substantial holdings of financial assets. At end-
2010, gross debt of the GG amounted to 85 percent
of GDP, while net debt amounted to only 30 percent.
Less than half of the debt is owed by the federal
government and the remainder by the provinces and
local governments. From 2007–10, gross debt of the
GG rose by almost 20 percentage points and net
debt by 7 percentage points, as government claims
on Crown corporations (mainly loans and equity on
SOEs, and foreign exchange reserves) rose
significantly. At present, these claims account for
40 percent of total GG financial assets.
The increase in the gross debt of the federal
government in recent years reflects both fiscaldeficits and loans to Crown corporations. At the
federal level, gross debt reached 41¼ percent of
GDP in 2010, while net debt was 25½ percent of
GDP. The difference is mainly explained by large
loans to Crown corporations since the beginning of
the crisis. Of these, government loans to the Canada
Mortgage Housing Corporation (CMHC) now
represent about 30 of its total financial assets. The
CMHC loans provided support to the mortgage
market through the purchase of mortgage pools (the
so-called IMPP program), which are expected to be
repaid by 2015. Other sizable financial assets at thefederal level include accrued tax receipts not yet
collected and loans to international institutions.
The provinces and local governments have
relatively high financial assets. While their total
gross debt amounted to 52 percent of GDP in 2010,
their net debt was only 16 percent of GDP. The
substantial financial assets of sub-national
governments include: (i) investments in domestic and
foreign bonds and shares (around half of total assets,
in part reflecting Alberta’s oil fund); (ii) government
claims for about 20 percent of total; and (iii)receivables (mainly accrued tax revenues to be
distributed by the federal government), loans, and
cash reserves.
20
30
40
50
60
70
8090
100
110
1990 1993 1996 1999 2002 2005 2008
Gross Debt
Net Debt
General Government Debt
(Percent of GDP)
Sources: OECD, Statistics Canada, and Fund staff
calculations.
2007 2008 2009 2010
Gross GG debt 66.5 71.1 83.6 85.1
Financial assets 43.6 48.8 55.3 54.6
Government claims 14.0 17.5 22.3 21.9
Cash and deposits 2.1 3.6 2.8 2.1
Securities 6.3 6.1 6.1 6.4
Loans 3.6 3.6 3.8 3.9
Shares 6.4 4.0 5.1 5.6
Other 1/ 11.2 13.9 15.1 14.8
Net GG debt 22.9 22.4 28.3 30.4
Canada: GG Financial Assets and Liabilities, 2007-10
(Percent of GDP)
1/ Government claims on Crown Corporations, mainly loans and
equity.
2/ Includes accrued corporate income taxes less collection,
deferred interests, among others.
Sources: Finance Canada, OECD, and Fund staff calculations.
0
1
2
3
4
5
6
7
2004-05 2005-06 2006-07 2007-08 2008-09 2009-10
Other LoansFarm CreditLoans to Dev. BankLoans to CMHC
Government Loans to Crown Corporations
(Percent of GDP)
Sources: Finance Canada and Fund staff calculations.
8/3/2019 Canada Imf
http://slidepdf.com/reader/full/canada-imf 25/54
8/3/2019 Canada Imf
http://slidepdf.com/reader/full/canada-imf 26/54
CANADA 2011 ARTICLE IV REPORT
INTERNATIONAL MONETARY FUND 25
Fixing the maximum amortization period for new government-backed insured
mortgages with loan-to-value ratios of more than 80 percent to 35 years.
Requiring a minimum down payment of five percent for new government-backed
insured mortgages
Establishing a consistent minimum credit score requirement.
Introducing new loan documentation standards to ensure that there is evidence
of reasonableness of property value and the borrower’s sources and level of
income.
Requiring that borrowers meet the standards for a five-year fixed-rate mortgage
even if they choose a mortgage with a lower interest rate and shorter term.
Lowering the maximum amount Canadians can withdraw in refinancing theirmortgages to 90 percent from 95 percent of the value of their homes.
Requiring a minimum down payment of 20 percent on non-owner-occupied
properties purchased for speculation.
Reduce the maximum amortization period to 30 years from 35 years for new
government-backed insured mortgages with loan-to-value ratios of more than
80 percent.
Lower the maximum amount Canadians can borrow in refinancing their
mortgages to 85 percent from 90 percent of the value of their homes.
Withdraw government insurance backing on lines of credit secured by homes,
such as home equity lines of credit, or HELOCs.
Source: Finance Canada.
July 2008
February 2010
January 2011
Table 1. Tightening of Minimum Standards for Government-Backed Insured Mortgages Since 2008
8/3/2019 Canada Imf
http://slidepdf.com/reader/full/canada-imf 27/54
2011 ARTICLE IV REPORT CANADA
26 INTERNATIONAL MONETARY FUND
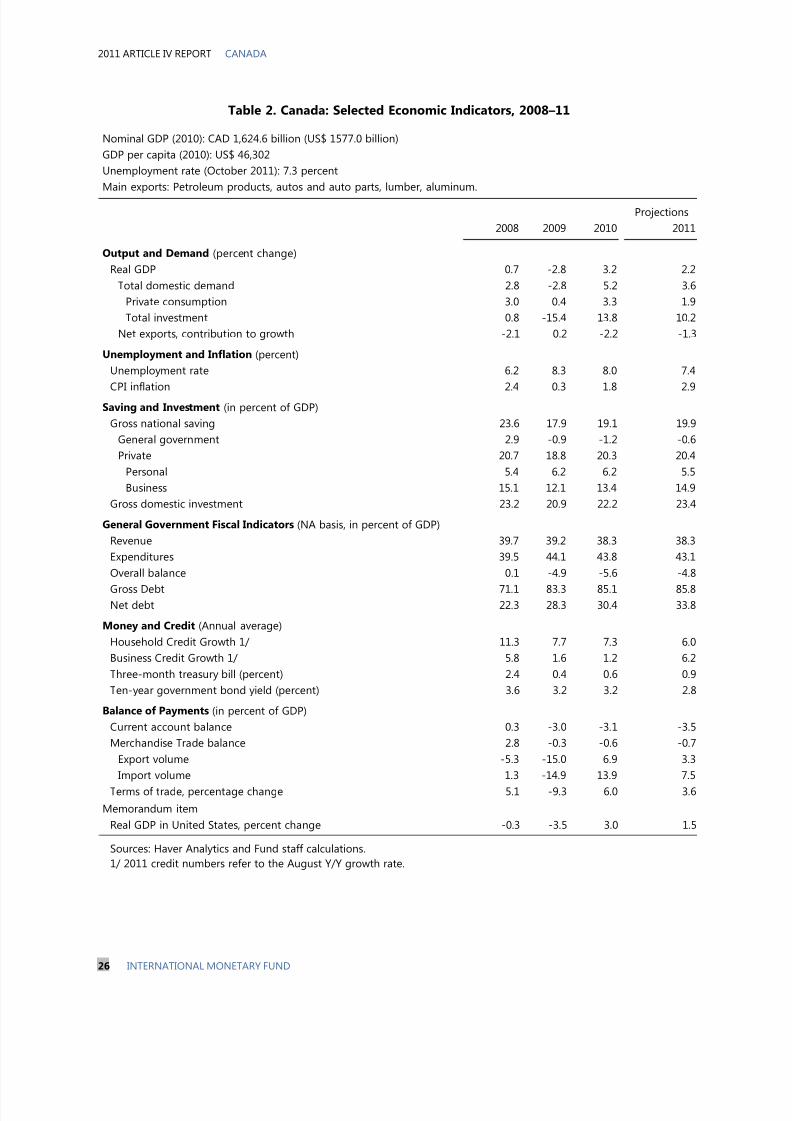
Nominal GDP (2010): CAD 1,624.6 billion (US$ 1577.0 billion)
GDP per capita (2010): US$ 46,302
Unemployment rate (October 2011): 7.3 percent
Main exports: Petroleum products, autos and auto parts, lumber, aluminum.
2008 2009 2010 2011
Output and Demand (percent change)
Real GDP 0.7 -2.8 3.2 2.2
Total domestic demand 2.8 -2.8 5.2 3.6
Private consumption 3.0 0.4 3.3 1.9
Total investment 0.8 -15.4 13.8 10.2
Net exports, contribution to growth -2.1 0.2 -2.2 -1.3
Unemployment and Inflation (percent)
Unemployment rate 6.2 8.3 8.0 7.4
CPI inflation 2.4 0.3 1.8 2.9Saving and Investment (in percent of GDP)
Gross national saving 23.6 17.9 19.1 19.9
General government 2.9 -0.9 -1.2 -0.6
Private 20.7 18.8 20.3 20.4
Personal 5.4 6.2 6.2 5.5
Business 15.1 12.1 13.4 14.9
Gross domestic investment 23.2 20.9 22.2 23.4
General Government Fiscal Indicators (NA basis, in percent of GDP)
Revenue 39.7 39.2 38.3 38.3
Expenditures 39.5 44.1 43.8 43.1
Overall balance 0.1 -4.9 -5.6 -4.8
Gross Debt 71.1 83.3 85.1 85.8Net debt 22.3 28.3 30.4 33.8
Money and Credit (Annual average)
Household Credit Growth 1/ 11.3 7.7 7.3 6.0
Business Credit Growth 1/ 5.8 1.6 1.2 6.2
Three-month treasury bill (percent) 2.4 0.4 0.6 0.9
Ten-year government bond yield (percent) 3.6 3.2 3.2 2.8
Balance of Payments (in percent of GDP)
Current account balance 0.3 -3.0 -3.1 -3.5
Merchandise Trade balance 2.8 -0.3 -0.6 -0.7
Export volume -5.3 -15.0 6.9 3.3
Import volume 1.3 -14.9 13.9 7.5
Terms of trade, percentage change 5.1 -9.3 6.0 3.6
Memorandum item
Real GDP in United States, percent change -0.3 -3.5 3.0 1.5
1/ 2011 credit numbers refer to the August Y/Y growth rate.
Projections
Table 2. Canada: Selected Economic Indicators, 2008–11
Sources: Haver Analytics and Fund staff calculations.
8/3/2019 Canada Imf
http://slidepdf.com/reader/full/canada-imf 28/54
CANADA 2011 ARTICLE IV REPORT
INTERNATIONAL MONETARY FUND 27
2010 2011 2012 2013 2014 2015 2016
National Accounts (in constant prices)
Real GDP 3.2 2.2 1.9 2.5 2.5 2.4 2.3
Q4/Q4 3.3 1.6 2.5 2.5 2.5 2.3 2.3
Net Exports 1/ -2.2 -1.3 -0.2 0.2 0.2 0.3 0.5
Total Domestic Demand 5.2 3.6 2.1 2.2 2.2 2.1 1.8
Final Domestic Demand 4.5 2.9 1.8 2.2 2.3 2.1 1.9
Private Consumption 3.3 1.9 1.6 2.4 2.2 2.2 2.0
Public Consumption 2.4 0.8 -0.2 0.4 0.6 0.8 0.9
Private Fixed Domestic Investment 8.4 9.3 5.3 5.0 4.8 3.4 2.4
Private Investment (percent of GDP) 17.9 18.7 19.2 19.7 20.1 20.3 20.3
Public Investment 17.9 0.6 -2.5 -3.0 -1.0 1.5 1.7
Change in Inventories 1/ 0.6 0.5 0.4 0.0 0.0 0.0 0.0GDP (current prices) 6.3 5.3 3.9 4.7 4.6 4.6 4.5
Employment and Inflation
Unemployment Rate (percent) 8.0 7.4 7.2 7.0 6.7 6.4 6.2
Employment 1.4 1.7 1.8 1.6 1.5 1.5 1.5
CPI Inflation 1.8 2.9 2.0 2.0 2.0 2.0 2.0
Core CPI Inflation (y/y) 1.7 1.7 1.9 2.0 2.0 2.0 2.0
GDP Deflator 2.9 3.0 1.9 2.1 2.1 2.1 2.1
Potential Output Growth 1.6 1.7 1.9 1.9 1.9 2.0 2.0
Output Gap (in percent of potential output) -2.4 -2.0 -2.0 -1.4 -0.9 -0.4 -0.1
Indicators of Fiscal Policies
(NA basis, in percent of GDP)
Federal Fiscal Balance -2.6 -1.9 -1.5 -1.0 -0.6 -0.2 -0.1General Government Fiscal Balance -5.6 -4.8 -4.0 -2.9 -2.0 -1.5 -1.1
General Government Gross Debt 85.1 85.6 86.4 83.3 81.4 79.6 77.4
General Government Net Debt 30.4 33.8 36.5 37.8 38.2 38.0 37.5
External Indicators
Current Account Balance (in percent of GDP) -3.1 -3.5 -3.8 -3.5 -3.4 -2.7 -2.2
Merchandise Trade Balance (in percent of GDP) -0.6 -0.7 -1.0 -0.7 -0.5 -0.2 -0.1
Export Volume 6.9 3.3 3.7 5.7 5.9 6.0 6.1
Import Volume 13.9 7.5 4.6 4.8 5.2 5.1 4.7
Balance on Invisibles (in percent of GDP) -2.6 -2.8 -2.8 -2.8 -2.9 -2.5 -2.1
Terms of Trade 6.0 3.6 -0.3 0.3 0.2 0.2 0.1
Saving and Investment (in percent of GDP)
Gross National Saving 19.1 19.9 20.4 20.9 21.3 22.1 22.4General Government -1.2 -0.6 0.1 0.9 1.7 2.2 2.5
Private 20.3 20.4 20.3 20.0 19.6 19.9 19.9
Gross Domestic Investment 22.2 23.4 24.1 24.3 24.6 24.7 24.7
Personal Savings (in percent of DI) 4.7 4.3 4.0 4.2 4.7 5.0 5.2
Memorandum Item
Real GDP in United States 3.0 1.5 1.8 2.5 3.1 3.4 3.4
1/ Contribution to growth.
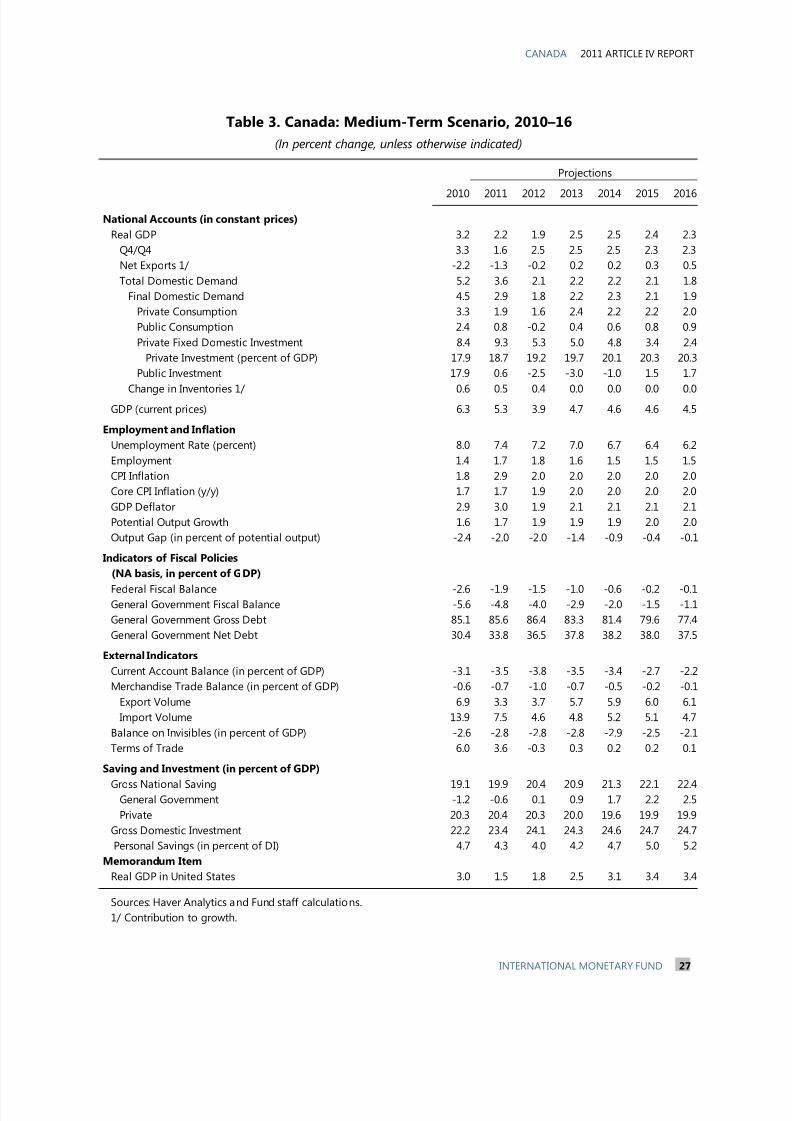
Table 3. Canada: Medium-Term Scenario, 2010–16
(In percent change, unless otherwise indicated)
Projections
Sources: Haver Analytics and Fund staff calculations.
8/3/2019 Canada Imf
http://slidepdf.com/reader/full/canada-imf 29/54
2011 ARTICLE IV REPORT CANADA
28 INTERNATIONAL MONETARY FUND
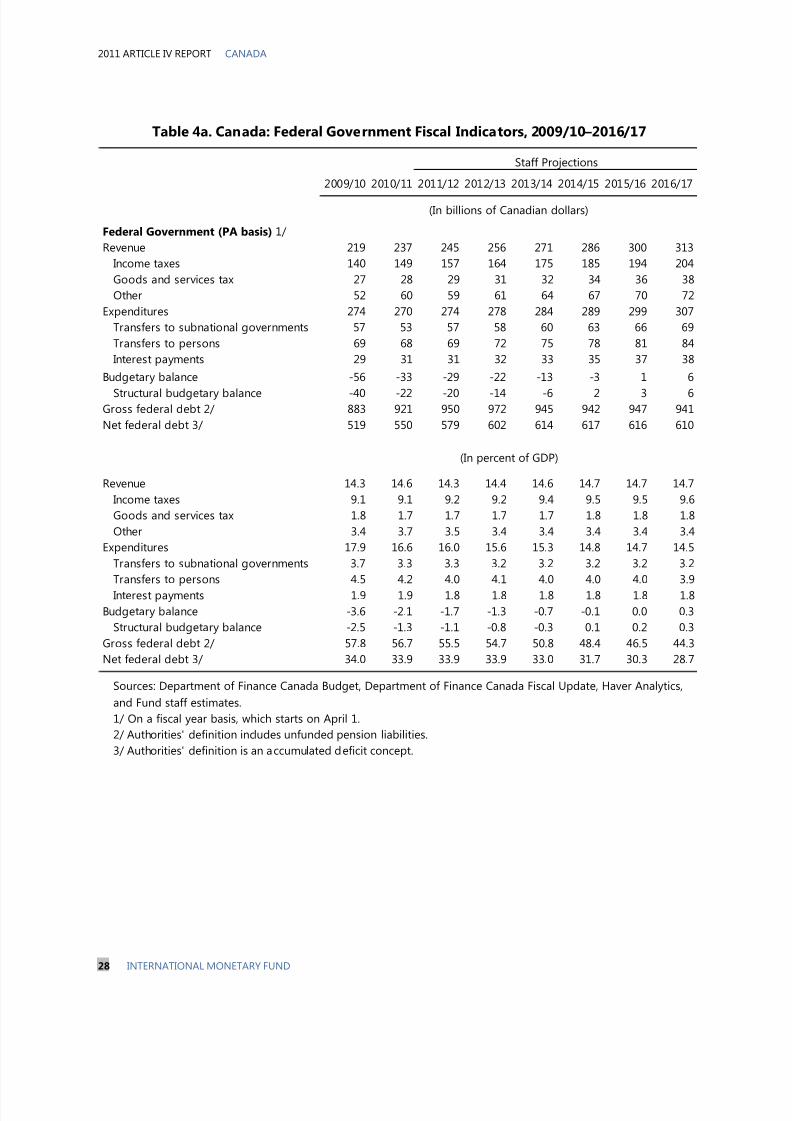
2009/10 2010/11 2011/12 2012/13 2013/14 2014/15 2015/16 2016/17
Federal Government (PA basis) 1/
Revenue 219 237 245 256 271 286 300 313
Income taxes 140 149 157 164 175 185 194 204
Goods and services tax 27 28 29 31 32 34 36 38
Other 52 60 59 61 64 67 70 72
Expenditures 274 270 274 278 284 289 299 307
Transfers to subnational governments 57 53 57 58 60 63 66 69
Transfers to persons 69 68 69 72 75 78 81 84
Interest payments 29 31 31 32 33 35 37 38
Budgetary balance -56 -33 -29 -22 -13 -3 1 6
Structural budgetary balance -40 -22 -20 -14 -6 2 3 6Gross federal debt 2/ 883 921 950 972 945 942 947 941
Net federal debt 3/ 519 550 579 602 614 617 616 610
Revenue 14.3 14.6 14.3 14.4 14.6 14.7 14.7 14.7
Income taxes 9.1 9.1 9.2 9.2 9.4 9.5 9.5 9.6
Goods and services tax 1.8 1.7 1.7 1.7 1.7 1.8 1.8 1.8
Other 3.4 3.7 3.5 3.4 3.4 3.4 3.4 3.4
Expenditures 17.9 16.6 16.0 15.6 15.3 14.8 14.7 14.5
Transfers to subnational governments 3.7 3.3 3.3 3.2 3.2 3.2 3.2 3.2
Transfers to persons 4.5 4.2 4.0 4.1 4.0 4.0 4.0 3.9
Interest payments 1.9 1.9 1.8 1.8 1.8 1.8 1.8 1.8
Budgetary balance -3.6 -2.1 -1.7 -1.3 -0.7 -0.1 0.0 0.3
Structural budgetary balance -2.5 -1.3 -1.1 -0.8 -0.3 0.1 0.2 0.3
Gross federal debt 2/ 57.8 56.7 55.5 54.7 50.8 48.4 46.5 44.3
Net federal debt 3/ 34.0 33.9 33.9 33.9 33.0 31.7 30.3 28.7
Table 4a. Canada: Federal Government Fiscal Indicators, 2009/10–2016/17
Staff Projections
(In billions of Canadian dollars)
(In percent of GDP)
3/ Authorities' definition is an accumulated deficit concept.
Sources: Department of Finance Canada Budget, Department of Finance Canada Fiscal Update, Haver Analytics,
and Fund staff estimates.
1/ On a fiscal year basis, which starts on April 1.
2/ Authorities' definition includes unfunded pension liabilities.
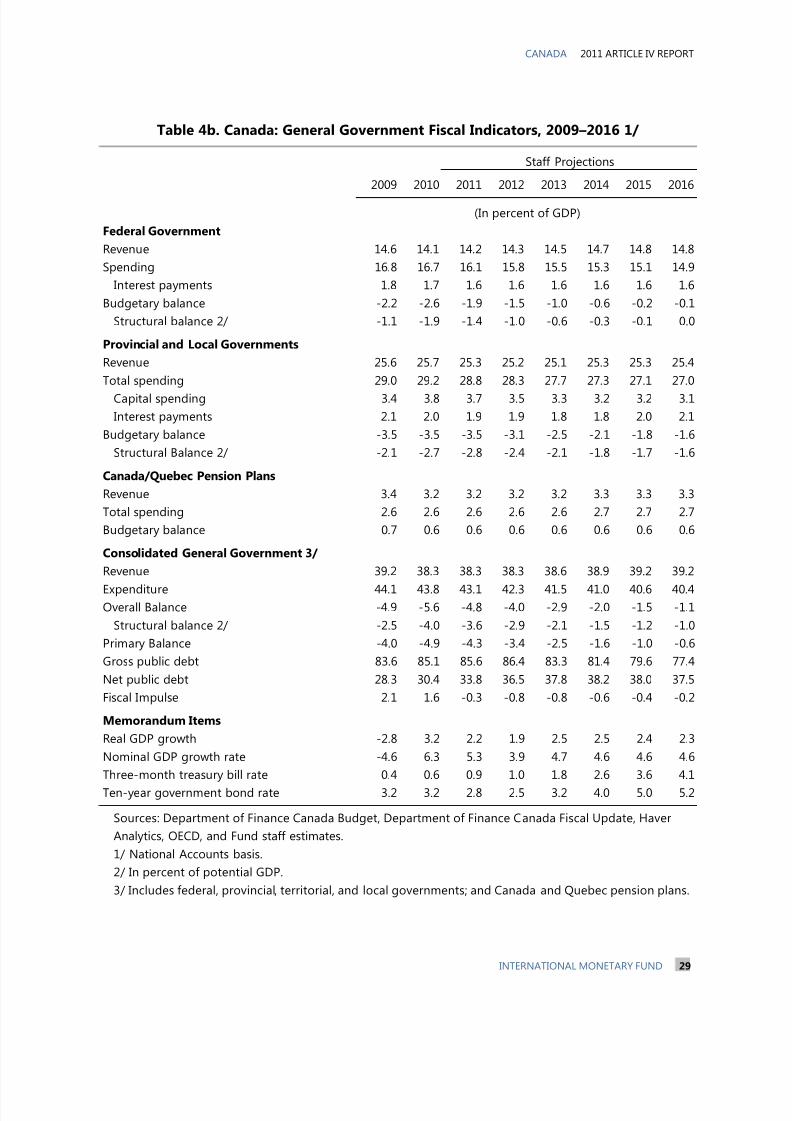
8/3/2019 Canada Imf
http://slidepdf.com/reader/full/canada-imf 30/54
CANADA 2011 ARTICLE IV REPORT
INTERNATIONAL MONETARY FUND 29
2009 2010 2011 2012 2013 2014 2015 2016
Federal Government
Revenue 14.6 14.1 14.2 14.3 14.5 14.7 14.8 14.8
Spending 16.8 16.7 16.1 15.8 15.5 15.3 15.1 14.9
Interest payments 1.8 1.7 1.6 1.6 1.6 1.6 1.6 1.6
Budgetary balance -2.2 -2.6 -1.9 -1.5 -1.0 -0.6 -0.2 -0.1
Structural balance 2/ -1.1 -1.9 -1.4 -1.0 -0.6 -0.3 -0.1 0.0
Provincial and Local Governments
Revenue 25.6 25.7 25.3 25.2 25.1 25.3 25.3 25.4
Total spending 29.0 29.2 28.8 28.3 27.7 27.3 27.1 27.0
Capital spending 3.4 3.8 3.7 3.5 3.3 3.2 3.2 3.1
Interest payments 2.1 2.0 1.9 1.9 1.8 1.8 2.0 2.1
Budgetary balance -3.5 -3.5 -3.5 -3.1 -2.5 -2.1 -1.8 -1.6
Structural Balance 2/ -2.1 -2.7 -2.8 -2.4 -2.1 -1.8 -1.7 -1.6
Canada/Quebec Pension Plans
Revenue 3.4 3.2 3.2 3.2 3.2 3.3 3.3 3.3
Total spending 2.6 2.6 2.6 2.6 2.6 2.7 2.7 2.7
Budgetary balance 0.7 0.6 0.6 0.6 0.6 0.6 0.6 0.6
Consolidated General Government 3/
Revenue 39.2 38.3 38.3 38.3 38.6 38.9 39.2 39.2
Expenditure 44.1 43.8 43.1 42.3 41.5 41.0 40.6 40.4Overall Balance -4.9 -5.6 -4.8 -4.0 -2.9 -2.0 -1.5 -1.1
Structural balance 2/ -2.5 -4.0 -3.6 -2.9 -2.1 -1.5 -1.2 -1.0
Primary Balance -4.0 -4.9 -4.3 -3.4 -2.5 -1.6 -1.0 -0.6
Gross public debt 83.6 85.1 85.6 86.4 83.3 81.4 79.6 77.4
Net public debt 28.3 30.4 33.8 36.5 37.8 38.2 38.0 37.5
Fiscal Impulse 2.1 1.6 -0.3 -0.8 -0.8 -0.6 -0.4 -0.2
Memorandum Items
Real GDP growth -2.8 3.2 2.2 1.9 2.5 2.5 2.4 2.3
Nominal GDP growth rate -4.6 6.3 5.3 3.9 4.7 4.6 4.6 4.6
Three-month treasury bill rate 0.4 0.6 0.9 1.0 1.8 2.6 3.6 4.1
Ten-year government bond rate 3.2 3.2 2.8 2.5 3.2 4.0 5.0 5.2
Staff Projections
Table 4b. Canada: General Government Fiscal Indicators, 2009–2016 1/
(In percent of GDP)
3/ Includes federal, provincial, territorial, and local governments; and Canada and Quebec pension plans.
Sources: Department of Finance Canada Budget, Department of Finance Canada Fiscal Update, Haver
Analytics, OECD, and Fund staff estimates.
1/ National Accounts basis.
2/ In percent of potential GDP.
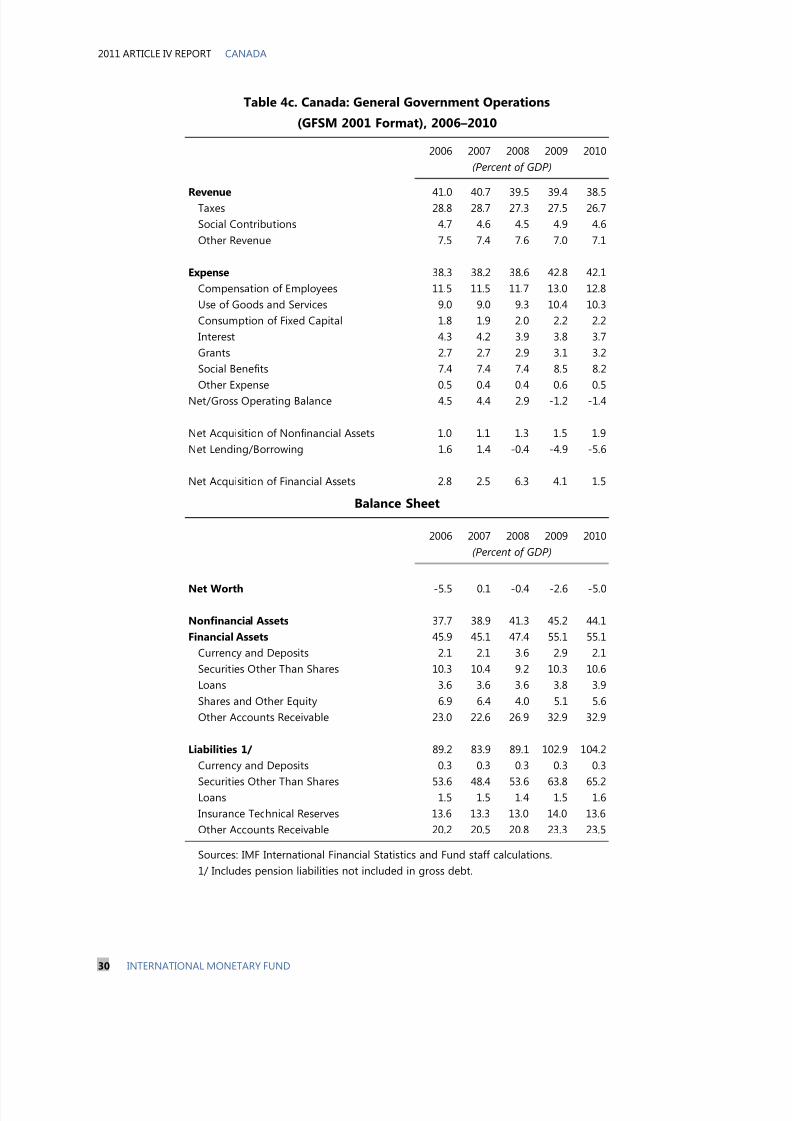
8/3/2019 Canada Imf
http://slidepdf.com/reader/full/canada-imf 31/54
2011 ARTICLE IV REPORT CANADA
30 INTERNATIONAL MONETARY FUND
2006 2007 2008 2009 2010
Revenue 41.0 40.7 39.5 39.4 38.5Taxes 28.8 28.7 27.3 27.5 26.7
Social Contributions 4.7 4.6 4.5 4.9 4.6
Other Revenue 7.5 7.4 7.6 7.0 7.1
Expense 38.3 38.2 38.6 42.8 42.1
Compensation of Employees 11.5 11.5 11.7 13.0 12.8
Use of Goods and Services 9.0 9.0 9.3 10.4 10.3
Consumption of Fixed Capital 1.8 1.9 2.0 2.2 2.2
Interest 4.3 4.2 3.9 3.8 3.7
Grants 2.7 2.7 2.9 3.1 3.2
Social Benefits 7.4 7.4 7.4 8.5 8.2
Other Expense 0.5 0.4 0.4 0.6 0.5
Net/Gross Operating Balance 4.5 4.4 2.9 -1.2 -1.4
Net Acquisition of Nonfinancial Assets 1.0 1.1 1.3 1.5 1.9
Net Lending/Borrowing 1.6 1.4 -0.4 -4.9 -5.6
Net Acquisition of Financial Assets 2.8 2.5 6.3 4.1 1.5
2006 2007 2008 2009 2010
Net Worth -5.5 0.1 -0.4 -2.6 -5.0
Nonfinancial Assets 37.7 38.9 41.3 45.2 44.1
Financial Assets 45.9 45.1 47.4 55.1 55.1
Currency and Deposits 2.1 2.1 3.6 2.9 2.1
Securities Other Than Shares 10.3 10.4 9.2 10.3 10.6
Loans 3.6 3.6 3.6 3.8 3.9
Shares and Other Equity 6.9 6.4 4.0 5.1 5.6
Other Accounts Receivable 23.0 22.6 26.9 32.9 32.9
Liabilities 1/ 89.2 83.9 89.1 102.9 104.2
Currency and Deposits 0.3 0.3 0.3 0.3 0.3
Securities Other Than Shares 53.6 48.4 53.6 63.8 65.2Loans 1.5 1.5 1.4 1.5 1.6
Insurance Technical Reserves 13.6 13.3 13.0 14.0 13.6
Other Accounts Receivable 20.2 20.5 20.8 23.3 23.5
Table 4c. Canada: General Government Operations
(GFSM 2001 Format), 2006–2010
(Percent of GDP)
Balance Sheet
(Percent of GDP)
1/ Includes pension liabilities not included in gross debt.
Sources: IMF International Financial Statistics and Fund staff calculations.
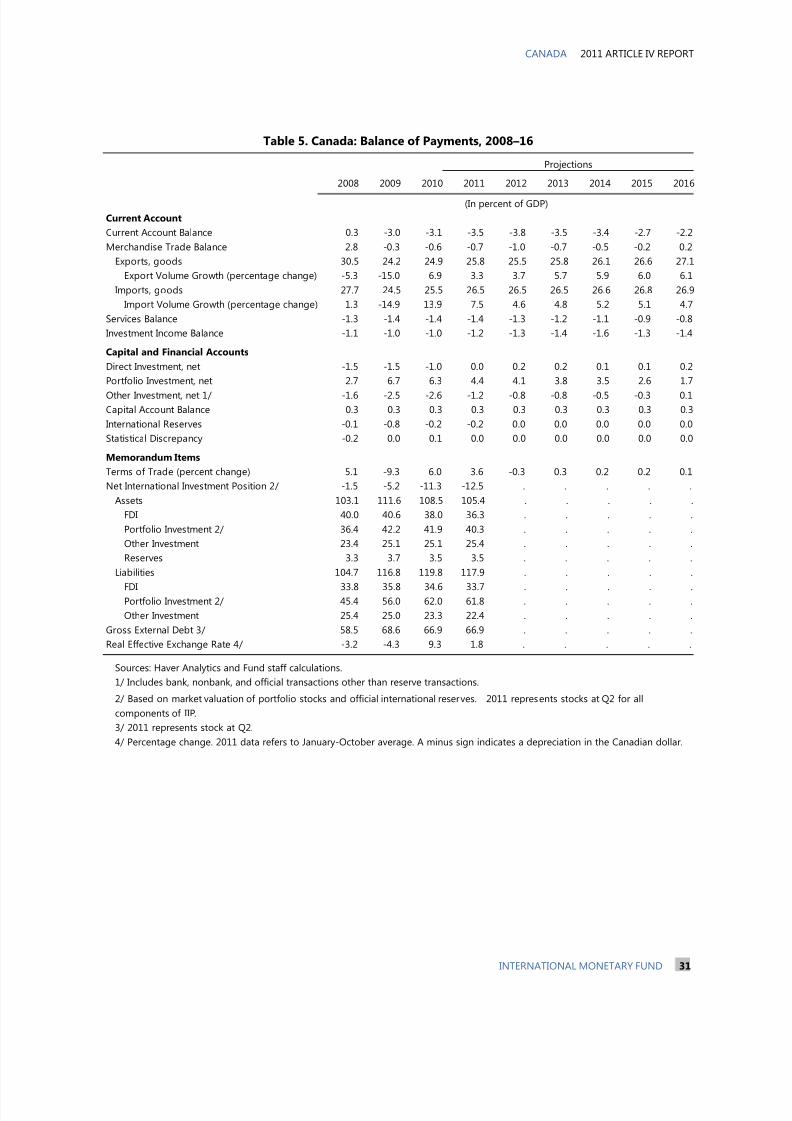
8/3/2019 Canada Imf
http://slidepdf.com/reader/full/canada-imf 32/54
CANADA 2011 ARTICLE IV REPORT
INTERNATIONAL MONETARY FUND 31
2008 2009 2010 2011 2012 2013 2014 2015 2016
Current Account
Current Account Balance 0.3 -3.0 -3.1 -3.5 -3.8 -3.5 -3.4 -2.7 -2.2
Merchandise Trade Balance 2.8 -0.3 -0.6 -0.7 -1.0 -0.7 -0.5 -0.2 0.2
Exports, goods 30.5 24.2 24.9 25.8 25.5 25.8 26.1 26.6 27.1
Export Volume Growth (percentage change) -5.3 -15.0 6.9 3.3 3.7 5.7 5.9 6.0 6.1
Imports, goods 27.7 24.5 25.5 26.5 26.5 26.5 26.6 26.8 26.9
Import Volume Growth (percentage change) 1.3 -14.9 13.9 7.5 4.6 4.8 5.2 5.1 4.7
Services Balance -1.3 -1.4 -1.4 -1.4 -1.3 -1.2 -1.1 -0.9 -0.8
Investment Income Balance -1.1 -1.0 -1.0 -1.2 -1.3 -1.4 -1.6 -1.3 -1.4
Capital and Financial Accounts
Direct Investment, net -1.5 -1.5 -1.0 0.0 0.2 0.2 0.1 0.1 0.2
Portfolio Investment, net 2.7 6.7 6.3 4.4 4.1 3.8 3.5 2.6 1.7
Other Investment, net 1/ -1.6 -2.5 -2.6 -1.2 -0.8 -0.8 -0.5 -0.3 0.1Capital Account Balance 0.3 0.3 0.3 0.3 0.3 0.3 0.3 0.3 0.3
International Reserves -0.1 -0.8 -0.2 -0.2 0.0 0.0 0.0 0.0 0.0
Statistical Discrepancy -0.2 0.0 0.1 0.0 0.0 0.0 0.0 0.0 0.0
Memorandum Items
Terms of Trade (percent change) 5.1 -9.3 6.0 3.6 -0.3 0.3 0.2 0.2 0.1
Net International Investment Position 2/ -1.5 -5.2 -11.3 -12.5 . . . . .
Assets 103.1 111.6 108.5 105.4 . . . . .
FDI 40.0 40.6 38.0 36.3 . . . . .
Portfolio Investment 2/ 36.4 42.2 41.9 40.3 . . . . .
Other Investment 23.4 25.1 25.1 25.4 . . . . .
Reserves 3.3 3.7 3.5 3.5 . . . . .
Liabilities 104.7 116.8 119.8 117.9 . . . . .
FDI 33.8 35.8 34.6 33.7 . . . . .Portfolio Investment 2/ 45.4 56.0 62.0 61.8 . . . . .
Other Investment 25.4 25.0 23.3 22.4 . . . . .
Gross External Debt 3/ 58.5 68.6 66.9 66.9 . . . . .
Real Effective Exchange Rate 4/ -3.2 -4.3 9.3 1.8 . . . . .
3/ 2011 represents stock at Q2.
4/ Percentage change. 2011 data refers to January-October average. A minus sign indicates a depreciation in the Canadian dollar.
2/ Based on market valuation of portfolio stocks and official international reserves. 2011 represents stocks at Q2 for all
components of IIP.
Projections
Table 5. Canada: Balance of Payments, 2008–16
Sources: Haver Analytics and Fund staff calculations.
1/ Includes bank, nonbank, and official transactions other than reserve transactions.
(In percent of GDP)
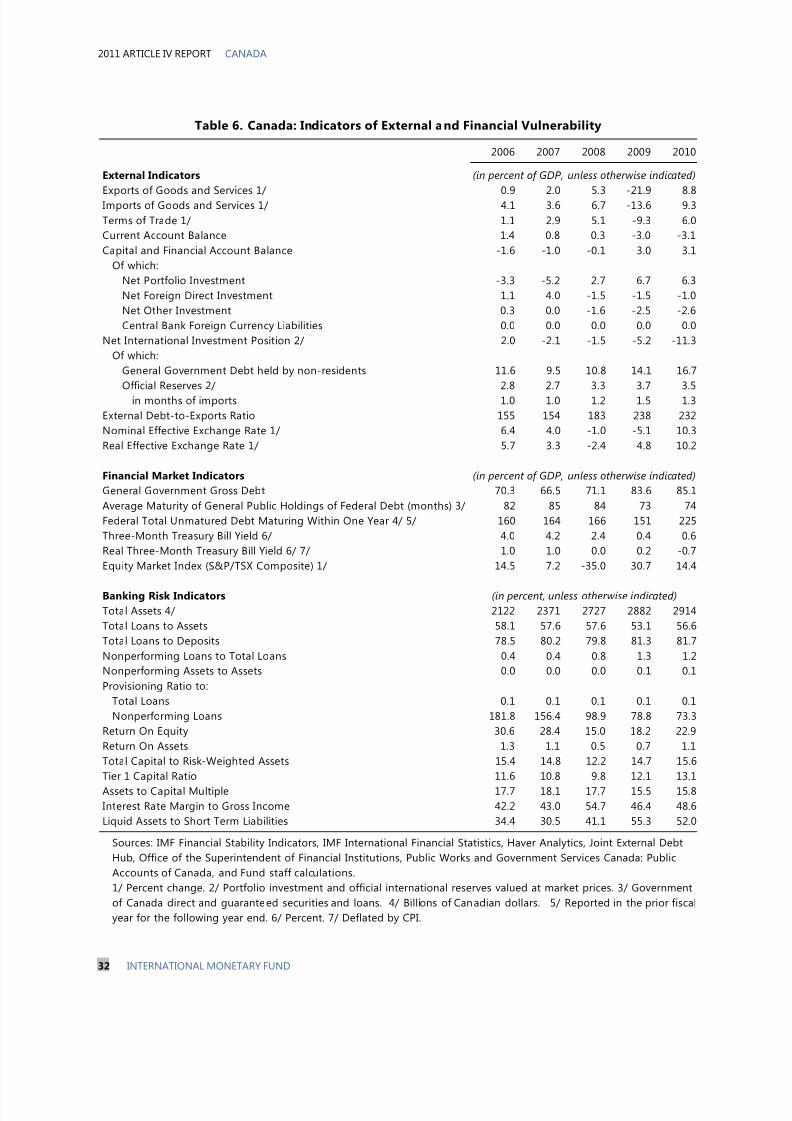
8/3/2019 Canada Imf
http://slidepdf.com/reader/full/canada-imf 33/54
2011 ARTICLE IV REPORT CANADA
32 INTERNATIONAL MONETARY FUND
2006 2007 2008 2009 2010
External Indicators
Exports of Goods and Services 1/ 0.9 2.0 5.3 -21.9 8.8Imports of Goods and Services 1/ 4.1 3.6 6.7 -13.6 9.3
Terms of Trade 1/ 1.1 2.9 5.1 -9.3 6.0
Current Account Balance 1.4 0.8 0.3 -3.0 -3.1
Capital and Financial Account Balance -1.6 -1.0 -0.1 3.0 3.1
Of which:
Net Portfolio Investment -3.3 -5.2 2.7 6.7 6.3
Net Foreign Direct Investment 1.1 4.0 -1.5 -1.5 -1.0
Net Other Investment 0.3 0.0 -1.6 -2.5 -2.6
Central Bank Foreign Currency Liabilities 0.0 0.0 0.0 0.0 0.0
Net International Investment Position 2/ 2.0 -2.1 -1.5 -5.2 -11.3
Of which:
General Government Debt held by non-residents 11.6 9.5 10.8 14.1 16.7
Official Reserves 2/ 2.8 2.7 3.3 3.7 3.5
in months of imports 1.0 1.0 1.2 1.5 1.3
External Debt-to-Exports Ratio 155 154 183 238 232
Nominal Effective Exchange Rate 1/ 6.4 4.0 -1.0 -5.1 10.3
Real Effective Exchange Rate 1/ 5.7 3.3 -2.4 -4.8 10.2
Financial Market Indicators
General Government Gross Debt 70.3 66.5 71.1 83.6 85.1
Average Maturity of General Public Holdings of Federal Debt (months) 3/ 82 85 84 73 74
Federal Total Unmatured Debt Maturing Within One Year 4/ 5/ 160 164 166 151 225
Three-Month Treasury Bill Yield 6/ 4.0 4.2 2.4 0.4 0.6
Real Three-Month Treasury Bill Yield 6/ 7/ 1.0 1.0 0.0 0.2 -0.7
Equity Market Index (S&P/TSX Composite) 1/ 14.5 7.2 -35.0 30.7 14.4
Banking Risk Indicators
Total Assets 4/ 2122 2371 2727 2882 2914
Total Loans to Assets 58.1 57.6 57.6 53.1 56.6
Total Loans to Deposits 78.5 80.2 79.8 81.3 81.7
Nonperforming Loans to Total Loans 0.4 0.4 0.8 1.3 1.2
Nonperforming Assets to Assets 0.0 0.0 0.0 0.1 0.1
Provisioning Ratio to:
Total Loans 0.1 0.1 0.1 0.1 0.1
Nonperforming Loans 181.8 156.4 98.9 78.8 73.3
Return On Equity 30.6 28.4 15.0 18.2 22.9
Return On Assets 1.3 1.1 0.5 0.7 1.1
Total Capital to Risk-Weighted Assets 15.4 14.8 12.2 14.7 15.6
Tier 1 Capital Ratio 11.6 10.8 9.8 12.1 13.1
Assets to Capital Multiple 17.7 18.1 17.7 15.5 15.8
Interest Rate Margin to Gross Income 42.2 43.0 54.7 46.4 48.6
Liquid Assets to Short Term Liabilities 34.4 30.5 41.1 55.3 52.0
1/ Percent change. 2/ Portfolio investment and official international reserves valued at market prices. 3/ Government
of Canada direct and guaranteed securities and loans. 4/ Billions of Canadian dollars. 5/ Reported in the prior fiscal
year for the following year end. 6/ Percent. 7/ Deflated by CPI.
(in percent of GDP, unless otherwise indicated)
(in percent of GDP, unless otherwise indicated)
(in percent, unless otherwise indicated)
Table 6. Canada: Indicators of External and Financial Vulnerability
Sources: IMF Financial Stability Indicators, IMF International Financial Statistics, Haver Analytics, Joint External Debt
Hub, Office of the Superintendent of Financial Institutions, Public Works and Government Services Canada: Public
Accounts of Canada, and Fund staff calculations.
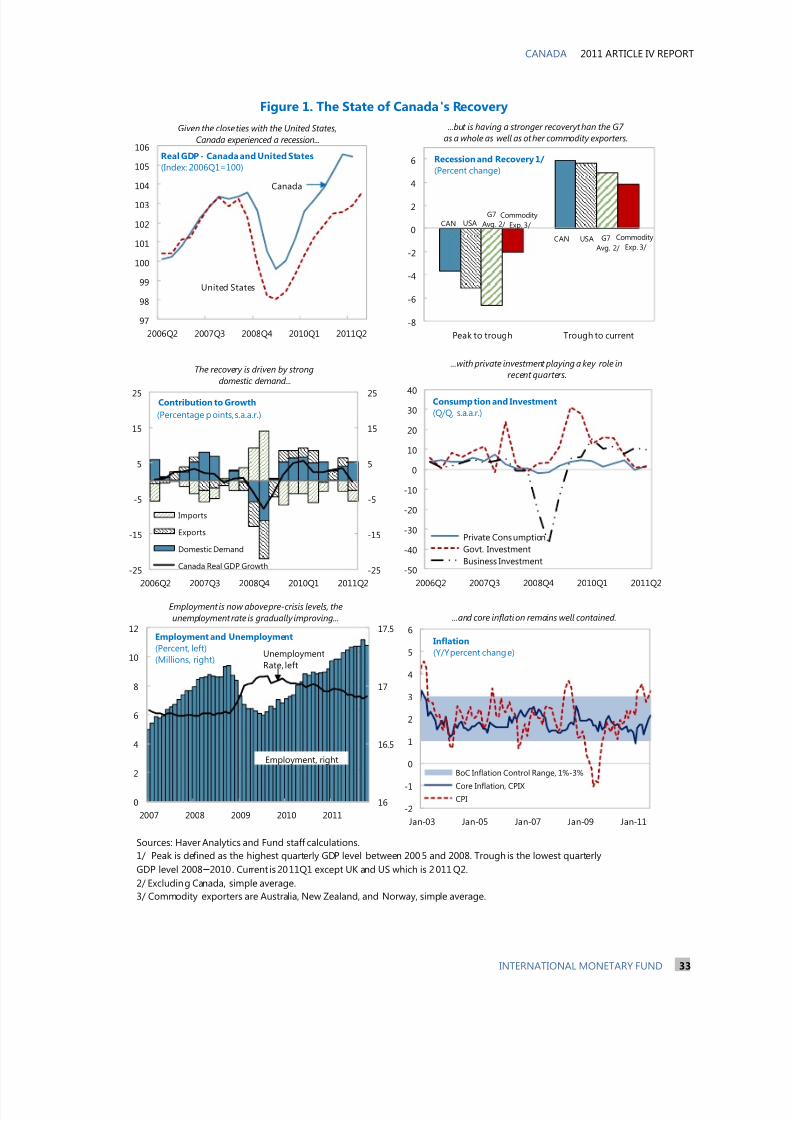
8/3/2019 Canada Imf
http://slidepdf.com/reader/full/canada-imf 34/54
CANADA 2011 ARTICLE IV REPORT
INTERNATIONAL MONETARY FUND 33
Figure 1. The State of Canada's Recovery
Sources: Haver Analytics and Fund staff calculations.
1/ Peak is defined as the highest quarterly GDP level between 2005 and 2008. Trough is the lowest quarterly
GDP level 2008 –2010. Current is 2011Q1 except UK and US which is 2011Q2.
2/ Excluding Canada, simple average.
3/ Commodity exporters are Australia, New Zealand, and Norway, simple average.
-25
-15
-5
5
15
25
-25
-15
-5
5
15
25
2006Q2 2007Q3 2008Q4 2010Q1 2011Q2
Imports
Exports
Domestic Demand
Canada Real GDP Growth
(Percentage points, s.a.a.r.)
Contribution to Growth
16
16.5
17
17.5
0
2
4
6
8
10
12
2007 2008 2009 2010 2011
Employment, right
Unemployment
Rate, left
Employment and Unemployment
(Percent, left)
(Millions, right)
-2
-1
0
1
2
3
4
5
6
Jan-03 Jan-05 Jan-07 Jan-09 Jan-11
Inflation
(Y/Y percent change)
BoC Inflation Control Range, 1%-3%
Core Inflation, CPIXCPI
The recovery is driven by strong
domestic demand...
Employment is now above pre-crisis levels, the
unemployment rate is gradually improving... ...and core inflation remains well contained.
...with private investment playing a key role in
recent quarters.
-50
-40
-30
-20
-10
0
10
20
30
40
2006Q2 2007Q3 2008Q4 2010Q1 2011Q2
Private Consumption
Govt. Investment
Business Investment
Consumption and Investment
(Q/Q, s.a.a.r.)
-8
-6
-4
-2
0
2
4
6
Peak to trough Trough to current
CANCommodity
Exp. 3/
G7
Avg. 2/ USA
Recession and Recovery 1/
(Percent change)
G7
Avg. 2/ CAN USA Commodity
Exp. 3/
97
98
99
100
101
102
103
104
105
106
2006Q2 2007Q3 2008Q4 2010Q1 2011Q2
Real GDP - Canada and United States
(Index: 2006Q1=100)
United States
Canada
Given the close ties with the United States,
Canada experienced a recession...
...but is having a stronger recoveryt han the G7
as a whole as well as other commodity exporters.
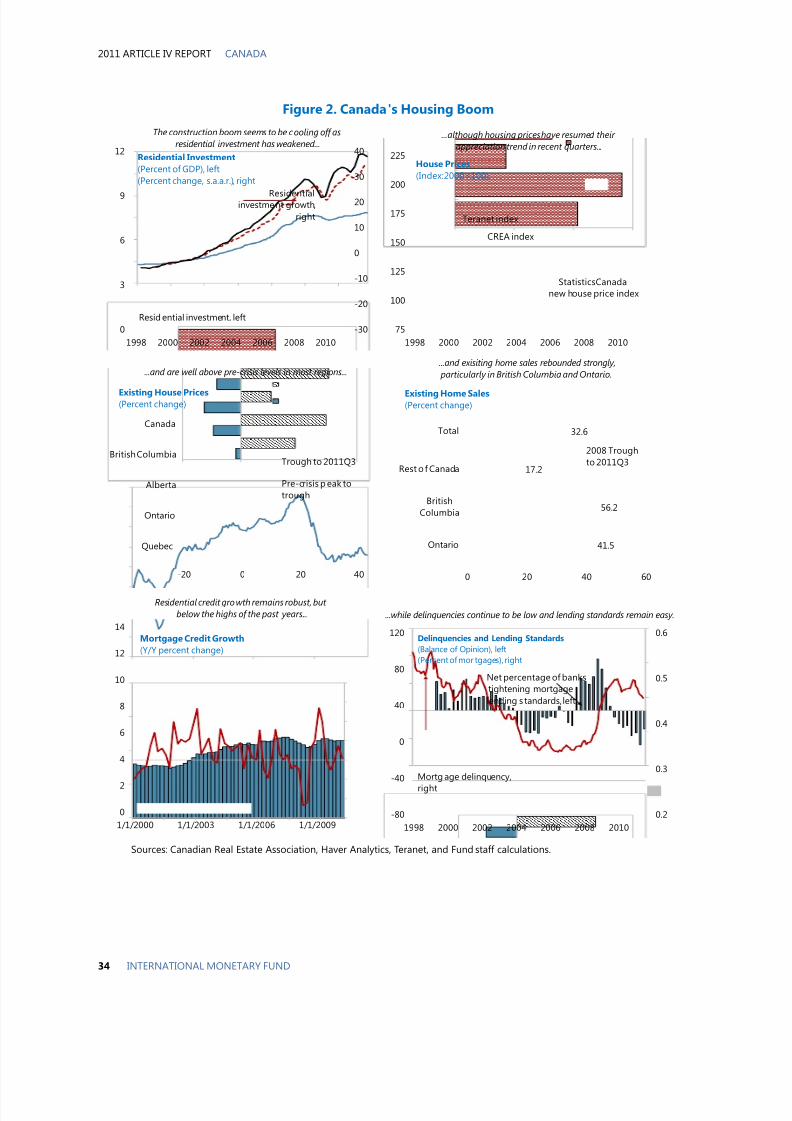
8/3/2019 Canada Imf
http://slidepdf.com/reader/full/canada-imf 35/54
2011 ARTICLE IV REPORT CANADA
34 INTERNATIONAL MONETARY FUND
Figure 2. Canada's Housing Boom
Sources: Canadian Real Estate Association, Haver Analytics, Teranet, and Fund staff calculations.
-30
-20
-10
0
10
20
30
40
0
3
6
9
12
1998 2000 2002 2004 2006 2008 2010
Resid ential investment, left
Residentialinvestment growth,
right
Residential Investment
(Percent of GDP), left(Percent change, s.a.a.r.), right
75
100
125
150
175
200
225
1998 2000 2002 2004 2006 2008 2010
CREA index
StatisticsCanadanew house price index
Teranet index
House Prices
(Index:2000=100)
0.2
0.3
0.4
0.5
0.6
-80
-40
0
40
80
120
1998 2000 2002 2004 2006 2008 2010
Mortg age delinquency,
right
Net percentage of bankstightening mortgage
lending s tandards, left
Delinquencies and Lending Standards
(Balance of Opinion), left(Percent of mor tgages), right
0
2
4
6
8
10
12
14
1/1/2000 1/1/2003 1/1/2006 1/1/2009
Mortgage Credit Growth
(Y/Y percent change)
The construction boom seems to be cooling off as
residential investment has weakened......although housing prices have resumed their
appreciation trend in recent quarters...
Residential credit growth remains robust, but
below the highs of the past years... ...while delinquencies continue to be low and lending standards remain easy.
-20 0 20 40
Quebec
Ontario
Alberta
British Columbia
Canada
Existing House Prices(Percent change)
Trough to 2011Q3
Pre-crisis p eak totrough
...and are well above pre-crisis levels in most regions...
41.5
56.2
17.2
32.6
0 20 40 60
Ontario
BritishColumbia
Rest o f Canada
Total
2008 Troughto 2011Q3
Existing Home Sales(Percent change)
...and exisiting home sales rebounded strongly,
particularly in British Columbia and Ontario.
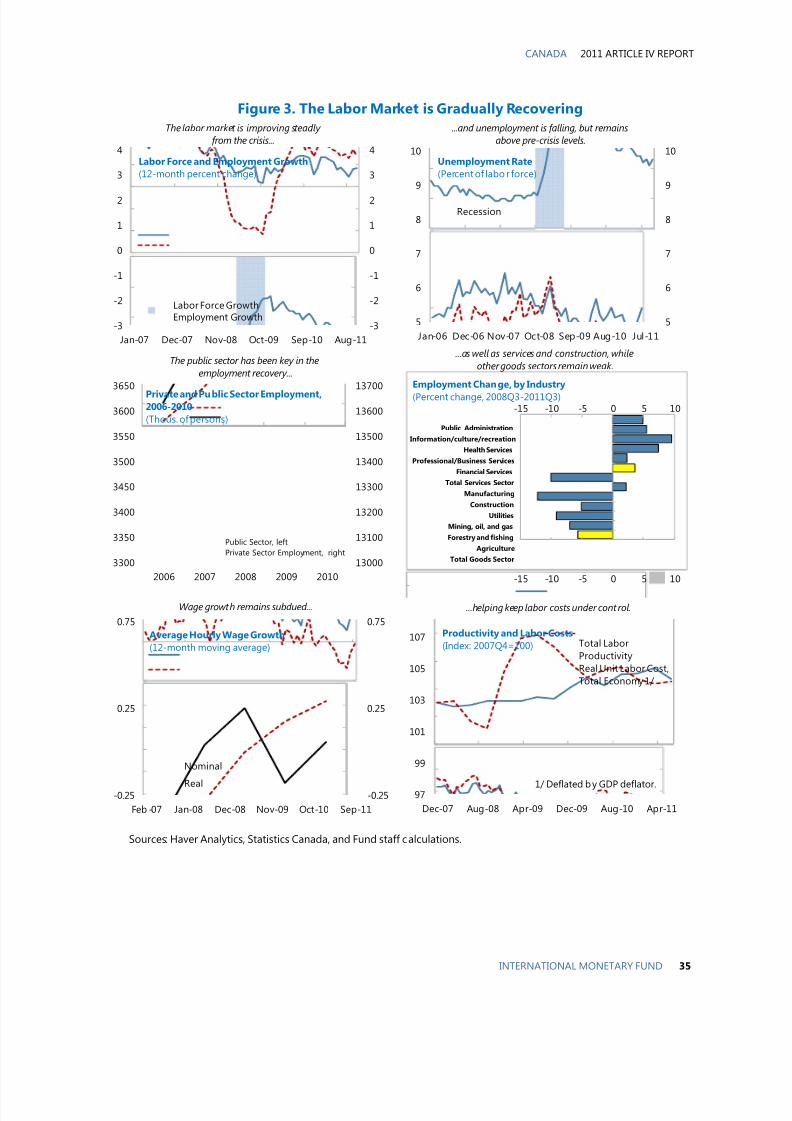
8/3/2019 Canada Imf
http://slidepdf.com/reader/full/canada-imf 36/54
CANADA 2011 ARTICLE IV REPORT
INTERNATIONAL MONETARY FUND 35
Figure 3. The Labor Market is Gradually Recovering
Sources: Haver Analytics, Statistics Canada, and Fund staff calculations.
-3
-2
-1
0
1
2
3
4
-3
-2
-1
0
1
2
3
4
Jan-07 Dec-07 Nov-08 Oct-09 Sep-10 Aug-11
Labor Force GrowthEmployment Growth
Labor Force and Employment Growth
(12-month percent change)
5
6
7
8
9
10
5
6
7
8
9
10
Jan-06 Dec-06 Nov-07 Oct-08 Sep-09 Aug-10 Jul-11
Recession
Unemployment Rate
(Percent of labo r force)
13000
13100
13200
13300
13400
13500
13600
13700
3300
3350
3400
3450
3500
3550
3600
3650
2006 2007 2008 2009 2010
Public Sector, left
Private Sector Employment, right
Private and Public Sector Employment,2006-2010
(Thous. of persons)-15 -10 -5 0 5 10
-15 -10 -5 0 5 10
Total Goods Sector
Agriculture
Forestry and fishing
Mining, oil, and gas
Utilities
Construction
Manufacturing
Total Services Sector
Financial Services
Professional/Business Services
Health Services
Information/culture/recreation
Public Administration
Employment Change, by Industry
(Percent change, 2008Q3-2011Q3)
-0.25
0.25
0.75
-0.25
0.25
0.75
Feb -07 Jan-08 Dec-08 Nov-09 Oct-10 Sep-11
Nominal
Real
Average Hourly Wage Growth
(12-month moving average)
97
99
101
103
105
107
Dec-07 Aug-08 Apr-09 Dec-09 Aug-10 Apr-11
Total LaborProductivityReal Unit Labor Cost,Total Economy 1/
Productivity and Labor Costs
(Index: 2007Q4=100)
The labor market is improving steadly
from the crisis...
...helping keep labor costs under cont rol.
...and unemployment is falling, but remains
above pre-crisis levels.
The public sector has been key in the
employment recovery...
...as well as services and construction, while
other goods sectors remain weak.
Wage growth remains subdued...
1/ Deflated by GDP deflator.
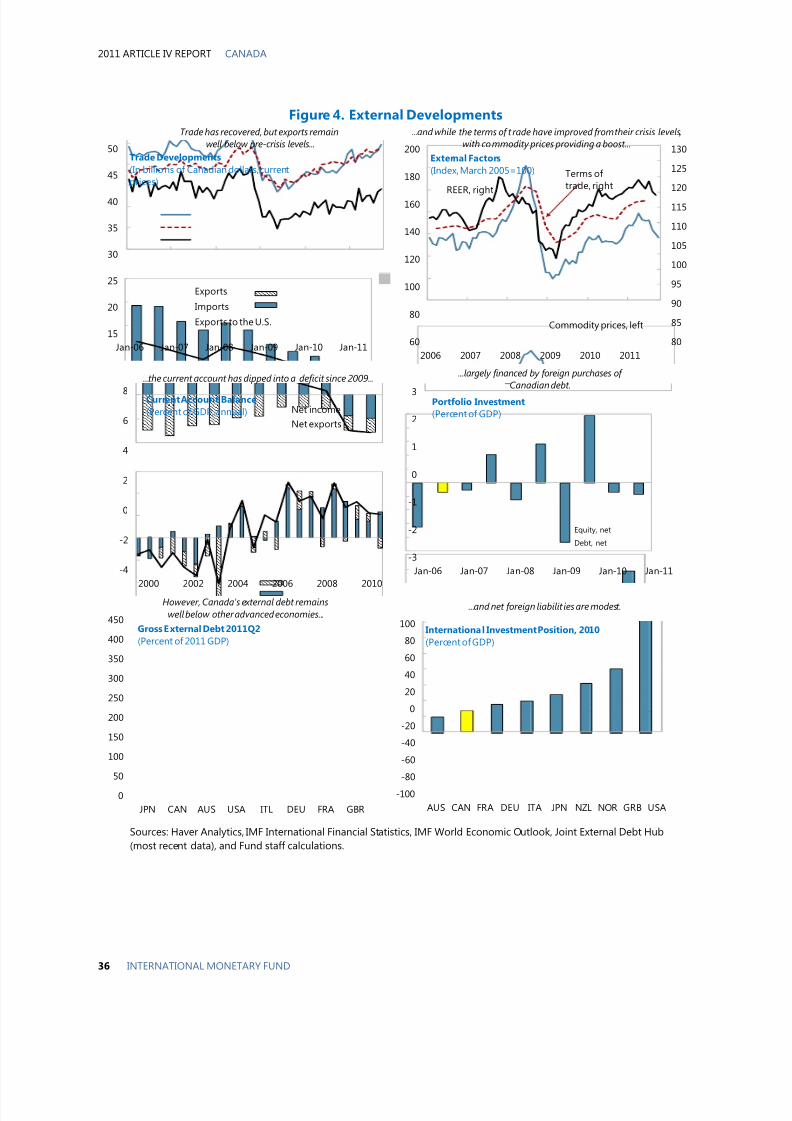
8/3/2019 Canada Imf
http://slidepdf.com/reader/full/canada-imf 37/54
2011 ARTICLE IV REPORT CANADA
36 INTERNATIONAL MONETARY FUND
Figure 4. External Developments
Sources: Haver Analytics, IMF International Financial Statistics, IMF World Economic Outlook, Joint External Debt Hub
(most recent data), and Fund staff calculations.
15
20
25
30
35
40
45
50
Jan-06 Jan-07 Jan-08 Jan-09 Jan-10 Jan-11
Exports
Imports
Exports to the U.S.
Trade Developments
(In billions of Canadiandollars, currentprices)
-4
-2
0
2
4
6
8
2000 2002 2004 2006 2008 2010
Net income
Net exports
Current Account Balance
(Percent of GDP, annual)
-3
-2
-1
0
1
2
3
Jan-06 Jan-07 Jan-08 Jan-09 Jan-10 Jan-11
Equity, net
Debt, net
Portfolio Investment
(Percent of GDP)
-100
-80
-60
-40
-20
0
20
40
60
80
100
AUS CAN FRA DEU ITA JPN NZL NOR GRB USA
International Investment Position, 2010
(Percent of GDP)
0
50
100
150
200
250
300
350
400
450
JPN CAN AUS USA ITL DEU FRA GBR
Gross External Debt 2011Q2
(Percent of 2011 GDP)
Trade has recovered, but exports remain
well below pre-crisis levels...
...the current account has dipped into a deficit since 2009......largely financed by foreign purchases of
Canadian debt.
...and net foreign liabilit ies are modest.
80
85
90
95
100
105
110
115
120
125
130
60
80
100
120
140
160
180
200
2006 2007 2008 2009 2010 2011
Terms of trade, right
External Factors
(Index, March 2005=100)
Commodity prices, left
REER, right
...and while the terms of t rade have improved from their crisis levels,
with commodity prices providing a boost...
However, Canada's external debt remains
well below other advanced economies...
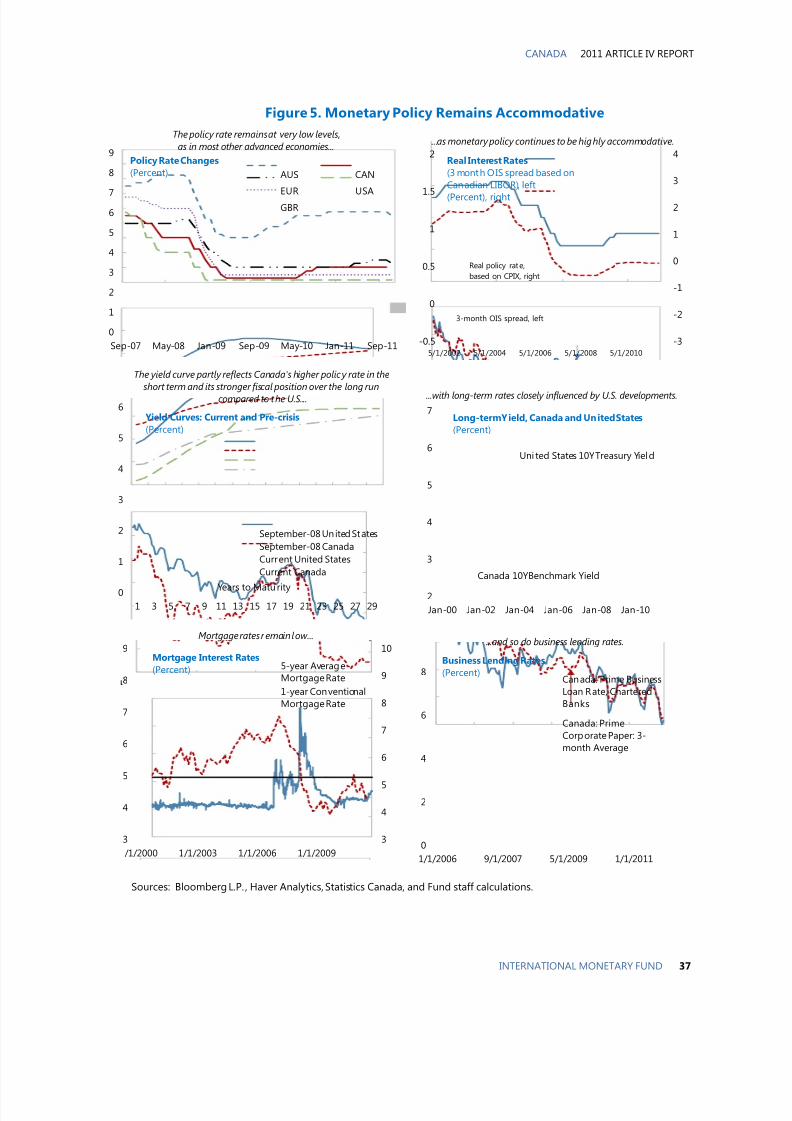
8/3/2019 Canada Imf
http://slidepdf.com/reader/full/canada-imf 38/54
CANADA 2011 ARTICLE IV REPORT
INTERNATIONAL MONETARY FUND 37
Figure 5. Monetary Policy Remains Accommodative
0
2
4
6
8
1/1/2006 9/1/2007 5/1/2009 1/1/2011
Business Lending Rates
(Percent)Canada: Prime Business
Loan Rate, Chartered
Banks
Canada: Prime
Corporate Paper: 3-
month Average
3
4
5
6
7
8
9
10
3
4
5
6
7
8
9
/1/2000 1/1/2003 1/1/2006 1/1/2009
Mortgage Interest Rates
(Percent) 5-year Average
Mortgage Rate
1-year Conventional
Mortgage Rate
Sources: Bloomberg L.P. , Haver Analytics, Statistics Canada, and Fund staff calculations.
-3
-2
-1
0
1
2
3
4
-0.5
0
0.5
1
1.5
2
5/1/2002 5/1/2004 5/1/2006 5/1/2008 5/1/2010
Real Interest Rates
(3 month OIS spread based on
Canadian LIBOR), left
(Percent), right
3-month OIS spread, left
Real policy rate,
based on CPIX, right
0
1
2
3
4
5
6
1 3 5 7 9 11 13 15 17 19 21 23 25 27 29
September-08 United States
September-08 Canada
Current United States
Current Canada
Yield Curves: Current and Pre-crisis
(Percent)
Years to Matu rity 2
3
4
5
6
7
Jan-00 Jan-02 Jan-04 Jan-06 Jan-08 Jan-10
Long-termYield, Canada and United States
(Percent)
Canada 10YBenchmark Yield
Uni ted States 10Y Treasury Yield
0
1
2
3
4
5
6
7
8
9
Sep-07 May-08 Jan-09 Sep-09 May-10 Jan-11 Sep-11
AUS CAN
EUR USAGBR
Policy RateChanges
(Percent)
Mortgage rates remain low......and so do business lending rates.
...with long-term rates closely influenced by U.S. developments.
The yield curve partly reflects Canada's higher policy rate in the
short term and its stronger fiscal position over the long run
compared to the U.S....
...as monetarypolicy continues to be highly accommodative.The policy rate remains at very low levels,
as in most other advanced economies...
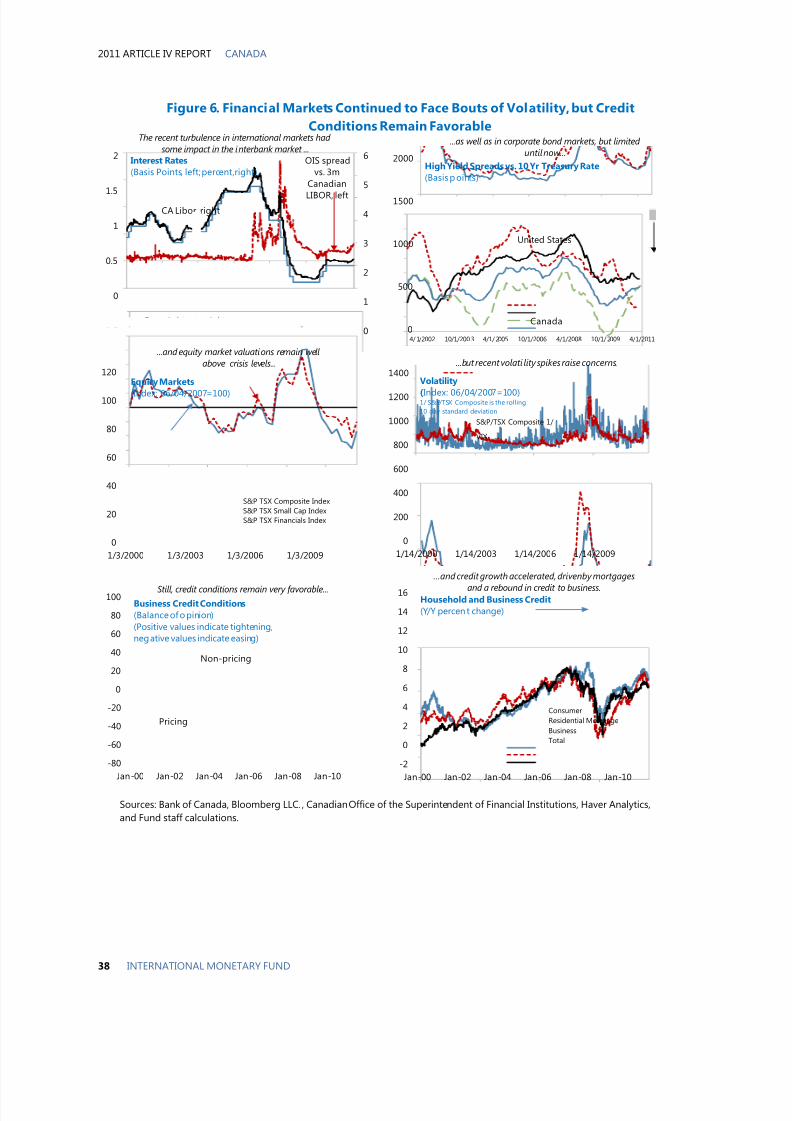
8/3/2019 Canada Imf
http://slidepdf.com/reader/full/canada-imf 39/54
2011 ARTICLE IV REPORT CANADA
38 INTERNATIONAL MONETARY FUND
Figure 6. Financial Markets Continued to Face Bouts of Volatility, but Credit
Conditions Remain Favorable
Sources: Bank of Canada, Bloomberg LLC. , Canadian Office of the Superintendent of Financial Institutions, Haver Analytics,
and Fund staff calculations.
0
1
2
3
4
5
6
-0.5
0
0.5
1
1.5
2
5/1/2002 11/1/2003 5/1/2005 11/1/2006 5/1/2008 11/1/2009 5/1/2011
Overnight rate, right
CA Libor, right
OIS spreadvs. 3m
Canadian
LIBOR, left
Interest Rates
(Basis Points, left; percent,right)
0
500
1000
1500
2000
4/1/2002 10/1/2003 4/1/2005 10/1/2006 4/1/2008 10/1/2009 4/1/2011
Canada
High Yield Spreads vs. 10 Yr Treasury Rate
(Basis points)
United States
0
20
40
60
80
100
120
1/3/2000 1/3/2003 1/3/2006 1/3/2009
S&P TSX Composite Index
S&P TSX Small Cap Index
S&P TSX Financials Index
Equity Markets
(Index: 06/04/2007=100)
0
200
400
600
800
1000
1200
1400
1/14/2000 1/14/2003 1/14/2006 1/14/2009
S&P/TSX Composite 1/
VIX
Volatility
(Index: 06/04/2007=100)1/ S&P/TSX Composite is the rolling
10 day standard deviation
The recent turbulence in international markets had
some impact in the interbank market ......as well as in corporate bond markets, but limited
until now...
...and equity market valuations remain well
above crisis levels... ...but recent volati lity spikes raise concerns.
-2
0
2
4
6
8
10
12
14
16
Jan-00 Jan-02 Jan-04 Jan-06 Jan-08 Jan-10
Consumer
Residential Mortgage
Business
Total
Household and Business Credit
(Y/Y percen t change)
-80
-60
-40
-20
0
20
40
60
80
100
Jan-00 Jan-02 Jan-04 Jan-06 Jan-08 Jan-10
Pricing
Non-pricing
Business Credit Conditions
(Balance of opinion)(Positive values indicate tightening,negative values indicate easing)
Still, credit conditions remain very favorable...
…and credit growth accelerated, drivenby mortgages
and a rebound in credit to business.
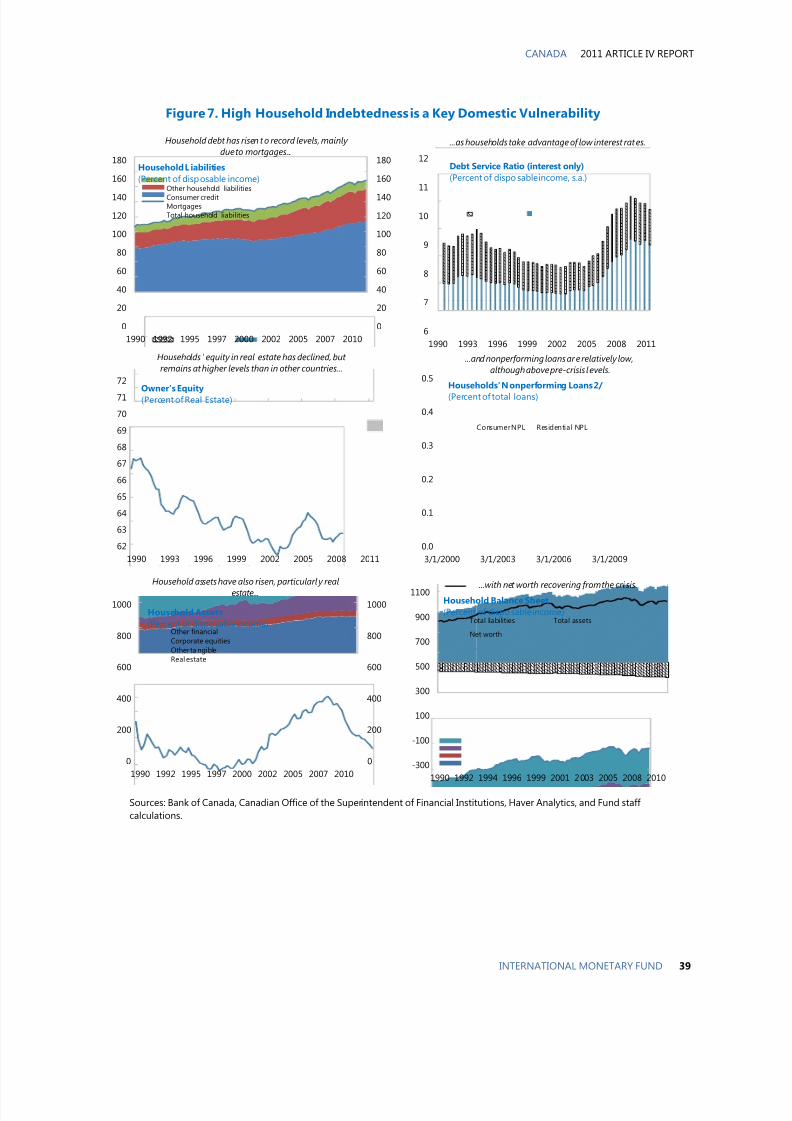
8/3/2019 Canada Imf
http://slidepdf.com/reader/full/canada-imf 40/54
CANADA 2011 ARTICLE IV REPORT
INTERNATIONAL MONETARY FUND 39
Figure 7. High Household Indebtedness is a Key Domestic Vulnerability
62
63
64
65
66
67
68
69
70
71
72
1990 1993 1996 1999 2002 2005 2008 2011
Owner's Equity(Percent of Real Estate)
-300
-100
100
300
500
700
900
1100
1990 1992 1994 1996 1999 2001 2003 2005 2008 2010
Total liabilities Total assets
Net worth
Household Balance Sheet
(Percent of disposable income)
0
200
400
600
800
1000
0
200
400
600
800
1000
1990 1992 1995 1997 2000 2002 2005 2007 2010
Other financialCorporate equitiesOther tangibleReal estate
Household Assets
(Percent of disposable income)
0
20
40
60
80
100
120
140
160
180
0
20
40
60
80
100
120
140
160
180
1990 1992 1995 1997 2000 2002 2005 2007 2010
Other household liabilities
Consumer creditMortgagesTotal household liabilities
Household L iabilities
(Percent of disposable income)
Sources: Bank of Canada, Canadian Office of the Superintendent of Financial Institutions, Haver Analytics, and Fund staff
calculations.
0.0
0.1
0.2
0.3
0.4
0.5
3/1/2000 3/1/2003 3/1/2006 3/1/2009
Consumer NPL Residential NPL
Households' Nonperforming Loans 2/
(Percent of total loans)
6
7
8
9
10
11
12
1990 1993 1996 1999 2002 2005 2008 2011
Debt Service Ratio (interest only)
(Percent of dispo sable income, s.a.)
Household debt has risen t o record levels, mainly
due to mortgages......as households take advantage of low interest rates.
Households ' equity in real estate has declined, but
remains athigher levels than in other countries......and nonperforming loans are relatively low,
although above pre-crisis levels.
Household assetshave also risen, particularly real
estate... ...with net worth recovering from the cri sis.
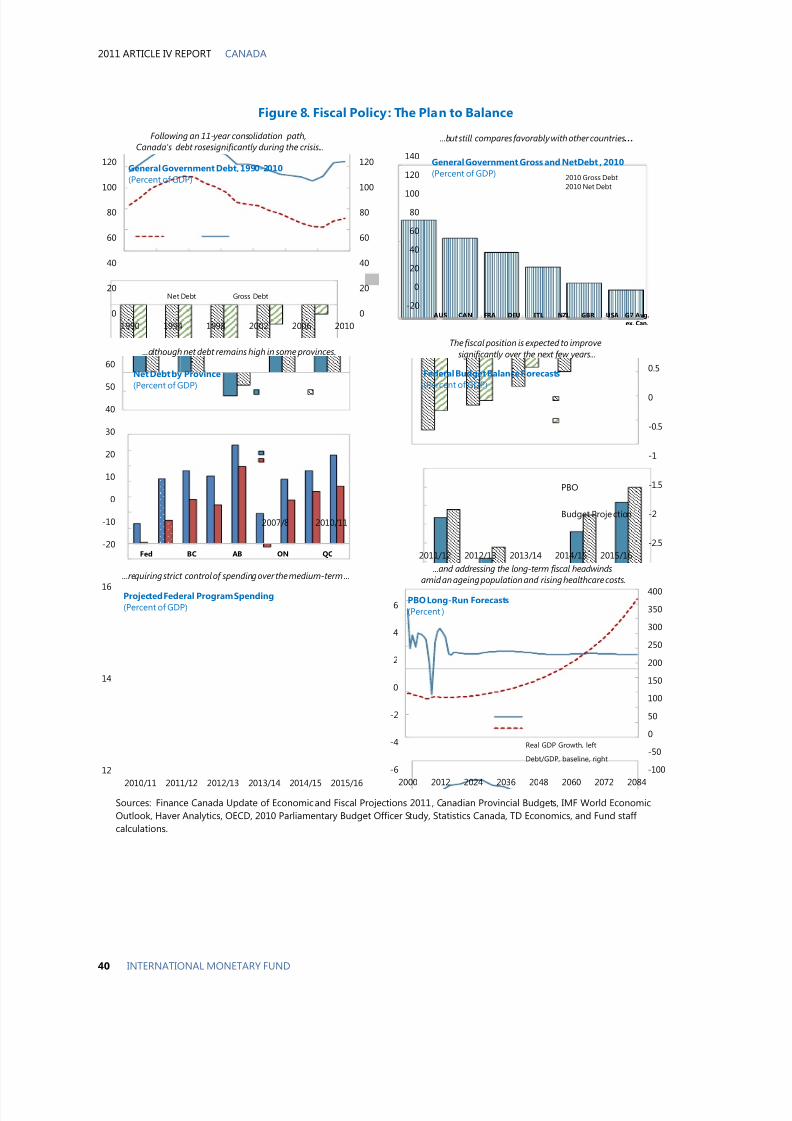
8/3/2019 Canada Imf
http://slidepdf.com/reader/full/canada-imf 41/54
2011 ARTICLE IV REPORT CANADA
40 INTERNATIONAL MONETARY FUND
Figure 8. Fiscal Policy: The Plan to Balance
-20
-10
0
10
20
30
40
50
60
Fed BC AB ON QC
Net Debt by Province
(Percent of GDP)
2007/8 2010/11
-100
-50
0
50
100
150
200
250
300
350
400
-6
-4
-2
0
2
4
6
2000 2012 2024 2036 2048 2060 2072 2084
PBO Long-Run Forecasts
(Percent )
Real GDP Growth, left
Debt/GDP, baseline, right
Sources: Finance Canada Update of Economic and Fiscal Projections 2011, Canadian Provincial Budgets, IMF World Economic
Outlook, Haver Analytics, OECD, 2010 Parliamentary Budget Officer Study, Statistics Canada, TD Economics, and Fund staff
calculations.
...although net debt remains high in some provinces.The fiscal position is expected to improve
significantly over the next few years...
...and addressing the long-term fiscal headwinds
amid an ageing population and rising healthcare costs.
-20
0
20
40
60
80
100
120
140
AUS CAN FRA DEU ITL NZL GBR USA G7 Avg.ex. Can.
2010 Gross Debt2010 Net Debt
GeneralGovernment Gross and NetDebt , 2010
(Percent of GDP)
0
20
40
60
80
100
120
0
20
40
60
80
100
120
1990 1994 1998 2002 2006 2010
Net Debt Gross Debt
GeneralGovernment Debt,1990-2010
(Percent of GDP)
Following an 11-year consolidation path,
Canada's debt rosesignificantly during the crisis......but still compares favorably with other countries...
...requiring strict control of spending over the medium-term ...
12
14
16
2010/11 2011/12 2012/13 2013/14 2014/15 2015/16
Projected Federal Program Spending
(Percent of GDP)
-2.5
-2
-1.5
-1
-0.5
0
0.5
2011/12 2012/13 2013/14 2014/15 2015/16
Federal Budget Balance Forecasts
(Percent of GDP)
PBO
Budget Projection
8/3/2019 Canada Imf
http://slidepdf.com/reader/full/canada-imf 42/54
CANADASTAFF REPORT FOR THE 2011 ARTICLE IV
CONSULTATION—INFORMATIONAL ANNEX
Prepared By The Western Hemisphere Department
(in consultation with other departments)
I. FUND RELATIONS ________________________________________________________________ 2 II. STATISTICAL ISSUES _____________________________________________________________6
CONTENTS
vember 23, 2011
8/3/2019 Canada Imf
http://slidepdf.com/reader/full/canada-imf 43/54
2011 ARTICLE IV REPORT—INFORMATIONAL ANNEX CANADA
2 INTERNATIONAL MONETARY FUND
I. FUND RELATIONS
(As of October 31, 2011)
I. Membership Status: Joined 12/27/1945; Article VIII
SDR Percent
II. General Resources Account: Million of Quota
Quota 6,369.20 100.00
Fund holdings of currency 4,708.78 73.93
Reserve position in Fund 1,660.48 26.07
Lending to the Fund 742.86
SDR Percent of III. SDR Department: Million Allocation
Net cumulative allocation 5,988.08 100.00
Holdings 5,880.37 98.20
IV. Outstanding Purchases and Loans: None.
V. Financial Arrangements: None.
VI. Projected Obligations to Fund:
(SDR Million; based on existing use of resources and present holdings of SDRs):2010 2011 2012 2013 2014
Principal
Charges/Interest 0.09 0.41 0.41 0.41 0.41
Total 0.09 0.41 0.41 0.41 0.41
VII. Implementation of HIPC Initiative: Not applicable.
VIII. Implementation of Multilateral Debt Relief Initiative (MDRI): Not Applicable.
IX. Implementation of Post-Catastrophe Debt Relief (PCDR): Not Applicable.
X. Exchange Rate Arrangements: The authorities maintain a “free floating” exchange rate
regime. The exchange rate regime is free from exchange restrictions and multiple currency
practices. The Canadian authorities do not maintain margins with respect to exchange
transactions. However, the authorities may intervene to maintain orderly conditions in the
exchange market. There are no taxes or subsidies on purchases or sales of foreign exchange.
8/3/2019 Canada Imf
http://slidepdf.com/reader/full/canada-imf 44/54
CANADA 2011 ARTICLE IV REPORT—INFORMATIONAL ANNEX
INTERNATIONAL MONETARY FUND 3
Canada has accepted the obligations of Article VIII, Sections 2, 3, and 4 (a) and maintains an
exchange system that is free of restrictions on the making of payments and transfers for current
international transactions. Canada maintains exchange restrictions for security reasons, based on
UN Security Council Resolutions, that have been notified to the Fund for approval (most recently
in December 2007) under the procedures set forth in Executive Board Decision No. 144-(52/51).
XI. Last Article IV Consultation: The Staff Report for the 2010 consultation with Canada was
considered by the Executive Board on December 22, 2010 (IMF Country Report No. 10/377).
Canada is on a 12-month consultation cycle.
XII. The 2011 Article IV discussions were conducted in Ottawa and Toronto from October 11–
24 by G. Milesi-Ferretti (head), O. Celasun, P. Medas, J. Dagher (all WHD), G. Blondy (FAD), and A.
Costa (MCM). Mr. Gilbert Terrier joined the mission for the meetings in Ottawa and Mr. Nicolas
Eyzaguirre for the concluding meeting with Minister of Finance Flaherty and Bank of Canada
Governor Carney in Ottawa on October 24. Ms. Beaton (Senior Advisor) attended the meetings
and Mr. Hockin (Executive Director) participated in some of the meetings. A press conference was
held on October 31. Outreach activities included discussions with the private sector and think
tanks.
XIII. FSSA Participation and ROSC Assessments
Canada–Financial System Stability Assessment–
Volume II: Report on Observance of Standards in
the Financial System
www.imf.org
Summary: The FSSA report concluded that Canada has a stable and highly advanced
financial system, which is among the soundest in the world. Moreover, it is supported bya well-developed regulatory system that shows a high degree of compliance with major
international standards. Nevertheless, the FSSA report made a few recommendations to
further strengthen the regulatory framework and financial system’s resilience, most of
which have already been addressed, including:
Introducing capital requirements for the guarantees in life insurance segregated
fund (completed by end-2001);
Tabling legislation granting the Office of the Superintendent of Financial
Institutions (OSFI) powers to remove a financial institution’s director or senior
officer if the person is deemed not suitable to hold that office based on a numberof criteria. The latter legislation brought Canada into broad compliance with the
Basel Core Principles;
Making significant progress in harmonizing securities regulation and improving
coordination among provincial securities regulators, including through a newly created
association of securities regulators, the Canadian Securities Administrators. Although
there remain multiple regulators at the provincial level, a Senate commission was created

8/3/2019 Canada Imf
http://slidepdf.com/reader/full/canada-imf 45/54
2011 ARTICLE IV REPORT—INFORMATIONAL ANNEX CANADA
4 INTERNATIONAL MONETARY FUND
to develop specific recommendations on further harmonization and streamlining of
securities regulation.
Canada: Report on the Observance of Standards
and Codes—Fiscal Transparency Module
IMF Country Report No. 02/51,
03/12/02
Summary: The report found that fiscal management in Canada meets the requirements
of the fiscal transparency code, and in a number of instances represents best practice. In
particular, it highlighted the use of private sector economic forecasts. Fiscal management
was also commended for its statistical integrity, impartial tax administration, open
procurement, and a transparent regulatory process.
The report found several areas where further improvements would be desirable,
including: (i) the preparation of timely, current year estimates of federal and provincial
budgets on a comparable basis, (ii) a comprehensive account of the procedures for the
budget cycle and expenditure management system, (iii) systematic reporting of the use
of reserves for non-economic contingencies, (iv) resumption of publication of reconcilednational and public accounts forecasts of major aggregates over the forecast horizon,
and (v) publication by all governments of quasi-fiscal activities.
Many of these issues have been addressed, including: (i) the release by Statistics Canada
of consolidated data for federal and provincial budgets for 2001–02 (on a Financial
Management System basis); (ii) the publication of comprehensive descriptions of budget
and expenditure management procedures, including a joint document entitled
“Budgeting in Canada” by the Government and the OECD, detailed accounts of policies
and procedures on expenditure management at the website of the Treasury Board
Secretariat, and the explanation of the budget cycle and process in Budget and Update
documents; and (iii) publication of reconciled national and public accounts forecasting.
Canada: Report on the Observance of Standards
and Codes—Data Module
IMF Country Report
No. 03/328, 10/23/03
Summary: Canada’s macroeconomic statistics are comprehensive, timely, and accurate
and thus adequate to conduct effective surveillance of economic and financial policies.
Official institutions responsible for the compilation and dissemination of the
macroeconomic datasets are supported by adequate legal and institutional frameworks.
These frameworks protect confidentiality and ensure that statistical work is conducted
within a quality assurance program and with sufficient resources. Integrity is ensured by
the professionalism of the staff, transparency in statistical policies and practices, and theprovision of ethical guidelines for staff. Compilers generally follow internationally
accepted guidelines in the production of the macroeconomic statistics, which is well-
supported by excellent efforts to develop source data that facilitate a high degree of
accuracy and reliability. Statistics are generally relevant, well documented, available with
good frequency on a timely basis, and readily accessible to users, who trust them as
objective.
8/3/2019 Canada Imf
http://slidepdf.com/reader/full/canada-imf 46/54
CANADA 2011 ARTICLE IV REPORT—INFORMATIONAL ANNEX
INTERNATIONAL MONETARY FUND 5
While recognizing the high quality of the macroeconomic data, the report makes
recommendations to further strengthen the statistical system, most of which are already
being addressed, including these priorities:
Articulate the roles of Statistics Canada and the Bank of Canada in producing
financial sector statistics and explore possibilities for more data sharing of monetaryand financial statistics;
Estimate consumption of fixed capital at replacement cost rather than historic costs
now used for the corporate sector in the Canadian System of National Accounts
(CSNA);
Disseminate information on the sources and methods used in compiling quarterly
public sector statistics for the quarterly CSNA; and
Reclassify certain transactions that are not recorded in line with the 5th edition of the
Balance of Payments Manual (BPM5).
Canada: Report on the Observance of Standards
and Codes––FATF Recommendations for Anti-
Money Laundering and Combating the Financing
of Terrorism
IMF Country Report
No. 08/372, 12/11/08
Summary: Canada underwent a detailed FATF evaluation of its anti-money laundering
and combating the financing of terrorism (AML/CFT) framework in 2007. Shortcomings
were identified with respect to the scope of customer due diligence, AML/CFT
supervision, and the Canadian financial intelligence unit. Since then, a number of steps
have been taken to strengthen the framework in these three areas, resulting in significant
improvements.
Canada: Financial System Stability Assessment-
Update
IMF Country Report
No. 08/59, 02/13/08
Summary: The FSSA update concluded that Canada’s financial system is mature,
sophisticated, and well-managed. Financial stability was underpinned by sound
macroeconomic policies and strong prudential regulation and supervision, and well-
designed deposit insurance and arrangements for crisis management and failure
resolution. The banking system appeared sound, with stress tests showing that the major
banks could withstand sizeable shocks, although they did faces some challenges related
to the global financial turmoil that started in mid-2007. Also, there were some concerns
about bank attempts to build on their secure domestic position, to enter highly
competitive foreign markets or complex activities.
The update reiterated the advantages of moving towards a single securities regulator,
including the streamlining of policy development, reductions in compliance costs, and
8/3/2019 Canada Imf
http://slidepdf.com/reader/full/canada-imf 47/54
2011 ARTICLE IV REPORT—INFORMATIONAL ANNEX CANADA
6 INTERNATIONAL MONETARY FUND
improved enforcement. However, it also recognized the significant improvements to the
regulatory system from the creation of the Canadian Securities Administrators (CSA), and
the implementation of the passport system.
XIV. Technical Assistance: Not applicable.
XV. Resident Representative: Not applicable.
II. STATISTICAL ISSUES
The quality, coverage, periodicity, and
timeliness of Canada’s economic data are
considered to be excellent both in the context
of the Article IV consultation and for purposes
of ongoing surveillance. Canada has
subscribed to the Fund’s Special Data
Dissemination Standard (SDDS), and its
metadata are posted on the Fund’s
Dissemination Standards Bulletin Board
(DSBB). The data ROSC was published on
October 23, 2003.
Real Sector. Statistics Canada provides timely
and adequate data in monthly, quarterly, and
annual frequency thereby facilitating the
analysis of economic developments and
assessment of policy proposals within a
quantitative macroeconomic framework. In
May 2001, Statistics Canada effected a smooth
transition from Laspeyres methodology for
estimating real expenditure-based GDP to
Fisher index formulae, which enabled more
accurate comparison between Canada and
other G-7 countries.
Fiscal Sector. Statistics Canada provides
quarterly data (a Statement of Government
Operations along with a Balance Sheet) on the
consolidated general government and its
subsectors following the Government Finance
Statistics Manual , 2001 (GFSM 2001)
recommendations. In addition, the Department
of Finance Canada provides monthly and
annual data on the federal government’s
budget, tax policies, rules and regulations for
Canada’s banks and other financial institutions,
according to the national presentation. The
provided data enable adequate assessment of
the impact of fiscal policy measures on
Canada’s economic performance.
Monetary Sector. The Bank of Canada
provides timely and adequate coverage of
daily, weekly, monthly and quarterly datarelated to the monetary sector.
External Sector. Statistics Canada provides
timely information on a quarterly frequency on
the balance of payments, external debt, and
the international investment position (IIP).
Finance Canada provides monthly data on
Official International Reserves in a format
comparable to the IMF’s reserve data template,
thus enabling adequate surveillance. Data are
published athttp://www.fin.gc.ca/finsearch/finresults_e.asp?
Who=News .
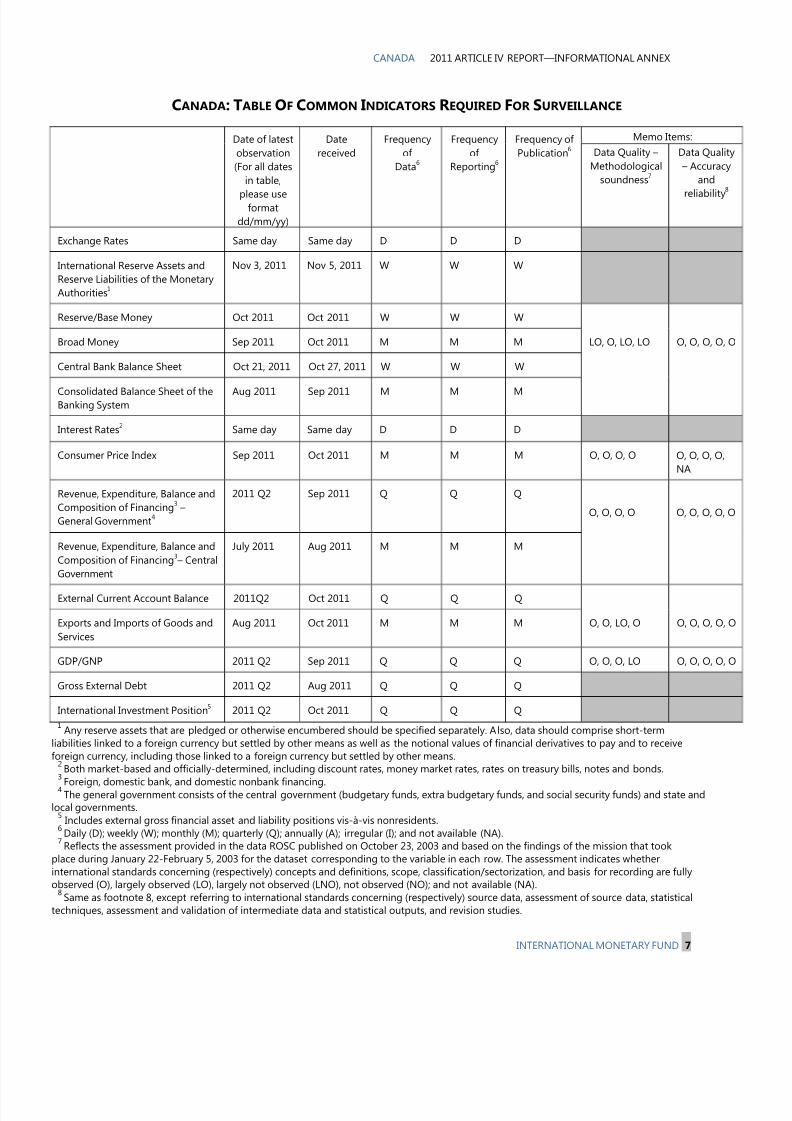
8/3/2019 Canada Imf
http://slidepdf.com/reader/full/canada-imf 48/54
CANADA 2011 ARTICLE IV REPORT—INFORMATIONAL ANNEX
INTERNATIONAL MONETARY FUND 7
CANADA: TABLE OF COMMON INDICATORS R EQUIRED FOR SURVEILLANCE
1Any reserve assets that are pledged or otherwise encumbered should be specified separately. Also, data should comprise short-term
liabilities linked to a foreign currency but settled by other means as well as the notional values of financial derivatives to pay and to receive
foreign currency, including those linked to a foreign currency but settled by other means.2
Both market-based and officially-determined, including discount rates, money market rates, rates on treasury bills, notes and bonds.3
Foreign, domestic bank, and domestic nonbank financing.4 The general government consists of the central government (budgetary funds, extra budgetary funds, and social security funds) and state and
local governments.5
Includes external gross financial asset and liability positions vis-à-vis nonresidents.
6 Daily (D); weekly (W); monthly (M); quarterly (Q); annually (A); irregular (I); and not available (NA).
7 Reflects the assessment provided in the data ROSC published on October 23, 2003 and based on the findings of the mission that took
place during January 22-February 5, 2003 for the dataset corresponding to the variable in each row. The assessment indicates whether
international standards concerning (respectively) concepts and definitions, scope, classification/sectorization, and basis for recording are fullyobserved (O), largely observed (LO), largely not observed (LNO), not observed (NO); and not available (NA).
8 Same as footnote 8, except referring to international standards concerning (respectively) source data, assessment of source data, statistical
techniques, assessment and validation of intermediate data and statistical outputs, and revision studies.
Date of latest
observation
(For all dates
in table,
please useformat
dd/mm/yy)
Date
received
Frequency
of
Data6
Frequency
of
Reporting6
Frequency of
Publication6
Memo Items:
Data Quality –
Methodological
soundness7
Data Quality
– Accuracy
and
reliability8
Exchange Rates Same day Same day D D D
International Reserve Assets and
Reserve Liabilities of the Monetary
Authorities1
Nov 3, 2011 Nov 5, 2011 W W W
Reserve/Base Money Oct 2011 Oct 2011 W W W
Broad Money Sep 2011 Oct 2011 M M M LO, O, LO, LO O, O, O, O, O
Central Bank Balance Sheet Oct 21, 2011 Oct 27, 2011 W W W
Consolidated Balance Sheet of theBanking System
Aug 2011 Sep 2011 M M M
Interest Rates2
Same day Same day D D D
Consumer Price Index Sep 2011 Oct 2011 M M M O, O, O, O O, O, O, O,
NA
Revenue, Expenditure, Balance and
Composition of Financing3
–
General Government4
2011 Q2 Sep 2011 Q Q Q
O, O, O, O O, O, O, O, O
Revenue, Expenditure, Balance and
Composition of Financing3– Central
Government
July 2011 Aug 2011 M M M
External Current Account Balance 2011Q2 Oct 2011 Q Q Q
Exports and Imports of Goods and
Services
Aug 2011 Oct 2011 M M M O, O, LO, O O, O, O, O, O
GDP/GNP 2011 Q2 Sep 2011 Q Q Q O, O, O, LO O, O, O, O, O
Gross External Debt
2011 Q2 Aug 2011 Q Q Q
International Investment Position5
2011 Q2 Oct 2011 Q Q Q
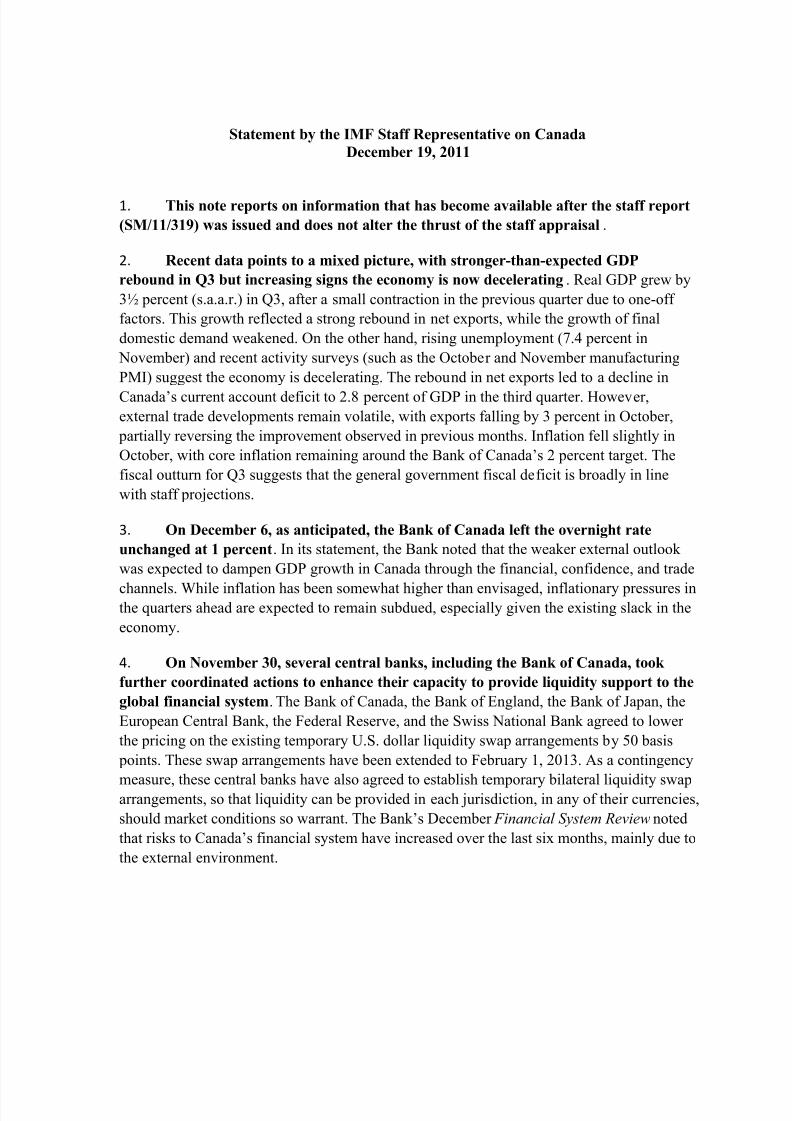
8/3/2019 Canada Imf
http://slidepdf.com/reader/full/canada-imf 49/54
Statement by the IMF Staff Representative on Canada
December 19, 2011
1. This note reports on information that has become available after the staff report
(SM/11/319) was issued and does not alter the thrust of the staff appraisal .
2. Recent data points to a mixed picture, with stronger-than-expected GDP
rebound in Q3 but increasing signs the economy is now decelerating. Real GDP grew by
3½ percent (s.a.a.r.) in Q3, after a small contraction in the previous quarter due to one-off
factors. This growth reflected a strong rebound in net exports, while the growth of final
domestic demand weakened. On the other hand, rising unemployment (7.4 percent in
November) and recent activity surveys (such as the October and November manufacturing
PMI) suggest the economy is decelerating. The rebound in net exports led to a decline in
Canada’s current account deficit to 2.8 percent of GDP in the third quarter. However,external trade developments remain volatile, with exports falling by 3 percent in October,
partially reversing the improvement observed in previous months. Inflation fell slightly in
October, with core inflation remaining around the Bank of Canada’s 2 percent target. The
fiscal outturn for Q3 suggests that the general government fiscal deficit is broadly in line
with staff projections.
3. On December 6, as anticipated, the Bank of Canada left the overnight rate
unchanged at 1 percent. In its statement, the Bank noted that the weaker external outlook
was expected to dampen GDP growth in Canada through the financial, confidence, and trade
channels. While inflation has been somewhat higher than envisaged, inflationary pressures inthe quarters ahead are expected to remain subdued, especially given the existing slack in the
economy.
4. On November 30, several central banks, including the Bank of Canada, took
further coordinated actions to enhance their capacity to provide liquidity support to the
global financial system. The Bank of Canada, the Bank of England, the Bank of Japan, the
European Central Bank, the Federal Reserve, and the Swiss National Bank agreed to lower
the pricing on the existing temporary U.S. dollar liquidity swap arrangements by 50 basis
points. These swap arrangements have been extended to February 1, 2013. As a contingency
measure, these central banks have also agreed to establish temporary bilateral liquidity swaparrangements, so that liquidity can be provided in each jurisdiction, in any of their currencies,
should market conditions so warrant. The Bank’s December Financial System Review noted
that risks to Canada’s financial system have increased over the last six months, mainly due to
the external environment.
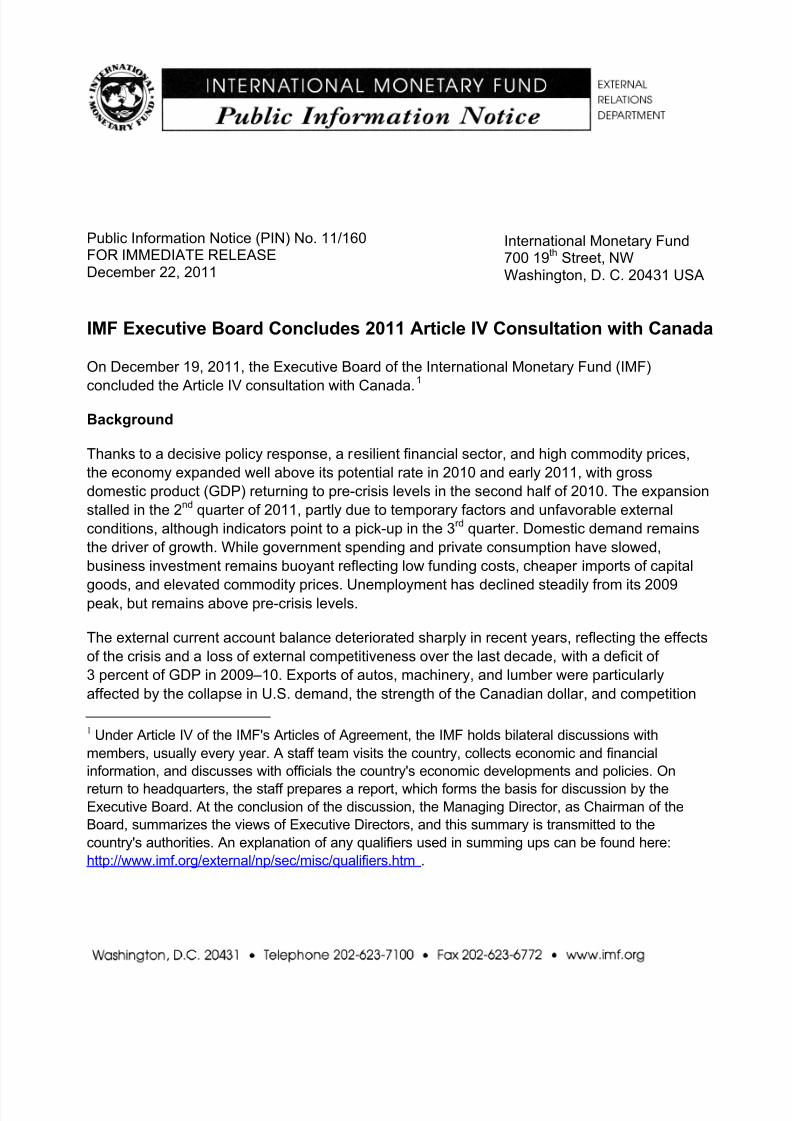
8/3/2019 Canada Imf
http://slidepdf.com/reader/full/canada-imf 50/54
Public Information Notice (PIN) No. 11/160FOR IMMEDIATE RELEASEDecember 22, 2011
IMF Executive Board Concludes 2011 Article IV Consultation with Canada
On December 19, 2011, the Executive Board of the International Monetary Fund (IMF)
concluded the Article IV consultation with Canada.
1
Background
Thanks to a decisive policy response, a resilient financial sector, and high commodity prices,
the economy expanded well above its potential rate in 2010 and early 2011, with gross
domestic product (GDP) returning to pre-crisis levels in the second half of 2010. The expansion
stalled in the 2nd
quarter of 2011, partly due to temporary factors and unfavorable external
conditions, although indicators point to a pick-up in the 3rd
quarter. Domestic demand remains
the driver of growth. While government spending and private consumption have slowed,
business investment remains buoyant reflecting low funding costs, cheaper imports of capital
goods, and elevated commodity prices. Unemployment has declined steadily from its 2009peak, but remains above pre-crisis levels.
The external current account balance deteriorated sharply in recent years, reflecting the effects
of the crisis and a loss of external competitiveness over the last decade, with a deficit of
3 percent of GDP in 2009–10. Exports of autos, machinery, and lumber were particularly
affected by the collapse in U.S. demand, the strength of the Canadian dollar, and competition
1 Under Article IV of the IMF's Articles of Agreement, the IMF holds bilateral discussions with
members, usually every year. A staff team visits the country, collects economic and financial
information, and discusses with officials the country's economic developments and policies. On
return to headquarters, the staff prepares a report, which forms the basis for discussion by theExecutive Board. At the conclusion of the discussion, the Managing Director, as Chairman of the
Board, summarizes the views of Executive Directors, and this summary is transmitted to the
country's authorities. An explanation of any qualifiers used in summing ups can be found here:
http://www.imf.org/external/np/sec/misc/qualifiers.htm .
International Monetary Fund700 19
thStreet, NW
Washington, D. C. 20431 USA
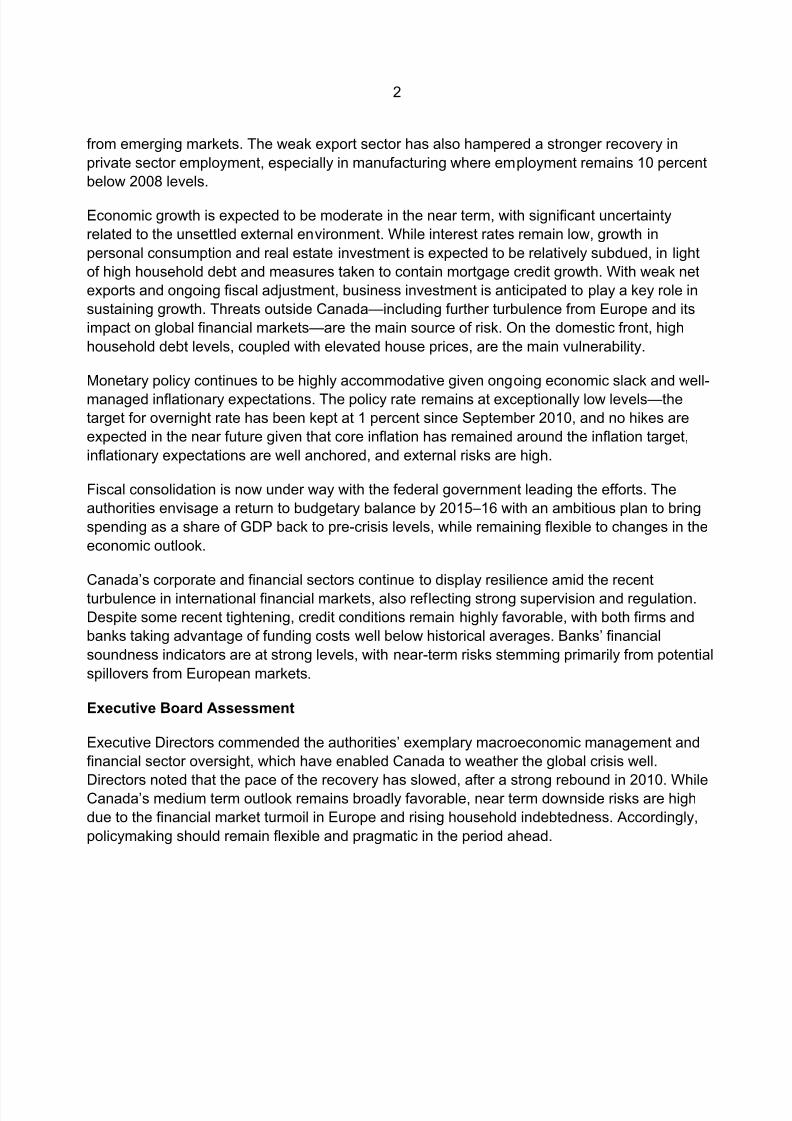
8/3/2019 Canada Imf
http://slidepdf.com/reader/full/canada-imf 51/54
2
from emerging markets. The weak export sector has also hampered a stronger recovery in
private sector employment, especially in manufacturing where employment remains 10 percent
below 2008 levels.
Economic growth is expected to be moderate in the near term, with significant uncertainty
related to the unsettled external environment. While interest rates remain low, growth in
personal consumption and real estate investment is expected to be relatively subdued, in light
of high household debt and measures taken to contain mortgage credit growth. With weak net
exports and ongoing fiscal adjustment, business investment is anticipated to play a key role in
sustaining growth. Threats outside Canada—including further turbulence from Europe and its
impact on global financial markets—are the main source of risk. On the domestic front, high
household debt levels, coupled with elevated house prices, are the main vulnerability.
Monetary policy continues to be highly accommodative given ongoing economic slack and well-
managed inflationary expectations. The policy rate remains at exceptionally low levels—the
target for overnight rate has been kept at 1 percent since September 2010, and no hikes are
expected in the near future given that core inflation has remained around the inflation target,
inflationary expectations are well anchored, and external risks are high.
Fiscal consolidation is now under way with the federal government leading the efforts. The
authorities envisage a return to budgetary balance by 2015–16 with an ambitious plan to bring
spending as a share of GDP back to pre-crisis levels, while remaining flexible to changes in the
economic outlook.
Canada’s corporate and financial sectors continue to display resilience amid the recent
turbulence in international financial markets, also reflecting strong supervision and regulation.
Despite some recent tightening, credit conditions remain highly favorable, with both firms and
banks taking advantage of funding costs well below historical averages. Banks’ financial
soundness indicators are at strong levels, with near-term risks stemming primarily from potential
spillovers from European markets.
Executive Board Assessment
Executive Directors commended the authorities’ exemplary macroeconomic management and
financial sector oversight, which have enabled Canada to weather the global crisis well.
Directors noted that the pace of the recovery has slowed, after a strong rebound in 2010. WhileCanada’s medium term outlook remains broadly favorable, near term downside risks are high
due to the financial market turmoil in Europe and rising household indebtedness. Accordingly,
policymaking should remain flexible and pragmatic in the period ahead.
8/3/2019 Canada Imf
http://slidepdf.com/reader/full/canada-imf 52/54
3
Directors endorsed the Bank of Canada’s conduct of monetary policy. They agreed that, with
the prevailing economic slack and with core inflation and expectations well within the target
range, monetary policy should continue to be accommodative at present. Most Directors agreed
that there is scope for further monetary easing if the economy weakens. Directors welcomed theBank of Canada’s preparedness to respond quickly to liquidity strains in the event of increased
financial turbulence from Europe.
Directors supported the authorities’ intention to gradually remove fiscal stimulus and return to
fiscal balance over the medium term. They stressed that provincial governments also need to
move ahead with fiscal consolidation. Most Directors agreed that, within the medium term
consolidation plans, there is space for countercyclical fiscal support if the economic outlook
deteriorates, given the low level of government net debt.
Directors welcomed the authorities’ adoption of macro prudential measures to curb the build up
of mortgage debt. With household debt at a historical high and various indicators suggesting
house price levels above fundamentals in some regions, Directors called for continued vigilance
in this area. Strengthening oversight of the Canadian Mortgage and Housing Corporation will be
particularly important. Directors welcomed the authorities’ willingness to take additional action
should prices and household indebtedness continue to rise.
Directors commended Canada’s strong financial regulation and supervision. This has resulted in
a stable and resilient banking sector, which has resisted the international financial crisis well
and remains well prepared to deal with most adverse scenarios. Nonetheless, Directors called
for continued close monitoring of spillover risks, as well as risks associated with a prolonged
period of exceptionally low global interest rates. Directors welcomed Canada’s leadership inimplementing the international financial reform agenda, and its valuable contributions to
developing new global regulatory standards.
Directors highlighted a gradual loss of external competitiveness over the years and the
importance of reversing this trend, particularly through efforts to improve the business
environment and boost productivity. Directors also stressed the need for a concerted effort to
contain the rising health care costs associated with population aging. The forthcoming review of
transfers from the federal government to the provinces provides an opportunity to address this
issue.

8/3/2019 Canada Imf
http://slidepdf.com/reader/full/canada-imf 53/54
4
Public Information Notices (PINs) form part of the IMF's efforts to promote transparency of the IMF'sviews and analysis of economic developments and policies. With the consent of the country(or countries) concerned, PINs are issued after Executive Board discussions of Article IV consultations
with member countries, of its surveillance of developments at the regional level, of post-programmonitoring, and of ex post assessments of member countries with longer-term program engagements.PINs are also issued after Executive Board discussions of general policy matters, unless otherwisedecided by the Executive Board in a particular case. The staff report (use the free Adobe AcrobatReader to view this pdf file) for the 2011 Article IV Consultation with Canada is also available.
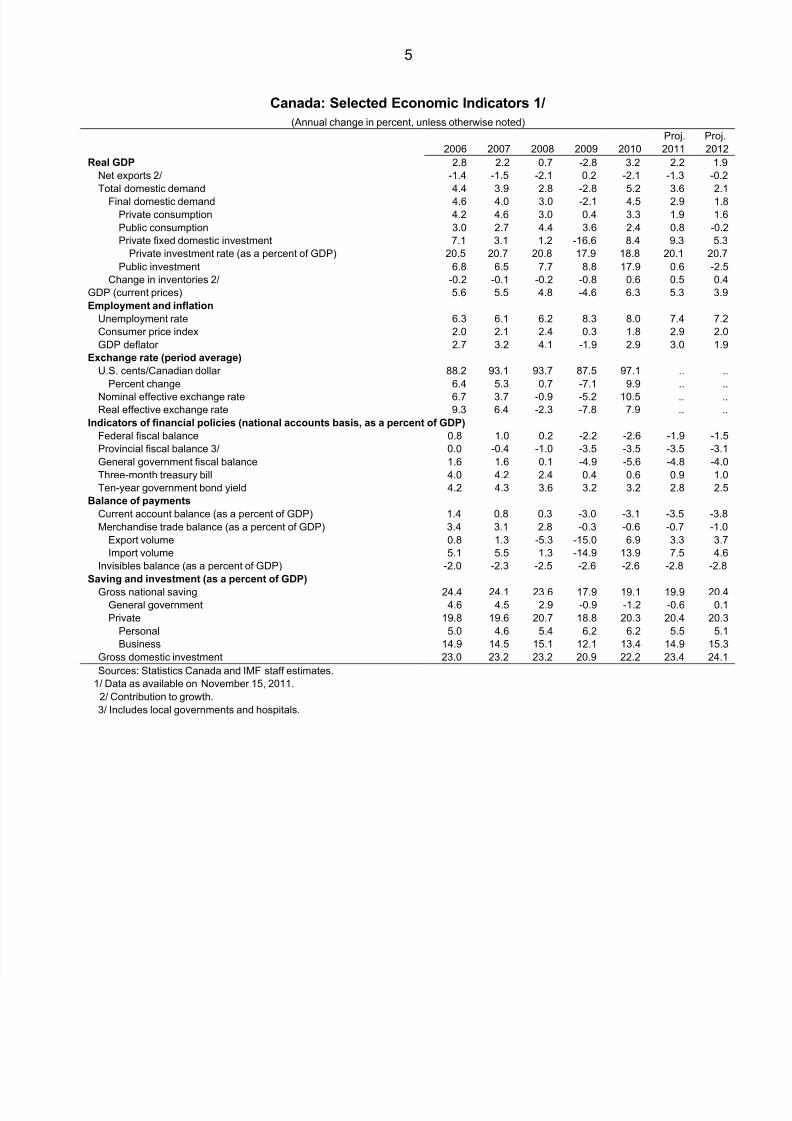
8/3/2019 Canada Imf
http://slidepdf.com/reader/full/canada-imf 54/54
5
Canada: Selected Economic Indicators 1/
(Annual change in percent, unless otherwise noted)
Proj. Proj.
2006 2007 2008 2009 2010 2011 2012
Real GDP 2.8 2.2 0.7 -2.8 3.2 2.2 1.9
Net exports 2/ -1.4 -1.5 -2.1 0.2 -2.1 -1.3 -0.2
Total domestic demand 4.4 3.9 2.8 -2.8 5.2 3.6 2.1
Final domestic demand 4.6 4.0 3.0 -2.1 4.5 2.9 1.8
Private consumption 4.2 4.6 3.0 0.4 3.3 1.9 1.6
Public consumption 3.0 2.7 4.4 3.6 2.4 0.8 -0.2
Private fixed domestic investment 7.1 3.1 1.2 -16.6 8.4 9.3 5.3
Private investment rate (as a percent of GDP) 20.5 20.7 20.8 17.9 18.8 20.1 20.7
Public investment 6.8 6.5 7.7 8.8 17.9 0.6 -2.5
Change in inventories 2/ -0.2 -0.1 -0.2 -0.8 0.6 0.5 0.4
GDP (current prices) 5.6 5.5 4.8 -4.6 6.3 5.3 3.9
Employment and inflation
Unemployment rate 6.3 6.1 6.2 8.3 8.0 7.4 7.2
Consumer price index 2.0 2.1 2.4 0.3 1.8 2.9 2.0
GDP deflator 2.7 3.2 4.1 -1.9 2.9 3.0 1.9
Exchange rate (period average)
U.S. cents/Canadian dollar 88.2 93.1 93.7 87.5 97.1 .. ..
Percent change 6.4 5.3 0.7 -7.1 9.9 .. ..
Nominal effective exchange rate 6.7 3.7 -0.9 -5.2 10.5 .. ..
Real effective exchange rate 9.3 6.4 -2.3 -7.8 7.9 .. ..
Indicators of financial policies (national accounts basis, as a percent of GDP)
Federal fiscal balance 0.8 1.0 0.2 -2.2 -2.6 -1.9 -1.5
Provincial fiscal balance 3/ 0.0 -0.4 -1.0 -3.5 -3.5 -3.5 -3.1
General government fiscal balance 1.6 1.6 0.1 -4.9 -5.6 -4.8 -4.0
Three-month treasury bill 4.0 4.2 2.4 0.4 0.6 0.9 1.0
Ten-year government bond yield 4.2 4.3 3.6 3.2 3.2 2.8 2.5
Balance of payments
Current account balance (as a percent of GDP) 1.4 0.8 0.3 -3.0 -3.1 -3.5 -3.8
Merchandise trade balance (as a percent of GDP) 3.4 3.1 2.8 -0.3 -0.6 -0.7 -1.0
Export volume 0.8 1.3 -5.3 -15.0 6.9 3.3 3.7
Import volume 5.1 5.5 1.3 -14.9 13.9 7.5 4.6
Invisibles balance (as a percent of GDP) -2.0 -2.3 -2.5 -2.6 -2.6 -2.8 -2.8
Saving and investment (as a percent of GDP)
Gross national saving 24.4 24.1 23.6 17.9 19.1 19.9 20.4General government 4.6 4.5 2.9 -0.9 -1.2 -0.6 0.1
Private 19.8 19.6 20.7 18.8 20.3 20.4 20.3
Personal 5.0 4.6 5.4 6.2 6.2 5.5 5.1
Business 14.9 14.5 15.1 12.1 13.4 14.9 15.3
Gross domestic investment 23.0 23.2 23.2 20.9 22.2 23.4 24.1
Sources: Statistics Canada and IMF staff estimates.
1/ Data as available on November 15, 2011.
2/ Contribution to growth.
3/ Includes local governments and hospitals.